A Quantitative Relationship Between Application ...
17
A Quantitative Relationship Between Application Performance Metrics and Quality of Experience for Over-The-Top Video Weiwei Li a , Petros Spachos b,* , Mark Chignell a , Alberto Leon-Garcia a , Leon Zucherman c , Jie Jiang c a Electrical and Computer Engineering, University of Toronto, Toronto, Ontario, M5S 3G4, Canada b School of Engineering, University of Guelph, Guelph, Ontario, N1G 2W1, Canada c TELUS Communications Company, Toronto, Ontario, M1H 3J3, Canada Abstract Quality of Experience (QoE) is a measure of the overall level of customer satisfaction with a vendor. In telecom- munications, consumer satisfaction is of great interest in the adoption of novel multimedia products and services. A number of factors can greatly influence the customer experience during a video session. Factors such as user percep- tion, experience, and expectations are expressed by QoE while factors such as application and network performance are expressed by Quality of Service (QoS) parameters. This paper studies the relationship between QoS and QoE in a session-based mobile video streaming. Specific QoS Application Performance Metrics (APMs) are examined based on a QoE assessment database which is built for experimentation and contains 108 subjects. It is shown that these APMs are highly related to two QoE factors, Technical Quality (TQ) and Acceptability. Furthermore, Viewing Ration (VR) parameter and the corresponding Kendall correlation between VR and QoE factors proves that VR is a valuable metric for mapping QoS to QoE. We further generated the compacted decision tree to predict QoE factors through Rebuffering Ratio (RR), Non-interruption Content Viewing Ratio (VR c ), and Non-interruption Viewing Ratio (VR s ). Through extensive experimentation, a general relationship between APMs and QoE factors has been examined and a primary QoE model is proposed based on this relationship. Keywords: QoE, QoS, OTT video streaming, machine learning. 1. Introduction One of the main goals of telecommunications is to provide services which satisfy consumers. However, the dramatic growth in data traffic is stressing network. Video service has occupied an important place in net- work services and video traffic has taken a huge amount of traffic on the Internet. A crucial requirement is to support video services to meet customer’s expectation in terms of Quality of Experience (QoE). QoE is the degree of delight or annoyance of the user of an appli- cation or service. It results from the fulfillment of his or her expectations with respect to the utility and/ or en- joyment of the application or service in the light of the user’s personality and current state [1]. QoE is a subjective measure of user’s perception. People are still at the stop of determining the methodol- ogy of QoE assessment, exploring the connections be- * Corresponding author Email address: [email protected] (Petros Spachos) tween Quality of Service (QoS) and QoE, and deriv- ing potential models for QoE estimation. Traditional QoS has focused on the video itself, while ignored that video is only a part of the whole service session for an Over-The-Top (OTT) video streaming. This is reason- able since OTT video becomes popular only recently. In order to propose a QoE model for next-generation net- works, it is necessary to study QoE based on a life cycle of a video session [2]. In this paper, the relationship between Application Performance Metrics (APMs) and QoE factors collected by subjective experiments is studied. APMs are ob- jective measurable metrics to represent the quality of a video. Two QoE factors are involved in this paper: Technical Quality (TQ) and Acceptability. TQ collects user’s opinions from available options to understand QoE, while Acceptability is a binary measure to locate whether user accepts the video quality or not. The im- pact of failures which happened during a video display is also discussed. It is investigated whether the addition of failure requires new performance metrics, and how Preprint submitted to Computer Networks May 30, 2018
Transcript of A Quantitative Relationship Between Application ...
A Quantitative Relationship Between Application Performance Metrics andQuality of Experience for Over-The-Top Video
Weiwei Lia, Petros Spachosb,∗, Mark Chignella, Alberto Leon-Garciaa, Leon Zuchermanc, Jie Jiangc
aElectrical and Computer Engineering, University of Toronto, Toronto, Ontario, M5S 3G4, CanadabSchool of Engineering, University of Guelph, Guelph, Ontario, N1G 2W1, Canada
cTELUS Communications Company, Toronto, Ontario, M1H 3J3, Canada
Abstract
Quality of Experience (QoE) is a measure of the overall level of customer satisfaction with a vendor. In telecom-munications, consumer satisfaction is of great interest in the adoption of novel multimedia products and services. Anumber of factors can greatly influence the customer experience during a video session. Factors such as user percep-tion, experience, and expectations are expressed by QoE while factors such as application and network performanceare expressed by Quality of Service (QoS) parameters. This paper studies the relationship between QoS and QoE ina session-based mobile video streaming. Specific QoS Application Performance Metrics (APMs) are examined basedon a QoE assessment database which is built for experimentation and contains 108 subjects. It is shown that theseAPMs are highly related to two QoE factors, Technical Quality (TQ) and Acceptability. Furthermore, Viewing Ration(VR) parameter and the corresponding Kendall correlation between VR and QoE factors proves that VR is a valuablemetric for mapping QoS to QoE. We further generated the compacted decision tree to predict QoE factors throughRebuffering Ratio (RR), Non-interruption Content Viewing Ratio (VRc), and Non-interruption Viewing Ratio (VRs).Through extensive experimentation, a general relationship between APMs and QoE factors has been examined and aprimary QoE model is proposed based on this relationship.
Keywords: QoE, QoS, OTT video streaming, machine learning.
1. Introduction
One of the main goals of telecommunications is toprovide services which satisfy consumers. However,the dramatic growth in data traffic is stressing network.Video service has occupied an important place in net-work services and video traffic has taken a huge amountof traffic on the Internet. A crucial requirement is tosupport video services to meet customer’s expectationin terms of Quality of Experience (QoE). QoE is thedegree of delight or annoyance of the user of an appli-cation or service. It results from the fulfillment of hisor her expectations with respect to the utility and/ or en-joyment of the application or service in the light of theuser’s personality and current state [1].
QoE is a subjective measure of user’s perception.People are still at the stop of determining the methodol-ogy of QoE assessment, exploring the connections be-
∗Corresponding authorEmail address: [email protected] (Petros Spachos)
tween Quality of Service (QoS) and QoE, and deriv-ing potential models for QoE estimation. TraditionalQoS has focused on the video itself, while ignored thatvideo is only a part of the whole service session for anOver-The-Top (OTT) video streaming. This is reason-able since OTT video becomes popular only recently. Inorder to propose a QoE model for next-generation net-works, it is necessary to study QoE based on a life cycleof a video session [2].
In this paper, the relationship between ApplicationPerformance Metrics (APMs) and QoE factors collectedby subjective experiments is studied. APMs are ob-jective measurable metrics to represent the quality ofa video. Two QoE factors are involved in this paper:Technical Quality (TQ) and Acceptability. TQ collectsuser’s opinions from available options to understandQoE, while Acceptability is a binary measure to locatewhether user accepts the video quality or not. The im-pact of failures which happened during a video displayis also discussed. It is investigated whether the additionof failure requires new performance metrics, and how
Preprint submitted to Computer Networks May 30, 2018

the failures impact user’s assessment on QoE on mobilevideo streaming.
The major contributions of this work are listed below:
• An extensive QoE experiment was designed andconducted. In the experiment, 108 subjects partic-ipated and successfully finished the experiment.
• A novel session-based QoE model is introducedfor mobile OTT video streaming. The model pro-poses the use of the entire interaction during thelife-cycle of the video section in order to determinethe QoE.
• Following the introduced model and the Interna-tional Telecommunication Union (ITU) standards,two types of failures are introduced: Accessibilityand Retainability, in order to understand the QoEin the whole session.
• Along with the traditional Mean Opinion Score(MOS) scale, two new scales are used to examinewhether the opinion scores remain stable after theintroduction of the failures.
• Data correlation and four machine learning clas-sification: Naive Bayes, Logistic Regression, k-NN Classification, and Decision Tree, were used toanalyze the complex relationships among selectedAPMs and QoE factors and to compare the impactunder various test conditions, the addition of fail-ures and the change of scales.
• A primary QoE model is proposed which relies ona quantitative relationship between the OoS perfor-mance metrics and the QoE factors.
The remainder of the paper is structured as follows:In Section 2, the related work on QoE and APMs is re-viewed. In Section 3 the session-based QoE and QoSare described followed by a description of the experi-mental design and methodology in Section 4. In Sec-tion 5 is the evaluation analysis to explain the relation-ship between APMs and QoE factors, and Section 6proposed a primary QoE model of MOS based on thisstudy. This work is concluded in Section 7.
2. Related Work
2.1. QoE Overview
QoE of a service is determined by various factors, orcategories [3, 4, 5, 6]. Defining QoE categories is thebasic problem for analyzing and researching the multi-faceted, user-oriented quality assessment problem. Twotypes of indicators are mentioned in QoE: Key Quality
Indicator (KQI ) and Key Performance Indicator (KPI).KPIs can be measured and calculated directly. Thevalues of KPIs are derived from measurable networkperformance and non-network performance parameters.KQIs are used to capture the user’s perception directly.KPIs are logically aggregated into KQIs, and one KPIcan be a part of multiple KQIs at the same time [7]. Fi-nally, KQIs are mapped into QoE factors.
Nokia proposed five main categories to characterizeQoE: service availability, usability, integrity, reliabil-ity, and accessibility [4]. As mentioned in [6], thereare many factors related to QoE, such as accessibility,server reliability/availability, usability, network qual-ity, content effectiveness, and so on. QoE dimensionsinclude technology performance, usability, subjectiveevaluation, expectations, and context [3].
This paper focuses on two KQIs: TQ and Acceptabil-ity. For KPIs, APMs related to failures are introduced.it provides a detailed description of APMs in a videosession and how to connect APMs to QoE factors.
2.2. Classical QoE Studies
Most QoE research aims to reveal the relationship be-tween QoS and QoE. A. Khan et. al. have studied theimpact of QoS parameters on QoE and proposed a QoEadaptation scheme for video applications [8]. R. Imranet. al. have utilized statistical techniques to evaluateQoE performance based on QoS parameters [9]. Alres-hoodi and Woods have summarized recent studies onQoE/QoS correlation modes [10]. They have summa-rized three possible approaches for mapping the QoE/QoS relationship: use QoS to map QoE, use QoE tomap QoS and use some QoS and QoE to estimate otherQoS and QoE. They conclude that the problem is whichapproach is efficient enough.
The ITU-T Study Group is active in developing stan-dards for video QoE evaluation [11, 12, 13, 14]. QUA-LINET developed systematic methodologies for QoEon multimedia applications [15, 16]. Joskowicz et al.summarized parametric models for video quality esti-mation in recent years [17], and proposed their ownparametric model for perceptual video quality [18].Dalal et al. implemented a video QoE assessmentframework for real-time video streaming [19]. Basedon real-time models, a packet scheduling algorithm wasutilized to minimize a defined cost function [20, 21].
2.3. Tendencies in QoE Assessment
Recently, more and more researchers discussed QoEmeasurement by proposing new approaches. Oymanet al. considered how to develop performance metrics
2

to accurately evaluate QoE for adaptive streaming ser-vices [22]. They found that rebuffering is the singlemost influential impairment relating to QoE and theyused rebuffering percentage to estimate the user satis-faction.
Machine learning is being introduced into the QoE/QoE model study. Balachandran et. al. proposed a data-driven machine learning approach to tackle the complexrelationship between the quality metrics and QoE mea-surement [23]. Mushtaq et. al. have discussed dif-ferent machine learning approaches to assess the cor-relations between QoS and QoE [24]. Six classifiersare tested based on their data to investigate the correla-tion between QoS and QoE in video streaming service.Chen et. al have discussed QoS parameters impactingusers’ satisfaction and proposed a video rate adaptationscheme to improve viewer QoE [25, 26].
Another tendency in QoE assessment is the deploy-ment of Acceptability. T. Hoßfeld et. al have pointedthat QoE studies should not be limited to the study ofMOS. They have classified a set of objective and sub-jective QoE metrics and indicated that acceptance is akey QoE metric [27]. Menkovskis et. al. have imple-mented a QoE model to predict whether the quality ofnetwork service is acceptable (‘Yes’) or unacceptable(‘No’) [28]. Their model is based on a decision tree,and they declared that the accuracy is over 90%. Otherwork on acceptability QoE model is proposed by Songet. al. [29] They have generated a logistic regressionmodel to map QoS parameters to acceptability.
Meanwhile, there has been considerable recent re-search in QoE evaluation, especially in developing QoEmodels for OTT video applications [30, 31, 32, 33]. Anearly indication of the need to assess QoE for an en-tire session was discussed in [34]. Human factors thatinfluence QoE, such as context, human memory, and at-tention effects, were investigated in [31, 34]. Moorthyet al. implemented studies including subjective testing,subjective opinion evaluation and objective algorithmperformance analysis [33]. Their QoE evaluation em-phasized the impact of rate adaptation.
Mok et. al. [32] and Pessemier et. al. [30] have stud-ied the impacts of impairments on QoE directly insteadof correlating network performance to QoE. Dorian et.al. have proposed the impact of video quality on QoEfactor, however, they did not discuss the possible fail-ures although they mention the concept of a video ses-sion life, which included "stopped/exit" [31].
Comparing to above research, this paper focuses onfinding the impact of impairment and failures, whichhas a close explanation about the QoS side comparedto previous work.
3. Session-based QoE and QoS
In this section, the proposed session-based QoE andQoS model is described, followed by the main QoE fac-tors that are examined and the QoS performance metricswhich affect it.
3.1. Session QoE with impairments and failures
Traditionally, QoE assessment focused on Integrityimpairments [14]. Integrity indicates the degree towhich a session unfolds without excessive impairments.However, this approach does not include whether avideo can successfully start and/ or end normally andwithout any problems.
With the popularity of OTT video streaming, researchon QoE proposed that user perception of a video ser-vice should be studied during the life-cycle of a videosession [31, 2]. Experimental results have shown thatthe customer experience in a service is significantly im-pacted by the entirety of interactions during the sessionof a customer with a service. Consequently, as a typeof service, the QoE of video streaming should be deter-mined by the entire interaction during the life-cycle ofthe video session.
When the user requests a video, it follows the stepsbelow:
i. wait for the video to start,
ii. watch the video along with some possible impair-ments, and
iii. quit the video service normally or abnormally dueto unexpected problems.
Integrity impairments cover only the second step ofthe previous process. In this work, two more compo-nents, Accessibility and Retainability failures are pro-posed, to understand QoE in the whole session. Con-cerning the QoE measurement of an entire session,a session-based QoE evaluation which includes threecomponents has been proposed in our previous work[35, 36, 37, 38, 39, 40].
Accessibility and Retainability are called failuressince either represents an abnormal termination of videoservice. Accessibility failures will cover the first step ofthe video session process and Retainability failures willcover the third step of the video session process.
The ITU standard sets six primary components to thequality of telecommunication services [41, 42]. Theseare: Support, Operability, Accessibility, Retainability,Integrity, and Security. A service session typically con-tains Accessibility, Retainability, and Integrity. Hence,
3

only these three components in a video session are dis-cussed.
Accessibility. It refers to the successful start of thesession. When the subject attempts to initiate thesession, the session may or may not start success-fully. If the session fails to start, an Accessibilityfailure has occurred. Service accessibility may berelated to availability, security (authentication), ac-cess, coverage etc.
Retainability. It is the capability to continue the ses-sion until its completion, or until it is interruptedby the subject. If the session is terminated perma-nently due to a failure, this is a Retainability fail-ure. In general, Retainability characterizes connec-tion losses.
Integrity. It indicates the degree to which a session un-folds without excessive impairments. Even whena session does not experience any of the previoustwo failures, there are a number of service-specificimpairments that may impact the QoE of the ser-vice. For instance, throughput, delay, delay varia-tion (or jitter) can impact the perceived quality ofthe service.
The definitions of these three components followthe International Telecommunication Union (ITU) stan-dard [41]. Our investigation of the session-based QoE isbased on these definitions and focuses on mobile videoservice. This is because mobile video service occupies ahuge data traffic and encounters more Integrity, Acces-sibility, Retainability issues comparing to non-mobileservice.
3.2. QoE Factors
In this work, two main QoE factors are examined torepresent user’s perception:
Technical Quality (TQ): All technical features thatthe user can perceive during the whole video ses-sion. These features include but are not limited tothe video blockiness, video freezing, video blurri-ness, and audio sync issues. This definition is pro-posed in a study focusing on quantifying the influ-ence of rebuffering on QoE of mobile video [30],and the terminology of TQ is widely used for QoEsubjective assessment [30, 15]. In this work, thetechnical features are the impairments and failuresthat we designed and discuss in Section 4.3.
For rating the TQ, three different rating scales wereemployed:
Scale A: Excellent - Good - Fair - Poor - Bad.Scale A strictly follows the ITU standardsand it is a 5-point rating scale.
Scale B: Excellent - Good - Fair - Poor - Bad -Terrible. Scale B extends the rating scale ofScale A on the negative side by adding onemore choice at the bottom (Terrible). Thisis proposed in order to decide whether theuser’s evaluation of impairments and failurestends to go to the negative side when morefailures are shown.
Scale C: Excellent - Good - Fair - Poor - Bad-Terrible - Worst Possible. Scale C also ex-tends on the basis of Scale A with two morenegative choices.
The design for Scale B and Scale C is to decidewhether the opinion scores are stable when evenworse opinion scores are provided with the appear-ance of failures, which is the first time introducedin the QoE assessment.
Acceptability: Acceptability refers to the subject’s de-cision to either accept or reject a product or a ser-vice by utilizing 2-point likert scale (answering Yesor No). In QoE research, acceptability is treated asa whole offer – including price, cost, and system –and relies on directly querying subjects regardingthe acceptability of the quality level experienced.In [43], the authors have defined acceptability inthe context of mobile video QoE as “a binary mea-sure to locate the threshold of minimum acceptablequality that fulfills subject quality expectations andneeds for a certain application or system”.
At the same time, consumer acceptance is of greatinterest in the adoption of novel multimedia prod-ucts and services. The ITU definition of QoE isbased on the notion of subject acceptability of aservice [12], while most QoE systems follow MOSto measure a subject’s acceptability. Study on ac-ceptability can help explore the possibility and ef-fectiveness of new QoE models based on binaryQoE assessment.
For acceptability, the traditional 2-point likert scalewas employed.
3.3. QoS Performance Metrics
QoE and QoS are complementary but distinct mea-sures of service quality. QoS of OTT video streamingis focused on network performance and its measure-ment involves network-centric metrics for service as-
4

sessment. Objective QoS metrics are important in as-sessing network performance. However, network per-formance cannot directly represent the user’s perceptionof quality regarding services. Many other factors, suchas psychological aspects, end-to-end service processes,and context, should be considered in QoE evaluation.
An important component of QoE study is how to eval-uate the impact of QoS parameters on QoE assessment.For Integrity impairments, rebuffering event is consid-ered. Our work proposed a session-based QoE evalu-ation, hence it needs to examine the impact of Retain-ability/ Accessibility failures on video QoE as well. Asa result, the QoS parameters used in our work are asso-ciated with both Integrity impairment and Retainability/Accessibility failures, which were seldom discussed be-fore.
The following QoS parameters are examined:
• Initial buffering duration: The duration of an initialbuffering.
• Rebuffering Number (RN): The number of re-buffering events happened during a video session.
• Rebuffering time: The time point at which a re-buffering event happened.
• Rebuffering duration ( td): The duration of a re-buffering event.
• Video length ( tv ): The original length of a video.This is the total length of a pristine video, withoutany Integrity impairment, Retainability failure orAccessibility failure.
• The total display time(tL): The total display timeof a video and rebuffering duration.
• Content viewing time: The content viewing time ofa video from a specific user. Content viewing timeis a performance metric introduced due to the ad-dition of failure types since Integrity impairmentassumes that user can watch the whole video de-spite encountering impairments.
A graphical description of the different timing isshown in Fig. 1. tni represents the content display timeafter the last impairment. In our experiment, all re-buffering have the same duration.This is not a realisticscenario in daily applications. However, deploying vari-able lengths of rebuffering duration means that we needto consider the impact of rebuffering time lengths onQoE evaluation. As we described above, we are moreinterested in exploring the QoE evaluation with the ad-dition of Retainability and Accessibility failures. Con-sidering the time and money consumption of recruiting
Figure 1: An example of impairment/ failure timing.
participants, we simplify some properties on Integrityimpairments. More details are discussed in paper [44].
Note that tv , tL − RN · td when Retainability failurehappens. This is because when a Retainability failurehappened, the user cannot see any more content of thisvideo. Content viewing time is decided by a video ses-sion. If there is a Retainability failure, the content view-ing time is smaller than tv. Meanwhile, the value of tv isa fixed value when the video is selected.
Based on these objective metrics, four performancemetrics to quantify QoS for OTT video streaming areproposed. All metrics are Application PerformanceMetrics (APMs), hence, they are performance metricson the application level during the video playback.
i. Rebuffering Ratio (RR): The ratio of total rebuffer-ing time versus the total display time of a video (re-buffering time + content viewing time). It can bedefined as:
RR =td · RN
tL(1)
ii. Non-interruption Content Viewing Ratio (VRc):The content display time after the last impairmentversus the total content viewing time. It is equal to:
VRc =tni
tL − RN · td(2)
iii. Non-interruption Viewing Ratio (VRs): The con-tent display time after the last impairment versusthe total content viewing time. It can be defined as:
VRs =tni
tv(3)
iv. Content Viewing Ratio (VR): The content viewingtime versus the total length of a video. It reflectsthe level of video completion. It is equal to:
VR =tL − RN · td
tv(4)
4. Experiment Design and Methodology
This section describes the subjective assessmentmethodology that was followed. A laboratory-
5

controllable subjective experiment was designed, withspecific impairments and failures [44].
4.1. Experimental Setup
The experiment took place in a controlled environ-ment at the University of Toronto. The conditions ofparticipation were to have normal or corrected to nor-mal vision and to not have participated in a video qual-ity assessment experiment in the six months prior to thedate of the experiment. All subjects were aged over 18years.
108 subjects participated and finished the experiment.The majority of participants are engineering studentsfrom the University of Toronto. They are familiar withOTT video services, such as YouTube and Netflix. Theage of above 90% participants are between 18 and 30.The ratio of males to females is 2 : 1 (some participantschose to not expose their gender).
All the subjects used the same computer with thesame configuration. Each subject evaluated 31 videosessions in total, which lasted around 90 minutes. Theaverage length of each video is 96.7 seconds. Thevideos are displayed in random order to control possi-ble effects. The resolution of video clips is 864 × 482and a frame-rate of 30 frames-per-second (fps), whichis a comparative number to the resolution of mobile dis-plays in the real world. The complete videos were be-tween 73 and 123 seconds in length with an average of94.1 seconds. The video sessions consisted of 23 shortmovie trailers (teaser-trailers) and 8 short movies.
The Absolute Category Rating (ACR) method, whichwas recommended from ITU [14, 45], was employedfor the experiments. Every participant answered fourquestions related to the video quality immediately afterthe video. The questions are listed in Table 1. Q1 andQ2 are related to TQ and Acceptability. The other twoquestions are related to CQ (Content Quality) and OX(Overall eXperience).
4.2. Experimental procedure
The experiment procedure for each participant has thefollowing phases:
i. Registration phase. The participant first signed theconsent form and answered some general profilequestions. During this phase demographics, videoviewing habits, and video quality preferences werecollected.
ii. Training phase. After the registration phase, eachparticipant took a short training on QoE evalu-ation along with the definition of the different
No. Rating Criterion/ Question RatingScale
1 Is the technical quality of this videoacceptable? Yes/No
2 Your evaluation of the technicalquality in the video is:
Scale A/Scale B/Scale C
3 The content of the video is: Scale A
4Your overall viewing experience(Content + Technical quality) duringthe video play back is:
Scale A/Scale B/Scale C
Table 1: Questionnaire for each video.
terms/ words in the questionnaire. The participantwatched 5 videos and answered the questionnaireused for video evaluation. These 5 videos includedeither Integrity impairments and Retainability fail-ures or Accessibility failure in a predetermined or-der. The responses to the questionnaire were notused in any analysis. The only purpose of this phaseis to familiarize the participant with the procedure.
iii. Evaluation phase. After the training, the experi-ment started. The participant watched the videosbased on the group she/ he belongs. Between thevideos, there is a short break to answer the ques-tions. During the video playback, there were twobreaks after every 10 video clips.
4.3. Impairment and failure types
Each video has one type of impairment/ failure. Thetype of impairment/ failure is the test condition. Eachparticipant encountered the same amount of impair-ments/ failures, in a randomized order.
Three categories of impairment/ failure issues weredesigned for the experiment, which follows the life-cycle of a video session:
Test sequences containing Integrity impairmentsduring playback (I). In our experiments, only re-buffering events were used to present Integrity im-pairments. One video sequence may have morethan one rebuffering event during playback.
Test sequences containing Retainability failuresduring playback (R). In our experiments, a Re-tainability failure may happen with/without In-tegrity impairments. As long as the Retainabilityfailure happened, the video session ended.
6
Test sequences containing Accessibility Failuresduring playback (AF). An Accessibility failure isa failure which occurs before any content of thevideo sequence is displayed.
In this experiment, we have videos without any im-pairment/ failure (I0), videos encountered AccessibilityFailure (AF), three types of Integrity impairments (I1-I3), and three types of Retainability failures (R0-R2).The description of each impairment/ failures is listed asfollows [44]:
• I0: There is no impairments and failure. The videois pristine.
• I1: The video has a single temporary interruptionof 10s duration happening at 15s.
• I2: The video has two 10s temporary interruptionshappening at 15s and 30s of the content displaytime.
• I3: The video has three 10s temporary interrup-tions happening at 15s, 30s, and 45s of the contentdisplay time.
• R0: A permanent interruption happening at 70s ofthe content display time.
• R1: One 10s temporary interruptions happening at15s; and a permanent interruption happening at 30sof the content display time.
• R2: Two 10s temporary interruptions happening at15s and 30s; and a permanent interruption happen-ing at 50s of the content display time.
• AF: The video never starts to play. The videoplayer display "failure-to-play" message immedi-ately.
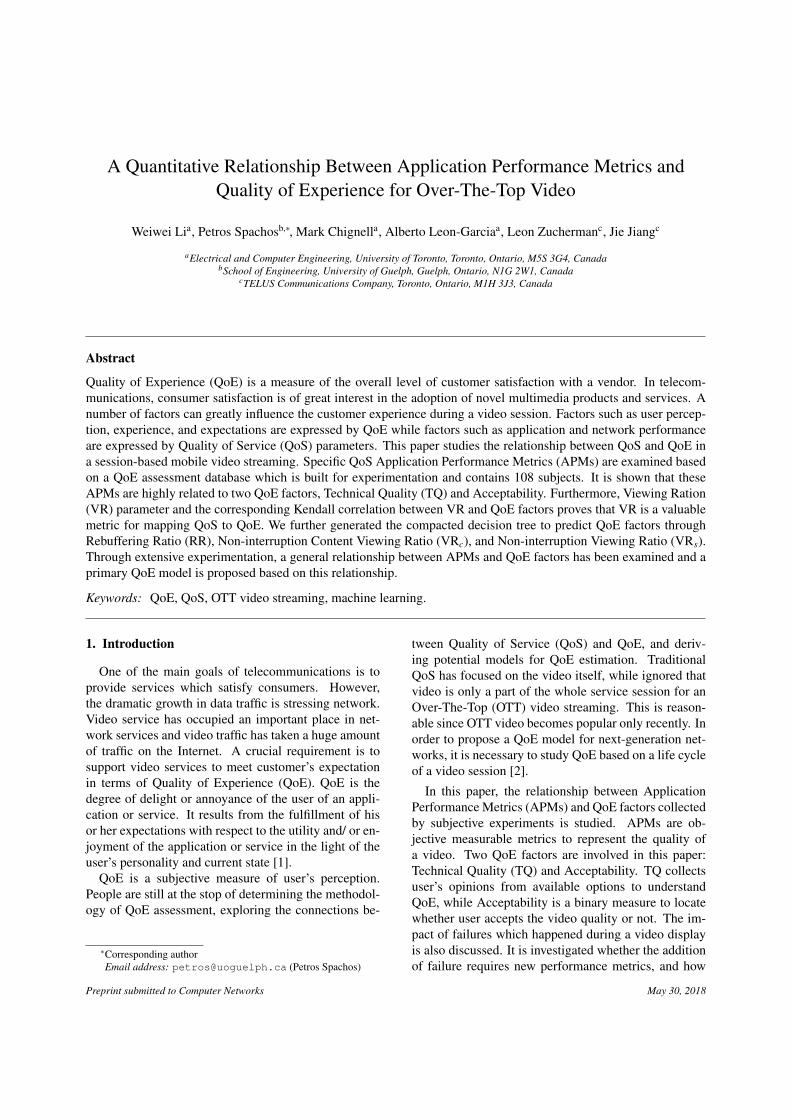
Performance metrics of corresponding types arelisted in Table 2. VRc, VRs, and VR are new perfor-mance metrics proposed due to the addition of failuretypes since the definition of Integrity assumes that usercan watch the whole video despite encountering impair-ments. We can see that VR is always equal to one forIntegrity impairments, and the difference between VRc
and VRs is on the calculation of Retainability failuretypes. The reason we propose these new metrics is be-cause we found that the length of content viewing timeimpacts the evaluation of Retainability failures [36]. Wewill discuss whether these new performance metricsshould be used to sketch the impact of failures in thefollowing sections.
Type RN RR VRc VRs VR
I0 0 0 1 1 1I1 1 td
td+tvtv−t f 1
tvtv−t f 1
tv1
I2 2 2td2td+tv
tv−t f 2
tvtv−t f 2
tv1
I3 3 3td3td+tv
tv−t f 3
tvtv−t f 3
tv1
R0 0 0 1 tR0tv
tR0tv
R1 1 tdtd+tR1
tR1−t f 1
tR1
tR1−t f 1
tvtR1tv
R2 2 2td2td+tR2
tR2−t f 2
tR2
tR2−t f 2
tvtR2tv
A 1 1 0 0 0
∗td: The duration of each rebuffering.∗tv: The content time of each video.∗tRi: The content viewing time for Ri, i=0, 1, 2∗t f i: The time point of the i-th rebuffering happened atthe content time, i=1, 2, 3.
Table 2: Performance metrics for Integrity Impairments and Failures.
4.4. Group formation
We divided the 108 subjects into four groups andeach group finished their experiment with different rat-ing scales. Table 3 shows the details about the ratingscale assignment and group arrangement.
We can see that G1 followed the ITU standard model.The rating scale is a 5-point scale (Scale A), and theyonly evaluated Integrity impairments during the exper-iment, as shown in the fourth column of Table 3. G1is a special group which is used as a comparison. Theparticipant in G1 evaluated all video clips without theappearance of any failure.
The participants in G2, G3, and G4 evaluated bothimpairments and failures. To further explore the impactof Retainability and Accessibility failures, we also em-ployed various rating scales on G2, G3, and G4. Thepurpose of various scales is to extend negative choicesfor rating since our experiment introduces more nega-tive scenarios (failure types) than usual.
In the following analysis, we will use the Scenariosshown on the fifth column of Table 3 to represents eachgroup. We will use 5 to −1 to represent these ratings,i.e. Excellent = 5, Good = 4, Fair= 3, Poor= 2, Bad= 1,Terrible = 0, and Worst Possible = −1.
5. Evaluation Analysis
In this section, we will analyze the relationship be-tween the performance metric and the QoE factors.
7

Group Subjects Scale Type Scenario
G1 36 A I0-I3 A_IG2 24 A I0-I3, R0-R2, AF A_IFG3 24 B I0-I3, R0-R2, AF B_IFG4 24 C I0-I3, R0-R2, AF C_IF
Table 3: Groups arrangement of the participants, along with the Rat-ing Scales and Impairment/ Failures Types.
5.1. Analysis Overview
In our experimental analysis, we used two meth-ods: data correlation and machine learning classifier ap-proaches.
5.1.1. CorrelationCorrelation is a statistical measure of association be-
tween two variables. A correlation coefficient is a di-rect approach to reflect relationships between a pair ofvariables. However, the disadvantage is that correlationcannot reveal the interactions if there are more than twovariables.
Correlation can help us to decide whether a specificAPM is related to QoE factors or not. Kendall cor-relation was used to measure the relevance betweenone APM and one QoE factor. Follow the suggestionin [31], the Kendall correlation is a rank correlationwhich does not have any assumption on the distributionor the joint distribution of variables; while Pearson cor-relation assumes a linear correlation between variables.Considering that VRc, VRs, and VR are related to fail-ures which have rarely been discussed, it is important toexamine whether they should be used as effective per-formance metrics for QoE assessment.
5.1.2. Machine Learning Classifier ApproachesWe have used various machine learning classifiers
to analyze the complex relationships among selectedAPMs and QoE factors and to compare the impact un-der various test conditions (the addition of failures andthe change of scales). Machine learning classifier isa black box approach to analyzing the association be-tween APMs and QoE factors. The advantage is thatit provides a clear output (QoE factors) by the input(APMs). Although at the same time, it hides detailsfrom data. This is why the accuracy of prediction de-creases when the requirement of granularity becomeshigher, as stated in [23].
In this work, our goal is to examine the primary as-sociation between APMs and QoE factors. We first
Figure 2: MOS under four scenarios.
go through four simple and widely-used classifiers dis-cussed in [10, 23, 24]: Naive Bayes, Logistic Regres-sion, k-NN Classification, and Decision Tree. Then, weselect the classifier which is most stable accompanyinghigh accuracy across all cases.
5.2. Impairment/ failure types vs QoE factors
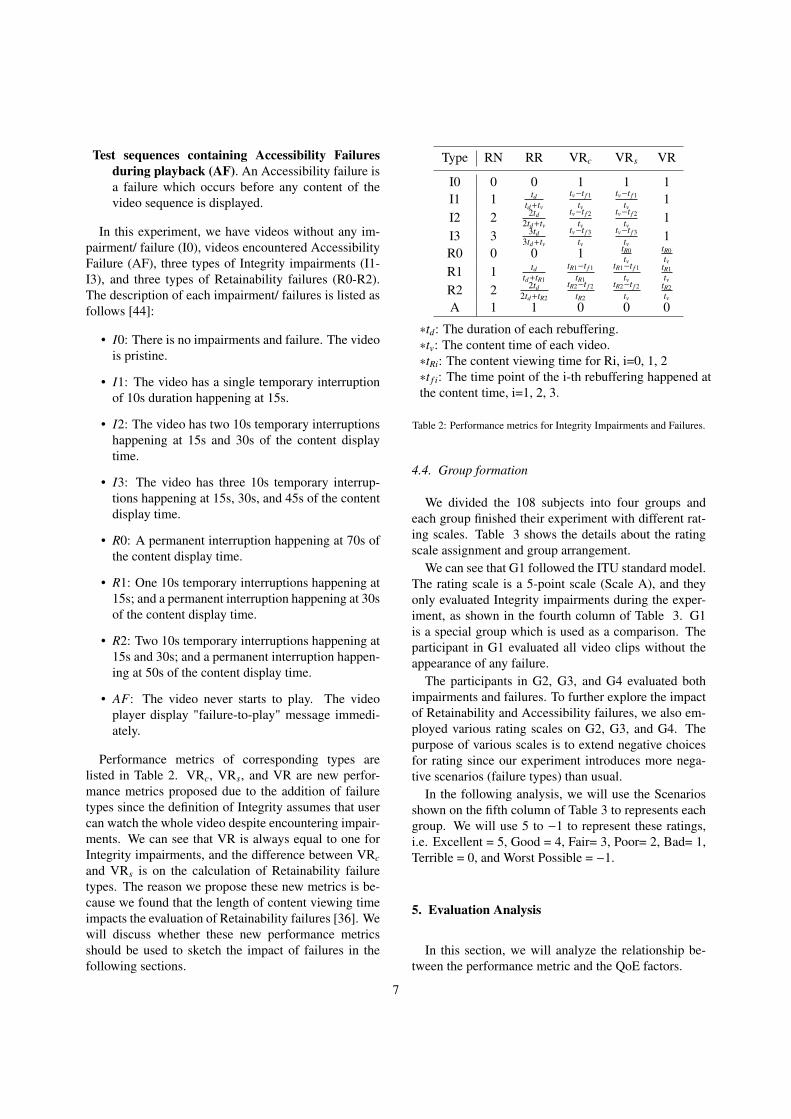
MOS and 95CI (Confidence Interval) of impairment/failure types under specific scenarios(A_I, A_IF, B_IF,and C_IF) is shown in Fig. 2.
As it can be seen, the MOS values of these types aredifferent. This implies that the users’ perception of onetype of impairment/ failure is varied from others, nomatter which scenario is examined. Generally speaking,the MOS of impairments decreases with the increase ofrebuffering times (I0 > I1 > I2 > I3). Meanwhile,the MOS values of Retainability failures are lower thanthose of impairments.
Figure 2 indicates that there is a connection betweenimpairment/ failure types and QoE factors. However,how impairment/ failure types impact QoE factors needsfurther examination. Figure 3 shows the correspond-ing values of RR, VRs, and VR of impairment/ failuretypes based on all samples of A_IF. On one hand, itshows that RR distinguish the level of rebuffering issuessince impairments with same RNs are clustered togetheralong the RR values. On the other hand, it shows thatVR and VRs represents the characteristics of failures.
For example, R1 has one rebuffering issue and thenencountered a failure, while R2 has two rebufferingissues and a relatively longer content viewing time.Hence R1 shows generally smaller RR values while R2has larger VR values. These impairment/failure types
8
00.1
0.20.3
0.4 00.2
0.40.6
0.81
0
0.1
0.2
0.3
0.4
0.5
0.6
0.7
0.8
0.9
1
VR
RR
VR
s
I0
I1
I2
I3
R0
R2
R1
Figure 3: 3-D view: APMs of impairment/failure types, A_IF.
Scenario d f F-value p-value
A_I 3 115.27 < 0.0001A_IF 6 114.25 < 0.0001B_IF 6 97.22 < 0.0001C_IF 6 114.95 < 0.0001
Table 4: One-way ANOVA: Quantification of Impairment/ Failuretype.
deployed in our experiment explains the characteristicsof impairments and failures well, which is important fora subjective experiment.
One-way Analysis of variance (ANOVA) was con-ducted for each scenario to quantify the main effect ofimpairment/ failure types. Table 4 shows that the im-pact of impairment/ failure types is significant across allscenarios.
To verify the impact of impairment/ failure types onacceptability, the acceptability rate of each impairment/failure type is shown in Fig. 4. This is the rate in whichcustomers agree that TQ is acceptable.
It is clear that there is a huge drop between impair-ments and failures, which is not reflected by Fig. 2. Itcan be inferred that acceptability reflects users’ percep-tion from a different aspect and can capture assessmentwhich is not direct in MOS.
5.3. APMs versus QoE factors
The APMs are compared for the two QoE factors: TQand Acceptability.
5.3.1. APMs under TQ levelsTable 5 summarizes the Kendall and Pearson correla-
tion coefficients between APMs and TQ under the fourscenarios (A_I, A_IF, B_IF, and C_IF). As it can beinferred, the correlation between RN and TQ drops a
I0 I1 I2 I3 R0 R2 R10
0.1
0.2
0.3
0.4
0.5
0.6
0.7
0.8
0.9
1
Impairment/Failure Types
Accepta
bili
ty R
ate
A_IA_IFB_IFC_IF
Figure 4: Acceptability rate under four scenarios.
A_I A_IF B_IF C_IF
Kendall Correlation CoefficientsRN -0.4259 -0.2761 -0.2596 -0.2306RR -0.3872 -0.4166 -0.3833 -0.3912VRc 0.3872 0.4166 0.3833 0.3912VRs 0.3872 0.4944 0.4574 0.4762VR - 0.4581 0.4336 0.4794
Pearson Correlation CoefficientsRN -0.4854 -0.3110 -0.2555 -0.52065RR -0.4852 -0.4954 -0.4425 -0.4219VRc 0.4851 0.5086 0.4617 0.4447VRs 0.4851 0.6382 0.6059 0.6184VR - 0.5318 0.5460 0.5914
Table 5: Correlation coefficients between APMs and TQ.
lot when failures are introduced. This means RN can-not reflect the impact caused by rebuffering with the ap-pearance of failures. On the other side, RR measuresthe impact of rebuffering in a stable manner even withfailures.
At the same time, the absolute value of Kendall cor-relation of RR is the same as the absolute value of thatof VRc under the same scenarios. This indicates thatRR and VRc represent the same property from differentaspects. Note that the Pearson correlations of (RR, TQ)and that of (VRc, TQ) are slightly different.
The correlation between VR and TQ under A_I is notavailable because of VR=1 for all impairment types. Forother cases, the Kendall correlation coefficients betweenVRs/VR and TQ are above 0.4. The value 0.4 is closeto the Kendell correlation coefficients between RR and
9

0 0.05 0.1 0.15 0.2 0.250
0.1
0.2
0.3
0.4
0.5
0.6
0.7
0.8
0.9
1
Rebuffering ratio(RR)
F(R
R)
Empirical CDF
TQ<=2TQ=3TQ=4TQ=5
(a) A_I case.
0 0.05 0.1 0.15 0.2 0.250
0.1
0.2
0.3
0.4
0.5
0.6
0.7
0.8
0.9
1
Rebuffering ratio(RR)
F(R
R)
Empirical CDF
TQ<=2TQ=3TQ=4TQ=5
(b) A_IF case.
Figure 5: Empirical cdf for RR vs. TQ.
TQ in A_I, i.e. the traditional QoE assessment with In-tegrity impairments only. It indicates that the associ-ations between VRs/VR and TQ in the session-basedQoE evaluation is at the same level of associations be-tween RR and TQ in the traditional QoE assessment.Note that RR is a common metric used for traditionalQoE assessment. It means that VRs, and VR should beconsidered as RR for our further analysis on the session-based QoE.
The empirical Cumulative Distribution Function(CDF) of RR based on TQ levels is shown in Fig. 5.With the decrease of TQ, the shapes of CDFs are differ-ent in both A_I and A_IF while the general tendenciesin both cases are similar. It seems about 80% of highestratings (TQ=5) fall below RR<0.1. At the same time,80% of ratings of TQ≤ 2 fall below RR<0.25. Thisindicates that RR represents the characteristics of TQlevels regardless of whether failures are included in the
0.5 0.6 0.7 0.8 0.9 10
0.1
0.2
0.3
0.4
0.5
0.6
0.7
0.8
0.9
1
Noninterruption viewing ratio(VRs)
F(V
Rs)
Empirical CDF
TQ<=2
TQ=3
TQ=4
TQ=5
(a) A_I case.
0.2 0.3 0.4 0.5 0.6 0.7 0.8 0.9 10
0.1
0.2
0.3
0.4
0.5
0.6
0.7
0.8
0.9
1
Noninterruption viewing ratio(VRs)
F(V
Rs)
Empirical CDF
TQ<=2TQ=3TQ=4TQ=5
(b) A_IF case.
Figure 6: Empirical cdf for VRs vs. TQ.
evaluation or not.The empirical CDF of VRs is shown in Fig. 6. Similar
to Fig. 5, it is clear that under different levels of TQ, theCDFs of VRs is distinguishing.
The empirical CDF of VR in the A_IF case, since VRis a constant in the A_I case, is shown in Fig. 7. WhenTQ>3, around 90% of VR is equal to 1, i.e., the wholecontent of a video has been shown.
5.3.2. APMs vs. AcceptabilityTable 6 shows the correlations between APMs and
Acceptability when Acceptability is viewed as a binaryscale (‘Yes=1’, and ‘No=0’).
These coefficients agree with the conclusions fromTable 5. It also indicates that acceptability and TQ aresimilar to each other, although TQ and acceptability ex-plain the user’s perception of different granularities andconsideration.
10

0 0.1 0.2 0.3 0.4 0.5 0.6 0.7 0.8 0.9 10
0.1
0.2
0.3
0.4
0.5
0.6
0.7
0.8
0.9
1
Content Viewing Ratio (VR)
F(V
R)
Empirical CDF
TQ<=2TQ=3TQ=4TQ=5
Figure 7: Empirical cdf for VR vs. TQ, A_IF.
A_I A_IF B_IF C_IF
RN -0.2782 -0.0775 -0.0629 -0.0880RR -0.2528 -0.3042 -0.2763 -0.2961VRc 0.2528 0.3042 0.2763 0.2961VRs 0.2528 0.4057 0.3728 0.4130VR - 0.6101 0.5958 0.6072
Table 6: Correlation coefficients between APMs and Acceptability.
The empirical CDFs of RR and VRs under Accept-ability are shown in Fig. 8 and Fig. 9, respectively. Thecumulative tendency of RR is similar in A_I and A_IFcases, while the CDF of VRs shows a large differencewhen VRs ≤ 0.4 in the two cases. It indicates our previ-ous judgment: VRs is useful to present the presence offailures.
The CDF of VR under the A_IF scenario(VR=1 forall samples in A_I) is shown in Fig. 10. It is obviousthat the majority of ‘Yes’ needs VR=1.
5.4. Machine Learning Classifiers ComparisonConsidering that TQ and acceptability in our experi-
ments are categorical variables, we used machine learn-ing classification methods to model the relationshipsamong selected APMs and QoE factors. These candi-date methods were Naive Bayes, Logistic Regression,k-NN Classification, and Decision Tree. K-fold-cross-validation was employed to find the one providing thehighest mean accuracy.
The mean accuracy using the above four machinelearning classifiers is shown in Fig. 11. Decision Treeprovides the highest accuracy in almost all scenarios,which agrees with the conclusion in [23]. It is also themost stable classifier across all cases. Decision Tree is
0 0.05 0.1 0.15 0.2 0.250
0.1
0.2
0.3
0.4
0.5
0.6
0.7
0.8
0.9
1
Rebuffering ratio(RR)
F(R
R)
Empirical CDF
YesNo
(a) A_I case.
0 0.05 0.1 0.15 0.2 0.250
0.1
0.2
0.3
0.4
0.5
0.6
0.7
0.8
0.9
1
Rebuffering ratio(RR)
F(R
R)
Empirical CDF
YesNo
(b) A_IF case.
Figure 8: Empirical cdf for RR vs. Acceptability.
employed in the following analysis. Decision Tree andother classifiers we used are implemented by the scikit-learn tool [46] and MATLAB. Both the scikit-learn tooland MATLAB use Classification And Regression Tree(CART) [47] to build a tree. In general, the time com-plexity of CART algorithm is O(mn log n), where m isthe number of the input parameters, n is the total num-ber of data.
5.5. The Impact of Failures Appearance
To clearly reveal the effect of APMs under variousscenarios by classification tree, we use the compacteddecision tree as [23] did. We classify RR, VRs, and VRinto four levels: (very low, low, high and very high), asshown in Table 7. The reason we divided APMs intothese four levels is that these levels of APMs can clas-sify the designed impairment/ failure types, as shown inFig. 3.
11

0.5 0.6 0.7 0.8 0.9 10
0.1
0.2
0.3
0.4
0.5
0.6
0.7
0.8
0.9
1
Noninterruption viewing ratio(VRs)
F(V
Rs)
Empirical CDF
YesNo
(a) A_I case.
0.2 0.3 0.4 0.5 0.6 0.7 0.8 0.9 10
0.1
0.2
0.3
0.4
0.5
0.6
0.7
0.8
0.9
1
Noninterruption viewing ratio(VRs)
F(V
Rs)
Empirical CDF
YesNo
(b) A_IF case.
Figure 9: Empirical cdf for VRs vs. Acceptability.
0 0.1 0.2 0.3 0.4 0.5 0.6 0.7 0.8 0.9 10
0.1
0.2
0.3
0.4
0.5
0.6
0.7
0.8
0.9
1
Content Viewing Ratio (VR)
F(V
R)
Empirical CDF
YesNo
Figure 10: Empirical cdf for VR vs. Acceptability, A_IF case.
Decision Tree is biased towards classes which occupythe majority number of samples. However, we have
A_I A_IF B_IF C_IF0
10
20
30
40
50
60
70
80
90
100
Scenario
Accura
cy in %
Navie BayesRegressionkNNDecision tree
(a) TQ = f(PMs).
A_I A_IF B_IF C_IF0
10
20
30
40
50
60
70
80
90
100
Scenario
Accura
cy in %
Navie BayesRegressionkNNDecision tree
(b) Accept = f(PMs).
Figure 11: Machine learning classifiers.
Level RR VR VRs
Very low < 0.05 < 0.45 < 0.3Low 0.05 − 0.125 0.45 − 0.65 0.3 − 0.6High 0.125 − 0.2 0.65 − 0.9 0.6 − 0.9Very high > 0.2 > 0.9 > 0.9
Table 7: Four levels of RR, VR, and VRs based on data.
more positive samples (TQ>3 or acceptability is ‘Yes’)than negative ones. In fact, we value the informationhidden for the negative cases more, thus we assign ahigher weight to negative cases. Note that we only planto obtain a general understanding of the impact causedby failures, especially when the types of APMs are lim-ited (only three metrics are considered). For developinga predictive QoE model, this strategy might not be use-ful.
12

RR
VRs
very low, low
high very high
TQ=4
TQ= 4
very low,
low, high
very high
TQ= 2
RR
very low,
low
high
TQ=3
(a) TQ=f(RR, VRs, VR), A_I.
VR
VR
very low, low
high very high
TQ= 1
very low low, high
TQ=2
VRs
very low, low,
high
TQ= 2
high, very high
RR
TQ=3
TQ= 4
very high
TQ= 3
very low, low
VRs
very low, low high
(b) TQ=f(RR, VRs, VR), A_IF.
Figure 12: Compacted Decision Tree for A_I and A_IF.
The structure of compacted decision tree to interpretTQ = f(RR, VR, VRs) for A_I and A_IF. is shown inFig. 12. Note that VR=1 in all A_I samples, however, itis interesting to investigate whether VR will become avaluable predictor if failures appear.
According to the experimental results, if Integrity im-pairments appear, RR is the main predictor to decide TQlevels in the compacted tree. On the other hand, whenfailures are taken into account, VR plays a more impor-tant role to determine TQ levels. This proves that theimpact of failures should be considered in QoE of OTTvideo streaming. The changed structure indicates thata predictive model for both failures and impairmentsshould consider VR first, and the impact of RR and VRs
should be discussed separately under different VR lev-els.
RR
very low, low
high
very high
‘Yes’ ‘NO
(a) Accept=f(RR, VRs, VR), A_I.
VR
VRs
very low, low,
high, very high
‘Yes’
very low, low high, very high
‘No’
‘No’
(b) Accept=f(RR, VRs, VR), A_IF.
Figure 13: Compacted Decision Tree for A_I and A_IF.
It is also important to notice that the compacted de-cision tree does not include all possible TQ levels. Forexample, TQ=1 is missed in the decision tree based onA_I, while TQ=5 is missed in the case of A_IF.
Two are the main reasons for this phenomenon: first,the basis of Decision Tree is information gain, whichleads the tree being biased to samples with larger sizesunder the same conditions; and second, we compactedthe level of APMs instead of using exact values, whichprovides a general structure for APMs with the price oflosing precision of the tree. However, the compactedlevels are enough to explore the general relationshipbetween APMs and between APMs and QoE factorswhich is discussed in this work.
The Decision Tree of Accept = f(VR, RRs) of A_Iand A_IF is shown in Fig. 13. It is clear that the rela-tionship between APMs of both trees is similar to thecorresponding structures shown in Fig. 12.
Table 8 shows the mean accuracy of compacted deci-sion trees generated based on (RR, VRs) and (RR, VR,VRs). The accuracy of trees based on (RR, VRs) is fromour previous work [48]. The ’Yes/No’ choice of accept-ability leads to higher accuracy.
It can be inferred that the selection of the granular-
13

A_I A_IF
TQ=f(RR, VRs) 42.64% 48.19%TQ = f(RR, VR, VRs) 39.68% 39.86%
Accept=f(RR, VRs) 80.11% 81.11%Accept=f(RR, VR, VRs) 75.90% 78.19%
Table 8: Mean accuracy (%) of decision trees, A_I and A_IF.
ity is important in deriving a predictive model, whichis stated in [23]. Considering that the available types ofAPMs might be limited in an OTT video, it is invaluableto discuss whether to select TQ or Acceptability as theindicator for QoE. Another thing is that the accuracyof f(RR, VR, VRs) is slightly lower than f(RR, VRs)among all cases, even when one more predictor, VR, isadded in the latter. As was explained before, the pur-pose of the compacted decision tree is to examine t thegeneric relationship between APMs. However, the deci-sion tree is based on information entropy, which meansthe relationship between APMs will impact its accuracy.If a primary model based on decision tree needs to bedeveloped, the relationship among APMs should be ex-plored in more details.
The structure of decision trees for TQ = f(RR, VR,VRs) in Scale B and Scale C is shown in Fig. 14. Thestructure of the two decision trees are close to the struc-ture shown in Figure 12(b): VR is the primary determi-nant of TQ levels.
In these scenarios, the traditional ITU MOS scale ischanged to the introduced extended scales. The mainreason for this design is to reveal more details about theimpact of Retainability and Accessibility failures. TQtends to lower levels compared to the tree in the A_IFcase. It is obvious that the structures of the two trees areclose to TQ=f(RR, VR, VRs) in A_IF, thus the extendedscales will not impact the relationship among APMs.However, the extended point, Terrible (TQ=0), appearsin the tree indicating that users tend to evaluate failuretypes worse than Bad (TQ=1), but avoid Worst Possible(TQ=-1).
The decision tree of Accept = f(RR, VRs, VR) underB_IF and C_IF is shown in Fig. 15. It indicates thatthe impact caused by failures is stable across all cases ifevaluated by Acceptability. A comparison of the accu-racy of Accept = f(RR, VRs, VR) and TQ = f(RR, VRs,VR) is shown in Table 9 and the accuracy of Accept =f(RR, VRs) and TQ = f(RR, VRs) in [48]. It shows thatacceptability provides higher accuracy compared to TQ.
VR
RR
very high very low, low,
high
TQ=4
high, very
high
very low,
low
TQ=1
VRs
very low,
low
TQ=3
low, high
VR
very low
TQ=1 TQ=0
VRs
high, very
high
TQ=4
very low,
low
high, very
high
(a) TQ=f(RR, VR, VRs), B_IF.
VR
VR
very high very low, low,
high
TQ=0
high
very low
TQ=4
VRs
very high
TQ=1
very low,
low
VRs
high
TQ=2
very high
TQ=3
low, high
RR
very low, low,
high
high, very
high
RR
very low,
low
TQ=4 TQ=3
(b) TQ=f(RR, VR, VRs), C_IF.
Figure 14: Compacted Decision Tree for TQ = f(RR, VRs),B_IF andC_IF.
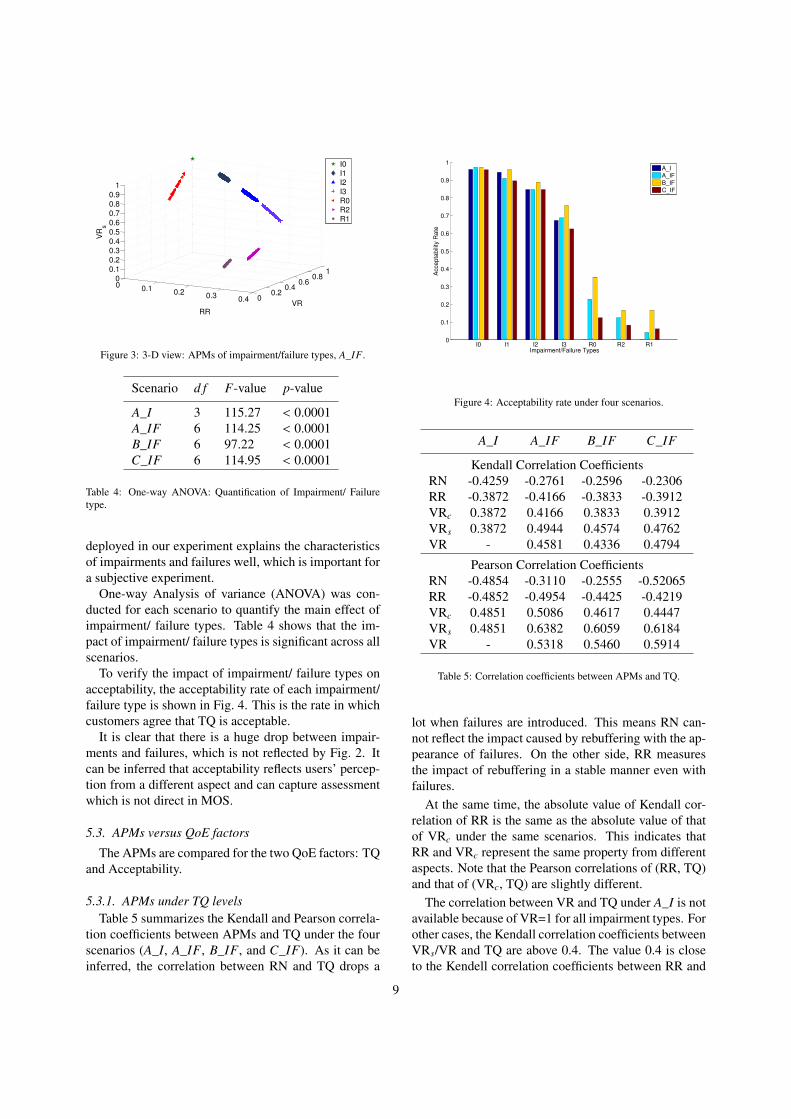
6. Primary Model Discussion
It has been proved that VRs and VR should be con-sidered when failure appears in the QoE assessment. Inthis part, a simple QoE model is proposed by runningregression analysis to compare the usage of these newpredictors.
In the following models, we used levels of APMs, andwe have:
• MOS denotes the MOS of TQ.
• LRR denotes the level of RR.
• LVR denotes the level of VR.
• LVRs denotes the levels of VRs.
14
VR
very low, low,
high, very high
‘Yes’ ‘No’
(a) Accept=f(RR, VR, VRs), B_IF.
VR
VRs
very high
‘Yes’
high, very
high
‘No’
‘No’
very low, low
very low, low,
high
(b) Accept=f(RR, VR, VRs), C_IF.
Figure 15: Compacted decision tree for Accept = f(RR, VRs), B_IFand C_IF.
B_IF C_IF
TQ=f(RR, VRs) 43.05% 43.75%TQ = f(RR, VR, VRs) 39.72% 35.69%
Accept=f(RR, VRs) 82.92% 82.50%Accept=f(RR, VR, VRs) 86.94% 79.72%
Table 9: Mean accuracy (%) of decision trees, B_IF and C_IF.
The mapping between levels of RR, VR and VRs andnumerical level for regression models are shown in Ta-ble 10.
MOS = f (LRR) can achieve a high accuracy in lin-ear regression analysis, as shown in Table 11. At thesame time, predicting MOS based on LRR and LVRs inthe A_IF scenario has a high goodness of fit if we onlyestimate on impairment types, as shown in Table 12.However, if we add LVR as a predictor and estimateimpairment and failure types together, the MSE (MeanSquared Error) will highly increase, especially in theMOS = f (LRR, LVR, LVRs ) case, shown in Table 13.Therefore, we propose to use the QoE models in thefollowing Equation 5:
MOS = g1(LVR) · f1(LRR, LVRs )+(1 − g1(LVR)) · f2(LRR, LVRs )
(5)
Symbol Very Low Low High Very highLRR 1 2 3 4LVR 1 2 3 4LVRs 1 2 3 4
Table 10: The numerical number of levels of RR, VR, and VRs
MOS = f (PMs) MSE
MOS = 4.6317 − 0.4217LRR 0.0020MOS = 3.7290 − 0.4217LRR + 0.2006LVRs < 0.0001
Table 11: Linear regression for A_I.
MOS = f (PMs) MSE
MOS = 4.7396 − 0.4990LRR 0.0095MOS = 4.0499 − 0.4071LRR + 0.1533LVRs 0.0083
Table 12: Linear regression for A_IF, for impairment types.
MOS = f (PMs) MSE
MOS = 1.4568 − 0.1749LRR + 0.5829LVR 0.2021MOS = 0.6450 + 0.3364LVR + 0.4577LVRs 0.1561MOS = −1.3059 + 0.4292LRR + +1.0438LVR 8.8439
+1.1600LVRs
Table 13: Linear regression for A_IF, impairment and failure types.
where
g1(LVR) = {1, if LVR = 40 if LVR , 4 (6)
Based on the experimental data:
MOS = g1(LVR) · (4.0499 − 0.4071LRR + 0.1533LVRs )+(1 − g1(LVR)) · 0.2794LRR + 0.6430LVRs
(7)and MS E = 0.0085.
This QoE model was tested on B_IF and C_IF andthe MSE is 0.0007 and 0.0038, respectively. Becausethe limited types of impairments and failures, this modelis a coarse-grained model for QoE estimation. However,it indicates the importance of VR and VRs when failureappears.
7. Conclusion
In this paper, the relationship between performancemetrics and QoE factors through a data-driven machine
15

learning approach was examined. A session-based QoEmodel was used and two new QoE metrics were exam-ined to evaluate the performance of the new model. Fur-ther the impairments, two failures were introduced inthe experiments. Through extensive experimentation, itwas found that the feature of failures requires new per-formance metrics to be introduced in the QoE evalua-tion.
Furthermore, the traditional multi-point scale wascompared to the binary likert scale. According to ex-perimental results, multiple levels are not necessary forall OTT video services. Depending on the requirementof accuracy and the purpose of QoE assessment, accept-ability might be a valuable indicator of the user’s per-ception. An extended scale was also examined and if itis necessary for the addition of failures. The extendedscales can help users distinguish different TQ levels.
Finally, a primary QoE model is proposed based onthe experimental results and analysis. The introducedmodel follows the changes in QoE due to the additionof failures without missing the impairments.
References
[1] K. Brunnström, S. A. Beker, K. De Moor, A. Dooms, S. Egger,M.-N. Garcia, T. Hossfeld, S. Jumisko-Pyykkö, C. Keimel,M.-C. Larabi, B. Lawlor, P. Le Callet, S. Möller, F. Pereira,M. Pereira, A. Perkis, J. Pibernik, A. Pinheiro, A. Raake,P. Reichl, U. Reiter, R. Schatz, P. Schelkens, L. Skorin-Kapov,D. Strohmeier, C. Timmerer, M. Varela, I. Wechsung, J. You,A. Zgank, Qualinet White Paper on Definitions of Quality ofExperience, qualinet White Paper on Definitions of Quality ofExperience Output from the fifth Qualinet meeting, Novi Sad,March 12, 2013 (Mar. 2013).URL https://hal.archives-ouvertes.fr/hal-00977812
[2] A. Leon-Garcia, L. Zucherman, Generalizing MOS to AssessTechnical Quality for End-to-End Telecom Session, in: Globe-com Workshops (GC Wkshps), 2014, 2014, pp. 681–687. doi:10.1109/GLOCOMW.2014.7063511.
[3] S. Barakovic, J. Barakovic, H. Bajric, QoE Dimensions and QoEMeasurement of NGN Services, in: Proceedings of the 18thTelecommunications Forum (TELFOR), 2010.
[4] N. Corporation, Nokia: Quality of Experience (QoE) of Mo-bile Services: Can It be Measured and Improved?, White Paper,Nokia (2005).
[5] ITU-T, QoE Factors in Web-Browsing, TelecommunicationStandardization Sector of ITU Recommendation G.1031.
[6] L. Skorin-Kapov, Survey and Challenges of QoE ManagementIssues in Wireless Networks, Journal of Computer Networks andCommunications 2013 (2013) 28 pages.
[7] M. Kunapareddy, G. Godbole, Delivering Network Centric Cus-tomer Experience, Technical Report, Tech Mahindra Limited(2011).
[8] A. Khan, L. Sun, E. Jammeh, E. Ifeachor, Quality ofExperience-Driven Adaptation Scheme for Video ApplicationsOver Wireless Networks, IET Communications 4 (11) (2010)1337–1347. doi:10.1049/iet-com.2009.0422.
[9] R. Imran, M. Odeh, N. Zorba, C. Verikoukis, Spatial Oppor-tunistic Transmission for Quality of Experience Satisfaction,J. Vis. Comun. Image Represent. 25 (3) (2014) 578–585.doi:10.1016/j.jvcir.2013.08.014.URL http://dx.doi.org/10.1016/j.jvcir.2013.08.014
[10] M. Alreshoodi, J. Woods, Survey on QoE\QoS CorrelationModels For Multimedia Services, CoRR abs/1306.0221.URL http://arxiv.org/abs/1306.0221
[11] ITU-R, Methodology for the Subjective Assessment of the Qual-ity of Television Pictures, Telecommunication StandardizationSector of ITU Recommendation BT. 500-13.
[12] ITU-T, Telephone Transmission Quality, Telephone Instal-lations, Local Line Networks, Recommendation Series P,Telecommunication standardization sector of ITU (Jan. 2007)P.10/G.100 (2006) /Amd.1.
[13] ITU-T, Quality of Experience Requirements for IPTV Services,Telecommunication Standardization Sector of ITU Recommen-dation G.1080.
[14] ITU-T, Subjective Video Quality Assessment Methods for Mul-timedia Applications, Recommendation P.910, Telecommunia-tion standardization sector of ITU.
[15] A. Raake, S. Egger, Quality and Quality of Experience, in:S. Moeller, A. Raake (Eds.), Quality of Experience: AdvancedConcepts, Applications and Methods, Springer, 2014, Ch. 2.
[16] I. Wechsung, K. D. Moor, Quality of Experience Versus UserExperience, in: S. Moeller, A. Raake (Eds.), Quality of Experi-ence: Advanced Concepts, Applications and Methods, Springer,2014, Ch. 3.
[17] J. Joskowicz, R. Sotelo, J. Lopez Arado, Comparison of Para-metric Models for Video Quality Estimation: Towards a Gen-eral Model, in: Proceedings of the 2012 IEEE InternationalSymposium on Broadband Multimedia Systems and Broadcast-ing (BMSB), 2012, pp. 1–7. doi:10.1109/BMSB.2012.6264245.
[18] J. Joskowicz, J. C. Ardao, A Parametric Model for PerceptualVideo Quality Estimation, Telecommunication Systems 49 (1)(2012) 49–62. doi:10.1007/s11235-010-9352-9.URL http://dx.doi.org/10.1007/s11235-010-9352-9
[19] A. Dalal, A. Bouchard, S. Cantor, Y. Guo, A. Johnson, As-sessing QoE of on-Demand TCP Video Streams in Real Time,in: Proceedings of the 2012 IEEE International Conferenceon Communications (ICC), 2012, pp. 1165–1170. doi:10.1109/ICC.2012.6364073.
[20] A. Reis, J. Chakareski, A. Kassler, S. Sargento, Quality of Ex-perience Optimized Scheduling in Multi-Service Wireless MeshNetworks, in: Proceedings of the 17th IEEE International Con-ference on Image Processing (ICIP), 2010, pp. 3233–3236.doi:10.1109/ICIP.2010.5651785.
[21] S. Tao, J. Apostolopoulos, R. Guerin, Real-Time Monitoring ofVideo Quality in IP Networks, IEEE/ACM Transactions on Net-working 16 (5) (2008) 1052–1065. doi:10.1109/TNET.2007.910617.
[22] O. Oyman, S. Singh, Quality of Experience for HTTP AdaptiveStreaming Services, IEEE Communications Magazine 50 (4)(2012) 20–27. doi:10.1109/MCOM.2012.6178830.
[23] A. Balachandran, V. Sekar, A. Akella, S. Seshan,I. Stoica, H. Zhang, Developing a Predictive Modelof Quality of Experience for Internet Video, SIG-COMM Comput. Commun. Rev. 43 (4) (2013) 339–350.doi:10.1145/2534169.2486025.URL http://doi.acm.org/10.1145/2534169.2486025
[24] M. Mushtaq, B. Augustin, A. Mellouk, Empirical Study Based
16

on Machine Learning Approach to Assess the QoS/QoE Cor-relation, in: Networks and Optical Communications (NOC),2012 17th European Conference on, 2012, pp. 1–7. doi:10.1109/NOC.2012.6249939.
[25] Y. Chen, Q. Chen, F. Zhang, Q. Zhang, K. Wu, R. Huang,L. Zhou, Understanding Viewer Engagement of Video Servicein Wi-Fi Network, Comput. Netw. 91 (C) (2015) 101–116.doi:10.1016/j.comnet.2015.08.006.URL http://dx.doi.org/10.1016/j.comnet.2015.08.006
[26] Y. Chen, F. Zhang, F. Zhang, K. Wu, Z. Q., QoE-Aware Dy-namic Video Rate Adaptation, in: IEEE Global Communica-tions Conference (GLOBECOM) 2015, 2015.
[27] T. Hoßfeld, P. E. Heegaard, M. Varela, S. Möller, QoE beyondthe MOS: an in-depth look at QoE via better metrics and theirrelation to MOS, Quality and User Experience 1 (1) (2016)1–23. doi:10.1007/s41233-016-0002-1.URL http://dx.doi.org/10.1007/s41233-016-0002-1
[28] V. Menkovski, G. Exarchakos, A. Liotta, Machine Learning Ap-proach for Quality of Experience Aware Networks, in: Intel-ligent Networking and Collaborative Systems (INCOS), 20102nd International Conference on, 2010, pp. 461–466. doi:10.1109/INCOS.2010.86.
[29] W. Song, D. Tjondronegoro, Acceptability-Based QoE Modelsfor Mobile Video, Multimedia, IEEE Transactions on 16 (3)(2014) 738–750. doi:10.1109/TMM.2014.2298217.
[30] T. De Pessemier, K. De Moor, W. Joseph, L. De Marez,L. Martens, Quantifying the Influence of Rebuffering Interrup-tions on the User’s Quality of Experience During Mobile VideoWatching, Broadcasting, IEEE Transactions on 59 (1) (2013)47–61. doi:10.1109/TBC.2012.2220231.
[31] F. Dobrian, V. Sekar, A. Awan, I. Stoica, D. Joseph, A. Ganjam,J. Zhan, H. Zhang, Understanding the Impact of Video Qualityon User Engagement, in: Proceedings of the ACM SIGCOMM2011 Conference, SIGCOMM ’11, ACM, New York, NY, USA,2011, pp. 362–373. doi:10.1145/2018436.2018478.URL http://doi.acm.org/10.1145/2018436.2018478
[32] R. Mok, E. Chan, R. Chang, Measuring the Quality of Experi-ence of HTTP Video Streaming, in: Integrated Network Man-agement (IM), 2011 IFIP/IEEE International Symposium on,2011, pp. 485–492. doi:10.1109/INM.2011.5990550.
[33] A. Moorthy, L. K. Choi, A. Bovik, G. De Veciana, Video Qual-ity Assessment on Mobile Devices: Subjective, Behavioral andObjective Studies, IEEE Journal of Selected Topics in SignalProcessing 6 (6) (2012) 652–671. doi:10.1109/JSTSP.2012.2212417.
[34] M. Söderlund, Behind the Satisfaction Facade: An Explorationof Customer Frustration, in: Proceedings of the 32nd EuropeanMarketing Academy Conference, 2003.
[35] W. Li, H.-U. Rehman, D. Kaya, M. Chignell, A. Leon-Garcia,L. Zucherman, J. Jiang, Video Quality of Experience in the Pres-ence of Accessibility and Retainability Failures, in: Heteroge-neous Networking for Quality, Reliability, Security and Robust-ness (QShine), 2014 10th International Conference on, 2014,pp. 1–7. doi:10.1109/QSHINE.2014.6928651.
[36] W. Li, H.-U. Rehman, M. Chignell, A. Leon-Garcia, L. Zucher-man, J. Jiang, Impact of Retainability Failures on Video Qual-ity of Experience, in: Signal-Image Technology and Internet-Based Systems (SITIS), 2014 Tenth International Conferenceon, 2014, pp. 524–531. doi:10.1109/SITIS.2014.106.
[37] W. Li, P. Spachos, M. Chignell, A. Leon-Garcia, L. Zucherman,J. Jiang, Impact of technical and content quality on overall expe-rience of ott video, in: 2016 13th IEEE Annual Consumer Com-
munications Networking Conference (CCNC), 2016, pp. 930–935. doi:10.1109/CCNC.2016.7444912.
[38] P. Spachos, W. Li, M. Chignell, A. Leon-Garcia, L. Zucherman,J. Jiang, Acceptability and Quality of Experience in over thetop video, in: Communication Workshop (ICCW), 2015 IEEEInternational Conference on, 2015, pp. 1693–1698. doi:10.1109/ICCW.2015.7247424.
[39] W. Li, P. Spachos, M. Chignell, A. Leon-Garcia, J. Jiang,L. Zucherman, Capturing user behavior in subjective qualityassessment of ott video service, in: 2016 IEEE Global Com-munications Conference (GLOBECOM), 2016, pp. 1–6. doi:10.1109/GLOCOM.2016.7841652.
[40] J. Jiang, P. Spachos, M. Chignell, L. Zucherman, Assessing un-reliability in ott video qoe subjective evaluations using cluster-ing with idealized data, in: 2016 Digital Media Industry Aca-demic Forum (DMIAF), 2016, pp. 235–239. doi:10.1109/DMIAF.2016.7574940.
[41] CCITT, Concepts, Models, Objectives, Dependability Planning- Terms and Definition Related to the Quality of Telecommuni-cation Services, ReSeries E.800, Telecommunication Standard-ization Sector of ITU.
[42] ITU-T, IMT-2000 References to Release 10 of GSM-EvolvedUMTS Core Network, Q.1741.8, Telecommunication Standard-ization Sector of ITU.
[43] S. Jumisko-Pyykkö, V. K. Malamal Vadakital, M. M. Han-nuksela, Acceptance Threshold: A Bidimensional ResearchMethod for User-Oriented Quality Evaluation Studies, Interna-tional Journal of Digital Multimedia Broadcasting 2008 (2008)1–21. doi:10.1155/2008/712380.
[44] P. Spachos, T. Lin, W. Li, M. Chignell, A. Leon-Garcia, J. Jiang,L. Zucherman, Subjective QoE assessment on video service:Laboratory controllable approach, in: 2017 IEEE 18th Interna-tional Symposium on A World of Wireless, Mobile and Mul-timedia Networks (WoWMoM), 2017, pp. 1–9. doi:10.1109/WoWMoM.2017.7974323.
[45] ITU-T, Subjective Audiovisual Quality Assessment Methods forMultimedia Applications, Recommendation P.911, Telecommu-nication standardization sector of ITU.
[46] F. Pedregosa, G. Varoquaux, A. Gramfort, V. Michel, B. Thirion,O. Grisel, M. Blondel, P. Prettenhofer, R. Weiss, V. Dubourg,J. Vanderplas, A. Passos, D. Cournapeau, M. Brucher, M. Per-rot, E. Duchesnay, Scikit-learn: Machine Learning in Python,Journal of Machine Learning Research 12 (2011) 2825–2830.
[47] L. Breiman, Classification and Regression Trees, New York:Routledge, 1984.
[48] W. Li, P. Spachos, M. Chignell, A. Leon-Garcia, L. Zucherman,J. Jiang, Understanding the relationships between performancemetrics and qoe for over-the-top video, in: 2016 IEEE Inter-national Conference on Communications (ICC), 2016, pp. 1–6.doi:10.1109/ICC.2016.7511100.
17