
Quantitative structure activity relationship (QSAR ...
20
Advances in Environmental Research, Vol. 1, No. 4 (2012) 257-276 257 Quantitative structure activity relationship (QSAR) between chlorinated alkene E LUMO and their chlorine Walter Z. Tang and Fang Wang Department of Civil and Environmental Engineering, Florida International University, 10555 West Flagler Street, Miami, FL 33174, USA (Received June 23, 2012, Revised November 30, 2012, Accepted December 1, 2012) Abstract. QSAR models for chlorinated alkenes were developed between E LUMO and their chlorine and carbon content. The aim is to provide valid QSAR model which is statistically validated for E LUMO prediction. Different molecular descriptors, N Cl , N C and E HOMO have been used to take into account relevant information provided by molecular features and physicochemical properties. The best model were selected using Partial Least Square (PLS) and Multiple Linear Regression (MLR) led to models with satisfactory predictive ability for a data set of 15 chlorinated alkene compounds. Keywords: chlorinated alkene; E LUMO ; QSAR; uncertainty 1. Introduction The chlorine substitution in aliphatic compounds results, by its electron attracting effect, in destabilization in alkanes and stabilization in alkenes. Thus, in alkenes, the stability of the molecule increases with the number of chlorine substitutions. Quantitative Structure Activity Relationship (QSAR) has been used intensively to screen and predict fate and toxicity of chemicals related to the environment. The essential assumption for QSAR studies is that biological, chemical and physical properties of compounds heavily dependent on their structural. Among various properties, energy of lowest unoccupied molecular orbital’s (E LUMO ) is of critical importance for describing the ability to gain electron from other sources. The objective of this study is to describe and discuss new externally predictive Multiple Linear Regression (MLR) QSAR models for the prediction of E LUMO of chlorinated alkenes. Models have been developed including N Cl as a molecular descriptor together with other theoretical descriptors, such as N C and E HOMO , while the other is to test the robustness of obtained model through some statistical methods. Furthermore, decision support has to take into account the uncertainty of the models. Since some of relevant study on QSAR often neglected the uncertainty analysis. A QSAR model without uncertainty test would be confined in practical prediction should not be used to interpret the toxicity behavior. According to the density functional theory, chemical potential (μ), chemical hardness (η) are defined as Corresponding author, Professor, E-mail: [email protected] DOI: http://dx.doi.org/10.12989/aer.2012.1.4.257
Transcript of Quantitative structure activity relationship (QSAR ...
Advances in Environmental Research, Vol. 1, No. 4 (2012) 257-276 257
Quantitative structure activity relationship (QSAR) between chlorinated alkene ELUMO and their chlorine
Walter Z. Tang and Fang Wang
Department of Civil and Environmental Engineering, Florida International University,
10555 West Flagler Street, Miami, FL 33174, USA
(Received June 23, 2012, Revised November 30, 2012, Accepted December 1, 2012)
Abstract. QSAR models for chlorinated alkenes were developed between ELUMO and their chlorine and carbon content. The aim is to provide valid QSAR model which is statistically validated for ELUMO prediction. Different molecular descriptors, NCl, NC and EHOMO have been used to take into account relevant information provided by molecular features and physicochemical properties. The best model were selected using Partial Least Square (PLS) and Multiple Linear Regression (MLR) led to models with satisfactory predictive ability for a data set of 15 chlorinated alkene compounds.
Keywords: chlorinated alkene; ELUMO; QSAR; uncertainty 1. Introduction
The chlorine substitution in aliphatic compounds results, by its electron attracting effect, in destabilization in alkanes and stabilization in alkenes. Thus, in alkenes, the stability of the molecule increases with the number of chlorine substitutions. Quantitative Structure Activity Relationship (QSAR) has been used intensively to screen and predict fate and toxicity of chemicals related to the environment. The essential assumption for QSAR studies is that biological, chemical and physical properties of compounds heavily dependent on their structural. Among various properties, energy of lowest unoccupied molecular orbital’s (ELUMO) is of critical importance for describing the ability to gain electron from other sources.
The objective of this study is to describe and discuss new externally predictive Multiple Linear Regression (MLR) QSAR models for the prediction of ELUMO of chlorinated alkenes. Models have been developed including NCl as a molecular descriptor together with other theoretical descriptors, such as NC and EHOMO, while the other is to test the robustness of obtained model through some statistical methods. Furthermore, decision support has to take into account the uncertainty of the models. Since some of relevant study on QSAR often neglected the uncertainty analysis. A QSAR model without uncertainty test would be confined in practical prediction should not be used to interpret the toxicity behavior.
According to the density functional theory, chemical potential (µ), chemical hardness (η) are defined as
Corresponding author, Professor, E-mail: [email protected]
DOI: http://dx.doi.org/10.12989/aer.2012.1.4.257
Walter Z. Tang and Fang Wang
)(rN
E
(1)
vv NNE /2
1/
2
122 (2)
where E is the total energy of the system, N is the number of electrons in the system and υ(r) is the external potential. µ is the negative of the electronegativity (χ) as defined by Iczkowski and Margrave (1961). E versus N plots is not straight lines but is generally convex upward. Their curvatures define another property of substantial importance, the hardness (η). The vertical ionization potential (I) of a system is the change of energy when an electron is removed from the system and variation of the energy when an electron is added to the system, known as electron affinity (A). In both electron withdrawing and electron addition, the external potential has to be kept fixed. Hence, using finite difference approximation, Eqs. (1) and (2) become
2
AI (3)
2
AI (4)
However, to obtain the IP and EA and hence µ and η, one needs three energy values (EN, EN+1 and EN-1). To save computational time, chemical potential and chemical hardness have been calculated by using Koopmans’ theorem as
2HOMOLUMO EE
(5)
2HOMOLUMO EE
(6)
where ELUMO is the lowest unoccupied molecular orbital’s energy and EHOMO is the highest occupied molecular orbital’s energy.
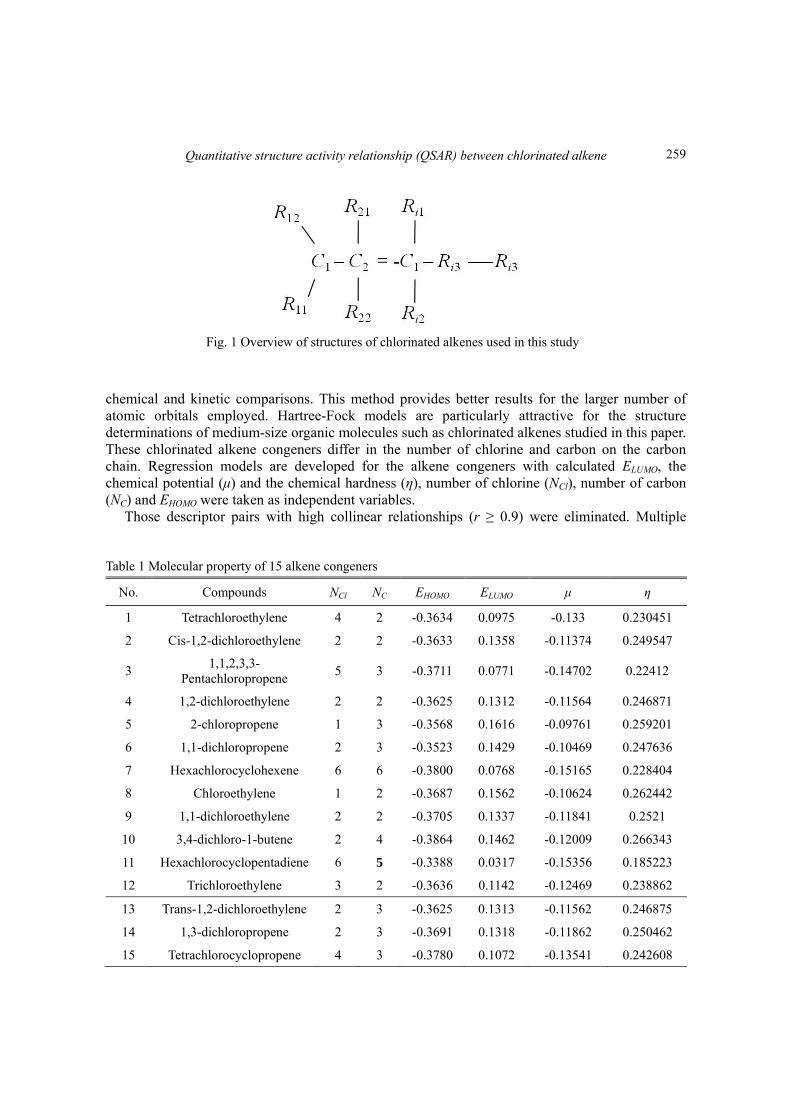
2. Dataset and methods 2.1 Data set Data were collected for fifteen derivations of chlorinated alkene. Fig. 1 shows the structure of
alkene compounds. QSAR model can be modeled due to their structural similarity which expected fall into similar mode of toxic action. From this set, two subsets were constructed by taking at random 12 compounds as the training sample and the remaining 3 compounds as the prediction sample. This proportion amounts for 80% of the compounds in the training set (Table 1). EHOMO and ELUMO values were calculated using SPARTAN Spartan Pro (Wavefunction Inc.). Ab initio calculations based on the orbital approximation were used and referred as Hartree-Fock method. Hartree-Fock molecular orbital models are generally satisfactory for a wide variety of thermo-
258
Quantitative structure activity relationship (QSAR) between chlorinated alkene
Fig. 1 Overview of structures of chlorinated alkenes used in this study
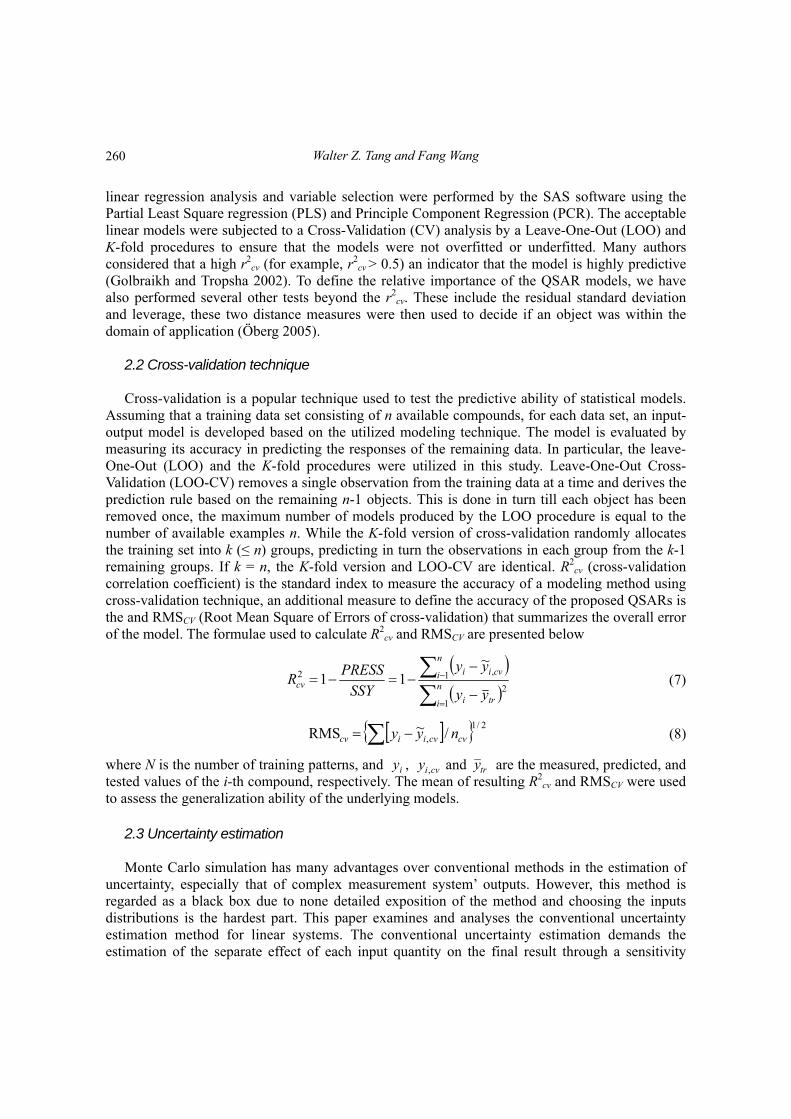
chemical and kinetic comparisons. This method provides better results for the larger number of atomic orbitals employed. Hartree-Fock models are particularly attractive for the structure determinations of medium-size organic molecules such as chlorinated alkenes studied in this paper. These chlorinated alkene congeners differ in the number of chlorine and carbon on the carbon chain. Regression models are developed for the alkene congeners with calculated ELUMO, the chemical potential (μ) and the chemical hardness (η), number of chlorine (NCl), number of carbon (NC) and EHOMO were taken as independent variables.
Those descriptor pairs with high collinear relationships (r ≥ 0.9) were eliminated. Multiple
Table 1 Molecular property of 15 alkene congeners
No. Compounds NCl NC EHOMO ELUMO μ η
1 Tetrachloroethylene 4 2 -0.3634 0.0975 -0.133 0.230451
2 Cis-1,2-dichloroethylene 2 2 -0.3633 0.1358 -0.11374 0.249547
3 1,1,2,3,3-
Pentachloropropene 5 3 -0.3711 0.0771 -0.14702 0.22412
4 1,2-dichloroethylene 2 2 -0.3625 0.1312 -0.11564 0.246871
5 2-chloropropene 1 3 -0.3568 0.1616 -0.09761 0.259201
6 1,1-dichloropropene 2 3 -0.3523 0.1429 -0.10469 0.247636
7 Hexachlorocyclohexene 6 6 -0.3800 0.0768 -0.15165 0.228404
8 Chloroethylene 1 2 -0.3687 0.1562 -0.10624 0.262442
9 1,1-dichloroethylene 2 2 -0.3705 0.1337 -0.11841 0.2521
10 3,4-dichloro-1-butene 2 4 -0.3864 0.1462 -0.12009 0.266343
11 Hexachlorocyclopentadiene 6 5 -0.3388 0.0317 -0.15356 0.185223
12 Trichloroethylene 3 2 -0.3636 0.1142 -0.12469 0.238862
13 Trans-1,2-dichloroethylene 2 3 -0.3625 0.1313 -0.11562 0.246875
14 1,3-dichloropropene 2 3 -0.3691 0.1318 -0.11862 0.250462
15 Tetrachlorocyclopropene 4 3 -0.3780 0.1072 -0.13541 0.242608
259
Walter Z. Tang and Fang Wang
linear regression analysis and variable selection were performed by the SAS software using the Partial Least Square regression (PLS) and Principle Component Regression (PCR). The acceptable linear models were subjected to a Cross-Validation (CV) analysis by a Leave-One-Out (LOO) and K-fold procedures to ensure that the models were not overfitted or underfitted. Many authors considered that a high r2
cv (for example, r2cv > 0.5) an indicator that the model is highly predictive
(Golbraikh and Tropsha 2002). To define the relative importance of the QSAR models, we have also performed several other tests beyond the r2
cv. These include the residual standard deviation and leverage, these two distance measures were then used to decide if an object was within the domain of application (Öberg 2005).
2.2 Cross-validation technique Cross-validation is a popular technique used to test the predictive ability of statistical models.
Assuming that a training data set consisting of n available compounds, for each data set, an input-output model is developed based on the utilized modeling technique. The model is evaluated by measuring its accuracy in predicting the responses of the remaining data. In particular, the leave-One-Out (LOO) and the K-fold procedures were utilized in this study. Leave-One-Out Cross-Validation (LOO-CV) removes a single observation from the training data at a time and derives the prediction rule based on the remaining n-1 objects. This is done in turn till each object has been removed once, the maximum number of models produced by the LOO procedure is equal to the number of available examples n. While the K-fold version of cross-validation randomly allocates the training set into k (≤ n) groups, predicting in turn the observations in each group from the k-1 remaining groups. If k = n, the K-fold version and LOO-CV are identical. R2
cv (cross-validation correlation coefficient) is the standard index to measure the accuracy of a modeling method using cross-validation technique, an additional measure to define the accuracy of the proposed QSARs is the and RMSCV (Root Mean Square of Errors of cross-validation) that summarizes the overall error of the model. The formulae used to calculate R2
cv and RMSCV are presented below
n
i tri
n
i cviicv
yy
yy
SSY
PRESSR
1
2
1 ,2~
11 (7)
2/1
, /~RMS cvcviicv nyy (8)
where N is the number of training patterns, and , and are the measured, predicted, and tested values of the i-th compound, respectively. The mean of resulting R2
cv and RMSCV were used to assess the generalization ability of the underlying models.
2.3 Uncertainty estimation Monte Carlo simulation has many advantages over conventional methods in the estimation of
uncertainty, especially that of complex measurement system’ outputs. However, this method is regarded as a black box due to none detailed exposition of the method and choosing the inputs distributions is the hardest part. This paper examines and analyses the conventional uncertainty estimation method for linear systems. The conventional uncertainty estimation demands the estimation of the separate effect of each input quantity on the final result through a sensitivity
cviy , tryiy
260
Quantitative structure activity relationship (QSAR) between chlorinated alkene
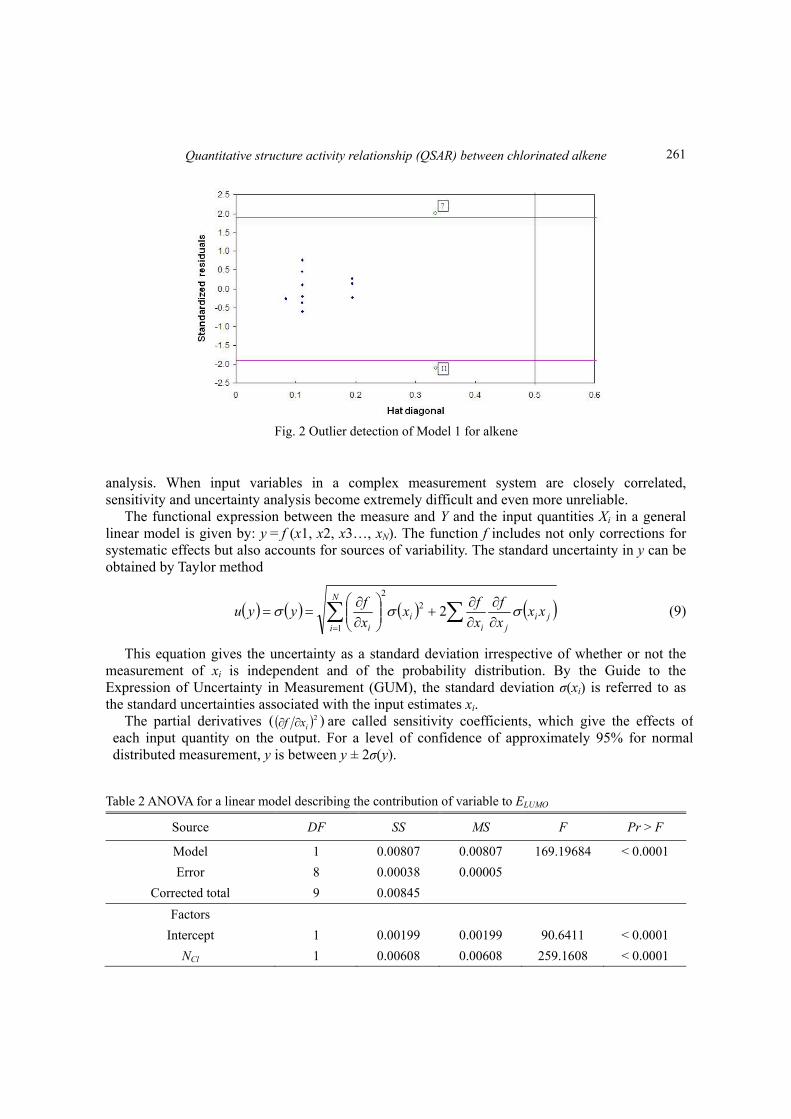
Fig. 2 Outlier detection of Model 1 for alkene
analysis. When input variables in a complex measurement system are closely correlated, sensitivity and uncertainty analysis become extremely difficult and even more unreliable.
The functional expression between the measure and Y and the input quantities Xi in a general linear model is given by: y = f (x1, x2, x3…, xN). The function f includes not only corrections for systematic effects but also accounts for sources of variability. The standard uncertainty in y can be obtained by Taylor method
N
iji
jii
i
xxx
f
x
fx
x
fyyu
1
22
2 (9)
This equation gives the uncertainty as a standard deviation irrespective of whether or not the measurement of xi is independent and of the probability distribution. By the Guide to the Expression of Uncertainty in Measurement (GUM), the standard deviation σ(xi) is referred to as the standard uncertainties associated with the input estimates xi.
The partial derivatives are called sensitivity coefficients, which give the effects ofeach input quantity on the output. For a level of confidence of approximately 95% for normaldistributed measurement, y is between y ± 2σ(y).
Table 2 ANOVA for a linear model describing the contribution of variable to ELUMO
Source DF SS MS F Pr > F
Model 1 0.00807 0.00807 169.19684 < 0.0001
Error 8 0.00038 0.00005
Corrected total 9 0.00845
Factors
Intercept 1 0.00199 0.00199 90.6411 < 0.0001
NCl 1 0.00608 0.00608 259.1608 < 0.0001
( 2ixf )
261
Walter Z. Tang and Fang Wang
Table 3 Goodness of fit statistics
Observations 10 MSE 0.00002 Sum of weights 10 RMSE 0.00485
R² 0.97006 MAPE 2.69905 Adjusted R² 0.96631 Press RMSE 0.00557
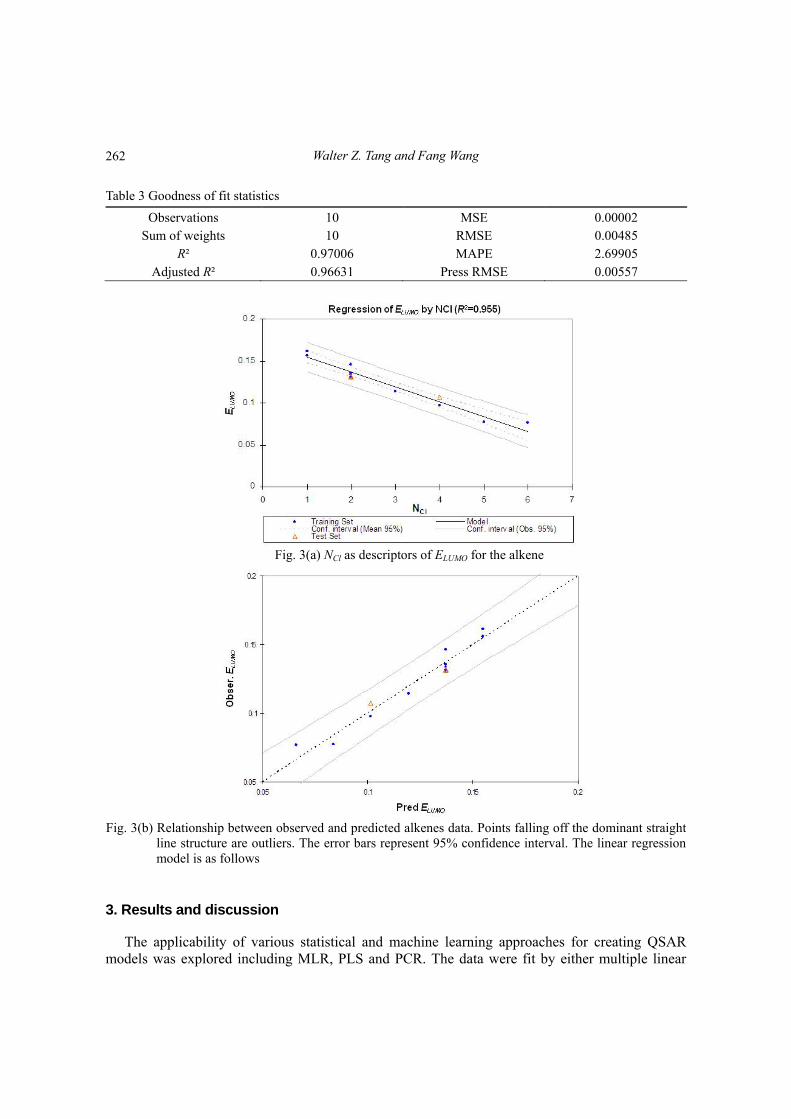
Fig. 3(a) NCl as descriptors of ELUMO for the alkene
Fig. 3(b) Relationship between observed and predicted alkenes data. Points falling off the dominant straight
line structure are outliers. The error bars represent 95% confidence interval. The linear regressionmodel is as follows
3. Results and discussion
The applicability of various statistical and machine learning approaches for creating QSAR models was explored including MLR, PLS and PCR. The data were fit by either multiple linear
262
Quantitative structure activity relationship (QSAR) between chlorinated alkene
regression (MLR) or partial least squares regression (PLS). For a theoretical background on MLR and PLS, see References (Martens and Naes 1989).
3.1 Evaluation of molecular descriptors
We will first examine a 1+1 predictor fit: intercept and 1 predictor. In Model 1, the single response variable is ELUMO, and potential predictor variable is NCl. ELUMO=a1* NCl +k1.
3.1.1 Outlier detection The Williams plot, or leverage plot, is a plot of standardized residuals versus leverages (hat
diagonals). In this plot the horizontal and vertical straight lines indicate the normal limits of outlier and influential chemicals values, respectively. Prediction for compounds with high leverage values must be considered unreliable. According to extrapolation method, we consider as reliable only the predictions of the compounds, whose leverages lie within the domain of applicability. Fig. 2 shows that the majority of compounds of the training set are inside of this square area. However, two compounds (7 and 11) have leverages greater than h*(h*=0.5), and these two compounds response outliers can be identified in the training set. By removing these two outliers, R2 value is improved to 0.9701 from 0.9281. Those two points will be discarded in the following analysis.
3.1.2 Linear regression The final models were then developed on a training set of 12 compounds and validated on 3
external compounds. With linear regression method, a regression equation consisting of coeffi- cients is produced. The linear regression results from an ANOVA for the alkene are summarized in Table 2.
For chlorinated alkene compounds, Fig. 3(a) demonstrated that the descriptor number of chlorine is negative interrelated to the ELUMO, ELUMO decrease as the number of chlorines increase. As ELUMO decreases, the ability of a compound to undergo reduction increases; therefore, an increase in chlorines increases the reactivity of the molecule. ELUMO represents 97.01% of the variance in the linear regression equation, the slope of the QSAR model is -0.02056, and the intercept is 0.1789. The correlation indicates that as the number of chlorine increase from 1 to 6 in an alkene compound, that ELUMO will decrease 0.1299. The probability of the alkene getting a correlation of -0.9849 for a sample size of 12 is less than 0.01%. Fig. 3(b) shows a plot of observed ELUMO against fitted values for Model 1, the correlation of the scatter is -0.9849. The observed over fitted plot should be routinely reported for any (QSAR) regression. The great advantage is that it can always be made, no matter how many predictor variables are included.
0000.0 ,00485.0 ,197.169 ,9701.0 ,10
1790.002056.02
PRMSEFRN
NE clLUMO (9)
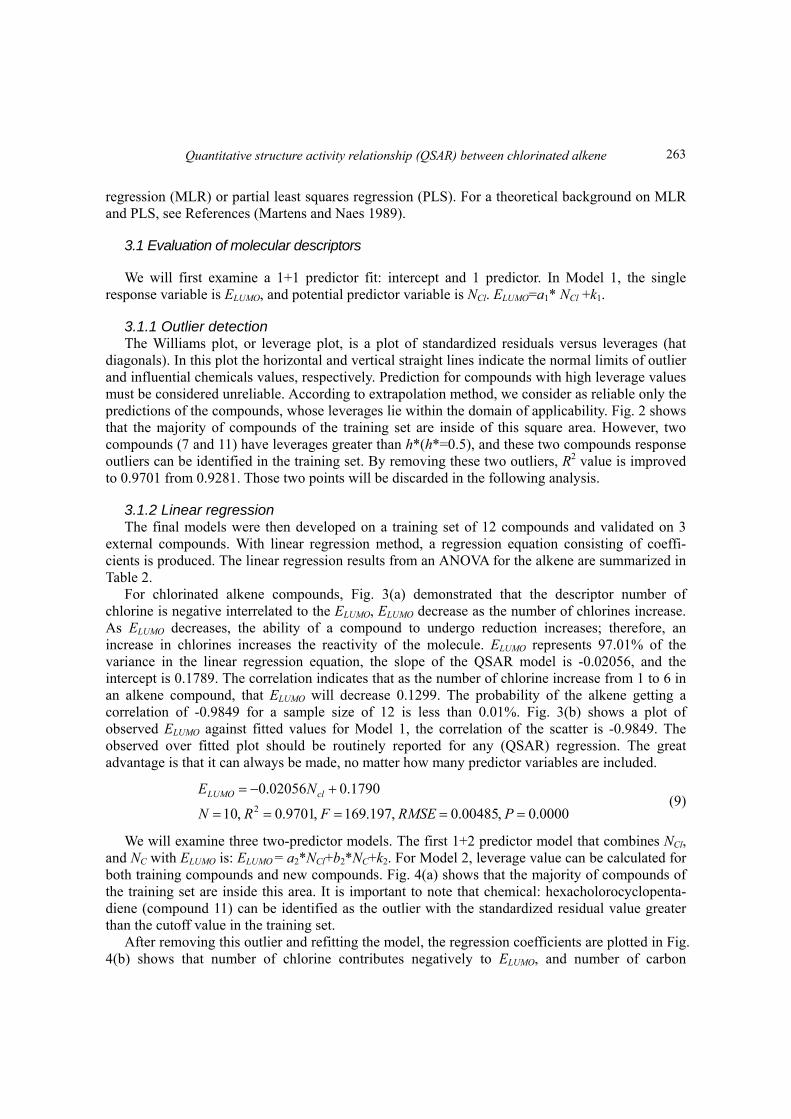
We will examine three two-predictor models. The first 1+2 predictor model that combines NCl, and NC with ELUMO is: ELUMO = a2*NCl+b2*NC+k2. For Model 2, leverage value can be calculated for both training compounds and new compounds. Fig. 4(a) shows that the majority of compounds of the training set are inside this area. It is important to note that chemical: hexacholorocyclopenta- diene (compound 11) can be identified as the outlier with the standardized residual value greater than the cutoff value in the training set.
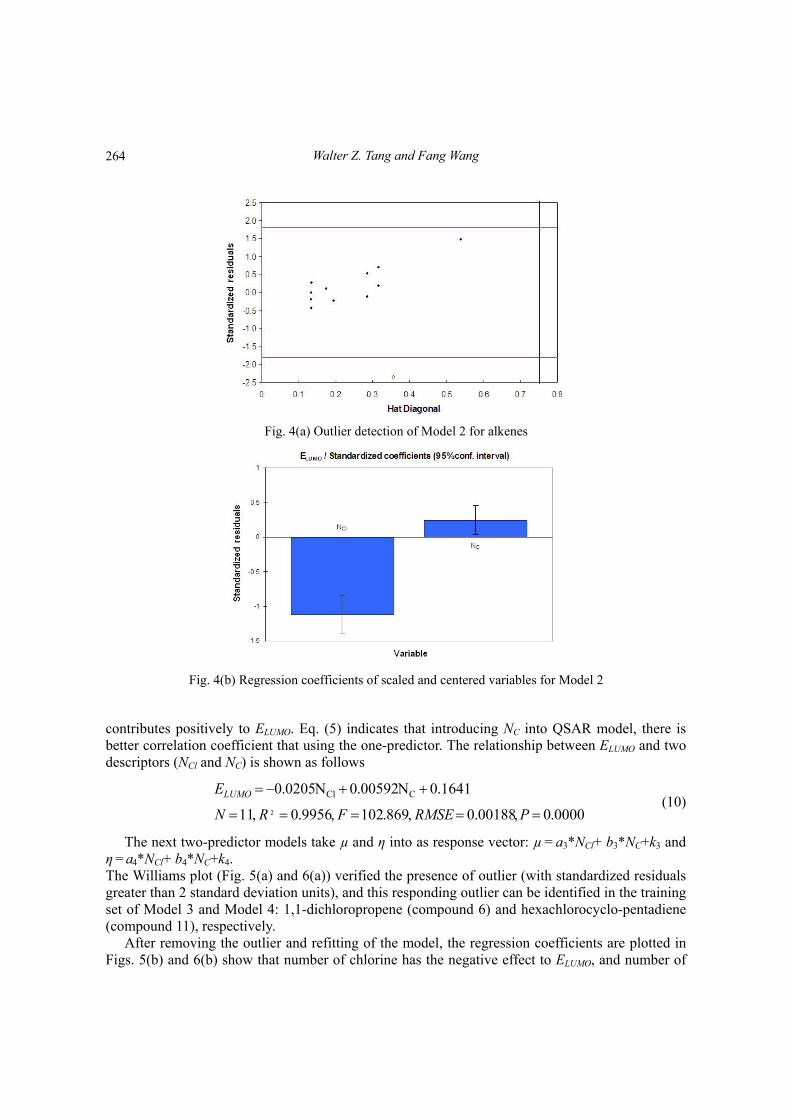
After removing this outlier and refitting the model, the regression coefficients are plotted in Fig. 4(b) shows that number of chlorine contributes negatively to ELUMO, and number of carbon
263
Walter Z. Tang and Fang Wang
Fig. 4(a) Outlier detection of Model 2 for alkenes
Fig. 4(b) Regression coefficients of scaled and centered variables for Model 2
contributes positively to ELUMO. Eq. (5) indicates that introducing NC into QSAR model, there is better correlation coefficient that using the one-predictor. The relationship between ELUMO and two descriptors (NCl and NC) is shown as follows
0000.0,00188.0 ,869.102 ,9956.0 ,11
1641.0N00592.0N0205.0
2
CCl
PRMSEFRN
ELUMO (10)
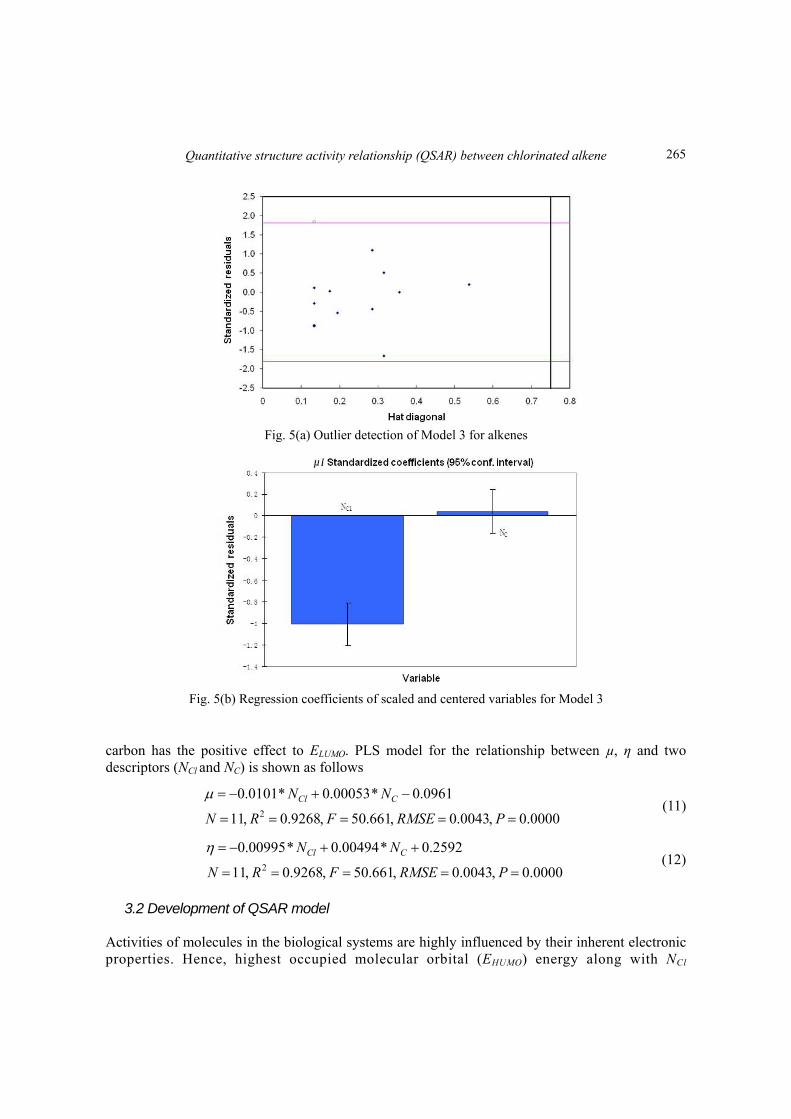
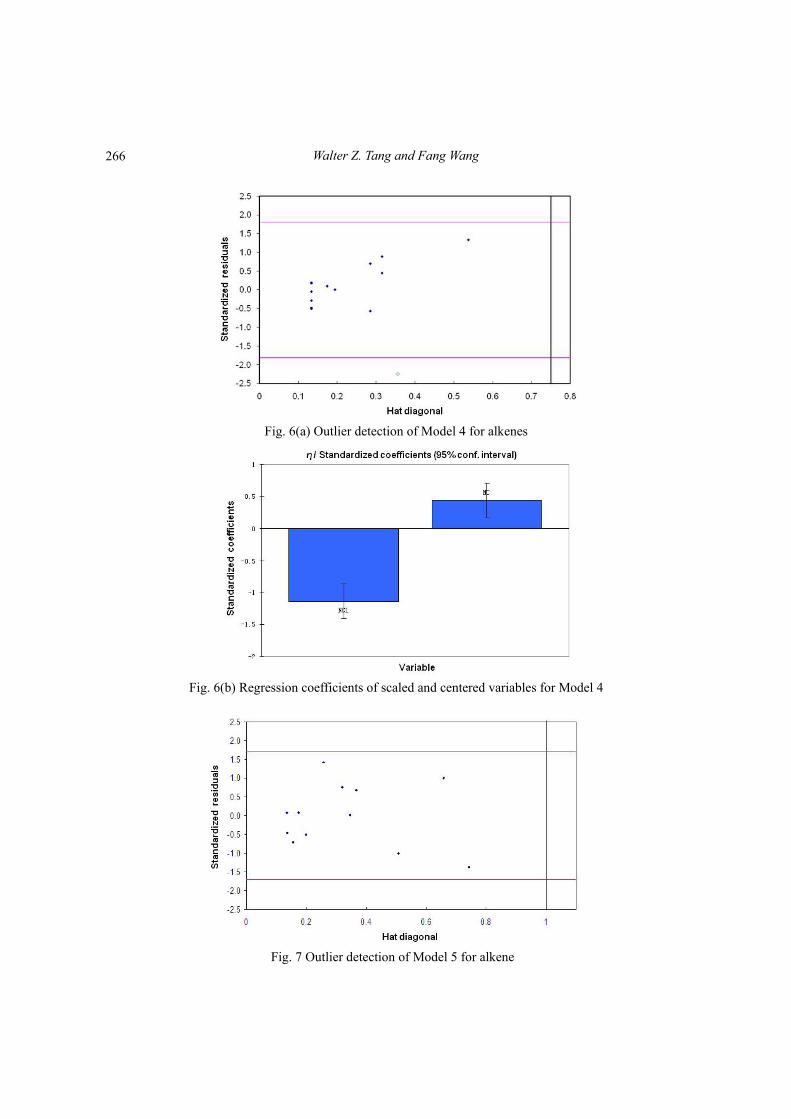
The next two-predictor models take µ and η into as response vector: µ = a3*NCl+ b3*NC+k3 and η = a4*NCl+ b4*NC+k4. The Williams plot (Fig. 5(a) and 6(a)) verified the presence of outlier (with standardized residuals greater than 2 standard deviation units), and this responding outlier can be identified in the training set of Model 3 and Model 4: 1,1-dichloropropene (compound 6) and hexachlorocyclo-pentadiene (compound 11), respectively.
After removing the outlier and refitting of the model, the regression coefficients are plotted in Figs. 5(b) and 6(b) show that number of chlorine has the negative effect to ELUMO, and number of
264
Quantitative structure activity relationship (QSAR) between chlorinated alkene
Fig. 5(a) Outlier detection of Model 3 for alkenes
Fig. 5(b) Regression coefficients of scaled and centered variables for Model 3
carbon has the positive effect to ELUMO. PLS model for the relationship between µ, η and two descriptors (NCl and NC) is shown as follows
0000.0 ,0043.0 ,661.50 ,9268.0 ,11
0961.0*00053.0*0101.02
PRMSEFRN
NN CCl (11)
0000.0 ,0043.0 ,661.50 ,9268.0 ,11
2592.0*00494.0*00995.02
PRMSEFRN
NN CCl (12)
3.2 Development of QSAR model
Activities of molecules in the biological systems are highly influenced by their inherent electronic properties. Hence, highest occupied molecular orbital (EHUMO) energy along with NCl
265
Walter Z. Tang and Fang Wang
Fig. 6(a) Outlier detection of Model 4 for alkenes
Fig. 6(b) Regression coefficients of scaled and centered variables for Model 4
Fig. 7 Outlier detection of Model 5 for alkene
266
Quantitative structure activity relationship (QSAR) between chlorinated alkene
and NC were selected as molecular descriptor to predict ELUMO. Using all three descriptors in the QSAR model, for the combined set of 12 alkane congeners, maximum values for the coefficient of correlation and lowest root mean square error were obtained. By 3 predictors, ELUMO = a5*NCl+b5*NC +c5*EHOMO+ k5. Fig. 7 shows that all of compounds of the training set are inside this area, and all compound are within the cut-off value limit, which implies that they are not be consider outliers but influential chemicals. The presence of outliers and chemicals very structurally influential in determining model parameters was verified by the Williams plot.
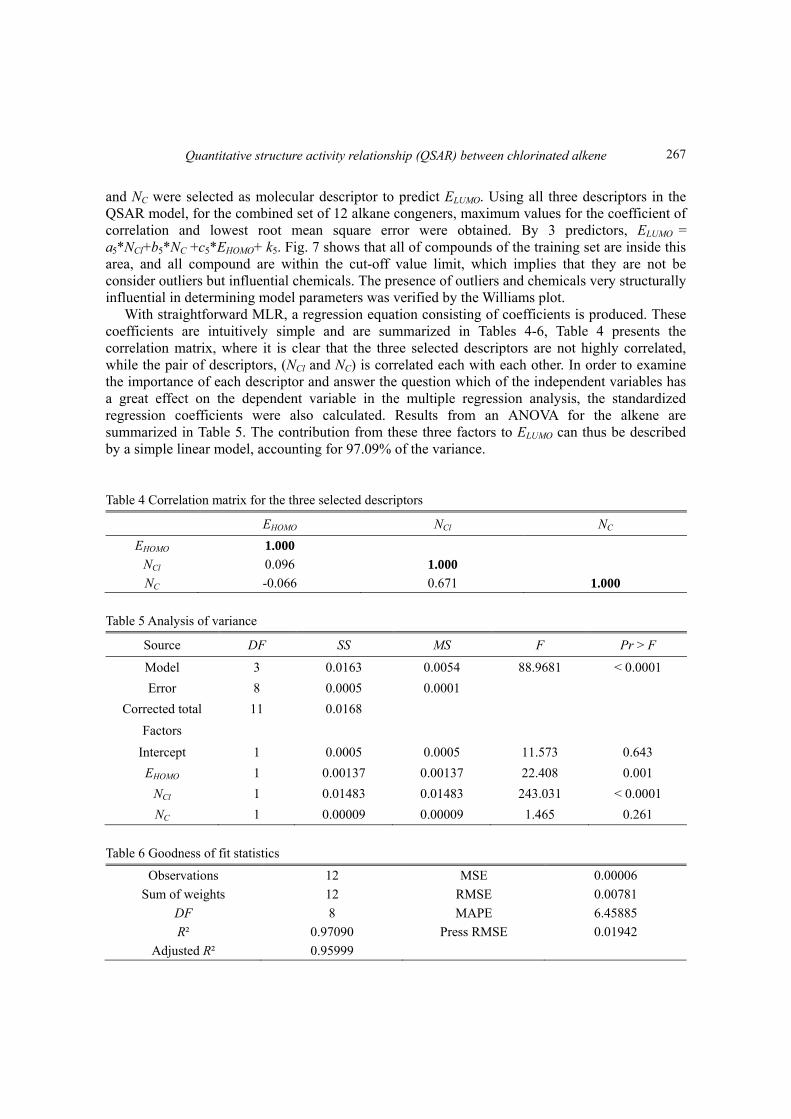
With straightforward MLR, a regression equation consisting of coefficients is produced. These coefficients are intuitively simple and are summarized in Tables 4-6, Table 4 presents the correlation matrix, where it is clear that the three selected descriptors are not highly correlated, while the pair of descriptors, (NCl and NC) is correlated each with each other. In order to examine the importance of each descriptor and answer the question which of the independent variables has a great effect on the dependent variable in the multiple regression analysis, the standardized regression coefficients were also calculated. Results from an ANOVA for the alkene are summarized in Table 5. The contribution from these three factors to ELUMO can thus be described by a simple linear model, accounting for 97.09% of the variance.
Table 4 Correlation matrix for the three selected descriptors
EHOMO NCl NC
EHOMO 1.000
NCl 0.096 1.000
NC -0.066 0.671 1.000
Table 5 Analysis of variance
Source DF SS MS F Pr > F
Model 3 0.0163 0.0054 88.9681 < 0.0001
Error 8 0.0005 0.0001
Corrected total 11 0.0168
Factors
Intercept 1 0.0005 0.0005 11.573 0.643
EHOMO 1 0.00137 0.00137 22.408 0.001
NCl 1 0.01483 0.01483 243.031 < 0.0001
NC 1 0.00009 0.00009 1.465 0.261
Table 6 Goodness of fit statistics
Observations 12 MSE 0.00006
Sum of weights 12 RMSE 0.00781
DF 8 MAPE 6.45885
R² 0.97090 Press RMSE 0.01942
Adjusted R² 0.95999
267
Walter Z. Tang and Fang Wang
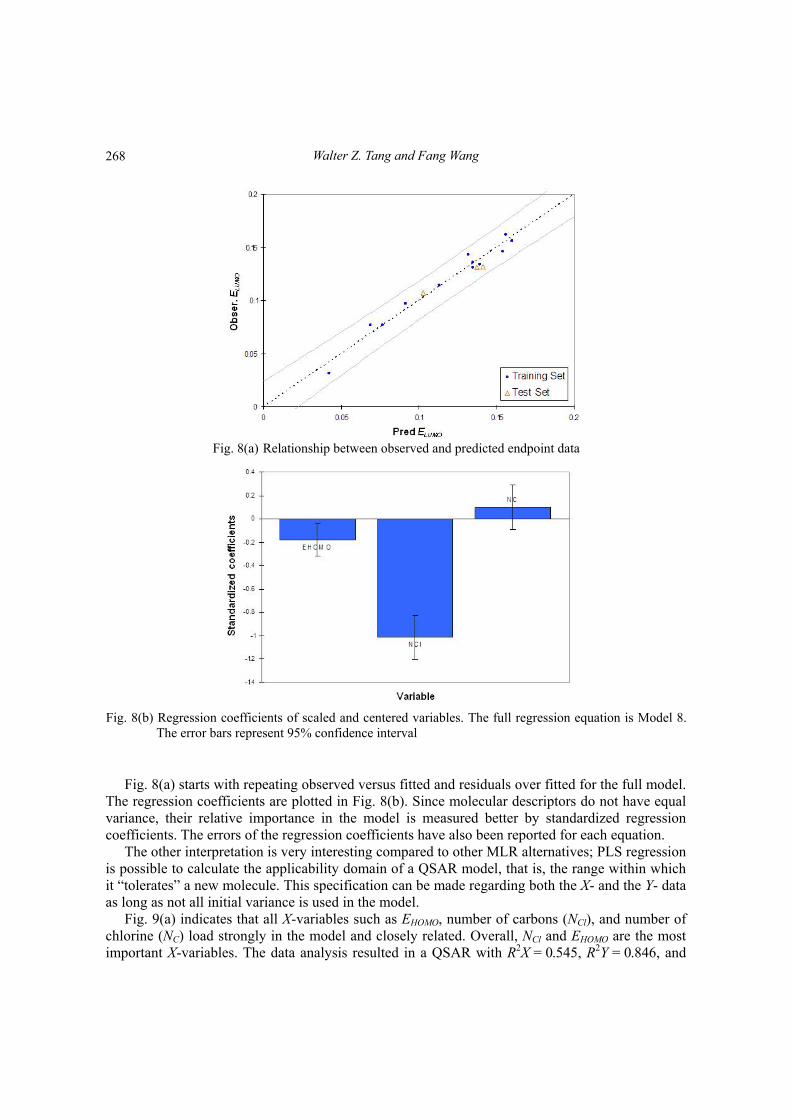
Fig. 8(a) Relationship between observed and predicted endpoint data
Fig. 8(b) Regression coefficients of scaled and centered variables. The full regression equation is Model 8.
The error bars represent 95% confidence interval
Fig. 8(a) starts with repeating observed versus fitted and residuals over fitted for the full model. The regression coefficients are plotted in Fig. 8(b). Since molecular descriptors do not have equal variance, their relative importance in the model is measured better by standardized regression coefficients. The errors of the regression coefficients have also been reported for each equation.
The other interpretation is very interesting compared to other MLR alternatives; PLS regression is possible to calculate the applicability domain of a QSAR model, that is, the range within which it “tolerates” a new molecule. This specification can be made regarding both the X- and the Y- data as long as not all initial variance is used in the model.
Fig. 9(a) indicates that all X-variables such as EHOMO, number of carbons (NCl), and number of chlorine (NC) load strongly in the model and closely related. Overall, NCl and EHOMO are the most important X-variables. The data analysis resulted in a QSAR with R2X = 0.545, R2Y = 0.846, and
268
Quantitative structure activity relationship (QSAR) between chlorinated alkene
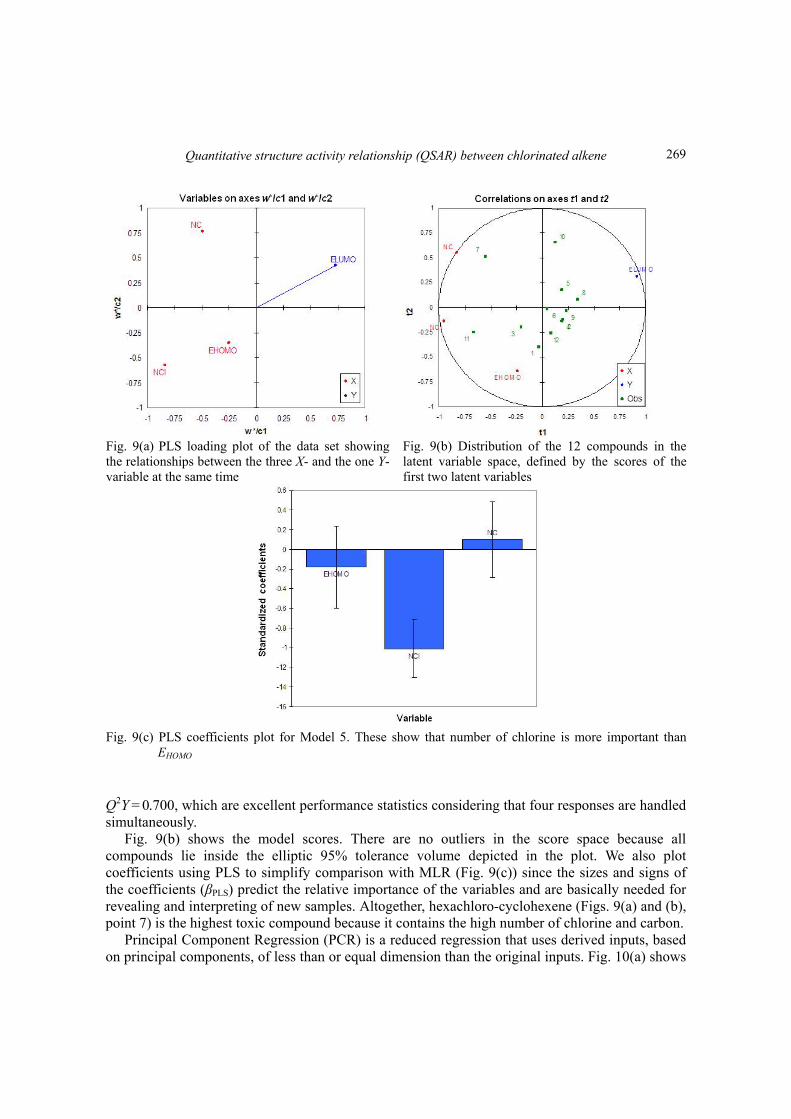
Fig. 9(a) PLS loading plot of the data set showing the relationships between the three X- and the one Y-variable at the same time
Fig. 9(b) Distribution of the 12 compounds in the latent variable space, defined by the scores of the first two latent variables
Fig. 9(c) PLS coefficients plot for Model 5. These show that number of chlorine is more important thanEHOMO
Q2Y = 0.700, which are excellent performance statistics considering that four responses are handled simultaneously.
Fig. 9(b) shows the model scores. There are no outliers in the score space because all compounds lie inside the elliptic 95% tolerance volume depicted in the plot. We also plot coefficients using PLS to simplify comparison with MLR (Fig. 9(c)) since the sizes and signs of the coefficients (βPLS) predict the relative importance of the variables and are basically needed for revealing and interpreting of new samples. Altogether, hexachloro-cyclohexene (Figs. 9(a) and (b), point 7) is the highest toxic compound because it contains the high number of chlorine and carbon.
Principal Component Regression (PCR) is a reduced regression that uses derived inputs, based on principal components, of less than or equal dimension than the original inputs. Fig. 10(a) shows
269
Walter Z. Tang and Fang Wang
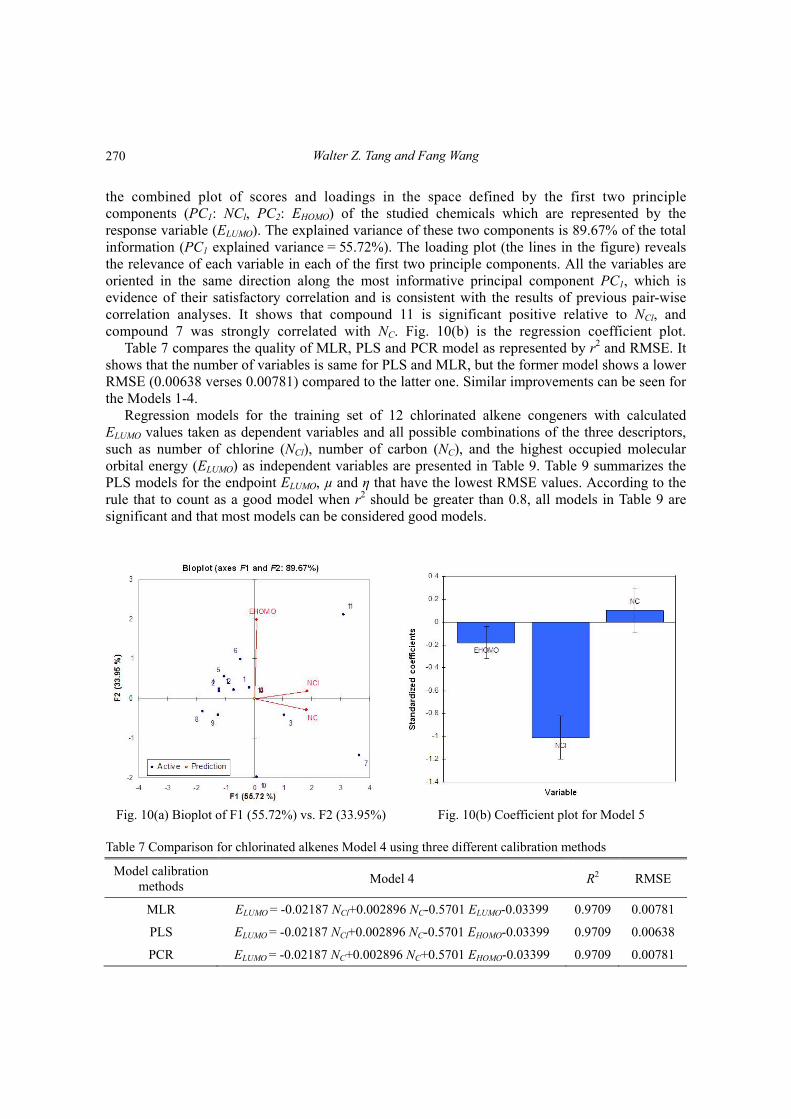
the combined plot of scores and loadings in the space defined by the first two principle components (PC1: NCl, PC2: EHOMO) of the studied chemicals which are represented by the response variable (ELUMO). The explained variance of these two components is 89.67% of the total information (PC1 explained variance = 55.72%). The loading plot (the lines in the figure) reveals the relevance of each variable in each of the first two principle components. All the variables are oriented in the same direction along the most informative principal component PC1, which is evidence of their satisfactory correlation and is consistent with the results of previous pair-wise correlation analyses. It shows that compound 11 is significant positive relative to NCl, and compound 7 was strongly correlated with NC. Fig. 10(b) is the regression coefficient plot.
Table 7 compares the quality of MLR, PLS and PCR model as represented by r2 and RMSE. It shows that the number of variables is same for PLS and MLR, but the former model shows a lower RMSE (0.00638 verses 0.00781) compared to the latter one. Similar improvements can be seen for the Models 1-4.
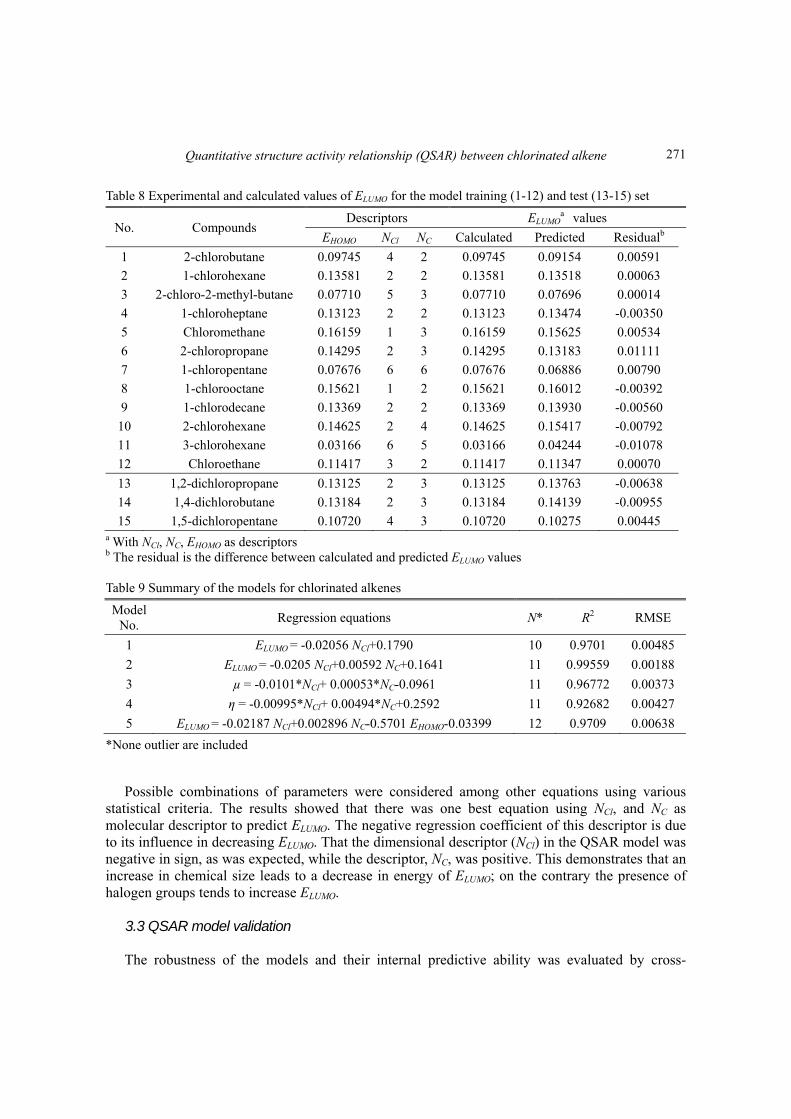
Regression models for the training set of 12 chlorinated alkene congeners with calculated ELUMO values taken as dependent variables and all possible combinations of the three descriptors, such as number of chlorine (NCl), number of carbon (NC), and the highest occupied molecular orbital energy (ELUMO) as independent variables are presented in Table 9. Table 9 summarizes the PLS models for the endpoint ELUMO, µ and η that have the lowest RMSE values. According to the rule that to count as a good model when r2 should be greater than 0.8, all models in Table 9 are significant and that most models can be considered good models.
Fig. 10(a) Bioplot of F1 (55.72%) vs. F2 (33.95%) Fig. 10(b) Coefficient plot for Model 5
Table 7 Comparison for chlorinated alkenes Model 4 using three different calibration methods
Model calibration methods
Model 4 R2 RMSE
MLR ELUMO = -0.02187 NCl+0.002896 NC-0.5701 ELUMO-0.03399 0.9709 0.00781
PLS ELUMO = -0.02187 NCl+0.002896 NC-0.5701 EHOMO-0.03399 0.9709 0.00638
PCR ELUMO = -0.02187 NC+0.002896 NC+0.5701 EHOMO-0.03399 0.9709 0.00781
270
Quantitative structure activity relationship (QSAR) between chlorinated alkene
Table 8 Experimental and calculated values of ELUMO for the model training (1-12) and test (13-15) set
No. Compounds Descriptors ELUMO
a values
EHOMO NCl NC Calculated Predicted Residualb
1 2-chlorobutane 0.09745 4 2 0.09745 0.09154 0.00591
2 1-chlorohexane 0.13581 2 2 0.13581 0.13518 0.00063
3 2-chloro-2-methyl-butane 0.07710 5 3 0.07710 0.07696 0.00014
4 1-chloroheptane 0.13123 2 2 0.13123 0.13474 -0.00350
5 Chloromethane 0.16159 1 3 0.16159 0.15625 0.00534
6 2-chloropropane 0.14295 2 3 0.14295 0.13183 0.01111
7 1-chloropentane 0.07676 6 6 0.07676 0.06886 0.00790
8 1-chlorooctane 0.15621 1 2 0.15621 0.16012 -0.00392
9 1-chlorodecane 0.13369 2 2 0.13369 0.13930 -0.00560
10 2-chlorohexane 0.14625 2 4 0.14625 0.15417 -0.00792
11 3-chlorohexane 0.03166 6 5 0.03166 0.04244 -0.01078
12 Chloroethane 0.11417 3 2 0.11417 0.11347 0.00070
13 1,2-dichloropropane 0.13125 2 3 0.13125 0.13763 -0.00638
14 1,4-dichlorobutane 0.13184 2 3 0.13184 0.14139 -0.00955
15 1,5-dichloropentane 0.10720 4 3 0.10720 0.10275 0.00445 a With NCl, NC, EHOMO as descriptors b The residual is the difference between calculated and predicted ELUMO values Table 9 Summary of the models for chlorinated alkenes
Model No.
Regression equations N* R2 RMSE
1 ELUMO = -0.02056 NCl+0.1790 10 0.9701 0.00485
2 ELUMO = -0.0205 NCl+0.00592 NC+0.1641 11 0.99559 0.00188
3 µ = -0.0101*NCl+ 0.00053*NC-0.0961 11 0.96772 0.00373
4 η = -0.00995*NCl+ 0.00494*NC+0.2592 11 0.92682 0.00427
5 ELUMO = -0.02187 NCl+0.002896 NC-0.5701 EHOMO-0.03399 12 0.9709 0.00638
*None outlier are included
Possible combinations of parameters were considered among other equations using various statistical criteria. The results showed that there was one best equation using NCl, and NC as molecular descriptor to predict ELUMO. The negative regression coefficient of this descriptor is due to its influence in decreasing ELUMO. That the dimensional descriptor (NCl) in the QSAR model was negative in sign, as was expected, while the descriptor, NC, was positive. This demonstrates that an increase in chemical size leads to a decrease in energy of ELUMO; on the contrary the presence of halogen groups tends to increase ELUMO.
3.3 QSAR model validation The robustness of the models and their internal predictive ability was evaluated by cross-
271
Walter Z. Tang and Fang Wang
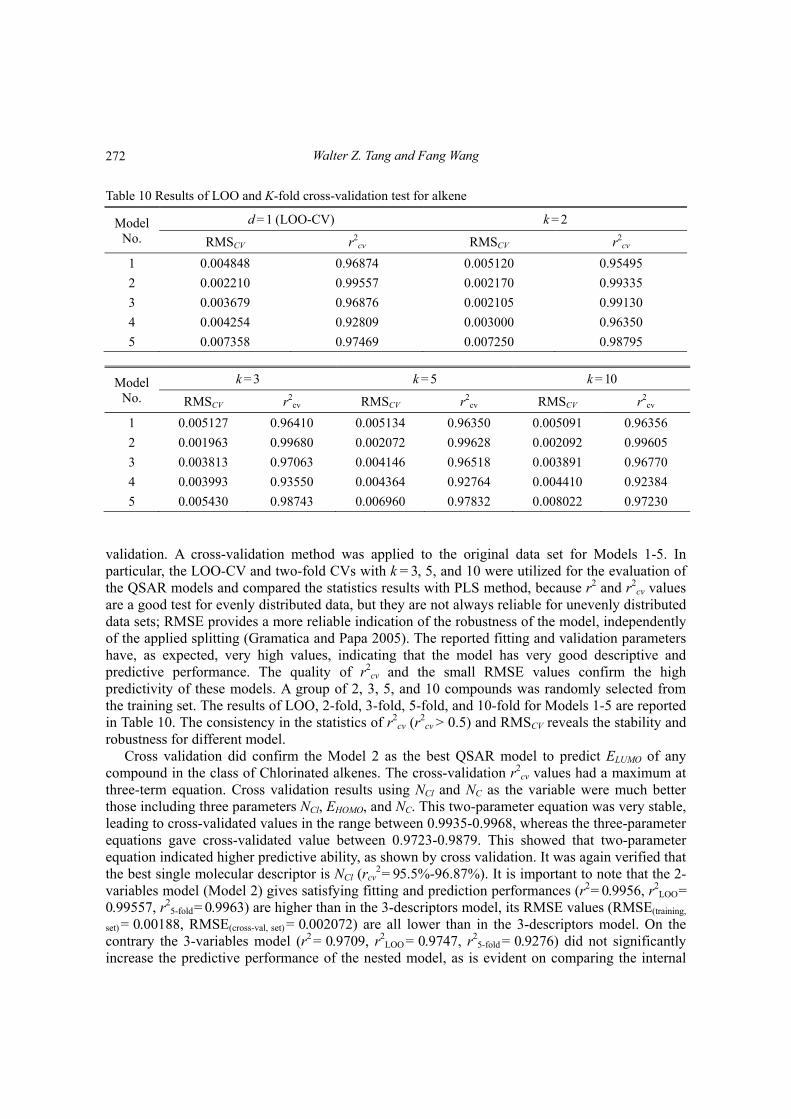
Table 10 Results of LOO and K-fold cross-validation test for alkene
Model No.
d = 1 (LOO-CV) k = 2
RMSCV r2cv RMSCV r2
cv
1 0.004848 0.96874 0.005120 0.95495
2 0.002210 0.99557 0.002170 0.99335
3 0.003679 0.96876 0.002105 0.99130
4 0.004254 0.92809 0.003000 0.96350
5 0.007358 0.97469 0.007250 0.98795
Model No.
k = 3 k = 5 k = 10
RMSCV r2cv RMSCV r2
cv RMSCV r2cv
1 0.005127 0.96410 0.005134 0.96350 0.005091 0.96356
2 0.001963 0.99680 0.002072 0.99628 0.002092 0.99605
3 0.003813 0.97063 0.004146 0.96518 0.003891 0.96770
4 0.003993 0.93550 0.004364 0.92764 0.004410 0.92384
5 0.005430 0.98743 0.006960 0.97832 0.008022 0.97230
validation. A cross-validation method was applied to the original data set for Models 1-5. In particular, the LOO-CV and two-fold CVs with k = 3, 5, and 10 were utilized for the evaluation of the QSAR models and compared the statistics results with PLS method, because r2 and r2
cv values are a good test for evenly distributed data, but they are not always reliable for unevenly distributed data sets; RMSE provides a more reliable indication of the robustness of the model, independently of the applied splitting (Gramatica and Papa 2005). The reported fitting and validation parameters have, as expected, very high values, indicating that the model has very good descriptive and predictive performance. The quality of r2
cv and the small RMSE values confirm the high predictivity of these models. A group of 2, 3, 5, and 10 compounds was randomly selected from the training set. The results of LOO, 2-fold, 3-fold, 5-fold, and 10-fold for Models 1-5 are reported in Table 10. The consistency in the statistics of r2
cv (r2
cv > 0.5) and RMSCV reveals the stability and robustness for different model.
Cross validation did confirm the Model 2 as the best QSAR model to predict ELUMO of any compound in the class of Chlorinated alkenes. The cross-validation r2
cv values had a maximum at three-term equation. Cross validation results using NCl and NC as the variable were much better those including three parameters NCl, EHOMO, and NC. This two-parameter equation was very stable, leading to cross-validated values in the range between 0.9935-0.9968, whereas the three-parameter equations gave cross-validated value between 0.9723-0.9879. This showed that two-parameter equation indicated higher predictive ability, as shown by cross validation. It was again verified that the best single molecular descriptor is NCl (rcv
2 = 95.5%-96.87%). It is important to note that the 2-variables model (Model 2) gives satisfying fitting and prediction performances (r2 = 0.9956, r2
LOO = 0.99557, r2
5-fold = 0.9963) are higher than in the 3-descriptors model, its RMSE values (RMSE(training,
set) = 0.00188, RMSE(cross-val, set) = 0.002072) are all lower than in the 3-descriptors model. On the contrary the 3-variables model (r2 = 0.9709, r2
LOO = 0.9747, r25-fold = 0.9276) did not significantly
increase the predictive performance of the nested model, as is evident on comparing the internal
272
Quantitative structure activity relationship (QSAR) between chlorinated alkene
and external r2cv values. The RMSE value (RMSE(training, set) = 0.00638, RMSE(cross-val, set) = 0.00696)
also show that this last model had a worse internal performance and an external predictivity lower than in Model 2.
Table 10 shows that for Model 2 RMSCV based on the LOO-CV is greater than the true RMSE by about 17.55% ((0.00221-0.00638)/0.00638), and RMSCV based on K-fold are greater than true RMSE in the range 4.43%-15.43%, the difference between RMSCV and true RMSE reaches its maximum at d = 1. For Models 1, 3 and 4, in the case d = 1, CV estimates the r2
cv and RMSCV values with satisfactory accuracy. In addition, the RMSCV based on the selected model is very close to the true RMS error in these cases. The difference between them is about 0.0412%-1.37%. In practice, true RMS error usually means that RMSE estimated based on the model since the true RMS error is not known.
Compared with K-fold cross-validation with k = 2 yields unsatisfactory results, but for all values of k > 2 good models are obtained. However, when k = 10, the results may not be very reliable due
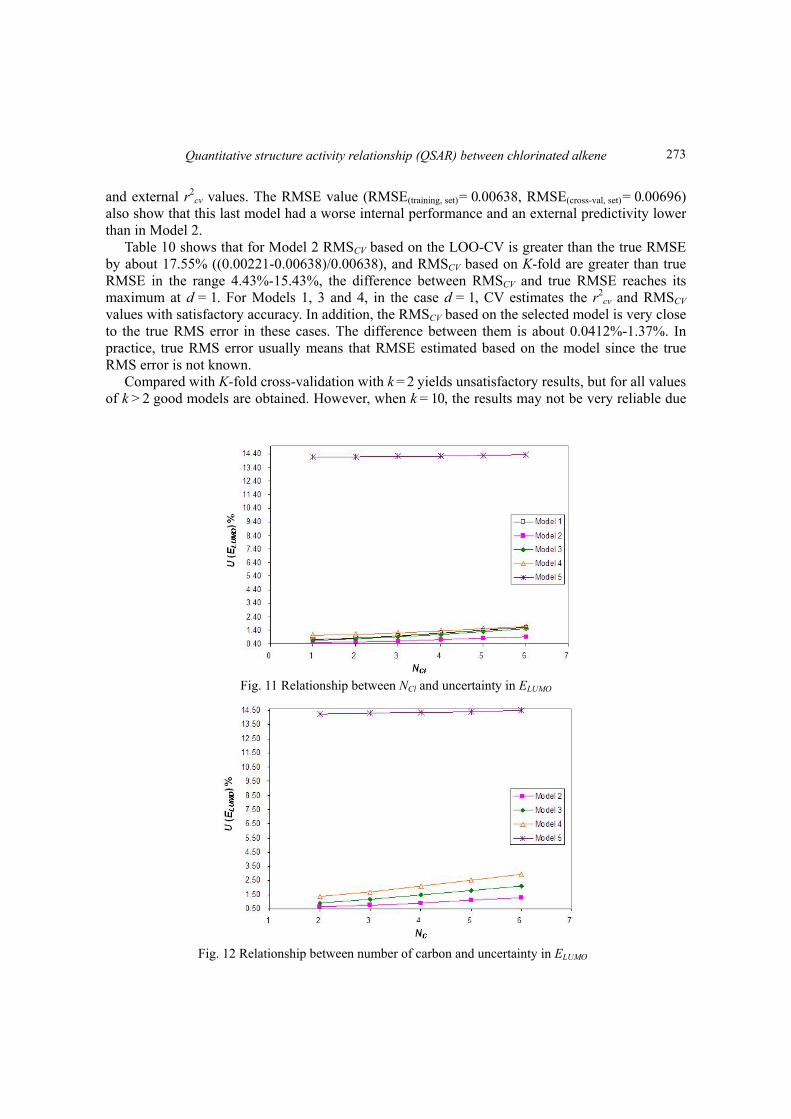
Fig. 11 Relationship between NCl and uncertainty in ELUMO
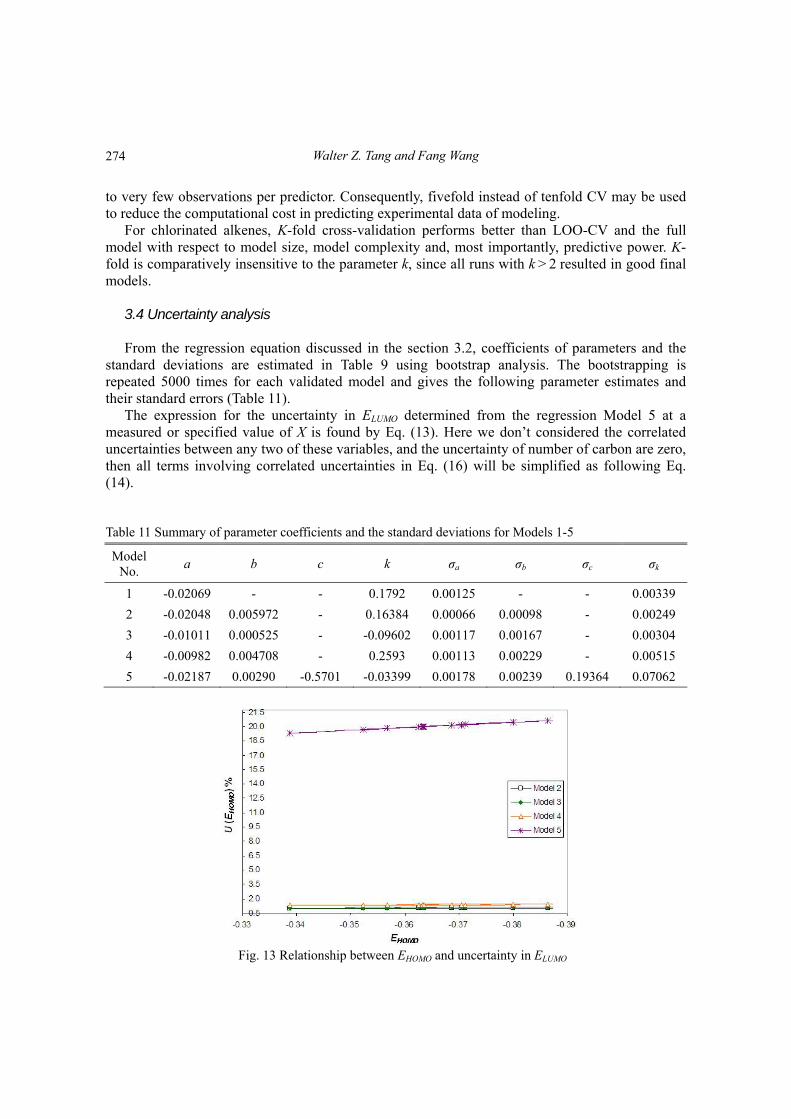
Fig. 12 Relationship between number of carbon and uncertainty in ELUMO
273
Walter Z. Tang and Fang Wang
to very few observations per predictor. Consequently, fivefold instead of tenfold CV may be used to reduce the computational cost in predicting experimental data of modeling.
For chlorinated alkenes, K-fold cross-validation performs better than LOO-CV and the full model with respect to model size, model complexity and, most importantly, predictive power. K-fold is comparatively insensitive to the parameter k, since all runs with k > 2 resulted in good final models.
3.4 Uncertainty analysis From the regression equation discussed in the section 3.2, coefficients of parameters and the
standard deviations are estimated in Table 9 using bootstrap analysis. The bootstrapping is repeated 5000 times for each validated model and gives the following parameter estimates and their standard errors (Table 11).
The expression for the uncertainty in ELUMO determined from the regression Model 5 at a measured or specified value of X is found by Eq. (13). Here we don’t considered the correlated uncertainties between any two of these variables, and the uncertainty of number of carbon are zero, then all terms involving correlated uncertainties in Eq. (16) will be simplified as following Eq. (14).
Table 11 Summary of parameter coefficients and the standard deviations for Models 1-5
Model No.
a b c k σa σb σc σk
1 -0.02069 - - 0.1792 0.00125 - - 0.00339
2 -0.02048 0.005972 - 0.16384 0.00066 0.00098 - 0.00249
3 -0.01011 0.000525 - -0.09602 0.00117 0.00167 - 0.00304
4 -0.00982 0.004708 - 0.2593 0.00113 0.00229 - 0.00515
5 -0.02187 0.00290 -0.5701 -0.03399 0.00178 0.00239 0.19364 0.07062
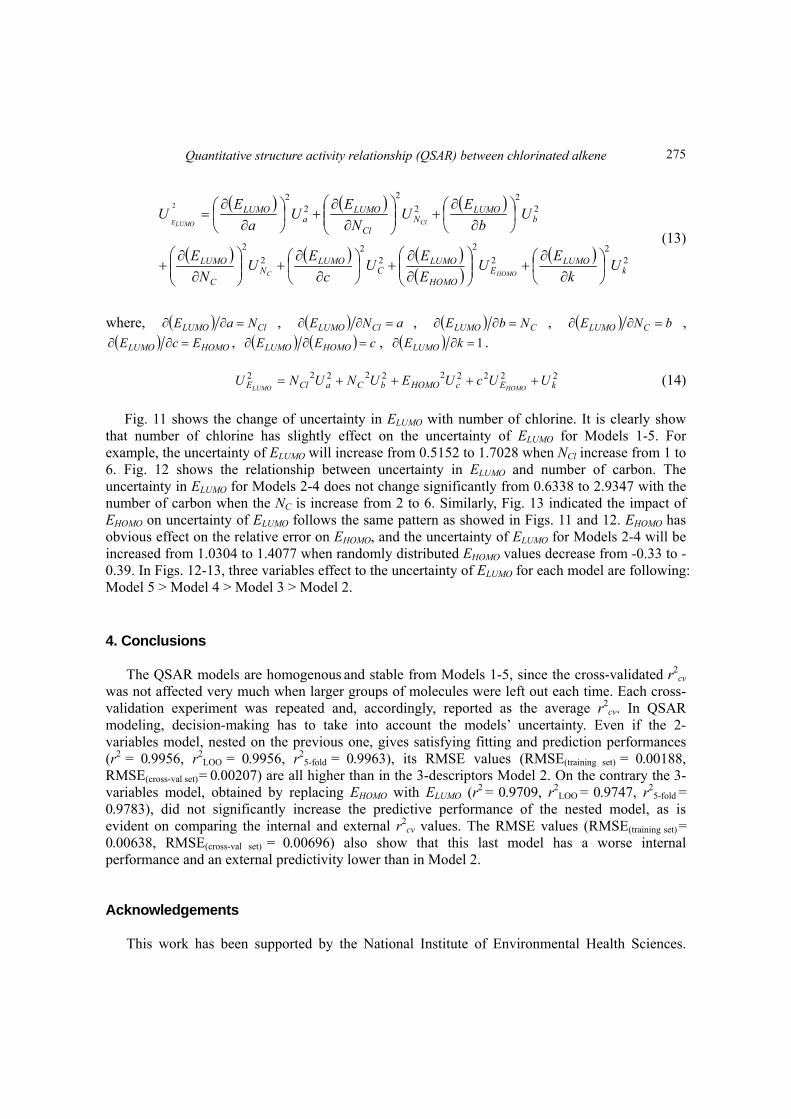
Fig. 13 Relationship between EHOMO and uncertainty in ELUMO
274
Quantitative structure activity relationship (QSAR) between chlorinated alkene
22
2
2
22
2
2
22
2
2
22
2
kLUMO
EHOMO
LUMOC
LUMON
C
LUMO
bLUMO
NCl
LUMOa
LUMO
Uk
EU
E
EU
c
EU
N
E
Ub
EU
N
EU
a
EU
HOMOC
ClLUMOE
(13)
where, ClLUMO NaE , aNE ClLUMO , CLUMO NbE , bNE CLUMO , HOMOLUMO EcE , cEE HOMOLUMO , 1 kELUMO .
2222222222kEcHOMObCaClE UUcUEUNUNU
HOMOLUMO (14)
Fig. 11 shows the change of uncertainty in ELUMO with number of chlorine. It is clearly show that number of chlorine has slightly effect on the uncertainty of ELUMO for Models 1-5. For example, the uncertainty of ELUMO will increase from 0.5152 to 1.7028 when NCl increase from 1 to 6. Fig. 12 shows the relationship between uncertainty in ELUMO and number of carbon. The uncertainty in ELUMO for Models 2-4 does not change significantly from 0.6338 to 2.9347 with the number of carbon when the NC is increase from 2 to 6. Similarly, Fig. 13 indicated the impact of EHOMO on uncertainty of ELUMO follows the same pattern as showed in Figs. 11 and 12. EHOMO has obvious effect on the relative error on EHOMO, and the uncertainty of ELUMO for Models 2-4 will be increased from 1.0304 to 1.4077 when randomly distributed EHOMO values decrease from -0.33 to -0.39. In Figs. 12-13, three variables effect to the uncertainty of ELUMO for each model are following: Model 5 > Model 4 > Model 3 > Model 2. 4. Conclusions
The QSAR models are homogenous and stable from Models 1-5, since the cross-validated r2cv
was not affected very much when larger groups of molecules were left out each time. Each cross-validation experiment was repeated and, accordingly, reported as the average r2
cv. In QSAR modeling, decision-making has to take into account the models’ uncertainty. Even if the 2-variables model, nested on the previous one, gives satisfying fitting and prediction performances (r2 = 0.9956, r2
LOO = 0.9956, r25-fold = 0.9963), its RMSE values (RMSE(training set) = 0.00188,
RMSE(cross-val set) = 0.00207) are all higher than in the 3-descriptors Model 2. On the contrary the 3-variables model, obtained by replacing EHOMO with ELUMO (r2 = 0.9709, r2
LOO = 0.9747, r25-fold =
0.9783), did not significantly increase the predictive performance of the nested model, as is evident on comparing the internal and external r2
cv values. The RMSE values (RMSE(training set) = 0.00638, RMSE(cross-val set) = 0.00696) also show that this last model has a worse internal performance and an external predictivity lower than in Model 2. Acknowledgements
This work has been supported by the National Institute of Environmental Health Sciences.
275
Walter Z. Tang and Fang Wang
Contents of this publication do not necessarily reflect the views and the policies of the U.S. NIH, nor does mention of trade names and commercial products constitute their endorsement by the U.S. Government. In addition, financial support from the Dean’s Infrastructure Award for the College of Engineering and Computing at Florida International University to WT is greatly appreciated. References Baumann, K. von Korff, M. and Albert, H. (2002), “A systematic evaluation of the benefits and hazards of
variable selection in latent variable regression, Part II; Practical applications”, J. Chemometrics, 16(7), 351-360.
Golbraikh, A. and Tropsha, A. (2002), “Beware of q2!”, J. Mol. Graph Model, 20(4), 269-276. Gramatica, P. and Papa, E. (2005), “An update of the BCF QSAR model based on theoretical molecular
descriptors”, QSAR Sci., 24(8), 953-960. Iczkowski, R.P. and Margrave, J.L. (1961), “Electronegativity”, J. Am.Chem. Soc., 83(17), 3547-3551. Kottegoda, N.T. and Rosso, R. (1998), Statistics, Probability and Reliability for Civil and Environmental
Engineers, McGraw-Hill, New York. Martens, H. and Naes, T. (1989), Multivariate Calibration, Wiley, New York. Öberg, T. (2005), “A QSAR for the hydroxyl radical reaction rate constant: Validation, domain of application,
and prediction”, Atmospheric Environment, 39(12), 2189-2200. Sagrado, S. and Cronin, M.T.D. (2006), “Diagnostic tools to determine the quality of “Transparent” regression-
based QSARs: The “Modeling Power” plot”, J. Chem. Inf. Model., 46(3), 1523-1532.
276