A Primer on Federal R&D Budget Trends - AAAS
12
1 For many decades, government has been a major funder of scientific research and technology development. This report serves as a guide to some long-term federal R&D investment trends. Why Does the Federal Government Fund R&D? Most R&D funded by cabinet departments and independent agencies is addressed to public missions in national security, agriculture, health, infrastructure, conservation and other areas. A substantial portion is also devoted to fundamental discovery by national labs and universities. The government-funded research enterprise typically serves a complementary role to industry. While business investment is substantial in many advanced industries, industrial R&D focuses more on development rather than research, which is riskier and with more uncertain return. There is some evidence that industrial research culture has gradually migrated to safer harbors; as one analyst has written, “Market- driven R&D has shifted the focus from fundamental research toward applied R&D. … Now, companies are cutting down on long-term and risky endeavors.” 1 Research investments tend to be more sensitive to firms’ operating liquidity compared to development investments, 2 and research investments are often unappreciated in market valuations. 3 This means that government fills a role that industry often cannot, as described by a 2014 National Academies panel: “Increasingly, government is called upon to fund high-risk, long-term research and some types of applied research, particularly proof-of-concept research, at least to the point where the risks of investment in such research are reduced to attract private-sector funding.” 4 A Primer on Federal R&D Budget Trends MATT HOURIHAN | UPDATED FEBRUARY 2021 At its best, the public research enterprise forms an ecosystem of government labs, universities, nonprofit institutes and industry. 0% 5% 10% 15% 20% 25% 1962 1966 1970 1974 1978 1982 1986 1990 1994 1998 2002 2006 2010 2014 2018 Net Interest Mandatory Nondefense Discretionary Defense Discretionary Figure 1: Federal Spending as a Percent of GDP, 1962-2020 Note: FY 2020 outlays are pre-COVID-19. Source: Budget of the U.S. Government FY 2021. © 2021 AAAS
Transcript of A Primer on Federal R&D Budget Trends - AAAS

1
For many decades, government has been a major funder of scientific research and technology development. This report serves as a guide to some long-term federal R&D investment trends.
Why Does the Federal Government Fund R&D? Most R&D funded by cabinet departments and independent agencies is addressed to public missions in national security, agriculture, health, infrastructure, conservation and other areas. A substantial portion is also devoted to fundamental discovery by national labs and universities.
The government-funded research enterprise typically serves a complementary role to industry. While business investment is substantial in many advanced industries, industrial R&D focuses more on development rather than research, which is riskier and with
more uncertain return. There is some evidence that industrial research culture has gradually migrated to safer harbors; as one analyst has written, “Market-driven R&D has shifted the focus from fundamental research toward applied R&D. … Now, companies are cutting down on long-term and risky endeavors.”1 Research investments tend to be more sensitive to firms’ operating liquidity compared to development investments,2 and research investments are often unappreciated in market valuations.3
This means that government fills a role that industry often cannot, as described by a 2014 National Academies panel: “Increasingly, government is called upon to fund high-risk, long-term research and some types of applied research, particularly proof-of-concept research, at least to the point where the risks of investment in such research are reduced to attract private-sector funding.”4
A Primer on Federal R&D Budget Trends MATT HOURIHAN | UPDATED FEBRUARY 2021
At its best, the public research enterprise forms an ecosystem of government labs, universities, nonprofit institutes and industry.
0%
5%
10%
15%
20%
25%
1962 1966 1970 1974 1978 1982 1986 1990 1994 1998 2002 2006 2010 2014 2018
Net Interest Mandatory Nondefense Discretionary Defense Discretionary
Figure 1: Federal Spending as a Percent of GDP, 1962-2020
Note: FY 2020 outlays are pre-COVID-19. Source: Budget of the U.S. Government FY 2021. © 2021 AAAS
2
Federal R&D expenditures and collaborations may increase the quantity, quality and novelty of invention.5 At its best, the federal R&D enterprise forms an ecosystem of government labs, universities, nonprofit institutes and industry, contributing to progress in pharmaceuticals, semiconductors, food, energy, aerospace, manufacturing and other sectors.6
Discretionary Spending Is Important Context for R&D Virtually all federal R&D funding is contained within the discretionary budget, the portion of the budget determined through annual appropriations. As seen in Figure 1 (previous page), discretionary spending – especially defense – once accounted for a greater share of the budget. Over time, the budget has come to be dominated by mandatory spending, which is made up mostly of the major entitlement programs – Social Security, Medicare and Medicaid – and is mostly on autopilot. The greatest drivers for this shift are an aging population and rising health care costs.
This matters for science because R&D doesn’t tend to change radically as a
share of the discretionary budget. At the height of the Space Race, R&D was 17.4% of discretionary spending, as seen in Figure 2. But since the late 1970s, R&D has tended to fluctuate between 11 and 13% of discretionary spending (recent changes in what gets counted as R&D have pushed this share lower).7 In most years, as the discretionary budget goes, so goes the R&D budget.
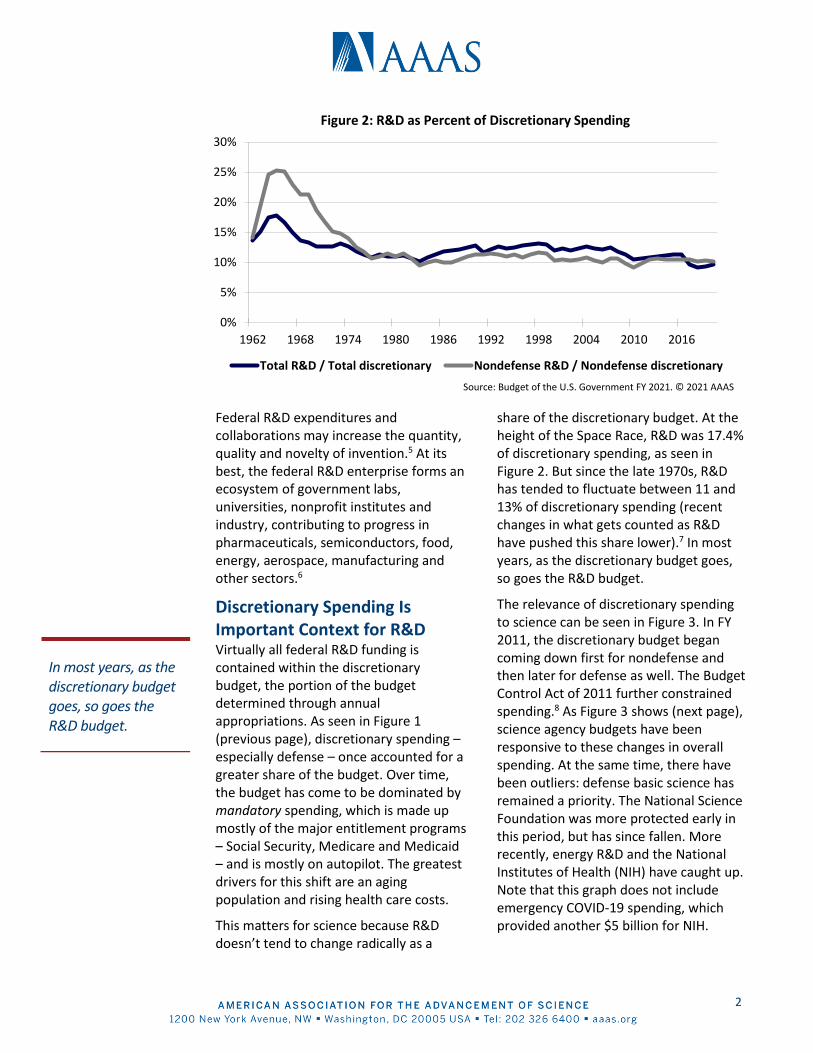
The relevance of discretionary spending to science can be seen in Figure 3. In FY 2011, the discretionary budget began coming down first for nondefense and then later for defense as well. The Budget Control Act of 2011 further constrained spending.8 As Figure 3 shows (next page), science agency budgets have been responsive to these changes in overall spending. At the same time, there have been outliers: defense basic science has remained a priority. The National Science Foundation was more protected early in this period, but has since fallen. More recently, energy R&D and the National Institutes of Health (NIH) have caught up. Note that this graph does not include emergency COVID-19 spending, which provided another $5 billion for NIH.
0%
5%
10%
15%
20%
25%
30%
1962 1968 1974 1980 1986 1992 1998 2004 2010 2016
Total R&D / Total discretionary Nondefense R&D / Nondefense discretionary
Figure 2: R&D as Percent of Discretionary Spending
Source: Budget of the U.S. Government FY 2021. © 2021 AAAS
In most years, as the discretionary budget goes, so goes the R&D budget.
3
In the long run, the Congressional Budget Office (CBO) predicts discretionary spending will continue to decline relative to the federal budget and the economy overall as mandatory spending continues its growth. This suggests federal R&D activities may also continue to decline relative to other economic activity even as R&D dollars grow in absolute terms.
Major Recent Trends In FY 2020, federal R&D reached an estimated $164 billion, shown in Figure 4. This estimate comes with three caveats. First, it excludes emergency R&D for COVID-19. Over the course of 2020, NIH was provided with nearly $5 billion in emergency spending and other agencies with much more, though much of this was not for R&D. Official R&D estimates should be available sometime in 2021.
Second, the $164 billion figure corrects the official government figures from the FY 2021 budget request to include Department of Defense (DOD) R&D
Management Support funding, known as the “6.6” account in DOD parlance. This funding, worth roughly $7 billion to $9 billion a year, was excluded from the official figures, but is included in AAAS estimates in accord with past practice,
-25%
-20%
-15%
-10%
-5%
0%
5%
10%
15%
20%
25%
30%
2010 2011 2012 2013 2014 2015 2016 2017 2018 2019 2020 2021
Figure 3: Select Agency Funding Since FY 2010Percent change in discretionary budgets from FY10 levels, constant dollars
Discretionary Caps NASA NSF
DOE Science DOD Basic Science NIH
DOE Tech Programs* USDA R&D Programs
*Including nuclear, fossil, grid, renewables, efficiency, ARPA-E.Excludes COVID-19 emergency spending. Based on analysis of OMB, agency and appropriations data. © 2021 AAAS
DOD$72.7
HHS$40.8
DOE$19.2
NASA$14.1
NSF$6.8
USDA$2.9
Commerce$1.9 All Other
$5.7
Figure 4: R&D by Agency, FY 2020Budget authority in billions of dollars
Does not include emergency COVID-19 R&D.Source: OMB and agency R&D data and documents. R&D
includes conduct of R&D and R&D facilities. © 2021 AAAS
Total R&D = $164.1 billion

4
National Center for Science and Engineering Statistics methodology, and the Office of Management and Budget (OMB) A-11 budget preparation guidance.
Third, OMB adopted a new, narrower definition of “development” in FY 2017 and beyond. The result is that the amount of spending labeled “R&D” has been reduced by approximately $30 billion per year, mostly from DOD.9 This accounting change is visible in the sharp drop in Figure 5.
The past 20 years of federal R&D appropriations can be divided into four rough phases. In the first phase, from FY 1997 to FY 2004, federal R&D funding increased rapidly, by 44%. This rise was driven partly by increased defense R&D following the Sept. 11 attacks, but especially by the congressional effort to double the National Institutes of Health (NIH) budget. Certain other agencies like the National Science Foundation (NSF) and the Office of Science within the Department of Energy (DOE) also experienced substantial funding growth in this period.
The second phase ran from FY 2004 to about FY 2010 and mostly represents a plateau. Defense R&D remained elevated, while the picture was more complicated for nondefense agencies. Funding did increase for some, including NSF, DOE Office of Science, and the National Institute of Standards and Technology (NIST), all of which were prioritized for doubling by the Bush administration and the America COMPETES legislation.10 But this was offset by erosion of the NIH budget as appropriations failed to keep pace with inflation. The end of this second phase was punctuated by the generous but one-time funding boost in the American Recovery and Reinvestment Act (ARRA), which added over $18 billion in nominal R&D dollars in FY 2009, along with transiently generous annual appropriations in FY 2009 and FY 2010.
After FY 2010, funding entered a brief but jagged third phase of decline. As mentioned above, discretionary spending was cut dramatically over the FY 2010 to FY 2013 period, partly in reaction to the large deficits incurred during the financial
$0
$50
$100
$150
$200
1976 1979 1982 1985 1988 1991 1994 1997 2000 2003 2006 2009 2012 2015 2018
Figure 5: Federal R&D Budget AuthorityBillions of constant 2020 dollars, including 2009 Recovery Act
Total R&D Nondefense R&D Defense R&D*
*Per OMB, beginning in FY 2017, late-stage development, testing and evaluation, mostly in Defense, no longer count as R&D. Does not yet include COVID-19 emergency R&D. Based on OMB, agency, appropriations data. | © 2021 AAAS

5
crisis. These cuts, concurrent with a drawdown in war funding, resulted in substantially reduced R&D spending within defense and nondefense agencies, notwithstanding the Obama administration’s preferences. Note that accounting changes within DOE and NASA in those years make nondefense R&D appear to follow a steadier path than it did in reality when agency budgets were being cut as seen in Figure 3.
Phase four is the most recent, with multiple deals to raise discretionary spending underlying multiple large increases for science agency budgets, often with bipartisan support. These increases continued into the Trump years with a White House hostile to science funding. For instance, R&D appropriations in FY 2018 were the most generous in a decade and a half.11
Types of R&D R&D budget data is recorded by federal agencies in five categories: basic research, applied research, development, facilities and equipment (the latter two are frequently combined as “R&D plant”). The definitions for these activities are
provided in OMB Circular A-11 (see box above).12
There will always be a level of subjectivity to these classifications, and definitions can change over time, as with the recent narrowing of “development” cited above.
Different parts of the federal R&D enterprise tend to focus on different types of R&D. Generally, basic and applied research is funded by nondefense agencies like NIH or NSF, which are
OMB’s R&D Definitions (Abbreviated) “Basic research is defined as experimental or theoretical work undertaken primarily to acquire new knowledge of the underlying foundations of phenomena and observable facts. Basic research may include activities with broad or general applications in mind.”
“Applied research is defined as original investigation undertaken in order to acquire new knowledge. Applied research is, however, directed primarily towards a specific practical aim or objective.”
“Experimental development is defined as creative and systematic work, drawing on knowledge gained from research and practical experience, which is directed at producing new products or processes or improving existing products or processes.”
R&D facilities spending includes “Construction of facilities that are necessary for the execution of an R&D program. This may include land, major fixed equipment, and supporting infrastructure such as a sewer line, or housing at a remote location. Many laboratory buildings will include a mixture of R&D facilities and office space.”
R&D equipment spending includes “Acquisition, design, or production of major movable equipment, such as mass spectrometers, research vessels, DNA sequencers, and other movable major instruments for use in R&D activities.”
Adapted from OMB Circular A-11, Sec. 84
$0
$10
$20
$30
$40
$50
$60
$70
$80
$90
Defense Nondefense
Figure 6: R&D by Type, FY 2020Budget authority in billions of dollars
Facilities & Equip. Development
Applied Basic
Source: OMB and agency R&D data. © 2021 AAAS
There will always be a level of subjectivity to federal classifications, and definitions can change over time.

6
focused on fundamental or exploratory knowledge. Development is mostly funded by DOD as part of its technology acquisition pipeline (Figure 6). There are exceptions to this division, however. For instance, NASA funds technology development for exploration while DOD maintains a sizable research enterprise through military labs, extramural research and agencies like the Defense Advanced Research Projects Agency (DARPA).
Federal R&D by Function Budget functions are topical spending categories maintained by OMB. Most R&D spending is concentrated in three functions: Defense; Health; and General Science, Space, and Technology (some analyses, including AAAS data, split this function into two subfunctions, “General Science” and “Space”). In addition to the named functions in Figure 7, R&D in the Transportation, Commerce, Veterans and Justice functions is also substantial.
R&D by function can indicate shifting national priorities. Figure 8, drawn from OMB data, shows such changes since 1953. During the Space Race, Space R&D
soared and then contracted following Apollo. Later, the energy crises of the 1970s prompted a temporary increase in energy R&D. More recently, the health concerns of a prosperous but aging population have made health R&D a major focus. The General Science function, which mostly covers discovery science programs, has seen fairly steady increases over the decades.
$0
$10
$20
$30
$40
$50
$60
$70
$80
1953 1959 1965 1971 1977 1983 1989 1995 2001 2007 2013 2019
Health
Space
Energy
Other
NaturalResources
GeneralScience
Based on historical tables in Budget of the U.S. Government FY 2021.Some Energy programs shifted to General Science beginning in FY 1998. © 2021 AAAS
Figure 8: Trends in Nondefense R&D by FunctionOutlays for the conduct of R&D, billions of constant FY 2020 dollars
Defense$80.5
Health$40.7
Space$13.5
General Sci$13.7
Energy$4.6
Environ$2.8
Ag$2.6
Other$5.6
Figure 7: R&D by FunctionFY 2020 budget authority in billions of dollars
Based on OMB and agency R&D data. © 2021 AAAS
7
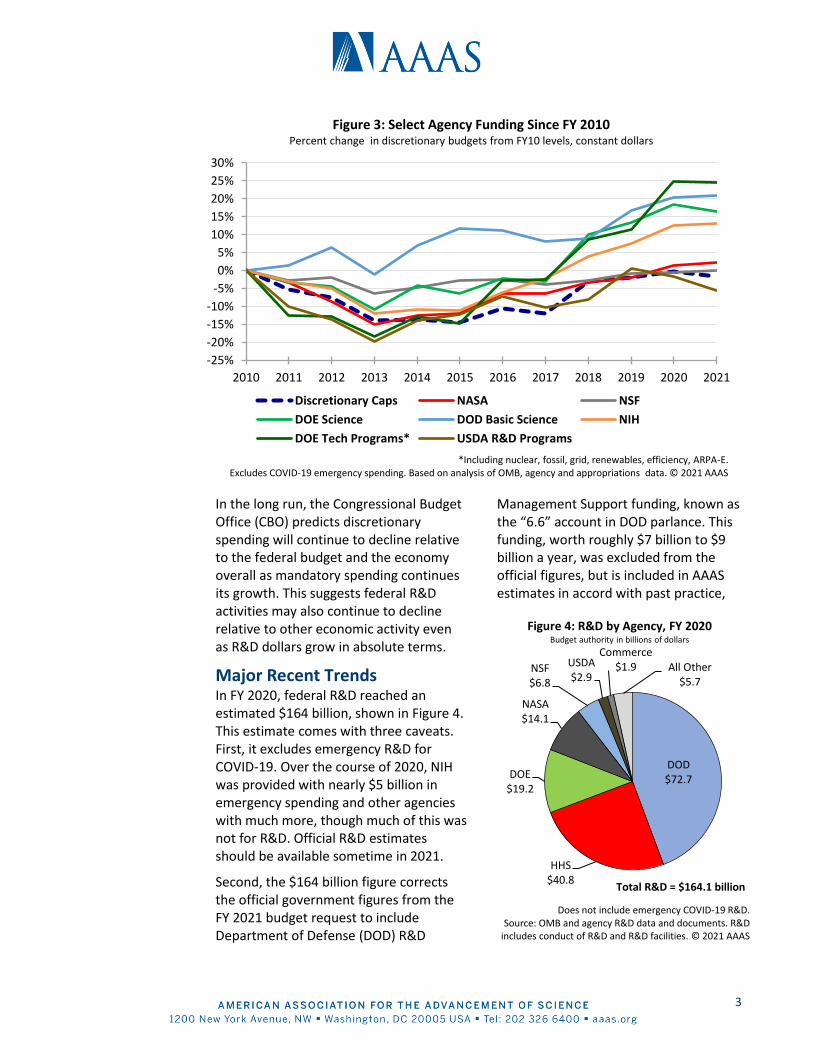
As Share of the U.S. Economy: Development Declining, Research Steady R&D as a share of gross domestic product (GDP), or “R&D intensity,” is not a definitive metric but is nevertheless a common way to view a nation’s relative innovative capacity. Figure 9 uses R&D budget authority data compiled by AAAS and GDP data from OMB to show federal R&D as a share of the U.S. economy.
Clearly, the overall trend has been downward. As of FY 2016 – before the revised definition of “development” took effect – the federal R&D budget had
declined to an estimated 0.8% of GDP, well below previous levels. This decline is likely to continue as discretionary spending shrinks.
As can be seen, however, research spending has remained far steadier as a share of GDP, likely due in part to a more stable nondefense budget, which is the primary source of basic and applied research dollars, and persistent bipartisan support for basic research agencies.
While federal R&D intensity relative to GDP has come down, these sums have been offset by increasing contributions from industry, universities, state
0.0%
0.2%
0.4%
0.6%
0.8%
1.0%
1.2%
1.4%
1976 1980 1984 1988 1992 1996 2000 2004 2008 2012 2016 2020
Figure 9: Federal R&D Budget Authority as a Share of GDP
Total R&D
Development
Research
Facilities
AAAS estimates based on historical agency and OMB budget data and appropriations.Excludes COVID-19 emergency R&D. | © 2021 AAAS
1953 1959 1965 1971 1977 1983 1989 1995 2001 2007 2013
0.0%
0.5%
1.0%
1.5%
2.0%
2.5%
3.0%
Figure 10: R&D as a Share of GDP by Funder
Total
Industry
Federal
Other
Based on National Science Foundation National Patterns of R&D Resources series. © 2021 AAAS
Research spending has remained far steadier as a share of GDP, likely due in part to a more stable nondefense budget.

8
governments and private nonprofit foundations over the past 40 years. Industry now accounts for the vast majority of U.S. R&D, as shown in Figure 10 (previous page).
Interestingly, the national R&D mix hasn’t enormously changed even as government and industry funding has flipped. Basic research, applied research and development have all held fairly steady in their relative shares of the national mix, even as R&D investment has grown overall (see Figure 11 above).
If one revisits Figure 9, it’s not difficult to understand why. As mentioned above, federal research spending has remained fairly steady in light of declines in development. This has been supplemented by increased research investments from industrial and other sources, especially universities (Figure 12, below). Meanwhile, industrial spending on development – the primary component of industrial R&D – has soared. The result has been a fairly steady overall mix.
0.0%
0.5%
1.0%
1.5%
2.0%
2.5%
3.0%
1953 1959 1965 1971 1977 1983 1989 1995 2001 2007 2013
Figure 11: U.S. R&D From All Sources as Share of GDP by Type
Total R&D
Development
AppliedResearch
BasicResearch
Based on National Science Foundation National Patterns of R&D Resources series. © 2021 AAAS
1953 1959 1965 1971 1977 1983 1989 1995 2001 2007 2013
0.0%
0.2%
0.4%
0.6%
0.8%
1.0%
1.2%
Figure 12: Research as a Share of GDP by Funder
TotalResearch
FederalResearch
IndustryResearch
Other
Based on National Science Foundation National Patterns of R&D Resources series. © 2021 AAAS

9
R&D Performers: Universities Prioritized Federally funded R&D is conducted by a range of performers. Figure 13 shows the distribution by performer as of FY 2018, the most recent year of data available from the National Science Foundation’s National Patterns of R&D Resources series.13 Note this data series includes basic research, applied research and development, but not R&D plant.
As can be seen, government labs (intramural) and universities accounted for similar shares of the federally funded R&D portfolio at 29% each. Industry R&D made up 18%, while federally funded R&D centers (FFRDCs), which refers to government-owned, contractor-operated labs, accounted for 16%. The “Other” category is primarily nonprofit institutes.
The NCSES Federal Funds for R&D survey of federal agencies reports R&D plant funding of $3.9 billion in FY 2018,14 with about a third going to intramural performance and acquisition, and another third going to FFRDCs.
While most agencies offer a mixed funding profile, they also exhibit tendencies regarding performers. Much DOD R&D reflects industrial contractors that handle its development work, though DOD also maintains an extensive
Intramural $33.4
Industry$21.2
Univs/ Colleges
$33.7
FFRDCs* $10.5
Other$8.0
Figure 13: Federal R&D byPerformer, FY 2018
spending in billions
*Federally Funded R&D Centers.Source: National Science Foundation National Patterns of
R&D Resources data series. © 2021 AAAS
1953 1959 1965 1971 1977 1983 1989 1995 2001 2007 2013
0.0%
0.2%
0.4%
0.6%
0.8%
1.0%
1.2%
Figure 14: Federal R&D as a Share of GDP by Performer
Intramural Industry Universities FFRDCs All Other
Source: National Science Foundation National Patterns of R&D Resources series. © 2021 AAAS
The only performers of federally funded R&D to have exhibited collective long-run growth relative to GDP are the nation’s universities, mostly through basic and applied research expenditures. University self-funding of R&D is also a growing trend.
10
intramural enterprise and funds substantial university research, behind only NIH and NSF. NIH maintains significant intramural research capacity, though most of the agency’s funding is extramural research. DOE (including the National Nuclear Security Administration or NNSA) channels somewhat more than half of its R&D through FFRDCs, while NASA’s largest expenditures are for industrial performers of R&D.
From a historical perspective, federal R&D performed by industry saw significant increases around the time of the Space Race, then experienced a smaller spike during the Reagan defense R&D buildup in the 1980s (see Figure 14, which presents R&D performer data as a share of U.S. GDP). Federal intramural R&D has seen a more gradual decline since the Space Race.
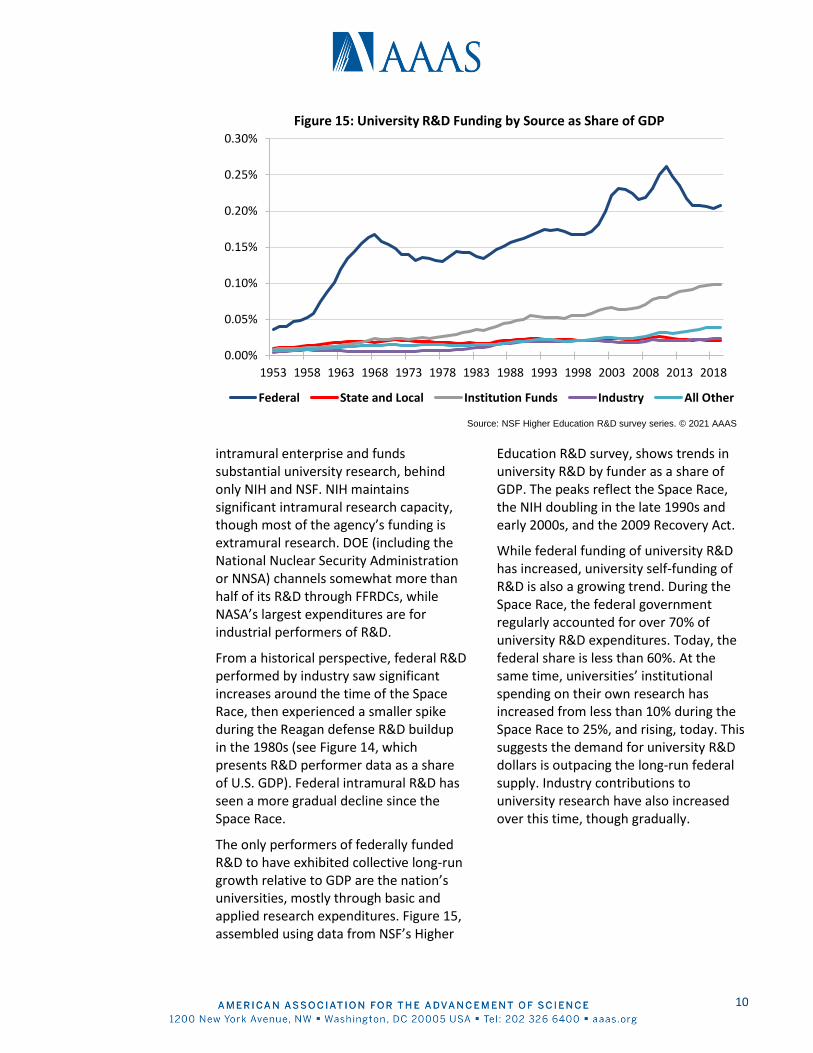
The only performers of federally funded R&D to have exhibited collective long-run growth relative to GDP are the nation’s universities, mostly through basic and applied research expenditures. Figure 15, assembled using data from NSF’s Higher
Education R&D survey, shows trends in university R&D by funder as a share of GDP. The peaks reflect the Space Race, the NIH doubling in the late 1990s and early 2000s, and the 2009 Recovery Act.
While federal funding of university R&D has increased, university self-funding of R&D is also a growing trend. During the Space Race, the federal government regularly accounted for over 70% of university R&D expenditures. Today, the federal share is less than 60%. At the same time, universities’ institutional spending on their own research has increased from less than 10% during the Space Race to 25%, and rising, today. This suggests the demand for university R&D dollars is outpacing the long-run federal supply. Industry contributions to university research have also increased over this time, though gradually.
1953 1958 1963 1968 1973 1978 1983 1988 1993 1998 2003 2008 2013 2018
0.00%
0.05%
0.10%
0.15%
0.20%
0.25%
0.30%
Figure 15: University R&D Funding by Source as Share of GDP
Federal State and Local Institution Funds Industry All Other
Source: NSF Higher Education R&D survey series. © 2021 AAAS

11
Global Landscape: R&D Shifting East While this review is primarily focused on U.S. trends, it is worth bearing the international context in mind. Total worldwide R&D has roughly tripled since 2000, surpassing $2 trillion in 2018.15 While the United States remains the global leader, China continues to encroach (see Figure 17 below). According to Organisation for Economic Cooperation and Development (OECD) data, the United States accounted for 39% of global R&D in 2000 but less than 29% in 2018. The EU showed a somewhat smaller decline, from 29% to 22%. Meanwhile, China’s share increased from 4% to 24%. Smaller economies including Korea, Taiwan and Israel have also achieved aggressive R&D growth (see Figure 16, above).
Regarding total R&D relative to gross domestic product, the United States has slipped to 10th over the past several years. Since 1995, the R&D intensity of Korea, Israel, Germany, Taiwan and other countries has surpassed that of the United States. In spite of China’s aggressive R&D growth, it has not yet caught up to advanced countries in R&D intensity, though it is gaining. Chinese
R&D now stands at 2.14% of Chinese GDP, while the U.S. stands at 2.83% and world leader Israel at 4.94%.
The U.S. ranking has similarly declined when restricting R&D expenditures to only those financed by government. As of 2017, the United States ranked 14th globally in publicly funded R&D, per OECD.
For additional international information, see the recent AAAS R&D
competitiveness snapshot.16
0% 5% 10% 15% 20%
France
Japan
U.K.
EU-28
Germany
United States
Israel
Taiwan
Korea
China
Figure 16: Annual Growth in Total R&D Since 1995
Including public and private sources. Based on OECD S&T Indicators data, October 2020. © AAAS
$0
$100,000
$200,000
$300,000
$400,000
$500,000
$600,000
1995 1997 1999 2001 2003 2005 2007 2009 2011 2013 2015 2017
Figure 17: World R&D by Country / RegionMillions of constant dollars adjusted for purchasing power parity
USA
China
EU-28
OtherWorld
Japan
Includes public and private sources. OECD Main S&T Indicators, October 2020. © 2021 AAAS
Regarding total R&D relative to gross domestic product, the United States has slipped to 10th over the past several years.

12
1 Varma, R. (2000). Changing Research Cultures in U.S. Industry. Science, Technology, & Human Values, 25(4), 395-416. https://doi.org/10.1177/016224390002500401 2 Czarnitzki, D., Hottenrott, H., & Thorwarth, S. (2010). Industrial research versus development investment: the implications of financial constraints. Cambridge Journal of Economics, 35(3), 527-544. https://doi.org/10.1093/cje/beq038 3 Arora, A., Belenzon, S., & Patacconi, A. (2017). The decline of science in corporate R&D. Strategic Management Journal, 39(1), 3-32. https://doi.org/10.1002/smj.2693 4 National Research Council Furthering America’s Research Enterprise. R.F. Celeste, A. Griswold, and M.L. Straf (Eds.), National Academies Press, 2014. 5 Hourihan, M., “Public Research Investments and Patenting: An Evidence Review,” AAAS, May 15, 2020, https://www.aaas.org/news/public-research-investments-and-patenting-evidence-review 6 Cohen, W.M., Nelson, R.R., & Walsh, J.P. (2002). Links and Impacts: The Influence of Public Research on Industrial R&D. Management Science, 48(1), 1-23. https://doi.org/10.1287/mnsc.48.1.1.14273 7 Hourihan, M., “The Federal Government is Tweaking What Counts as R&D: Q&A,” AAAS, June 13, 2018, https://www.aaas.org/news/federal-government-tweaking-what-counts-rd-qa 8 Hourihan, M., “The Budget Control Act May Have Cost Over $200 Billion in Federal R&D,” AAAS, January 19, 2021, https://www.aaas.org/news/budget-control-act-may-have-cost-over-200-billion-federal-rd
9 Hourihan, M., “The Federal Government is Tweaking What Counts as R&D: Q&A,” AAAS, June 13, 2018, https://www.aaas.org/news/federal-government-tweaking-what-counts-rd-qa 10 The America COMPETES Acts of 2007 and 2010 sought to double the budgets of NSF, NIST, and DOE’s Office of Science. See Congressional Research Service overview: https://crsreports.congress.gov/product/pdf/R/R43880/13 11 Hourihan, M., & Parkes, D. "Omnibus Would Provide Largest Research Increase in Nearly a Decade," AAAS, March 21, 2018, https://www.aaas.org/news/omnibus-would-provide-largest-research-increase-nearly-decade 12 Available at https://www.whitehouse.gov/omb/information-for-agencies/circulars/ 13 National Science Foundation, National Center for Science and Engineering Statistics 2019. National Patterns of R&D Resources: 2017-18 Data Update. NSF 20-307. Alexandria, VA. https://ncses.nsf.gov/pubs/nsf20307 14 National Science Foundation, National Center for Science and Engineering Statistics, Survey of Federal Funds for Research and Development, Fiscal Years 2017-18. https://ncsesdata.nsf.gov/fedfunds 15 OECD Main Science and Technology Indicators, 2018, http://www.oecd.org/sti/msti.htm 16 Hourihan, M., “A Snapshot of U.S. R&D Competitiveness: 2020 Update,” AAAS, October 22, 2020, https://www.aaas.org/news/snapshot-us-rd-competitiveness-2020-update
![Primer [budget 2013]](https://static.fdocuments.in/doc/165x107/5551be52b4c905bb708b5467/primer-budget-2013.jpg)