A model for fibrous illite nucleation and growth in...
27
A model for fibrous illite nucleation and growth in sandstones Robert H. Lander and Linda M. Bonnell ABSTRACT We have developed a model for the formation of fibrous illite in sandstones where kaolinite is a primary reactant and po- tassium is derived from in-situ K-feldspar grain dissolution or imported into the model reference frame. Illite fiber nuclea- tion and growth are modeled using Arrhenius expressions that consider saturation state in addition to temperature and time. Nucleation occurs on pore walls, and muscovite and detrital illite may be defined as energetically favorable substrates. The model is integrated with other Touchstone™ models to ac- count for the influence of other diagenetic processes on sur- face area and reactant volumes and to provide input for per- meability simulations. We evaluated the illite model performance on two data sets: (1) Jurassic quartzose samples from offshore mid-Norway with maximum temperatures ranging from 108 to 173°C (226 to 343°F) and (2) Miocene lithic samples from offshore South- east Asia that have maximum temperatures ranging from 157 to 182°C (315 to 360°F). The model matches measured abun- dances of illite, kaolinite, and K-feldspar in both data sets using identical kinetic parameters. Predicted K-Ar ages are consis- tent with available data given uncertainties associated with detrital contaminants. Although no illite particle-size data are available from the analyzed samples, modeled crystallite thick- nesses from the Norway data set are comparable to published measurements of 0.004 to 0.012 mm from North Sea samples with similar temperature histories. AUTHORS Robert H. Lander Geocosm LLC, 3311 San Mateo Drive, Austin, Texas 78738; [email protected] Rob Lander develops diagenetic models for Geocosm LLC. He obtained his Ph.D. in geology from the University of Illinois in 1991, was a research geologist at Exxon Production Research from 1991 to 1993, and worked for Rogaland Research and Geologica AS from 1993 to 2000. He is also a research fellow at the Bureau of Economic Geology. Linda M. Bonnell Geocosm LLC, 3311 San Mateo Drive, Austin, Texas 78738; [email protected] Linda Bonnell develops diagenetic models and conducts reservoir quality prediction studies for Geocosm LLC. She received her Ph.D. in geology from the University of Illinois in 1990 and subsequently was a research scientist at Washington University, Rice University, Roga- land Research, and Geologica AS. She is also a research fellow at the Bureau of Economic Ge- ology. Linda was an AAPG Distinguished Lecturer in 2003–2004. ACKNOWLEDGEMENTS This work was funded by Geocosm’s Consortium for Quantitative Prediction of Sandstone Reser- voir Quality (RQC), which is currently supported by the State of Alaska Department of Natural Resources, Anadarko, BHP-Billiton, BP, Chevron, Cobalt International, ConocoPhillips, Devon, Eni, ExxonMobil, Hess, Instituto Mexicano del Petróleo, Maersk, Petrobras, Saudi Aramco, Shell, Statoil, Total, and Woodside. We thank Thomas Moore, Arthur Trevena, Reed Glasmann, and Marek Kacewicz for providing the natural data sets. Richard Larese, Reed Glasmann, and Arthur Trevena, in particular, provided us with invaluable insights regarding these data sets and controls on illitization in general. Reviews by David Awwiller, Stephen Franks, and Olav Walderhaug helped us improve the article. The AAPG Editor thanks the following reviewers for their work on this article: David N. Awwiller, Stephen G. Franks, and Olav Walderhaug. Copyright ©2010. The American Association of Petroleum Geologists. All rights reserved. Manuscript received July 11, 2009; provisional acceptance October 26, 2009; revised manuscript received March 8, 2010; final acceptance April 21, 2010. DOI:10.1306/04211009121 AAPG Bulletin, v. 94, no. 8 (August 2010), pp. 1161 – 1187 1161
Transcript of A model for fibrous illite nucleation and growth in...

AUTHORS
Robert H. Lander � Geocosm LLC, 3311San Mateo Drive, Austin, Texas 78738;[email protected]
Rob Lander develops diagenetic models forGeocosm LLC. He obtained his Ph.D. in geologyfrom the University of Illinois in 1991, was a
A model for fibrous illitenucleation and growthin sandstonesRobert H. Lander and Linda M. Bonnell
research geologist at Exxon Production Researchfrom 1991 to 1993, and worked for RogalandResearch and Geologica AS from 1993 to 2000.He is also a research fellow at the Bureau ofEconomic Geology.
Linda M. Bonnell � Geocosm LLC, 3311San Mateo Drive, Austin, Texas 78738;[email protected]
Linda Bonnell develops diagenetic models andconducts reservoir quality prediction studiesfor Geocosm LLC. She received her Ph.D. ingeology from the University of Illinois in 1990and subsequently was a research scientist atWashington University, Rice University, Roga-land Research, and Geologica AS. She is also aresearch fellow at the Bureau of Economic Ge-ology. Linda was an AAPG Distinguished Lecturerin 2003–2004.
ACKNOWLEDGEMENTS
This work was funded by Geocosm’s Consortiumfor Quantitative Prediction of Sandstone Reser-voir Quality (RQC), which is currently supportedby the State of Alaska Department of NaturalResources, Anadarko, BHP-Billiton, BP, Chevron,Cobalt International, ConocoPhillips, Devon,Eni, ExxonMobil, Hess, Instituto Mexicano delPetróleo, Maersk, Petrobras, Saudi Aramco,Shell, Statoil, Total, and Woodside. We thankThomas Moore, Arthur Trevena, Reed Glasmann,and Marek Kacewicz for providing the naturaldata sets. Richard Larese, Reed Glasmann, and
ABSTRACT
We have developed a model for the formation of fibrous illitein sandstones where kaolinite is a primary reactant and po-tassium is derived from in-situ K-feldspar grain dissolution orimported into the model reference frame. Illite fiber nuclea-tion and growth are modeled using Arrhenius expressions thatconsider saturation state in addition to temperature and time.Nucleation occurs on pore walls, and muscovite and detritalillite may be defined as energetically favorable substrates. Themodel is integrated with other Touchstone™ models to ac-count for the influence of other diagenetic processes on sur-face area and reactant volumes and to provide input for per-meability simulations.
We evaluated the illite model performance on two datasets: (1) Jurassic quartzose samples from offshore mid-Norwaywithmaximum temperatures ranging from 108 to 173°C (226to 343°F) and (2) Miocene lithic samples from offshore South-east Asia that have maximum temperatures ranging from 157to 182°C (315 to 360°F). The model matches measured abun-dances of illite, kaolinite, and K-feldspar in both data sets usingidentical kinetic parameters. Predicted K-Ar ages are consis-tent with available data given uncertainties associated withdetrital contaminants. Although no illite particle-size data areavailable from the analyzed samples, modeled crystallite thick-nesses from the Norway data set are comparable to publishedmeasurements of 0.004 to 0.012 mm from North Sea sampleswith similar temperature histories.
Arthur Trevena, in particular, provided us withinvaluable insights regarding these data sets andcontrols on illitization in general. Reviews byDavid Awwiller, Stephen Franks, and OlavWalderhaug helped us improve the article.The AAPG Editor thanks the following reviewersfor their work on this article: David N. Awwiller,Stephen G. Franks, and Olav Walderhaug.
Copyright ©2010. The American Association of Petroleum Geologists. All rights reserved.
Manuscript received July 11, 2009; provisional acceptance October 26, 2009; revised manuscript receivedMarch 8, 2010; final acceptance April 21, 2010.DOI:10.1306/04211009121
AAPG Bulletin, v. 94, no. 8 (August 2010), pp. 1161– 1187 1161

INTRODUCTION
Accurate predictive models for the occurrence andproperties of fibrous illite would be useful for hy-drocarbon exploration and production given thatillite can have a severe detrimental effect on res-ervoir properties. In particular, the high surfacearea, pore-bridging texture, and significant associ-ated microporosity of illite fibers (Figure 1) actto reduce permeability while increasing irreduc-ible water saturation and capillary entry pressure(McHardy et al., 1982; Kantorowicz, 1984, 1990;Bjørlykke et al., 1986, 1992). Illite fibers gener-ally have thicknesses, widths, and lengths that areon the order of 0.05, 0.5, and 50 mm, respectively(Figure 1) (Güven et al., 1980; Nagy, 1994; Lansonet al., 1996, 2002). The resulting specific surface
1162 Fibrous Illite Model
areas (areas per solid volume) are at least two ordersof magnitude greater than cements such as calciteor quartz that are composed of larger, blockiercrystals (Panda and Lake, 1995). Illite fibers tendto grow as independent strands that extend wellinto the pore space of host sandstones (Figure 1)where they may significantly increase flow-pathtortuosity (Stalder, 1973; Pallatt et al., 1984; Cocker,1986; Panda and Lake, 1995). Because illite fibersfrequently extend farther into pores than otherauthigenic clays, they tend to cause larger perme-ability reductions for a given bulk volume. More-over, the higher microporosity of fibrous illitecompared to most other authigenic clays (Nadeauand Hurst, 1991) means that a comparable solidvolume will invade a larger proportion of macro-pore volume.
Figure 1. Scanning electron microscope photomicrographs illustrating the texture and morphology of fibrous illite in sandstone.(A) Illite fibers growing into an intergranular pore. The white dotted outlines indicate the zoomed-in views shown in panels B and C.(B) Illite fibers typically show a range in sizes, suggesting that the crystallites did not all nucleate simultaneously. (C) Illite fibers appearto have nucleated on authigenic quartz cement. (D) Illite fibers growing into a moldic pore that likely formed in response to dissolutionof a feldspar grain.

Fibrous illite appears to form mainly by reac-tion of kaolin minerals and K+. Potassium may bederived from local K-feldspar dissolution (e.g.,Bjørlykke et al., 1986, 1992; Bjørkum andGjelsvik,1988;Chuhan et al., 2001; Franks andZwingmann,this issue) or external sources such as migratingfluids (e.g., Robinson et al., 1993; Lanson et al.,1996; De Ros, 1998; Zwingmann et al., 1999) ordissolved solutes from adjacent shales (Gaupp et al.,1993; Berger et al., 1997; Thyne et al., 2001; Claueret al., 2008). The reaction pathway leading to fi-brous illite seems to require higher thermal ex-posures compared to illite that forms by smectiteillitization (Lander et al., 1990; Stroker and Harris,2009). The rate of the reaction leading to fibrousillite growth, once it begins, appears to be rapid.Oneline of evidence for this interpretation is the narrowpresent-day temperature range (120 to 140°C [248to 284°F]) from incipient to pervasive illitization inJurassic sandstones of the North Sea and Halten-banken (e.g., Bjørlykke et al., 1986, 1992, 1995;Ehrenberg and Nadeau, 1989; Glasmann, 1992;Ramm and Ryseth, 1996; Midtbø et al., 2000).
MODEL FORMULATION
The model simulates the following through geo-logic time: (1) the kinetics of illite crystal nuclea-tion and growth by considering saturation state,temperature, and the properties and areas of nu-cleation substrates; (2) reactant (kaolin and, op-tionally,K-feldspar) andproduct (illite cement, illitereplacement, and K-feldspar dissolution porosity)volumes; (3) the dimensions, volumes, and areas forthe illite crystallite population; and (4) the K-Ar agefor the authigenic illite with explicit considerationmade for the effect of detrital contaminants.
Illite Saturation State
The kinetics of crystal nucleation and growth bothdepend strongly upon saturation state (Lasaga,1998). Variations in the saturation state of illitewithin reservoir sandstones are mainly determinedby the activities of SiO2(aq), Al+3, K+, and H+
(Bjørkum and Gjelsvik, 1988; Aagaard et al., 1992;Bjørlykke et al., 1995). In geologic settings wherefibrous illite is actively forming, the activities ofthese species are likely to be controlled by mineralbuffers present within the host sandstone (Hutcheonet al., 1993; Bazin et al., 1997a, b; Berger et al., 1997;Palandri and Reed, 2001). In formation watersabove 100°C (212°F), SiO2(aq) concentrations tendto be at or near expected equilibrium values forquartz (Kharaka et al., 1985; Bjørlykke et al., 1995;Bazin et al., 1997a, b; Palandri and Reed, 2001).Kaolinite acts as an Al buffer and, like quartz, alsobuffers pH (Bazin et al., 1997a). Bazin et al. (1997b)argued that it is reasonable to assume that K-feldspar, when present, buffers K+ activities in theabsence of externally derived fluids.
We determined the likely saturation state ofillite as a function of temperature in the presenceof the quartz, kaolinite, and K-feldspar mineral buf-fers. The first step in this analysis is to calculateequilibrium activities for SiO2(aq), Al+3, and K+ asa function of temperature over the range of inter-est for illite formation in reservoir sandstones (weused Geochemist’s Workbench™ version 6.0 forthese calculations; Bethke, 1996). Although the sil-ica activity for the buffered system increases withtemperature, the opposite is true for dissolved alu-minum (Figure 2A). Muscovite can be considereda thermodynamically stable proxy for illite. Whenthe system is in equilibrium with quartz, the K-feldspar and kaolinite stability fields will be sepa-rated by the muscovite field over the full range oftemperatures where illitization is likely to occur(Figure 2B) (Aagaard et al., 1992). Thus, there willbe a thermodynamic drive for illite to form in thepresence of K-feldspar and kaolinite in sandstonereservoirs. The next step in the analysis involvesthe determination of the equilibrium constant formuscovite with temperature (Figure 2C). The finalstep is to estimate the muscovite supersaturationstate given its equilibrium constant and the activ-ities of SiO2(aq), Al
+3, and K+. Our calculations in-dicate that muscovite supersaturation in the pres-ence of the mineral buffers increases systematicallywith temperature (Figure 2C). The magnitude ofthis increase is about a factor of 1.5 as temperatureincreases from 100 to 200°C (212 to 392°F).
Lander and Bonnell 1163

Several workers suggest that illite formation inRotliegende sandstones may have been influencedby externally derived evaporitic brines (Rossel, 1982;Macchi et al., 1990; Lanson et al., 1996). Brineswith elevated K+ activities could induce faster rates
1164 Fibrous Illite Model
of illite formation by increasing illite supersatura-tion (Lanson et al., 1996). Consequently, we haveformulated the model so that K+ activities maybe defined explicitly as an alternative to assumingcontrol by a K-feldspar buffer. In such cases, the
Figure 2. Calculated fluid compositionsand extent of supersaturation for musco-vite (a proxy for illite) as a function oftemperature based on buffering by kaoli-nite, K-feldspar, and quartz. (A) Activitiesof Al+3, K+, and SiO2(aq). (B) Stabilityfields for muscovite, kaolinite, and K-feldspar assuming equilibrium with quartz.(C) Muscovite equilibrium constant (K)and supersaturation state (Q/K-1).

model still considers that the quartz and kaolinitebuffers control the SiO2(aq) and Al+3 activities whendetermining the muscovite saturation state. Themodel also assumes in this case that K-feldspar, ifpresent, is not a reactant. Thus, all Al in the fibrousillite is derived from kaolin and the system is fullyopen with respect to K.
Crystal Nucleation
Wilkinson and Haszeldine (2002a) argued that nu-cleation is the primary control on the occurrenceof fibrous illite cement in sandstones. Controlson crystallite nucleation, however, are the mostpoorly constrained aspect of kinetic models thatcould potentially be used to predict fibrous illitecharacteristics in sandstones because nucleationtheory remains in the developmental stage and isdifficult to test given that the nucleation processoccurs at the atomic scale (Lasaga, 1998).
Illite fibers, like most diagenetic phases in sand-stones, appear to form by heterogeneous nuclea-tion, where nuclei adhere to the surfaces of pre-existing solids because of the free energy benefitsassociated with the resulting lower surface area(Lasaga, 1998; Wilkinson and Haszeldine, 2002a).Experimentally grown illite fibers preferentiallynucleate on muscovite substrates when they arepresent but eventually will form in the absenceof such substrates (Chermak and Rimstidt, 1990).Little work has been done to date to rigorouslydocument the nature of nucleation substrates forillite fibers in natural sandstones. However, docu-mented examples of illite fibers nucleating onauthigenic kaolin exist (Środoń and Eberl, 1984;Lanson et al., 1996, 2002) as well as quartz ce-ment (Figure 1C) (Bonnell et al., 1999), and insome sandstones, illite pervasively covers all avail-able pore-wall surfaces irrespective of composition(Lanson et al., 1996; Bjørlykke, 1998). Franks andZwingmann (2010, this issue), in their study of il-lite in Permocarboniferous sandstones from SaudiArabia, find that although illite fibers nucleateon detrital quartz grain and noneuhedral quartzcement surfaces, they do not occur on euhedralquartz faces. The scanning electron microscope
(SEM) photomicrograph in Figure 1C, however,illustrates one instance where illite fibers appear tohave nucleated on euhedral quartz faces. Thus, itappears that although illitic or micaceous mate-rial is the favored nucleation substrate for fibrousillite, such substrates are not an absolute require-ment for nucleation. Furthermore, whereas theremight be a tendency for illite fibers to avoid nu-cleating on euhedral quartz faces, it is not impos-sible for them to do so.
The critical nucleus size is an essential con-cept for illite nucleation models (Wilkinson andHaszeldine, 2002a). The critical nucleus representsa maximum in the Gibbs free-energy change overa spectrum in atomic cluster size that ranges from afew atoms to many millions of atoms in a crystal.The cluster size of the critical nucleus denotes thepoint where the increase in thermodynamic stabi-lity that comes with additions of atoms promotescontinued crystal growth whereas removal of atomsincreases the potential for nucleus dissolution.The abundance of critical nuclei is given by Lasaga(1998) as
Nn ¼ N0e�GnRT ð1Þ
where N0 is the total number of moles in the me-dium (predominantly water), Gn is the energyneeded to form a critical nucleus consisting of nmolecular units, T is temperature, and R is thegas constant. By analogy with equation 1, we simu-late the number of potential illite nuclei that formduring a time interval Dt (s) as
N ¼ Ane�EanRT Dt
� �QK
� 1� �
SA ð2Þ
where An is a pre-exponential probability factor(nucleation sites/cm2/s), Ean is the activation en-ergy for illite fiber nucleation (kJ/mol), Q is thesaturation state for muscovite, K is the equilibriumconcentration for muscovite, and SA is the surfacearea available for nucleation. Increases in illitenuclei are thus expected with increasing super-saturation, temperature, and elapsed time. Increasednucleation rates could also result from lower activa-tion energies for nucleation on substrates made
Lander and Bonnell 1165

up of micaceous grains or detrital illitic clay com-pared to other surface types. Consequently, Eanand SA may be defined independently for mica-ceous and nonmicaceous substrates in the modelimplementation.
We allow crystallites to nucleate on intergran-ular pore walls (Figure 1B, C) as well as on sec-ondary pore walls associated with dissolution ofK-feldspar grains (Figure 1D). The intergranularsurface area is simulated through time by (Merinoet al., 1983; Lichtner, 1988; Canals and Meunier,1995; Lander et al., 2008)
Sig ¼ Vg6D
� �ff0
� �2=3
ð3Þ
where Vg is the grain volume in the model refer-ence frame (cm3), D is the mean grain diameter(cm), fo is the intergranular porosity at the timeof deposition (volume fraction), and f is the cur-rent intergranular porosity (volume fraction). Thefibrous illite model is integrated into Touchstone7.0, which simulates the intergranular porositythrough time based on the sandstone compactionstate as well as the volume of illite and other ce-ments. Touchstone also uses a proprietary algo-rithm to estimate the fo value based on mean grainsize, sorting, and detrital matrix abundance. Thenucleation area for moldic pores that form by K-feldspar grain dissolution is given by
Sksp ¼ fksp6D
� �ð4Þ
where fksp is the volume of K-feldspar grains thathave dissolved in the model reference frame (cm3).
As discussed above, the formation of criticalnuclei that could serve as the basis for new crystalsrequires a larger change in Gibbs free energy thanis needed for an existing crystal to continue togrow. Therefore, in the near vicinity of a growingcrystal, the degree of illite supersaturation will likelybe somewhat lower compared to otherwise barrenpore walls given that the crystal represents a sinkfor the dissolved reactants (Figure 3). This local-ized reduction in supersaturation would changethe local free energy, making new nuclei less
1166 Fibrous Illite Model
likely to form adjacent to growing crystals com-pared to crystal-free areas, and is analogous to whathas been proposed for the control on nucleationof carbonate concretions at larger length scales(Walderhaug and Bjørkum, 1998). As new nucleiform and grow, the proportion of pore walls thatare energetically favorable for creation of addi-tional nuclei declines in the absence of changes inother factors (Figure 3). We consider this effecton nucleation by defining a characteristic radiusof influence around each crystallite within whichno new nuclei are allowed to form. The size of thisarea is likely to be a function of the diffusion rate(Kittel and Kroemer, 1980).
Dc ¼ kT6pam
ð5Þ
whereDc is the diffusion coefficient, k is the Boltz-mann constant, a is the size of particles in solution,and m is the viscosity of the aqueous solution. Inrelatively dilute solutions, diffusion rates fromequation 5 double from 100 to 160°C (212 to320°F) thereby halving the expected radius of in-fluence. Thus, we define the exclusion radius fornucleation of new crystallites in terms of the valueat 100°C (212°F) and adjust the size using equa-tion 5. Simulations can effectively neglect this po-tential effect on nucleation, if desired, by using avanishingly small value for the radius of influence.
In a simulation, we define representative areasfor nucleation on three types of surfaces: (1) inter-granular pore walls that are made up of micaceousor illitic materials, (2) intergranular pore walls char-acterized by other materials, and (3) moldic poresafter K-feldspar dissolution. We adjust the areas ofthese surfaces with each time step to account forchanges in intergranular and secondary pore vol-umes. If illite reactants are present, we then de-termine the number of potential new nuclei foreach area type and distribute them randomly overthe currently available nucleation surface for thatarea. If a potential nucleus is located within theradius of influence of an existing crystal, however,it is not allowed to form.
An intriguing idea proposed byWilkinson andHaszeldine (2002a) for fibrous illite, and discussed

at greater length by Meunier (2006) for clay min-erals in general, is that as crystallites become pro-gressively larger, they eventually stop growing be-cause of high strain energies that arise due to the
cumulative influence of crystallographic defects.In such a scenario, it becomes energetically morefavorable for a new crystal to nucleate and growcompared to continued growth on a large crystal.
Figure 3. Schematic illustration of thepotential influence of growing illite fiberson the nucleation of new crystallites.(A) Prior to crystallite nucleation, a givenpore wall is likely to be exposed to fluidwith a uniform degree in the extent ofsupersaturation for illite. (B) Once a crys-tallite nucleates, it acts as a sink for illitesolutes thereby potentially reducing theextent of supersaturation in its immediatevicinity (gray region). (C) New crystalsmay be less likely to nucleate on the porewall in the near vicinity of growing crys-tallites due to the lower local extent ofillite supersaturation. (D) As additionalcrystallites form, the surface area that isamenable to the formation of new nucleideclines.
Lander and Bonnell 1167

Crystallite size distribution data for illite thatformed in hydrothermal zones (Bove et al., 2002)and by smectite illitization (Środoń et al., 2000),however, show log-normal distributions that havebeen interpreted to result from faster surface-areanormalized growth rates on larger crystallites com-pared to smaller counterparts (Eberl et al., 1998).This pattern of faster growth on larger crystals isthe opposite of that expected from a scenariowhere increasing strain energy with size results indiminished potential for continued growth of largercrystallites. Regrettably no quantitative size dis-tribution data are available to determine whetherfibrous illite crystals in sandstone reservoirs alsoshow log-normal size distributions. In light of theseconflicting views and the lack of illite fiber data, wehave elected not to incorporate any dependenciesbetween crystallite size and the rates of nucleationor growth in our current model implementation.
Crystal Growth, Reactant Dissolution, andMass Balance
We assume in our model formulation that the rateof growth of fibrous illite crystals is slower than thepotential rate of reactant dissolution and the po-tential rate of diffusion of dissolved reactants toillite growth sites. Consequently, the extent of re-actant dissolution for a modeled time interval isdetermined by the volume of illite that grows inthis precipitation rate limited system. These as-sumptions are consistent with the conclusions ofAltaner (1986), who showed that K-feldspar dis-solution rates are significantly faster than rates ofsmectite illitization.
We enforce the conservation of Al within themodeled frame of reference and permit illite togrow only when a source for both K and residualkaolin in the system exists. A simulation may beset to be either open or closed with respect to K. Ifthe system is closed with respect to K, then K isexclusively derived from K-feldspar, which alsoprovides an additional source of Al. For simulationsthat are defined as open with respect to K, we as-sume that in-situ K-feldspar dissolution does notcontribute to illite formation and that kaolin there-fore is the exclusive source of illite Al. Given that
1168 Fibrous Illite Model
quartz cementation is ubiquitous in illite-bearingsandstones (at least when quartz nucleation area isavailable), we assume that there is never a shortfallin the supply of the Si needed for illite formation.
Güven (2001) showed that illite fibers are elon-gated along the crystallographic a axis. Althoughillite fibers tend to taper somewhat along the aaxis (Lee, 1984; Nagy, 1994), we approximate thecrystallite shape as a rectangular volume definedby length, thickness, and width. We assume thatthe crystallite proportions remain constant as theygrow given that the growth surfaces for illite fibersare defined by euhedral crystal faces from earlygrowth stages, and Nagy (1994) found a width tothickness ratio of around 17 for illite fibers over arange in particle sizes. Assessing the ratio of fiberlength to width is more difficult. Dispersed par-ticles as analyzed by transmission electron micros-copy (TEM) and atomic force microscopy are likelybroken during the sample preparation procedureand therefore only provide a minimum constraint.Data from these methods and SEM images of in-situ illite, however, suggest that a value on the or-der of 100 is reasonable.
We determine the extent of growth along thelength of the crystal (a axis) over a time interval Dt(s) as follows.
Ia ¼ mr
� �Age
�EagRT Dt
� �QK
� 1� �
ð6Þ
where Ia is the increase in fiber length (cm), m isthe molecular mass of illite (g/mol), r is the den-sity of illite (g/cm3), Ag is a pre-exponential con-stant (mol/cm2/s), Eag is the activation energy forillite precipitation (kJ/mol), Q is the saturationstate for muscovite, and K is the equilibrium con-stant for muscovite. After determining the extentto which a crystal lengthens, we modify its thick-ness and width proportionally. The thicknesses ofthe crystallites, however, are restricted to integralvalues of 0.001 mm given that this represents oneunit cell for illite along the crystallographic c*direction. The crystallite volume (Vc) is deter-mined as
Vc ¼ LcWcTc ð7Þ

where Lc is the crystal length along the a axis, Wc
is the crystal width perpendicular to the a axis,and Tc is the crystallite thickness along the c* axis.As the crystal grows, the model keeps track of ex-cess thickness and adds a new illite unit cell to Tc
once the excess reaches 0.001 mm. By excludingthis excess thickness in the volume calculation,we obtain a more accurate illite K mass determi-nation for simulation of K-Ar ages. We calculatethe crystallite wetted surface area (Ac) by assum-ing that the entire surface of the crystallite is incontact with the pore fluid except for where it isattached to the pore wall.
Ac ¼ 2 LcWcð Þ þ 2 LcTcð Þ þ TcWc ð8Þ
Themodel tracks the dimensions, volume, andsurface area for each simulated crystallite in addi-tion to the nucleation time and the time at which itceased to have the potential to grow due to localporosity occlusion. A crystal is not permitted tocontinue to grow, even if reactants are available,when it is located in the part of the simulated nu-cleation area that has been removed due to po-rosity loss that arises from cementation or con-tinued compaction. In accordance with Nagy’s(1994) observations, we assume that no Ostwaldripening occurs for the crystallite population. Thus,once formed, a simulated illite fiber never dis-solves. This assumption appears to be reasonableover the temperature range experienced by manyhydrocarbon reservoirs. At temperatures in excessof approximately 150°C (302°F), however, thisassumption may not be valid because fibrous illitemay begin to dissolve while more equant crystal-lites form (Lanson et al., 2002) such that eventuallythe 2M1 polytype predominates over the 1M poly-type characteristic of fibrous illite (Hunziker, 1986;Jahren and Aagaard, 1989).
Illite K-Ar Ages
Much literature is concerned with the use of illiteK-Ar ages for inferring the timing and likely drivingforces for illite formation. Thus, K-Ar ages providean important potential means to test and calibratethe fibrous illite model. Consequently, the model
determines K-Ar ages by considering the volumefraction of illite that formed through the burialhistory of the sample. The K-Ar calculations aremade using the decay constants of Steiger andJäger (1977).
Although the illite K-Ar systematics are wellunderstood (Lee, 1984; Lee et al., 1985, 1989;Hamilton et al., 1989, 1992; Clauer andChaudhuri,1995), the interpretation of the meaning of illiteK-Ar ages is not so straightforward (e.g., Ehrenbergand Nadeau, 1989; Clauer et al., 1992; Matthewset al., 1994; Bjørlykke, 1998; Zwingmann et al.,1998; Pevear, 1999; Ylagan et al., 2000; Środońet al., 2002; Wilkinson and Haszeldine, 2002b;Meunier et al., 2004; Szczerba and Środoń, 2009).Two common assumptions in the analysis of il-lite fiber K-Ar ages are that (1) illite in the finestsize fraction represents the last formed illite and(2) the K-Ar age of this illite represents the time ofcessation of illite growth (Lee, 1984; Hamiltonet al., 1989). Two potential problems with theseassumptions exist. First, even if this fraction of theillite was the last to form, this does not necessarilymean that the growth duration was geologicallyinstantaneous. Thus, in the absence of contami-nants, the date reflects the volume-weighted averageof when the analyzed illite fibers grew (Hamiltonet al., 1989). Second, the extent towhich the smallestillite fraction actually represents the last formed illiteis unclear. Little is known about how the samplepreparation procedure impacts the in-situ particlesize distribution or if early formed small crystallitesthat stopped growing due to interference withother solids (including other illite fibers) may alsobe found within the smallest size fraction.
Even the smallest size separates used for K-Aranalysis are likely to contain some extent of de-trital contamination. This contamination in somecases may lead to K-Ar ages that are significantlyolder than what would be derived from pure au-thigenic illite, particularly for sandstones that con-tain detrital clay matrix or grains rich in K-feldspar,mica, or detrital illite (e.g., Hamilton et al., 1989,1992; Glasmann, 1992; Zwingmann et al., 1998,1999; Girard et al., 2002). Consequently, we alsodetermine an additional K-Ar age that incorporatesthe ages and volume abundances of the following
Lander and Bonnell 1169

contaminant phases: K-feldspar, muscovite, anddetrital illite.
In light of this discussion, we determine sev-eral different age values in the simulations for com-parison with K-Ar measurements: (1) the K-Ar agefor all authigenic illite fibers integrated over thecomplete illitization history, (2) the K-Ar age withdetrital contaminants, (3) the timeswhen the 10th,50th, and 90th volume percentiles of authigenicillite form, (4) the time of the peak rate for illitegrowth, and (5) the time of the cessation of illiteformation in association with the exhaustion of re-actants or the occlusion of pore space needed forcontinued growth.
Reconstructing Reactants
Wehave designed themodel so that it may be usedto simulate the geologic progression of the reac-tion for already illitized samples. The model re-constructs K-feldspar for the case where it is con-sidered to be the illite K source as well as theamount of kaolin that reacted to form illite. Theparentmaterials for kaolinite also are reconstructedby Al mass balance. These mass-balance calcula-tions account for the stoichiometries and densitiesof the associated minerals in addition to micro-porosity values for the authigenic kaolinite and il-lite (see Table 1 for the values used for simulationsin this article).
For simulations that assume that the illite K isderived from K-feldspar, the starting point is toreconstruct the depositional composition by deter-mining the amount of K-feldspar dissolution neededto account for the K bound in illite. This value isthen compared to the amount of K-feldspar dis-
1170 Fibrous Illite Model
solution indicated by secondary porosity fromK-feldspar dissolution together with K-feldsparreplacement by illitic phases. Even if K actuallyis conserved within the sample frame of reference,it is unlikely that these twomeasures of the volumeof dissolvedK-feldsparwill be in precise agreementgiven the uncertainties in the petrographic data,microporosity values, and illite stoichiometry usedfor the analysis. Thus, the amount of K-feldspar toadd to the depositional composition may be basedeither on the illite derived value or on the valuedetermined from K-feldspar secondary porosityand illite replacement.
The next step in the reconstruction is to con-duct an Al mass analysis. Here, we determine theAl associated with measured kaolinite and illiteabundances in light of their microporosities, stoi-chiometries, and densities. If K-feldspar is con-sidered to be the illite K source, then we subtractthe illite Al that is derived from K-feldspar dis-solution from the total Al bound in illite. We thenassume that the remaining illite Al is derived fromkaolinite dissolution. We add to this value the Alassociated with any measured kaolin in the sampleto determine the total Al produced by dissolutionof plagioclase feldspar, muscovite, biotite, or addi-tional K-feldspar. We compare this Al mass to thepetrographically determined extent of dissolutionand replacement of these additional potential Alsources. As with the K mass balance, we do notexpect a precise agreement between the Al massbased on the petrographic evidence for grain dis-solution and replacement and theAlmass based onthe authigenic clays. Consequently, we have de-signed the model so either of these two calculationmethods may be used for the Al reconstruction.
Table 1. Stoichiometry, Density, and Microporosity Values Used for Mass-Balance and K-Ar Calculations*
Mineral
Stoichiometry Density (g/cm3) Microporosity (vol.%)Illite
K0.91Al2.21Fe0.04Mg0.15Si3.51O10(OH)2 2.75 65 Kaolinite Al2Si2O5(OH)4 2.60 50 K-feldspar KAlSi3O8 2.56 0 Plagioclase feldspar K0.05Na0.60Ca0.35Al1.35Si2.65O8 2.67 0 Muscovite KAl3Si3O10(OH)2 2.82 0*Illite stoichiometry is from Lander et al. (1990) and mineral densities are from Deer et al. (1966).
The reconstruction process adds feldspar andmica to sample-measured values to derive the de-positional abundances of these minerals. We thenuse paragenetic rules (defined in terms of burialdepth, temperature, or absolute geologic time con-straints) to determine when these minerals reactto form kaolinite. Illite may then form accordingto the model characteristics and input data de-scribed above.
MODEL BEHAVIOR
Although the veracity of any geological model isbest determined by testing its predictions usingnatural data sets, synthetic simulations of simpli-fied geologic scenarios are useful for understand-ing the model behavior. Thus, as a prelude to ourevaluation of the model performance, we use syn-thetic simulations as a means to explore modelsensitivity to nucleation and growth kinetics, tem-perature history, reactant volumes, K+ activities,and the nature of nucleation substrates.
Approach for Constraining Kinetics
Perhaps the greatest controversy in the applicationof chemical kinetic models for simulation of dia-genetic processes has to do with the appropriateapproach for determining rate constants. Althoughlaboratory studies provide a critical understand-ing of the controls on kinetic rates, growing evi-dence shows that the associated ratesmay bemuchfaster than those found in geologic environments,at least for silicate phases. The dichotomy betweennatural and laboratory-derived rate constants hasbeen well documented, for example, for feldspardissolution (e.g., Blum and Stillings, 1995; Whiteand Brantley, 2003; Zhu, 2005;Maher et al., 2006)and quartz precipitation (e.g., Walderhaug, 1994,1996, 2000; Oelkers et al., 2000; Worden andMorad, 2000; Lander et al., 2008) where labora-tory rates may be as much as five orders of mag-nitude greater than rates derived from geologicobservations. Several studies have attempted toapply laboratory-derived rate constants for fibrousillite growth (e.g., Chermak and Rimstidt, 1990)
to geologic settings. These rate constants lead torapid, pervasive illitization at much lower tem-peratures than are observed in nature. For exam-ple, Brosse et al. (2000) found that laboratory-derived rates suggest that pervasive illitizationwould occur in about 20,000 yr at 105°C (221°F)in North Sea reservoirs but point out that parts ofthe reservoir that are at present-day temperaturesof 110°C (230°F) contain only trace amounts ofillite while having abundant K-feldspar and kaoli-nite reactants. Likewise, Berger et al. (1997) foundthat laboratory kinetics predict pervasive illitiza-tion to occur in typical formation waters within4.5 m.y. at 50°C (122°F) and in a mere 15,000 yrat 80°C (176°F), despite ample field evidenceshowing the coexistence of kaolinite and K-feldsparreactants over millions of years at these and highertemperatures (Berger et al., 1997). However,Nagy(1994) and D. N. Awwiller (unpublished presen-tation to the SEPM Clastic Diagenesis ResearchGroup in 1998) suggested that changes in particledimensions with depth imply illite fiber growthrates that are similar to the much slower rates ofquartz cement growth that are implied by em-pirical calibration to geologic data.
Our view is that a model that aims to predictthe occurrence and properties of illite in reservoirsandstones should incorporate kinetic parametersthat are based on empirical calibration to geologicobservations instead of laboratory rates that are inapparent conflict with these observations. Thus,in the following analysis, we use kinetic parametersthat lead to pervasive illitization over time andtemperature ranges that are consistent with geo-logical constraints on illite occurrence.
Baseline Case
We begin our sensitivity analysis by consideringsuites of kinetic parameters that lead to illitizationpatterns that are broadly consistent with data fromNorwegian Shelf reservoirs of Jurassic age. In thesesandstones, incipient illite formation is observed atpresent-day temperatures near 120°C (248°F), andpervasive illitization is characteristic of reservoirswith present-day temperatures of 140°C (284°F)(e.g., Bjørlykke et al., 1986; Ehrenberg andNadeau,
Lander and Bonnell 1171

1989; Glasmann et al., 1989; Ramm and Ryseth,1996; Chuhan et al., 2001). The simulations in-corporate a series of temperature histories with a
1172 Fibrous Illite Model
common depositional time of 180 m.y. but withmaximum temperatures that range from 110 to150°C (230 to 302°F) (Figure 4A). For model
Figure 4. Input and results for the baseline set of synthetic illitization models that are designed to roughly approximate illite formationin Jurassic reservoirs in the North Sea and Norwegian Shelf. (A) Temperature history input. (B) Simulated illite cement abundance withgeologic time for each of the temperature histories. (C) Modeled change in intergranular volume (IGV, a proxy for compaction state),intergranular porosity, quartz cement, and illite cement with geologic time for the maximum 150°C simulation. (D) Comparison of modeledrates of the pore volume loss due to compaction, quartz cementation, and illite cementation with geologic time for the maximum 150°Csimulation. (E) Evolution in the volume abundance of illite reactants and products with time for the maximum 150°C burial history.

input, we use a well-sorted, upper medium-grainedsandstone with a subarkosic composition that isbased on the characteristics of petrographicallyanalyzed samples from the Garn Formation. Thepresent-day sandstone composition has 3.2 and1.2 vol.% of K-feldspar and plagioclase feldspar,respectively. In addition, we assume that 3 vol.%of kaolinite formed early in the burial history fromthe dissolution of equal volumes of plagioclasefeldspar and K-feldspar. The simulations accountfor the effect of compaction and quartz cemen-tation on the porosity and nucleation surface areaby the coupling of the illite model with Touch-stone 7.0 models for these processes (Lander et al.,2008).
The kinetic parameters we use not only leadto pervasive illitization (all available reactants areconsumed) by 140°C (284°F), but are also in agree-ment with the data for these reservoirs that in-dicate that samples with maximum temperaturesof 120°C (248°F) have experienced only incipi-ent illite formation (Figure 4B). The value for theactivation energy for illite precipitation (Eag) of73 kJ/mol is substantially higher than the 60.7 kJ/mol value we used for quartz cementation, whichis based on empirical calibration to a Jurassic dataset from the Norwegian Shelf (Lander et al., 2008)(we used an Ag value of −9 × 10⁻¹² mol/cm2/s forboth the illite and quartz models). For the nucle-ation parameters, we used values of 8000 sites/cm2/m.y. for An and 73 kJ/mol for Ean. We alsoassumed that no new illite nuclei would formwithin 0.002 mm of an existing crystallite at a ref-erence temperature of 100°C (212°F) (we adjustedthis range with temperature using equation 5).
In the simulation using a burial history with amaximum temperature of 150°C (302°F), illiteformation begins much later than compaction oreven quartz cementation (Figure 4C). Once illi-tization begins in earnest, however, it reduces in-tergranular porosity at rates that greatly exceedloss rates associated with compaction or quartzcementation (Figure 4D). Although illitization be-comes significant much later than quartz cemen-tation, the simulation shows that quartz cementa-tion is likely to continue after the illitization processis complete provided that adequate nucleation sur-
face area remains (Figure 4C). This result is con-sistent with observations that indicate that al-though illite fibers nucleated and grew on quartzovergrowths in Norwegian Shelf reservoirs, theywere engulfed by subsequent quartz cement growth(Bonnell et al., 1999).
The fate of the reactants and products involvedin the illitization reaction is shownwith time for themaximum 150°C simulation in Figure 4E. We setup the simulation so that kaolinite formed in asso-ciation with K-feldspar and plagioclase (not shown)dissolution over a temperature range of 50 to 80°C(122 to 176°F). The coexisting kaolinite and re-sidual K-feldspar remained relatively unaffecteduntil about 28 Ma when the sandstone reached120°C (248°F). From this time onward, these phasesdissolved and illite began to form. Although thedissolution of K-feldspar produced additional sec-ondary porosity, this porosity was partly occludedby illite that grew within these pores, creating a re-placement texture. Likewise, the intergranular po-rosity increase associated with kaolinite cementdissolution was more than compensated for by in-tergranular porosity loss from both illite and quartzcements (Figure 4C). The reaction ceased when allkaolinite was consumed leading, in this scenario, toresidual K-feldspar.
In addition to matching the illitization patternwith present-day temperature, the nucleation ki-netic parameters also lead to predicted fiber thick-nesses that are consistent with data from NorthSea reservoirs. Average particle thicknesses forillite-size separates obtained by Nagy (1994) tendto thicken with the present-day reservoir temper-ature (Figure 5). The data shown in Figure 5 areaverage values derived from measurements madeon illite fibers in two size separates: less than0.02-mm equivalent spherical diameter and 0.02-to 0.2-mm equivalent spherical diameter. We haveoverlain on this figure the simulated present-day10th, 50th, and 90th percentile (P10, P50, andP90) crystallite thicknesses (by crystallite count)for the simulations. These simulated ranges spanthe measurements and also show an increase withtemperature. Although the P50 and P90 sizes showa larger increase with temperature than the mea-surements, such a discrepancy seems logical given
Lander and Bonnell 1173

that the size separation procedure, by design, isbiased toward the finer part of the crystallite sizedistribution.
Sensitivity to Kinetic Parameters
We evaluated the sensitivity of model results tothe activation energies for illite nucleation andgrowth using the 150°C maximum burial history(Figure 4A) and the baseline sandstone composi-tion and texture. For these simulations, we ad-justed the kinetic parameters such that the peakrate of illitization occurs at 140°C (284°F) for allscenarios. Results show that slower crystal growthrates (larger Eag values) must be counterbalancedby faster nucleation rates (smaller Ean values)to maintain this peak illitization temperature(Figure 6A). Stated in another way, if the crystalgrowth rate slows, then growth must occur onmore crystals to maintain a fast net precipitationrate. Consequently, when the crystal growth ratedecreases in these runs, the simulated crystal sizes(as exemplified by the P50 thicknesses) declinesystematically (Figure 6B). The simulations alsoshow a systematic increase in the duration of illi-tization (as indicated by the elapsed time betweenthe precipitation of the 10th and 90th volume
1174 Fibrous Illite Model
percentiles) as the crystal growth rate decreases(Figure 6B).
Sensitivity to Temperature History
We evaluated the model sensitivity to thermalexposure by maintaining the same temperature
Figure 5. Comparison of the average values for measured illitefiber thicknesses for North Sea reservoirs (Nagy, 1994) with sim-ulated values for the baseline case set of synthetic models. Thesimulated values are shown as the 10th, 50th, and 90th percentilevalues (P10, P50, and P90, respectively) for the particle size dis-tribution where the percentiles are based on the number of sim-ulated illite fibers.
Figure 6. Sensitivity of simulation results to the activation en-ergies for illite nucleation (Ean) and growth (Eag) where all modelscenarios are constrained to lead to a peak rate of illitizationat 140°C (284°F) for the maximum 150°C temperature history(Figure 4A) and baseline sandstone composition and texture.(A) Slower crystal growth from larger growth activation ener-gies must be counterbalanced by faster crystal nucleation (lowernucleation activation energy) to maintain the same peak tem-perature for illite formation. (B) The P50 crystal thicknesses de-crease systematically as growth rate decreases (Eag increases)and nucleation rate increases. Faster crystal growth rates alsoresult in faster overall rates of reaction as exemplified by thetime duration between when the 10th and 90th volume per-centiles (P10 and P90, respectively) of the present-day illite vol-ume formed.
history values used for the 150°C maximum sce-nario for the baseline case (Figure 4A) while scalingthe time duration such that the time of depositionranged from 720 to 90 Ma. We used the samekinetic parameters and sandstone composition andtexture as used for the baseline case. The simu-lated temperature of pervasive illitization drops byroughly 10°C (18°F) for each doubling of the burialhistory time duration (Figure 7A). The simulationsalso show progressively greater peak illitizationrates as the time duration decreases (Figure 7B).This pattern occurs because the shorter residencetime within a given temperature range for theyounger burial histories means that less reactant isconsumed before progressing to the higher tem-peratures associated with the next burial historystep. Consequently, greater volumes of reactantspersist to higher temperatures where illite nucle-ation and growth rates are faster.
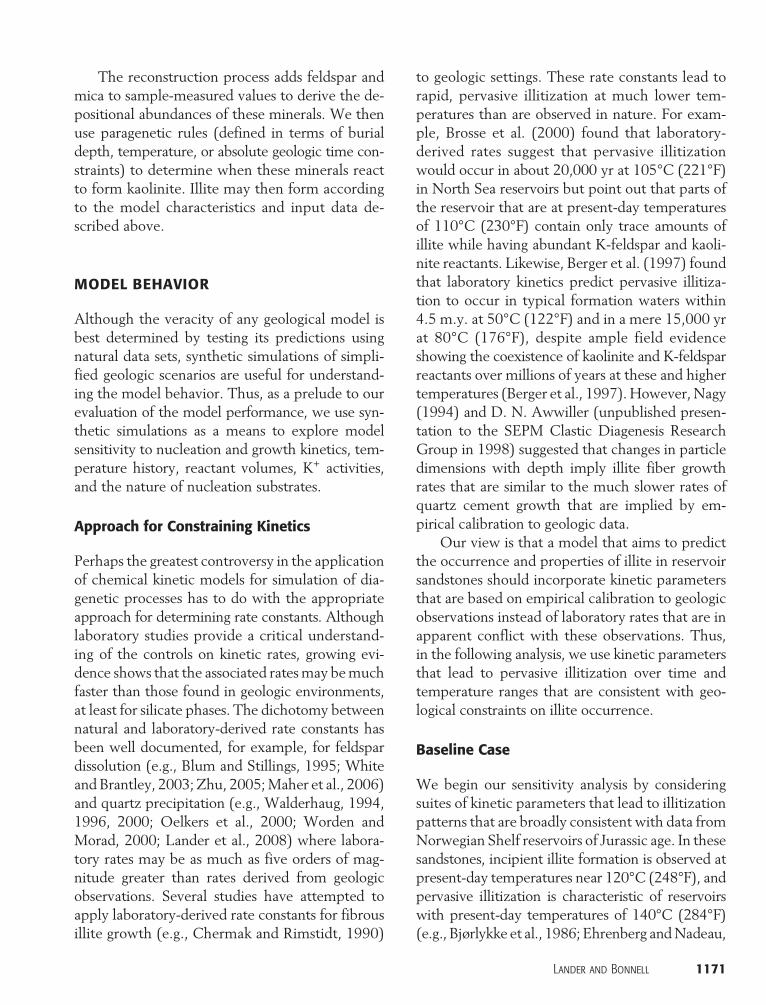
Sensitivity to Reactant Volumes
In this set of sensitivity runs, we varied the amountsof kaolinite and K-feldspar reactants while keepingall other factors the same as the baseline casewith themaximum 150°C burial history scenario(Figure 4A). Results show that although the rate ofillitization is equivalent for each simulation whilereactants are available, the reaction is able to con-tinue to higher temperatures for simulations withgreater reactant volumes (Figure 8). Thus, in theabsence of other differences, results indicate thatsandstones with greater reactant volume shouldhave younger integrated ages of illite formationwhile having higher peak illitization rates at hottertemperatures (Figure 8).
Sensitivity to K+ Activity
Increasing K+ activity leads to faster rates of bothcrystal nucleation and growth because it causes ahigher degree of supersaturation for the muscoviteproxy to illite.We used themaximum150°C burialhistory scenario from the baseline case (Figure 4A)together with log K+ activities of −3, −2, and −1 toassess the impact of this factor on the simulatedtiming of illitization with respect to a case where K+
Figure 7. Sensitivity to thermal exposure for scenarios wherethe same temperature values are used as the maximum 150°Cbaseline scenario (Figure 4A) but the time durations change.(A) The temperature of pervasive illitization increases roughlyby 10°C (18°F) when the time duration is halved. (B) The ratesof illitization increase progressively with decreasing time dura-tion for those scenarios with pervasive illitization.
Figure 8. Sensitivity to reactant volumes for scenarios whereother compositional and textural characteristics are constantusing the baseline maximum 150°C burial history (Figure 4A).The illite cementation rates are independent of reactant vol-umes so long as reactants are available. For samples with greaterreactant volumes (greater final illite abundances), the reactiontakes longer to complete, occurs at higher temperatures, andreaches faster peak rates.
Lander and Bonnell 1175

activity is controlled by equilibriumwith K-feldspar.The −2 log K+ activity scenario is at the upper endof the range shown by formation waters reportedfor severalMesozoic and Tertiary reservoirs, whereasthe −1 value corresponds to the upper end of val-ues determined from fluid inclusions in halite crys-tals (Figure 9). The simulations also assume thatthe system is open with respect to K+ and that K-feldspar is not a reactant.
Simulation results, as expected, are profoundlyinfluenced by increasing K+ activity. Illitization iscomplete by 95°C (194°F) for the log a K+ −2
1176 Fibrous Illite Model
scenario compared to 138°C (275°F) for the K-feldspar equilibrium baseline case (Figure 10A).At temperatures above 60°C (140°F) in the log aK+ −1 scenario, kaolinite is consumed more rapidlythan it forms (Figure 10B). Thus, the time of thereaction completion for this geologically unrealisticscenario is determined by the constraints used todefine the formation of the kaolinite reactant.The overall abundance of illite that forms is lowerfor these high K+ activity scenarios compared tothe baseline case because K-feldspar does not con-tribute Al for illite growth (Figure 10A).
Figure 9. Calculated K+ activities frompublished fluid compositional analysescollected from sandstone reservoirs andfrom fluid inclusions in halite. We calcu-lated the activities with Geochemist’sWorkbench™ 6.0 (Bethke, 1996) usingthe Debye-Hückel method except for thefluid derived from halite inclusions wherewe used the Pitzer method. The shadedregion indicates the range in K+ activitiesexpected for equilibrium with K feldspar.
Figure 10. Sensitivity to K+ activity using the baseline composition and texture and the maximum 150°C temperature history (Figure 4A).(A) Simulated illite cement with paleotemperature. The temperature of illitization drops greatly with increasing K+ activity. The final illiteabundance is greater for the K-feldspar equilibrium run because the feldspar provides an additional source for illite Al. (B) Simulatedkaolinite cement with paleotemperature. Although the same volume of kaolinite forms in all runs, in the scenario with a log K+ activity of−1, the rate of the reaction is sufficiently fast enough that it is consumed faster than it forms at temperatures greater than 70°C (158°F).

Sensitivity to Nucleation Substrate Properties
The model is designed to consider preferentialnucleation of fibrous illite on substrates such asmicaceous or illitic surfaces by providing a meansto specify the activation energy benefit for nucle-ation on such substrates compared to other surfacetypes and by accounting for the fraction of the in-tergranular pore area that is made up of such sub-strates. To illustrate the model sensitivity to thesetwo factors, we defined muscovite grains to be apreferential nucleation substrate. We consideredscenarioswherewedecreased the activation energyfor nucleation by 4 and 8 kJ/mol for muscovitesurfaces compared to other substrate types forsimulated samples with 5 and 25 vol.% of mus-covite grains. Other factors in the simulations areas defined for the baseline case with the maximum150°C burial history (Figure 4A).
Results indicate that preferential nucleation onmicaceous substrates leads to pervasive illitizationat lower paleotemperatures (earlier in the burialhistories) compared to the baseline case (Figure 11),although the crystal growth kinetics are held con-stant. The faster overall illitization occurs in thepreferential nucleation scenarios because growthoccurs on a larger number of crystals. Additionally,preferential nucleation substrates promote illite for-mation as cement compared to replacement (wherethe crystals grow within secondary pores after
K-feldspar dissolution). This preference for cementoccurs because the preferential nucleation sub-strates border intergranular pores. The signifi-cance of preferential nucleation on illite textureand timing, however, is comparatively minor ex-cept when the surface area made up of preferen-tial substrates is a significant fraction of the overallarea, and the activation energy benefit for nucle-ating on such surfaces is very large.
Summary of Sensitivity Test Results
The sensitivity analysis reveals several noteworthycharacteristics of the fibrous illite model. (1) Other-wise comparable sandstones with similar maxi-mum temperatures but longer thermal residencetimes will tend to become pervasively illitized atlower temperatures and at slower overall rates.(2) Incursion of potassic brines into kaolinite-bearing sandstones leads to dramatic decreases inthe temperatures of pervasive illitization comparedto scenarios where K is derived from in-situ dis-solution of K-feldspar. (3) Illitization takes longerto complete in sandstones with more reactants.(4) The presence of illitic or micaceous substratesthat could act as preferential nuclei for illite crys-tals is unlikely to significantly affect the timingof illite formation except for sandstones that arehighly micaceous, that have abundant illite-rich ormuscovite-rich rock fragments, or that have grains
Figure 11. Sensitivity of illite cementabundance to preferential nucleation onmuscovite grains using the baseline textureand the maximum 150°C temperaturehistory (Figure 4A). Preferential nucleationon muscovite leads to a lower tempera-ture for the completion of the illitizationreaction and a greater fraction of the illiteoccurrence as cement (in intergranularpores) compared to “replacement” (in graindissolution pores). The magnitude of theeffect, however, is minor for the two sce-narios with 5-vol.% muscovite. In themaximum effect case (25-vol.% muscoviteand an activation energy for nucleationon muscovite that is 8 kJ/mol lower thanon other substrates), the temperature forcompletion of the reaction is about 5°C(9°F) cooler than the baseline.
Lander and Bonnell 1177

with well-developed detrital or infiltrated illiticcoatings.
APPLICATION TO GEOLOGIC DATA SETS
Although the synthetic simulations are useful fordemonstrating model behavior, the model utilitycan only be determined by assessing the degreeto which it reproduces geologic observations. Weevaluated the performance of the model on twoillite-bearing data sets: Jurassic sandstones fromthe Norwegian Continental Shelf (NCS) and Mio-cene sandstones in offshore Southeast Asia (SEA).In these data sets, the reaction of kaolin and K-feldspar appears to be the main source for authi-genic illite given that both reactants are present,some illite appears to have inherited the morphol-ogy of kaolin that it replaced, and most authigenicillite has a fibrous habit (as opposed to a morphol-ogymore consistentwith replacement of a smectiticprecursor phase). Samples in both data sets havemean grain sizes ranging fromvery fine to very coarseand have sorting ranging from well to poor. TheSEA samples are dominantly fluvial in origin,whereas
1178 Fibrous Illite Model
the NCS samples are mainly shallow-marine sand-stones with some tidal influences. The NCS data setis composed of 189 samples from 12 wells, and theSEA data set is made up of 62 samples from threewells. Sample framework-grain compositions areshown in Figure 12, and the range in sample tem-perature histories is shown in Figure 13.
Our objective for this work is to determinewhether model results are consistent with the ob-served patterns of occurrence and abundances ofillite, kaolinite (or dickite for higher temperaturesamples), and K-feldspar in the two data sets. Addi-tionally, we compare predicted illite K-Ar resultswith available data and simulated fiber thicknesseswith measurements from North Sea sandstones.The simulations we describe below use the mass-balance option that ensures that each simulatedsample has sufficient reactants to account for themeasured volumes of authigenic kaolin and illite.Thus, additional feldspar reactants are added atthe time of deposition to maintain mass balance ifthe Al or K in the illite and kaolinite exceeds theamount associated with feldspar secondary poros-ity and replacement. Although this model config-uration ensures sufficient reactants to account
Figure 12. Quartz, feldspar, and rock fragment (QFR) ternary diagrams showing sample data for the two analyzed data sets using theclassification scheme of Folk (1980). (A) Plot based on petrographic data. (B) Plot of reconstructed compositions for the time of de-position. The additional reconstructed rock fragment and feldspar values are based on (1) the interpretation of parent grains forpetrographically determined grain dissolution and replacement and (2) the additional feldspar dissolution, if required, to account for Aland K in kaolin and illite assuming mass balance on the thin-section scale.

for the measured amount of illite, the simulatedamount of illite may be less than the measuredamount when the model does not predict a suffi-cient extent of the reaction. The modeled amountof illite may exceed the measured amount when(1) the modeled extent of illitization is extensiveand the measured extent of feldspar dissolutionand replacement by illite exceeds that required toaccount for measured illite volume or (2) the sam-ple contains both kaolinite and K-feldspar reac-tants and the model predicts more extensive illiteformation than has beenmeasured for the sample.Unless stated otherwise, we use the same activa-tion energy values for nucleation and growth andassume no activation energy benefit for nuclea-tion on micaceous substrates. All simulations usean Ag value of −9 × 10⁻¹² mol/cm2/s, an An valueof 8000 sites/cm2/m.y., and an exclusion radius of0.002 mm at 100°C (212°F) for fiber nucleationnear existing crystallites. We adjusted quartz ce-mentation kinetic and compaction model param-eters for each sample to match the measured quartzcement and intergranular volumes, respectively.The purpose of this procedure is to provide themost accurate basis possible for reconstructing in-tergranular nucleation surface area.
Norwegian Continental Shelf
The Haltenbanken region of offshore Norway iswell suited for diagenetic studies because post-depositional rifting in this area has caused Jurassic
sandstones with similar initial compositions andtextures to have experienced a broad range in ther-mal exposures. Kaolinite and K-feldspar reactantsshow a marked decline in abundance at present-day temperatures greater than 120 to 130°C andcease to coexist at present-day temperatures inexcess of 140°C (Bjørlykke et al., 1986; Ehrenbergand Nadeau, 1989; Chuhan et al. 2000, 2001).Authigenic illite, however, shows an inverse pat-tern of occurrence. Chuhan et al. (2000, 2001)concluded that the illitization reaction is mostlyisochemical with respect to both K and Al basedon their bulk chemical analysis of samples with arange in the extent of illitization. Formation-wateranalyses from this area have K+ concentrations thatdo not exceed what would be expected for equi-librium with K-feldspar (Egeberg and Aagaard,1989; Bjørlykke et al., 1995).
Simulation results indicate that apart fromsample-specific input (i.e., composition, texture,and thermal history), a single set of input param-eters accurately predicts the rapid transition fromincipient to pervasive illitization with present-daytemperature (Figure 14A) as well as the associatedpattern of K-feldspar and kaolin-reactant abun-dances. These results were obtained with an activa-tion energy of 73.2 kJ/mol for both crystal nucle-ation and growth. Simulations that use an activationenergy value of 76 kJ/mol for these two parameters,however, systematically underpredict illite abun-dances for samples at temperatures less than 160°C(Figure 14A). By contrast, increased reaction rates
Figure 13. Temperature histories used in the simulations for the two natural data sets. (A) Norwegian Continental Shelf data set.(B) Southeast Asia data set.
Lander and Bonnell 1179

Figure 14. Comparison of the pattern in authigenic illite abundance with maximum temperature from petrographic data and with calculated values for the 68-, 73.2-, and 76-kJ/molsimulations described in the text. Sample measurements with reactants include both kaolin and K-feldspar, whereas samples lacking reactants may contain one of these two phases but not both.
1180Fibrous
IlliteModel

associated with activation energy values of 68 kJ/mol lead to simulated illite abundances that sig-nificantly overpredict measured values for coolersamples that have coexisting K-feldspar and kao-linite reactants (Figure 14A).
Although the simulation results are consistentwith the present-day distribution of illite, fiberK-Ar ages provide an independent means to assessthe veracity of the simulated timing of illite for-mation. Ehrenberg andNadeau (1989)made K-Ardeterminations on illite from 16 Garn Formationsamples in 9 wells in the study area and obtaineda range in values of 31 to 55 Ma. Of these wells,one overlaps with those in our data set and twosamples analyzed from it have K-Ar ages of 33and 47 Ma. The simulated K-Ar ages range from11 to 20 Ma in the 73.2 kJ/mol run for pure, bulkauthigenic illite for the five samples in our dataset (Figure 15). Although the simulated ages aresignificantly younger than the measurements,Ehrenberg and Nadeau (1989) stated that theiranalyzed samples may have a problem with de-
trital contaminants. Recent U/Pb dating of detritalzircons in the Garn Formation shows ages rangingfrom approximately 400 to 3300Ma (Morton et al.,2009). The potential effects of muscovite con-taminants on the modeled K-Ar dates are shownas a function of the volume fraction of three rep-resentative ages of contaminants in Figure 15. Theresults indicate that as little as 1 to 3 vol.% ofProterozoic or Archean muscovite would resultin K-Ar measurements that are consistent withmodel results. Even smaller contaminant volumeswould be required to account for the K-Ar resultsif detrital K-feldspar of these ages were presentdue to the mineral’s higher K content (Hamiltonet al., 1989). The presence of such minor contam-inants seems reasonable given that sandstonesfrom this well in our data set contain K-feldspar(0 to 1 vol.%) and muscovite grains (0 to 0.7 vol.%)as well as clay matrix (0.7 to 3.7 vol.%), shale rockfragments (0.7 to 1.3 vol.%), and various othersedimentary, metamorphic, and plutonic rock frag-ments (1.7 to 3.6 vol.%) that contain these po-tential contaminants.
Although the 73.2-kJ/mol simulation predictsK-Ar ages that appear to be consistent with mea-surements, results from the other two simulationsare not. The 76-kJ/mol simulation predicts onlyincipient illitization with K-Ar ages of around 6Mafor the pure bulk sample. However, the simulatedK-Ar ages for the 68-kJ/mol run range from 60 to64 Ma for pure authigenic illite. In this case, evenwithout contaminants, the simulated K-Ar agesare much too old to be consistent with the mea-surements. The 73.2-kJ/mol simulation thus pro-vides the best fit to the illite abundance and patternof occurrence and K-Ar ages.
This simulated timing for illitization is con-siderably older than some other workers havesuggested for this region. Ehrenberg and Nadeau(1989) and Bjørlykke et al. (1995) proposed thatthe bulk of the illite formed during the past fewmillion years based on the abrupt transition fromincipient to pervasive illitization over present-daytemperatures of 120 to 140°C (248 to 284°F)and a pulse of rapid burial during the Pliocene–Pleistocene. One line of evidence that supportsolder illitization consistent with our model results
Figure 15. Impact of detrital contaminants on the simulatedbulk K-Ar ages for five Garn Formation samples from a well inthe Norwegian Continental Shelf data set using an activationenergy of 73.2 kJ/mol. The horizontal lines indicate K-Ar mea-surements reported by Ehrenberg and Nadeau (1989) for twodifferent Garn Formation samples in this well. The shaded re-gions indicate the range in simulated bulk K-Ar values for the fivemodeled samples as a function of the age and volume of apotential muscovite contaminant. The detrital contaminant agesused for the calculations are representative of values for GarnFormation zircons reported by Morton et al. (2009). Resultsindicate that only small amounts of Precambrian contaminantsare required for the simulated results to be consistent with themeasurements.
Lander and Bonnell 1181

is the considerable volume of quartz cement thatpostdates the initiation of fibrous illite nucleationand growth in sandstones from the study area.Bonnell et al. (1999) found illite fibers that wereenveloped by up to 50 mm of quartz cement over-growths in Viking Graben samples with similarburial histories. Using quartz cementation mod-els with empirically calibrated kinetic parameters,Bonnell et al. (1999) concluded that it wouldhave taken tens of millions of years to account forthe volume of the quartz cement that encases theillite fibers.
Southeast Asia
Like the NCS data set, the analyzed sandstonesin the SEA data set were deposited in a preriftdepositional system, and nearby formation-waterK+ concentrations do not exceed what wouldbe expected from equilibrium with K-feldspar(Lundegard and Trevena, 1990). These sandstones,however, tend to be much richer in micaceousmetamorphic rock fragments (Figure 12) and haveexperienced much greater heating rates com-pared to NCS samples (Figure 13). Despite thesedifferences, the pattern of correspondence betweencalculated and measured illite abundances forthe 68, 73.2, and 76 kJ/mol activation energyscenarios produces similar patterns (Figure 14B).Compared to the NCS simulations, however, the68-kJ/mol simulation results in a much lower max-imum extent of overprediction of illite abundance.
The clay minerals in this data set were ana-lyzed rigorously by J. Reed Glasmann in an un-published study (2001, personal communication)that incorporates K-Ar results in addition to op-tical thin-section petrography, whole rock and ori-ented clay x-ray diffraction (XRD), oxygen iso-topic analysis, and SEM and TEM characterization.James Aronson conducted K-Ar analyses on the lessthan 0.2-mm equivalent settling diameter fraction-size separates made by Glasmann from four sam-ples. Glasmann’s XRD and TEM investigationsindicate that K-feldspar and 2M1 polytype illitecontaminants occur in coarser size fractions aswell as one of the less than 0.2-mm fraction sam-
1182 Fibrous Illite Model
ples. Problems with detrital contamination are tobe expected with these samples given the sub-stantial abundances of micaceous and K-feldspar-bearing grains (mica grains: 0.3 to 5.2 vol.%, K-feldspar grains: 0 to 32.5 vol.%, metamorphic rockfragments: 2.0 to 42.5 vol.%, and plutonic rockfragments: 0 to 29.7 vol.%) as well as detrital clay(clasts: 0 to 6.1 vol.%, matrix: 0 to 5.0 vol.%).Thus, the measured K-Ar values likely represent amaximum integrated age for the authigenic illite,even for the less than 0.2-mm-size fraction samplesthat lack clear indications of detrital contamination.
The simulated K-Ar dates for pure, bulk illitefor the twowells with less than 0.2-mm fraction datawithout detected contaminants show a good corre-spondence with three measurements lacking ob-vious contamination, particularly for the 68-kJ/molactivation energy run (Figure 16). Although the
Figure 16. Correspondence between three measured K-Ardates for the Southeast Asia data set (J. R. Glasmann, 2001, per-sonal communication) and simulated values. The measurementswere made on less than 0.2-mm equivalent settling diameter-size fractions. The two measurements with values of approxi-mately 13 Ma are from different samples in the same well, andthe 7-Ma value comes from a sample in a different well. Cal-culated results are shown for bulk, pure illite (no contaminants)for the 73.2- and 68-kJ/mol runs (the 76-kJ/mol run did not createsufficient illite to simulate K-Ar values). The calculated valuesare based on simulations for 10 samples from each well that arewithin a few meters of the sample with the K-Ar measurement.The symbol y-axis position shows the average calculated value,and the vertical bar shows the range in calculated values.

73.2-kJ/mol run results underpredict the measuredvalues by 5 to 6 m.y. (Figure 16), this result seemsreasonable given the likely detrital contaminationproblems discussed above.
Natural Data Set Discussion
The illite model reproduces the present-day pat-tern of occurrence and abundances of illite, kaolin,and K-feldspar in both data sets. Moreover, simu-lation results made using the same kinetic param-eters (73.2 kJ/mol) provide a good match to bothdata sets despite their large differences in geologichistories and grain compositions. Optimizing theactivation energy independently for each dataset resulted in only minor differences (73.4 and73.0 kJ/mol, respectively, for theNCSandSEAdatasets). By comparison, optimized activation energiesfor quartz precipitation of 60.7 and 55.5 kJ/mol,respectively, for the NCS and SEA data sets, showmuch larger differences (Lander et al., 2008).
The simulated K-Ar dates from the 73.2 kJ/molruns also appear to be consistent with the mea-surements given their uncertainties. Additionally,the particle dimensions from these simulations arebroadly consistent with Nagy’s (1994) data fromsandstones from the United Kingdom North Sea(Figure 17). The reconstructed depositional feld-spar abundances for both data sets significantly ex-ceed present-day abundances if we assume that Aland K are conserved on the thin-section scale andif we use illite and kaolin abundances for reference(Figure 12).
In these simulations, we assumed no activationenergy benefit for nucleation on micaceous grains.Both data sets, however, contain micaceous grains,and they are especially abundant in metamorphicrock fragments in the SEA data set. We thereforeran simulations for a scenario where we assumed a20-kJ/mol activation energy benefit for nucleatingon micaceous surfaces compared to other surfacetypes. After parameter optimization, this scenariohas a slightly higher activation energy for crystalgrowth of 73.6 kJ/mol while having a comparablequality of fit to the data. Integrated times of illiti-zation are slightly older (0.2 to 2.6 m.y. older onaverage, respectively, for SEA and NCS), and P50
widths are somewhat smaller (by 12 to 19%, re-spectively, for NCS and SEA), but the results areotherwise similar. Thus, the model is relatively in-sensitive to an activation energy benefit for nucle-ation on micaceous grains as long as the kineticparameters are optimized to match the measuredpattern of illite occurrence.
CONCLUSIONS
Our kinetic model for fibrous illite nucleation andgrowth reproduces the pattern in occurrence offibrous illite as well as kaolin and K-feldspar reac-tants in two geologically distinct natural data setsusing a single set of model parameters. Simulationresults also appear to be at least broadly consistentwith available K-Ar ages and data on illite fiberdimensions. We have shown that if this reaction iskinetically controlled, then the temperature rangewhere illitization occurs will be a strong functionof the thermal history. Therefore, the illitizationprocess should not be expected to be a universalfunction of a simple temperature threshold of 120
Figure 17. Comparison of average fibrous illite particle thick-nesses reported by Nagy (1994) for two size separates (darksymbols) with simulated values for the two natural data setsusing the 73.2-kJ/mol scenario (light symbols). The symbols forthe simulation results indicate the predicted 50th percentile (P50)thickness value by crystallite count for each sample. The burialhistories from the Norwegian Continental Shelf (NCS) data setare similar to those experienced by Nagy’s (1994) samples, butthe Southeast Asia (SEA) samples experienced much higherheating rates.
Lander and Bonnell 1183

to 140°C (248 to 284°F) as has been suggestedby other workers (Ehrenberg and Nadeau, 1989;Bjørlykke et al., 1995; Bjørlykke, 1998). This kineticbehavior is well illustrated by the tendency for thesimulations of NCS samples to have cooler inte-grated temperatures of formation and longer dura-tions of illitization than SEA samples that havebeen exposed to far greater heating rates (Figure 18).
Model sensitivity tests indicate greatly acceler-ated rates of illitization in the presence of potassicbrines. Results for a synthetic Jurassic-aged sampleshow a dramatic drop from 135 to 80°C (275 to176°F) in the paleotemperature of pervasive illiti-zation when K+ activity increases from levels ex-pected for equilibrium with K-feldspar to that as-sociated with fluid inclusions in naturally occurringhalite. Sensitivity tests also predict that otherwisesimilar sandstones with comparable maximumtemperatures but longer thermal residence timesare illitized at lower temperatures and at sloweroverall rates and that completion of the reactiontakes longer in sandstones with more reactants butsimilar thermal exposures.
1184 Fibrous Illite Model
REFERENCES CITED
Aagaard, P., J. S. Jahren, and P. K. Egeberg, 1992, North Seaclastic diagenesis and formation water constraints, in Y.K. Kharaka and A. S. Maest, eds., Water-rock interac-tion: Proceedings of the 7th International Symposium,Park City, Utah, July 13–18.
Altaner, S. P., 1986, Comparison of rates of smectite illitiza-tion with rates of K-feldspar dissolution: Clays and ClayMinerals, v. 34, p. 608–611, doi:10.1346/CCMN.1986.0340517.
Bazin, B., É. Brosse, and F. Sommer, 1997a, Chemistry of oil-field brines in relation to diagenesis of reservoirs: 1. Useof mineral stability fields to reconstruct in situ watercomposition. Example of the Mahakam Basin: Marineand Petroleum Geology, v. 14, p. 481–495, doi:10.1016/S0264-8172(97)00004-4.
Bazin, B., É. Brosse, and F. Sommer, 1997b, Chemistry of oil-field brines in relation to diagenesis of reservoirs: 2. Re-construction of paleo-water composition for modelingillite diagenesis in the Greater Alwyn area (North Sea):Marine and Petroleum Geology, v. 14, p. 497–511,doi:10.1016/S0264-8172(97)00005-6.
Berger, G., J. C. Lacharpagne, B. Velde, D. Beaufort, and B.Lanson, 1997, Kinetic constraints on illitization reac-tions and the effects of organic diagenesis in sandstone/shale sequences: Applied Geochemistry, v. 12, p. 23–35,doi:10.1016/S0883-2927(96)00051-0.
Bethke, C. M., 1996, Geochemical reaction modeling—Con-cepts and applications: New York, Oxford UniversityPress, 397 p.
Bjørkum, P. A., and N. Gjelsvik, 1988, An isochemical modelfor formation of authigenic kaolinite, K-feldspar and illitein sediments: Journal of Sedimentary Petrology, v. 58,p. 506–511.
Bjørlykke, K., 1998, Clay mineral diagenesis in sedimentarybasins—A key to the prediction of rock properties. Ex-amples from the North Sea Basin: Clay Minerals, v. 33,p. 15–34, doi:10.1180/000985598545390.
Bjørlykke, K., P. Aagaard, H. Dypvik, D. S. Hastings, andA. S. Harper, 1986, Diagenesis and reservoir propertiesof Jurassic sandstones from the Haltenbanken area, off-shoremidNorway, inA.M. Spencer, ed., Petroleum geol-ogy of the Northern European margin: Norwegian Petro-leum Society, London, Graham and Trotman, p. 285–292.
Bjørlykke, K., T. Nedkvitne, M. Ramm, and G. C. Saigal,1992, Diagenetic processes in the Brent group, in A. C.Morton, R. S. Haszeldine, M. R. Giles, and S. Brown,eds., Geology of the Brent Group: Geological Society(London) Special Publication 61, p. 263–288.
Bjørlykke, K., P. Aagaard, P. K. Egeberg, and S. P. Simmons,1995, Geochemical constraints from formation wateranalyses from the North Sea and the Gulf Coast basinson quartz, feldspar and illite precipitation in reservoirrocks, in J. M. Cubitt and W. A. England, eds., The geo-chemistry of reservoirs: Geological Society (London)Special Publication 86, p. 33–50.
Blum, A. E., and L. L. Stillings, 1995, Feldspar dissolutionkinetics, inA. F.White and S. L. Brantley, eds., Chemicalweathering rates of silicate minerals, v. 31, p. 291–346.
Figure 18. Comparison of the integrated temperature of illiti-zation with the duration of illite formation for samples from theNorwegian Continental Shelf and Southeast Asia data sets usingthe 73.2-kJ/mol run scenario. The duration of illitization is basedon the time span between the formation of the 10th and 90thvolume percentiles, whereas the integrated temperature is thevolume-weighted average temperature for illite formation. Themuch higher thermal exposures of the Southeast Asia data sethave resulted in simulated illitization occurring at significantlyfaster rates and higher temperatures compared to NorwegianContinental Shelf samples.

Bonnell, L.M., C. J. Lowrey, andA.A. Bray, 1999, The timingof illitization, Haltenbanken, mid-Norway (abs.): AAPGAnnual Meeting Program with Abstracts, v. 8, p. A14.
Bove, D. J., D. D. Eberl, D. K. McCarty, and G. P. Meeker,2002, Characterization andmodeling of illite crystal par-ticles and growth mechanisms in a zoned hydrothermaldeposit, Lake City, Colorado: American Mineralogist,v. 87, p. 1546–1556.
Brosse, E., J. Matthews, B. Baxin, Y. Le Gallo, and F. Sommer,2000, Related quartz and illite cementation in the Brentsandstones: A modeling approach, in R. H. Worden andS. Morad, eds., Quartz cementation in sandstones: In-ternational Association of Sedimentologists Special Pub-lication 29, p. 51–66.
Canals, M., and J. D. Meunier, 1995, A model for porosityreduction in quartzite reservoirs by quartz cementation:Geochimica et Cosmochimica Acta, v. 59, p. 699–709,doi:10.1016/0016-7037(94)00355-P.
Cendón, D. I., C. Ayora, J. J. Pueyo, and C. Taberner, 2003,The geochemical evolution of the Catalan potash sub-basin, South Pyrenean foreland basin (Spain): ChemicalGeology, v. 200, p. 339–357, doi:10.1016/S0009-2541(03)00195-5.
Chermak, J. A., and J. D. Rimstidt, 1990, The hydrothermaltransformation of kaolinite to muscovite/illite: Geochimicaet Cosmochimica Acta, v. 54, p. 2979–2990, doi:10.1016/0016-7037(90)90115-2.
Chuhan, F. A., K. Bjørlykke, and C. Lowrey, 2000, The roleof provenance in illitization of deeply buried reservoirsandstones from Haltenbanken and north Viking Graben,offshore Norway: Marine and Petroleum Geology, v. 17,p. 673–689.
Chuhan, F. A., K. Bjørlykke, and C. J. Lowrey, 2001, Closed-system burial diagenesis in reservoir sandstones: Exam-ples from the Garn Formation at Haltenbanken area, off-shore mid-Norway: Journal of Sedimentary Research,v. 71, p. 15–26, doi:10.1306/041100710015.
Clauer, N., and S. Chaudhuri, 1995, Clays in crustal en-vironment: Isotope dating and tracing: Heidelberg,Springer, 359 p.
Clauer, N., J. D. Cocker, and S. Chaudhuri, 1992, Isotopicdating of diagenetic illites in reservoir sandstones: Influ-ence of the investigator effect: SEPM (Society for Sed-imentary Geology), v. 47, p. 5–12.
Clauer, N., N. Liewig, B. Ledesert, and H. Zwingmann,2008, Thermal history of Triassic sandstones from theVosges Mountains-Rhine Graben rifting area, NE France,based on K-Ar illite dating: Clay Minerals, v. 43, p. 363–379, doi:10.1180/claymin.2008.043.3.03.
Cocker, J. D., 1986, Authigenic illite morphology: Appear-ances can be deceiving: AAPG Bulletin, v. 70, p. 575.
Deer,W.A., R. A.Howie, and J. Zussman, 1966, Introductionto the rock-forming minerals: London, Longman, 528 p.
De Ros, L. F., 1998, Heterogeneous generation and evolutionof diagenetic quartarenites in the Silurian–DevonianFurnas Formation of the Paraná Basin, southern Brazil:Sedimentary Geology, v. 116, p. 99–129, doi:10.1016/S0037-0738(97)00081-X.
Eberl, D. D., V. A. Drits, and J. Środoń, 1998, Deducinggrowth mechanisms for minerals from the shapes of
crystal size distributions: American Journal of Science,v. 298, p. 499–533.
Egeberg, P. K., and P. Aagaard, 1989, Origin and evolution offormation waters from oil fields on the Norwegian Shelf:Applied Geochemistry, v. 4, p. 131–142, doi:10.1016/0883-2927(89)90044-9.
Ehrenberg, S. N., and P. H. Nadeau, 1989, Formation of dia-genetic illite in sandstones of the Garn Formation, Hal-tenbanken area, mid-Norwegian Continental Shelf: ClayMinerals, v. 24, p. 233–253, doi:10.1180/claymin.1989.024.2.09.
Folk, R. L., 1980, Petrology of sedimentary rocks: Austin,Texas, Hemphill Publishing Company, 184 p.
Franks, S. G., and H. Zwingmann, 2010, Origin and timingof late diagenetic illite in the Permian–CarboniferousUnayzah sandstone reservoirs of Saudi Arabia: AAPGBulletin, v. 94, p. 1133–1159, doi:10.1306/04211009142.
Gaupp, R., A. Matter, J. Platt, K. Ramseyer, and J. Walzebuck,1993, Diagenesis and fluid evolution of deeply buriedPermian (Rotliegende) gas reservoirs, northwest Ger-many: AAPG Bulletin, v. 77, p. 1111–1128.
Girard, J. P., I. A. Munz, H. Johansen, J. C. Lacharpagne, andF. Sommer, 2002, Diagenesis of the Hild Brent sand-stones, northern North Sea: Isotopic evidence for theprevailing influence of deep basinal water: Journal ofSedimentary Research, v. 72, p. 746–759, doi:10.1306/040102720746.
Glasmann, J. R., 1992, The fate of feldspar in Brent Groupreservoirs, North Sea: A regional synthesis of diagen-esis in shallow, intermediate, and deep burial environ-ments, in A. C. Morton, R. S. Haszeldine, M. R. Giles,and S. Brown, eds., Geology of the Brent Group: Geo-logical Society (London) Special Publication 61, p. 329–350.
Glasmann, J. R., P. D. Lundegard, R. A. Clark, B. K. Penny,and I. D. Collins, 1989, Geochemical evidence for thehistory of diagenesis and fluid migration: Brent sand-stone, Heather field, North Sea: Clay Minerals, v. 24,p. 255–284, doi:10.1180/claymin.1989.024.2.10.
Güven, N., 2001, Mica structure and fibrous growth of illite:Clays and Clay Minerals, v. 49, p. 189–196, doi:10.1346/CCMN.2001.0490301.
Güven, N., W. F. Hower, and D. K. Davies, 1980, Nature ofauthigenic illites in sandstone reservoirs: Journal of Sedi-mentary Petrology, v. 50, p. 761–766.
Hamilton, P. J., S. Kelley, and A. E. Fallick, 1989, K-Ar dat-ing of illite in hydrocarbon reservoirs: Clay Minerals,v. 24, p. 215–232, doi:10.1180/claymin.1989.024.2.08.
Hamilton, P. J., M. R. Giles, and P. Ainsworth, 1992, K-Ardating of illites in Brent Group reservoirs: A regionalperspective, in A. Morton, R. Haszeldine, M. Giles, andS. Brown, eds., Geology of the Brent Group: Geologi-cal Society (London) Special Publication 61, p. 377–400.
Hunziker, J. C., 1986, The evolution of illite to muscovite:An example of the behavior of isotopes in low-grademetamorphic terrains: Chemical Geology, v. 57, p. 31–40, doi:10.1016/0009-2541(86)90092-6.
Hutcheon, I., M. Shevalier, and H. J. Abercrombie, 1993,pH buffering by metastable mineral-fluid equilibria
Lander and Bonnell 1185

and evolution of carbon dioxide fugacity during burialdiagenesis: Geochimica et Cosmochimica Acta, v. 54,p. 1017–1027, doi:10.1016/0016-7037(93)90037-W.
Jahren, J. S., and P. Aagaard, 1989, Compositional variationsin diagenetic chlorites and illites, and relationships withformation-water chemistry: Clay Minerals, v. 24, p. 157–170, doi:10.1180/claymin.1989.024.2.04.
Kantorowicz, J., 1984, The nature, origin and distribution ofauthigenic clay minerals, from Middle Jurassic Raven-scar and Brent Group sandstones: Clay Minerals, v. 19,p. 359–375, doi:10.1180/claymin.1984.019.3.08.
Kantorowicz, J. D., 1990, The influence of variations in illitemorphology on the permeability of Middle Jurassic BrentGroup sandstones, Cormorant field, U.K. North Sea:Marine Petroleum Geology, v. 7, p. 66–74, doi:10.1016/0264-8172(90)90057-N.
Kharaka, Y. K., R. W. Hull, and W. W. Carothers, 1985,Water-rock interactions in sedimentary basins, in D. LGautier, Y. K. Kharaka, and R. C. Surdam, eds., Roleof organic matter in sediment diagenesis: SEPM ShortCourse 17, p. 79–176.
Kittel, C., and H. Kroemer, 1980, Thermal physics: NewYork, Freeman, 473 p.
Lander, R. H., S. Bloch, S. Mehta, and C. D. Atkinson, 1990,Burial diagenesis of paleosols in the Giant Yacheng Gasfield, People’s Republic of China: Bearing on illite reac-tion pathways: Journal of Sedimentary Research, v. 61,p. 256–268.
Lander, R. H., R. E. Larese, and L. M. Bonnell, 2008, Towardmore accurate quartz cement models: The importance ofeuhedral versus noneuhedral growth rates: AAPG Bulle-tin, v. 92, p. 1537–1563, doi:10.1306/07160808037.
Lanson, B., D. Beaufort, G. Berger, J. Baradat, and J. C.Lacharpagne, 1996, Illitization of diagenetic kaolinite-to-dickite conversion series: Late-stage diagenesis of theLower Permian Rotliegende sandstone reservoir, off-shore of the Netherlands: Journal of Sedimentary Re-search, v. 66, p. 501–518.
Lanson, B., D. Beaufort, G. Berger, A. Bauer, A.Cassagnabère,and A. Meunier, 2002, Authigenic kaolin and illiticminerals during burial diagenesis of sandstones: A re-view: Clay Minerals, v. 37, p. 1–22, doi:10.1180/0009855023710014.
Lasaga, A. C., 1998, Kinetic theory in the earth sciences:Princeton series in geochemistry: Princeton, New Jersey,Princeton University Press, 811 p.
Lee, M., 1984, Diagenesis of the Permian Rotliegendes sand-stone, North Sea: K-Ar, 180/16O and petrographic evi-dence: Ph.D. thesis, Case Western Reserve University,Cleveland, Ohio, 362 p.
Lee, M., J. L. Aronson, and S. M. Savin, 1985, K/Ar dating ofRotliegendes sandstone, Netherlands: AAPG Bulletin,v. 68, p. 1381–1385.
Lee, M., J. L. Aronson, and S. M. Savin, 1989, Timing andconditions of Permian Rotliegendes sandstone diagen-esis, southern North Sea: K/Ar and oxygen isotope data:AAPG Bulletin, v. 73, p. 195–215.
Lichtner, P. C., 1988, The quasi-stationary state approxima-tion to coupled mass transport and fluid-rock interactionin a porous medium: Geochimica et Cosmochimica
1186 Fibrous Illite Model
Acta, v. 52, p. 143–165, doi:10.1016/0016-7037(88)90063-4.
Lundegard, P. D., and A. S. Trevena, 1990, Sandstone diag-enesis in the Pattani Basin (Gulf of Thailand): History ofwater-rock interaction and comparison with the Gulf ofMexico: Applied Geochemistry, v. 5, p. 669–685,doi:10.1016/0883-2927(90)90064-C.
Macchi, L., C.D. Curtis, A. Levison, K.Woodward, andC. R.Hughes, 1990, Chemistry, morphology, and distributionof illites from Morecambe gas field, Irish Sea, offshoreUnited Kingdom: AAPG Bulletin, v. 74, p. 296–308.
Maher, K., C. I. Steefel, D. J. DePaolo, and B. E. Viani, 2006,The mineral dissolution rate conundrum: Insights fromreactive transport modeling of U isotopes and pore fluidchemistry in marine sediments: Geochimica et Cosmo-chimica Acta, v. 70, p. 337–363, doi:10.1016/j.gca.2005.09.001.
Matthews, J. C., B. Velde, and H. Johansen, 1994, Significanceof K-Ar ages of authigenic illitic clay-minerals in sand-stones and shales from the North Sea: Clay Minerals,v. 29, p. 379–389, doi:10.1180/claymin.1994.029.3.09.
McHardy, W. J., M. J. Wilson, and J. M. Tait, 1982, Electronmicroscope and x-ray diffraction studies of filamentous il-litic clay from sandstones of theMagnus field:ClayMiner-als, v. 17, p. 23–29, doi:10.1180/claymin.1982.017.1.04.
Merino, E., P. Ortoleva, and P. Strickholm, 1983, Generationof evenly spaced pressure-solution seams during (late)diagenesis: A kinetic theory: Contributions to Mineral-ogy and Petrology, v. 82, p. 360–370
Meunier, A., 2006,Why are clay minerals small?: ClayMiner-als, v. 41, p. 551–566, doi:10.1180/0009855064120205.
Meunier, A., B. Velde, and P. Zalba, 2004, Illite K-Ar datingand crystal growth processes in diagenetic environments:A critical review: Terra Nova, v. 16, p. 296–304, doi:10.1111/j.1365-3121.2004.00563.x.
Midtbø, R. E. A., J. M. Rykkje, and M. Ramm, 2000, Deepburial diagenesis and reservoir quality along the easternflank of the VikingGraben. Evidence for illitization andquartz cementation after hydrocarbon emplacement:Clay Minerals, v. 35, p. 227–237, doi:10.1180/000985500546602.
Morton, A., C. Hallsworth, D. Strogen, A. Whitham, and M.Fanning, 2009, Evolution of provenance in the NEAtlantic rift: The Early–Middle Jurassic succession intheHeidrun field, Halten Terrace, offshoreMid-Norway:Marine and Petroleum Geology, v. 26, p. 1100–1117,doi:10.1016/j.marpetgeo.2008.07.006.
Morton, R. A., and L. S. Land, 1987, Regional variations information water chemistry, Frio Formation (Oligocene),Texas Gulf Coast: AAPG Bulletin, v. 71, p. 191–206.
Nadeau, P. H., and A. Hurst, 1991, Application of back-scattered electron microscopy to the quantification ofclay mineral microporosity in sandstones: Journal ofSedimentary Research, v. 61, p. 921–925.
Nagy, K. L., 1994, Application of morphological data ob-tained using scanning force microscopy to quantificationof fibrous illite growth rates, in K. L. Nagy and A. EBlum, eds., Scanning probe microscopy of clay minerals:CMS Workshop Lectures, Bloomington, Indiana, TheClay Minerals Society, v. 7, p. 204–239.

Oelkers, E. H., P. A. Bjørkum,O.Walderhaug, N. H. Nadeau,and W. M. Murphy, 2000, Making diagenesis obey ther-modynamics and kinetics: The case of quartz cementa-tion in sandstones from offshore mid-Norway: AppliedGeochemistry, v. 15, p. 295–309, doi:10.1016/S0883-2927(99)00047-5.
Palandri, J. L., and M. H. Reed, 2001, Reconstruction of insitu composition of sedimentary formation waters: Geo-chimica et Cosmochimica Acta, v. 65, p. 1741–1767,doi:10.1016/S0016-7037(01)00555-5.
Pallatt, N. M., M. J. Wilson, and W. J. McHardy, 1984, Therelationship between permeability and the morphologyof diagenetic illite in reservoir rocks: Journal of Petro-leum Technology, v. 36, p. 2225–2227.
Panda, M. N., and L. W. Lake, 1995, A physical model ofcementation and its effects on single-phase permeability:AAPG Bulletin, v. 79, p. 431–443.
Pevear, D. R., 1999, Illite and hydrocarbon exploration: Pro-ceedings of the National Academy of Science, U.S.A.,v. 96, p. 3440–3446.
Ramm, M., and A. E. Ryseth, 1996, Reservoir quality andburial diagenesis in the Statfjord Formation, North Sea:Petroleum Geoscience, v. 2, p. 313–324.
Robinson, A. G.,M. L. Coleman, and J. G. Gluyas, 1993, Theage of illite cement growth, Village fields area, southernNorth Sea: Evidence fromK-Ar ages and 18O/16O ratios:AAPG Bulletin, v. 77, p. 68–80.
Rossel, N. C., 1982, Clay mineral diagenesis in Rotliegendeolian sandstones of the southern North Sea: Clay Miner-als, v. 17, p. 69–77, doi:10.1180/claymin.1982.017.1.07.
Środoń, J., and D. D. Eberl, 1984, Illite, in S. W. Bailey, ed.,Micas: Reviews in Mineralogy, v. 13, p. 495–544.
Środoń, J., D. D. Eberl, and V. A. Drits, 2000, Evolution offundamental-particle size during illitization of smectiteand implications for reaction mechanism: Clays andClay Minerals, v. 48, p. 446–458, doi:10.1346/CCMN.2000.0480405.
Środoń, J., N. Clauer, andD.D. Eberl, 2002, Interpretation ofK-Ar dates of illitic clays from sedimentary rocks aided bymodeling: American Mineralogist, v. 87, p. 1528–1535.
Stalder, P. J., 1973, Influence of crystallographic habit andaggregate structure of authigenic clay minerals on sand-stone permeability: Geologie en Mijnbouw, v. 53, p. 217–220.
Steiger, R. H., and E. Jäger, 1977, Subcommission on Geo-chronology: Convention on the use on decay constantsin geo- and cosmochronology: Earth and PlanetaryScience Letters, v. 36, p. 359–362, doi:10.1016/0012-821X(77)90060-7.
Stroker, T., and N. Harris, 2009, K-Ar dating of authigenicillites: Integrating diagenetic history of the Mesa VerdeGroup, Piceance Basin, NWColorado (abs.): AAPGAn-nual Meeting Abstracts, v. 18, p. 206.
Szczerba, M., and J. Środoń, 2009, Extraction of diageneticand detrital ages of the 40Kdetrital/
40Kdiagenetic ratio fromK-Ar dates of clay fractions: Clays and Clay Minerals,v. 57, p. 93–103, doi:10.1346/CCMN.2009.0570109.
Thyne, G., B. P. Boudreau, M. Ramm, and R. E. Midtbø,2001, Simulation of potassium feldspar dissolution andillitization in the Statfjord Formation, North Sea: AAPGBulletin, v. 85, p. 621–635.
Walderhaug, O., 1994, Precipitation rates for quartz cementin sandstones determined by fluid-inclusion microther-mometry and temperature-history modeling: Journal ofSedimentary Research, v. A64, p. 324–333.
Walderhaug, O., 1996, Kinetic modeling of quartz cementa-tion and porosity loss in deeply buried sandstone reser-voirs: AAPG Bulletin, v. 80, p. 731–745.
Walderhaug, O., 2000, Modeling quartz cementation andporosity loss in Middle Jurassic Brent Group sandstonesof the Kvitebjørn field, northern North Sea: AAPG Bul-letin, v. 84, p. 1325–1339.
Walderhaug, O., and P. A. Bjørkum, 1998, Calcite cement inshallow marine sandstones: growth mechanisms andgeometry, in S. Morad, ed., Carbonate cementation insandstones: Distribution patterns and geochemical evo-lution: International Association of SedimentologistsSpecial Publication 26, p. 179–192.
White, A. F., and S. L. Brantley, 2003, The effect of time onthe weathering of silicate minerals: Why do weatheringrates in the laboratory and field?: Chemical Geology,v. 202, p. 479–506, doi:10.1016/j.chemgeo.2003.03.001.
Wilkinson, M., and R. S. Haszeldine, 2002a, Fibrous illite inoilfield sandstones—A nucleation kinetic theory ofgrowth: Terra Nova, v. 14, p. 56–60, doi:10.1046/j.1365-3121.2002.00388.x.
Wilkinson, M., and R. S. Haszeldine, 2002b, Problems withargon: K-Ar ages in Gulf Coast shales: Chemical Geol-ogy, v. 191, p. 277–283, doi:10.1016/S0009-2541(02)00145-6.
Worden, R. H., and S. Morad, 2000, Quartz cementation inoil field sandstones: A review of the key controversies, inR. H. Worden and S. Morad, eds., Quartz cementationin sandstones: International Association of Sedimentolo-gists Special Publication 29, p. 1–20.
Ylagan, R. F., D. R. Pevear, and P. J. Vrolijk, 2000, Discus-sion of “Extracting K-Ar ages from shales: A theoreticaltest”: Clay Minerals, v. 35, p. 599–604, doi:10.1180/000985500546918.
Zhu, C., 2005, In situ feldspar dissolution rates in an aquifer:Geochimica et Cosmochimica Acta, v. 69, p. 1435–1453, doi:10.1016/j.gca.2004.09.005.
Zwingmann, H., N. Clauer, and R. Gaupp, 1998, Timing offluid flow in a sandstone reservoir of the North GermanRotliegend (Permian) by K-Ar dating of related hydro-thermal illite, in J. Parnell, ed., Dating and duration offluid flow and fluid-rock interaction: Geological Society(London) Special Publication 144, p. 91–106.
Zwingmann, H., N. Clauer, and R. Gaupp, 1999, Structure-related geochemical (REE) and isotopic (K-Ar, Rb-Sr,d18O) characteristics of clay minerals from Rotliegendsandstone reservoirs (Permian, northern Germany):Geochimica et Cosmochimica Acta, v. 63, p. 2805–2823, doi:10.1016/S0016-7037(99)00198-2.
Lander and Bonnell 1187