A Grid-Friendly Plant - IEEE Power & Energy...
9
may/june 2014 IEEE power & energy magazine 87 1540-7977/14/$31.00©2014IEEE Digital Object Identifier 10.1109/MPE.2014.2302221 Date of publication: 17 April 2014 PLANT—© FOTOSEARCH, BACKGROUND—IMAGE LICENSED BY INGRAM PUBLISHING A A RECENT RAPID PHOTOVOLTAIC (PV) price reduction has significantly increased the competitiveness of PV-generated electricity, which has now reached grid parity in many markets, i.e., electricity is produced at the same or a lower price than conventional electricity sources. Along with other factors stimulating the global growth of renewable energy, this cost decline has greatly increased both the number and size of utility-scale solar plants, especially PVs, that are deployed on the power grid. The impact on power systems of integrating PV generation, especially as it relates to grid reliability and stability, needs to be addressed. A typical PV solar generation plant is composed of multiple individual “generators” connected to the electrical network via power electronics (inverters), rather than synchronous machines. The PV plant’s response to grid system disturbances is not similar to the inherent electromechanical dynamics of syn- chronous machines. Through sophisticated control functions, however, the PV plant is able to contribute actively to grid stability and reliability and operate effectively in the grid. A Grid-Friendly Plant The Role of Utility-Scale Photovoltaic Plants in Grid Stability and Reliability By Mahesh Morjaria, Dmitriy Anichkov, Vladimir Chadliev, and Sachin Soni
Transcript of A Grid-Friendly Plant - IEEE Power & Energy...

may/june 2014 ieee power & energy magazine 871540-7977/14/$31.00©2014IEEE
Digital Object Identifier 10.1109/MPE.2014.2302221
Date of publication: 17 April 2014
pla
nt
—©
fo
tos
ea
rc
h, b
ac
kg
ro
un
d—
ima
ge
lic
en
se
d b
y in
gr
am
pu
bli
sh
ing A
A Recent RApid photovoltAic (pv) price reduction has significantly increased the competitiveness of pv-generated electricity, which has now reached grid parity in many markets, i.e., electricity is produced at the same or a lower price than conventional electricity sources. Along with other factors stimulating the global growth of renewable energy, this cost decline has greatly increased both the number and size of utility-scale solar plants, especially pvs, that are deployed on the power grid. the impact on power systems of integrating pv generation, especially as it relates to grid reliability and stability, needs to be addressed.
A typical pv solar generation plant is composed of multiple individual “generators” connected to the electrical network via power electronics (inverters), rather than synchronous machines. the pv plant’s response to grid system disturbances is not similar to the inherent electromechanical dynamics of syn-chronous machines. through sophisticated control functions, however, the pv plant is able to contribute actively to grid stability and reliability and operate effectively in the grid.
A Grid-Friendly Plant
The Role of Utility-Scale Photovoltaic Plants in Grid Stability and Reliability
By Mahesh Morjaria, Dmitriy Anichkov, Vladimir Chadliev, and Sachin Soni
88 ieee power & energy magazine may/june 2014
A task force under the aegis of the north American electric Reliability corporation (neRc) has made several recommen-dations on specific requirements that such variable generation plants must meet to provide their share of grid support. these recommendations address grid requirements such as voltage control and regulation, voltage and frequency fault ride-through, reactive and real power control, and frequency response criteria in the context of the technical characteristics and physical capa-bilities of variable- generation equipment.
in this article, we describe our design of a grid-friendly pv plant, including the development of a plant controller that complies with these requirements, resulting in a pv plant that actively contributes to the reliability and stabil-ity of electrical transmission and distribution system. Field data from First Solar-developed utility-scale pv plants are used to illustrate the concepts. the grid-friendly pv plant also includes the ability to ride through specific low and high voltages or low- and high-frequency ranges.
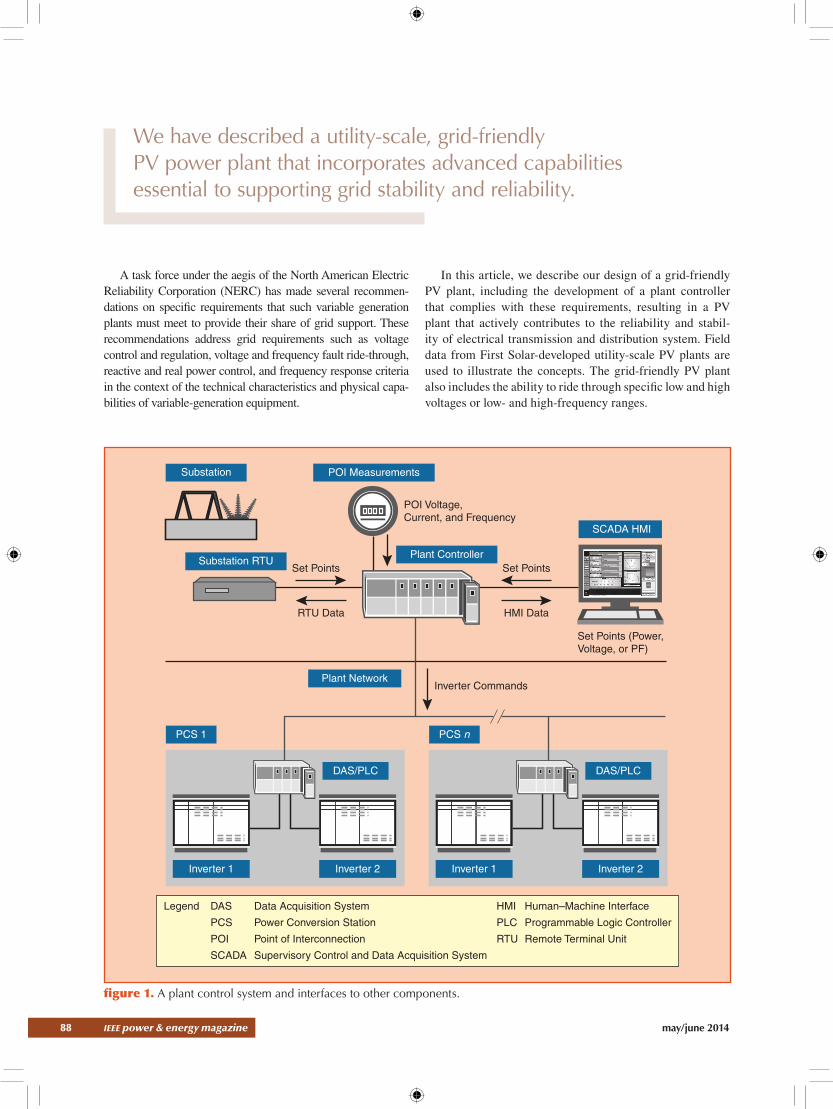
figure 1. A plant control system and interfaces to other components.
POI Voltage,Current, and Frequency
Set Points (Power, Voltage, or PF)
POI Measurements
Plant Controller
Plant Network
SCADA HMI
Substation
Substation RTU
Legend HMI Human–Machine InterfaceDAS Data Acquisition System
PCS Power Conversion Station PLC Programmable Logic Controller
POI Point of Interconnection RTU Remote Terminal Unit
SCADA Supervisory Control and Data Acquisition System
RTU Data HMI Data
Inverter Commands
Set PointsSet Points
DAS/PLC DAS/PLC
PCS 1 PCS n
Inverter 1 Inverter 2 Inverter 1 Inverter 2
We have described a utility-scale, grid-friendly PV power plant that incorporates advanced capabilities essential to supporting grid stability and reliability.

may/june 2014 ieee power & energy magazine 89
Power Plant Controller ArchitectureA key component of a grid-friendly pv power plant is a plant-level controller. it is designed to regulate real and reactive power output from the pv plant, such that it behaves as a single large generator. While the plant is com-posed of individual small generators (or, more specifically, inverters), with each generator performing its own energy production based on local solar array conditions, the func-tion of the plant controller is to coordinate the power output to provide typical large power-plant features such as active power control and voltage regulation (through reactive power regulation).
the plant controller provides the following plant-level control functions:
✔✔ dynamic voltage and/or power factor regulation of the solar plant at the point of interconnection (poi)
✔✔ real power output curtailment of the solar plant when required so that it does not exceed an operator- specified limit
✔✔ ramp-rate controls to ensure that the plant output does not ramp up or down faster than a specified ramp-rate limit, to the extent possible
✔✔ frequency control to lower plant output in case of over-frequency situation or increase plant output (if pos-sible) in case of under-frequency
✔✔ start-up and shut-down control.the plant controller implements plant-level logic and
closed-loop control schemes with real-time commands to the inverters to achieve fast and reliable regulation. it relies on the ability of the inverters to provide a rapid response to commands from the plant controller. typically there is one controller per plant controlling the output at a single high-voltage bus (referred to as poi). the commands to the plant controller can be provided through the supervisory control and data acquisition system (ScAdA) human-machine interface (hMi) or even through other interface equipment, such as a substation remote terminal unit.
Figure 1 illustrates a block-diagram overview of the con-trol system and its interfaces to other devices in the plant. the power plant controller monitors system-level measure-ments and determines the desired operating conditions of various plant devices to meet the specified targets. it man-ages capacitor banks and/or reactor banks, if present. it has the critical responsibility of managing all the inverters in the plant, continuously monitoring the conditions of the invert-ers and commanding them to ensure that they are producing
the real and reactive power necessary to meet the desired settings at the poi.
the plant operator can set an active power curtailment command to the controller. in this case, the controller calcu-lates and distributes active power curtailment to individual inverters. in general, the inverters can be throttled back only to a certain specified level of active power and not any lower without causing the dc voltage to rise beyond its operating range. therefore, the plant controller dynamically stops and starts inverters as needed to manage the specified active power
figure 2. An HMI screen on AVR modes.
Voltage Control
Automatic Voltage Regulation (AVR)
AVR Control Mode
Off
Mode Current Setpoint New Setpoint
528.0 kV kV528.0
0.98 0.98
0.2 MVar MVar0.2Var Mode
Power Factor Mode
On
ConfirmChanges
CancelChanges
–4 –2 0 2 4 6 8 10Time (s)
Pow
er F
acto
r
MV
ars
10
0
–10
–20
–30
–40
–50
1.000
0.995
0.990
0.985
0.980
Measured Power FactorCommanded Power FactorTotal Vars
figure 3. Dynamic power-factor regulation.
A typical PV solar generation plant is composed of multiple individual “generators” connected to the electrical network via power electronics.

90 ieee power & energy magazine may/june 2014
output limit. it also uses the active power management func-tion to ensure that the plant output does not exceed the desired ramp rates, to the extent possible. it cannot, however, always accommodate rapid reduction in irradiance due to cloud cover.
Dynamic Voltage Regulation Modesthrough the ScAdA hMi, the plant control system can be set to operate in one of the three modes of automatic voltage regulation (AvR): voltage regulation, power-factor regula-tion, or reactive-power control. the three AvR modes are illustrated in the ScAdA hMi screen shown in Figure 2. note that the plant can operate in only one of the three oper-ating modes at any time.
in the voltage-regulation mode, the controller maintains the specified voltage set point at the poi by regulating the reactive power produced by the inverters as well as other devices such as capacitor banks. in the power-factor regula-tion mode, the controller maintains the specified power fac-tor. the operation of the controller is illustrated in Figure 3, which shows field data from a pv plant producing about 212 MW of active power at that time.
Figure 3 illustrates the response of the plant when the power factor set point is changed from 0.98 to 1.0. the controller commands the inverters to change their reactive power output to meet the new power factor set point, using
a closed-loop control mecha-nism. the figure illustrates that the inverters respond very rap-idly. Within a few seconds (<4 s) the new set point is achieved in a closed-loop control mode. More specifically, the rise time to reach 90% of steady-state value shown in the figure is about 3.2 s.
Active Power Managementthrough the ScAdA hMi, the controller can also be set to con-trol the active power output of the plant. When the control system detects that the active power at poi exceeds the specified set point, it
figure 4. An active power curtailment HMI.
figure 5. Power curtailment at different levels.
figure 6. The impact of cloud passage under curtailment.
Active Power Curtailment
Current SP
Active Power Limit
Ramp Up Rate
Ramp Down Rate
290.00
15.0
15.0
290.00
15.0
15.0
MW
MW/min
MW/min
New SP
ConfirmChanges
CancelChanges
Time (min)
Power Curtailment at Different Levels
0 2 4 6 8 10 12 14 16 18 20
Ramp Rates Between Set Point Changes Are Controlled
Inverters Are Turned Down/Off to Curtail Output
Pow
er (
MW
)
Set
Poi
nt (
MW
)
100
95
90
85
80
75
70
100
95
90
85
80
75
70
Curtailed
TimeBlock
Pow
er
Pow
er
Increase in Power Limit
Additional Energy Captured
Plant Output Limit
PotentialPower
Output of Each Block Plant Output Power

may/june 2014 ieee power & energy magazine 91
calculates and sends the commands for each inverter individually to lower its output to achieve the desired set point, using a closed-loop control mechanism. note that, in some cases the plant controller will turn off certain inverters to achieve this desired set point since the output of each inverter cannot be lowered below a certain thresh-old without causing a high dc volt-age operating condition.
Figure 4 illustrates field data from a pv plant operating at around 90-MW power. the cur-tailment limit is initially changed from 100 to 82.5 MW. the plant controller turns down the invert-ers (and turns off some of them if required) to achieve the new set point. note that the turndown of power is gradual to meet the spec-ified ramp-rate limit.
the curtailment limit is reduced again to around 75 MW, and the controller responds as expected. When the limit is raised, the con-troller adjusts the output of the inverters to increase the total plant output. Finally, when the limit is raised to 100 MW, the plant is no longer curtailed since the plant is producing less than the limit.
in all the control actions, the con-troller’s command to each inverter is unique, given the specific conditions each inverter is experiencing. For example, when the plant is under curtailment, the plant controller can release the power limit of indi-vidual inverters if the total output of the plant starts falling below the set point. So in case of a cloud passage, which results in a reduction of the output of a part of the plant, the con-troller can make the adjustment to increase the output of other inverters that are not impacted.
the plant-level control strategy results in a capture of energy from inverters that would have been otherwise unnecessarily cur-tailed. this concept is illustrated in Figure 5. the left side of the figure represents the reduction in power output of some of the inverters (grouped in blocks for illustration purposes) due to partial cloud cover. the controller commands other inverters
that are not impacted by the cloud cover to dynamically increase their previously curtailed limit. Since the total potential power of the plant is greater than the specified plant output limit (as illustrated on the right-hand side of Figure 5), the plant is able to output the total power all the way to the limit.
figure 7. Plant shut-down and start-up controls.
figure 8. The frequency droop function.
Stopping and Starting One Block (30 MW)
0 1 2 3 4 5 6 7 8 9 10
Source: Agua Caliete PV Plant in Yuma, Arizona, USA 13 March 2012 ~90 MW Online
Inverters AreStarted inSequence
Plant Stop Command
Plant Start Command
Inverters Are Turned Off in Sequence;Ramp Rates Are Controlled
Pow
er (
MW
)
Com
man
ded
(MW
)
Time (min)
Low Irradiance
90
85
80
75
70
65
60
55
90
85
80
75
70
65
60
55
Frequency Droop Parameters
MW
Droop
Droop
Hz
Hz
Hz
Hz
MW
MW
%
0.036
61.500
58.500
290.0
10.0
5.0
Frequency Deadband
High Limit
Low Limit
Active Power High Limit
Active Power Low Limit
Frequency Droop
Deadband
Deadband
High LimitsLow
Limits Decrease ActivePower in Case ofHigh Frequency

92 ieee power & energy magazine may/june 2014
An illustration of an additional function related to active power management is shown in Figure 6, which shows the reaction of the plant when it is shut down and started up. the field data in this case illustrates when one block (30 MW), which is under the control of the plant controller, is commanded to shut down. the active power manage-ment function reduces plant output while maintaining the
required ramp rate. As mentioned earlier, some inverters are turned down while others are shut down. note that the control is quite effective even with moderately varying irra-diance conditions.
Figure 7 also illustrates the plant start command resulting in the controller gradually increasing the plant output by adjusting the inverters’ output and turning on the inverters in sequence.
figure 9. An overall model structure of a solar PV plant.
figure 10. An REPC_A model block diagram.
Vreg
Freg
Vref
Pref
Qref
Qext
Vt Vt
Iqcmd Iq
Ip
Fref
Pref
Qbranch
Pbranch
REPC_A REEC_B REGC_A
Plant-LevelV/Q Control
QControl
PControl
Plant-LevelP Control
′
Ipcmd′
Iqcmd
Ipcmd
CurrentLimitLogic
GeneratorModel
NetworkSolution
Pqflag
Ibranch VcompFlag
RefFlag
Freg_flag
Qbranch
Pbranch
Freg
Freg_ref
Qref
Kc
VregVreg – (Rc + jXc) × Ibranch
1
10
0
1
0
+
+
+
–
–
+∑
∑∑
∑
∑
∑
11 + sTfltr
11 + sTp
11 + sTfltr
11 + sTlag
1 + sTft
1 + sTiv
dbd emax
Qext
emin
femin
femax
Pmax
Pmin
Qmin
Qmax
Freeze State IfVreg < Vfrz
Kp +Ki
S
Kpg +Kig
S
Plant_Pref
+–
fdbd1, fdbd2 Ddn
Dup
0
0
+
+
+
+– Pref
The grid-friendly PV plant also includes the ability to ride through specific low and high voltages or low- and high-frequency ranges.

may/june 2014 ieee power & energy magazine 93
Frequency Droop Controlthe control system also pro-vides frequency droop control to handle unusual grid situations. For example, in case of above-normal frequency, the control-ler will reduce the active power of the plant, as illustrated in Figure 8. if the plant is under curtailment, the power can also be increased if the below-normal frequency is detected. note that all the param-eters illustrated in the figure are configurable and are shown here for illustrative purposes only.
Fault Ride-Through CapabilityA significant benefit of utility-scale pv systems that incorpo-rate fault ride-through capability is that they do not trip off during system disturbances but continue to provide power when the grid needs it. the ability to ride through specific low and high voltages or low- and high-frequency ranges is being designed effectively into all modern variable generators. Most utility-scale inverters have this capability. With proper design practices, the pv plant is engineered to ensure that all com-ponents in addition to inverters also have the ability to ride through short-term grid events.
Modeling and ValidationA general structure of a pv power plant recommended by the Western electricity coordinating council (Wecc) is shown in Figure 9. For the simplification of a solar pv plant, the dynamics related to the dc side of the inverter (pv array dynamics, inverter dc link, and voltage regulator) are ignored. the overall model structure shown in Figure 9 represents the complete pv plant and consists of an equiva-lent generator model “ReGc_A” to provide current injec-tions into the network solution, an electrical control model “Reec_B” for local active and reactive power control, and a centralized plant controller model “Repc_A” to allow for plant-level active and reactive power control.
Power Plant Controller Modelthe plant controller model Repc_A is used when plant-level control of active and/or reactive power is desired. A func-tional block diagram for Repc_A model is shown in Figure 10. the model incorporates the following functionalities Renewable energy Modeling task Force (Wecc-ReMtF):
✔✔ closed-loop voltage regulation at a user-designated bus with the provisions for line drop compensation, voltage droop response, and a user-settable dead-band on the voltage error signal.
✔✔ closed-loop reactive power regulation on a user-des-ignated branch with a user-settable dead-band on the reactive power error signal.
✔✔ A plant-level governor response signal derived from frequency deviation from the nominal user-designated branch. the frequency droop response can be applied to active power flow on a user-designated branch. Fre-quency droop control is capable of being activated in both over and under frequency conditions. the fre-quency deviation applied to the droop gain can be subject to a user-settable dead-band.
Test Model Descriptionthis section demonstrates the outcome from a set of field tests performed at a pv plant when operating at 90-MW active power output. the test plant equivalent model is config-ured as shown in Figure 11, where multiple medium-voltage
figure 11. A single-machine equivalent load flow representation.
figure 12. A PSLF equivalent model for a plant under test.
InterconnectionTransmission
Line
StationTransformer
CollectorSystem
Equivalent
EquivalentPad-MountedTransformer
kV, R, X, B kV, MVA, R, X kV, MVA, R, X PV SystemEquivalent
Plant-LevelReactive
Compensation
POI or Connection toTransmission System
kV, R, X, BPV
90.09.6
90.00
2
3
9.6337.741.007
34.621.003
89.758.35
89.758.35
89.5813.20
89.58
13.20
89.54
4 5
9.58
89.54
9.57
89.54
9.55
89.5412-MVar Cap Bank
9.541
Grid525.01.050
525.01.050
1
PV Plant 0.3281.011
1
1.00
0
1.00
0
1

94 ieee power & energy magazine may/june 2014
feeders are equivalenced at one collector, a 34.5-kv bus at the low side of the plant substation transformer. load-flow model equivalencing is performed using the method sug-gested in the Wecc modeling guide for solar pv plants Modeling and validation Work Group/technical Studies Subcommittee.
this plant uses SMA 800-kvA inverters controlled by First Solar’s power plant controller. the power plant control-ler allows for coordination of all online inverters for plant-level voltage regulation at the poi, located at the 500-kv substation bus. the purpose of testing at this plant is for the model validation of First Solar’s controller against Wecc’s proposed power plant controller. data captured from the field tests were filtered and then compared to simulation results obtained from a plant model built in Ge’s positive Sequence load Flow (pSlF) simulation software. A single-line dia-gram of the plant model in pSlF is shown in Figure 12. A 12-Mvar capacitor bank switching test is performed to examine the plant controller performance.
in the test system, a 12-Mvar capacitor bank, located at the 34.5-kv collector bus, is engaged as an external stimulus. Figure 13 illus-trates that, when the capacitor bank is engaged at “t = 0” s relative time, the power plant controller sends control signals to each individual inverter to immediately address this switching event, and eventually inverters reactive power contribu-tion to the plant drops. First Solar’s power plant controller reactive power command (Qcmd_actual) distributed to the individual invert-ers is shown in green in Figure 13. Both field measured reactive power command (Qcmd_actual) and sim-ulated model command (Qcmd_simulation) are shown in Figure 13. the figure illustrates the initial quick response by the pv plant, which took almost 100 ms, followed by the dominance of the power plant controller in the order of seconds, to maintain post-disturbance stability.
Figure 14 shows the detailed plant-reactive power response to capacitor switching. this figure illustrates that the simulation model performance adequately mimics actual plant behavior. the response closely matches actual behavior, with a difference immediately fol-lowing the switching operation that could be attributed to the lower sam-
pling rate in the field measurement than in pSlF simulation.
Daily Grid OperationAnother grid integration concern, especially for a grid operator, is daily load balancing. Solar generation is a type of variable power generation that is not fully dispatch-able since the energy source is influenced by the presence of solar radiation and by atmospheric conditions. Reliable power-system operation requires the continuous balance of supply and demand. to successfully manage a variable gen-eration source like solar, grid operators treat pv generation as “negative” load, and they utilize short-term forecasts to schedule and dispatch compensatory controllable resources. the operators are already familiar with a certain amount of variability and uncertainty, particularly with system load (or demand). they have successfully utilized a variety of tools such as generator and transmission flexibility, ancillary ser-vices, and demand-side resources to achieve reliable sys-tem operation. the growing sophistication and accuracy of
15.0
12.0
9.0
6.0
3.0
–3.0
–6.0
–9.0
–12.0–5.90 –4.40 –2.90 –1.40 0.10 1.60 3.10 4.60 6.10 7.60
Relative Time (s)
Rea
ctiv
e P
ower
(M
Var
)
Field Test Versus Model Simulation for 12-MVar Capacitor Bank Switching
Capacitor Bank Switched Online
Inverter Vars (Measured)Inverter Vars (Simulated)Cap Bank Switching
0.0
Capacitor Bank Switched Online
Inverter Vars (Measured)Inverter Vars (Simulated)Cap Bank Switching
figure 14. Inverter VARs during a 12-MVar cap bank switching test.
15.0
12.0
9.0
6.0
3.0
–3.0
–6.0
–9.0
–12.0–1.10 0.40 1.90 3.40 4.90 6.40 7.90
Relative Time (s)
Rea
ctiv
e P
ower
Com
man
d (M
Var
)
Slower Plant Level Response
Fast Initial Response
Field Test Versus Simulation for 12-MVar Capacitor Bank Switching
Capacitor Bank Switched Online
Cap Bank SwitchingQcmd_actualQcmd_simulation
0.0
figure 13. The Qcmd response field test versus simulation.

may/june 2014 ieee power & energy magazine 95
short-term solar generation forecasts is facilitating continued efficient and reliable system operations. By providing pv plants that can support the forecasting needs of grid opera-tors, this variable resource can address the load-balancing needs of grid operators. An advantage of solar in many mar-kets is that its peak generation coincides with higher load demand, making it more a valuable generation resource.
Grid Flexibility and Power Systems Resource PlanningAs the proportion of variable generation increases in the overall generation portfolio, another integration concern is that greater grid flexibility is required to provide the neces-sary power backup when the variable generation resource is not adequate to meet the demand. this dictates an increased use of conventional resources that are able to respond and ramp up more quickly and a reduced use of inflexible gen-eration resources. A recent analysis points out “that planning the lowest-cost, lowest-risk investment route aligns with a low-carbon future. From a risk management standpoint, diversifying utility portfolios today by expanding invest-ment in clean energy and energy efficiency makes sense regardless of how and when carbon controls come into play. placing too many bets on the conventional basket of genera-tion technologies is the highest risk route.”
SummaryWe have described a utility-scale, grid-friendly pv power plant that incorporates advanced capabilities essential to supporting grid stability and reliability. it includes features such as voltage regulation, active power controls, ramp-rate controls, fault ride through, and frequency control. these capabilities provide the intrinsic benefits of reliable plant operation in the grid, which in turn results in additional plant yield and potential additional revenue. Such capa-bilities are essential for successful the deployment of large-scale pv plants.
A key component of such a grid-friendly plant is a plant-level controller specifically engineered to regulate real and reactive power output of the solar facility such that it behaves as a single large conventional generator, although within the limits dictated by the intermittent nature of the solar resource. in cases where the plant output is constrained but the plant has additional generation capability, this controller
can reduce the impact of cloud passage and increase over-all yield. plant-model validation against measured field data demonstrates that the Wecc-proposed model for a solar pv plant is adequately capturing actual plant behavior.
For Further ReadingR. Binz. (2012. Apr.). practicing risk aware electricity regu-lation: What every state regulators need to know. A ceres Report. [online]. Available: http://www.ceres.org/resources/reports/practicing-risk-aware-electricity-regulation
M. G. lauby, M. Ahlstorm, d. l. Brooks, S. Beuning, J. caspray, W. Grant, B. Kirby, M. Milligan, M. o’Malley, M. patel, R. piwko, p. pourbeik, d. Shirmohammadi, and J. c. Smith., “Balancing act,” IEEE Power Energy Mag., vol. 9, no. 6, pp. 75–85, nov./dec. 2011.
Modeling and validation Work Group/technical Stud-ies Subcommittee. (2011, Jan.). [online]. Available: https://www.wecc.biz/committees/Standingcommittees/pcc/tSS/MvWG/Shared%20documents/MvWG%20Approved%20documents/ Wecc%20pv%20plant%20power%20Flow%20Modeling%20Guide.pdf
R. piwko, A. ellis, R Walling, B. Zavadil, d. Jacobson, M. patel, d. Brooks, B. nelson, J. Macdowell, c. Barker, e. v. engeln, e Seymour, l. casey, e. John, W. peter, W. lasher, c. loutan, l. dangelmaier, e. Seymour, and M. Behnke. (2012, Mar.). Special reliability assessment: interconnection require-ments for variable generation. neRc. [online]. Available: http://www.nerc.com/comm/pc/integration%20of%20vari-able%20Generation%20task%20Force%20ivGt/Sub%20teams/interconnection/neRc_ivGtF_1-3_dRAFt.pdf
Wecc Renewable energy Modeling task Force. (2012, Sept.). [online]. Available: https://www.wecc.biz. https://www.wecc.biz/committees/Standingcommittees/pcc/tSS/MvWG/Shared%20documents/MvWG%20Approved%20documents/Wecc%20Solar%20pv%20dynamic%20Model%20Specification%20-%20September%202012.pdf
BiographiesMahesh Morjaria is with First Solar, tempe, Arizona.
Dmitriy Anichkov is with First Solar, tempe, Arizona.Vladimir Chadliev is with First Solar, tempe, Arizona.Sachin Soni is with Arizona State University, tempe,
Arizona. p&e
In all the control actions, the controller’s command to each inverter is unique, given the specific conditions each inverter is experiencing.