Generation to Come T - IEEE Power & Energy...
15
november/december 2014 IEEE power & energy magazine 63 1540-7977/14©2014IEEE Digital Object Identifier 10.1109/MPE.2014.2347612 Date of publication: 20 October 2014 OIL CAN & GRID LICENSED BY GRAPHIC STOCK, POWER LINE & TOWER: ©ARTVILLE, LLC. T THIS ARTICLE DESCRIBES THE NATIONAL FUEL MIX and electric system plans of South Korea. The country’s recent energy history is presented first, followed by a brief introduction to two important national energy plans: the Second National Basic Energy Plan (NBEP) of 2013 and the Sixth National Basic Plan for Electrical Energy Supply and Demand of 2012. Analyses of historical fuel data and the electric system in South Korea are summarized, and the interactions are discussed. South Korea: An Oil and Natural Gas Importer Without Domestic Resources Production South Korea possesses energy resources in the form of coal, hydro, and renewable energy. Other energy resources, such as oil Generation to Come Natural Gas and Electric System Interactions in South Korea By Jaeseok Choi
-
Upload
nguyendung -
Category
Documents
-
view
213 -
download
0
Transcript of Generation to Come T - IEEE Power & Energy...

november/december 2014 ieee power & energy magazine 631540-7977/14©2014IEEE
Digital Object Identifier 10.1109/MPE.2014.2347612
Date of publication: 20 October 2014
OIL
CA
N &
GR
ID L
ICE
NS
ED
BY
GR
AP
HIC
STO
CK
, P
OW
ER
LIN
E &
TO
WE
R: ©
AR
TV
ILLE
, LLC
.
TTHIS ARTICLE DESCRIBES THE NATIONAL FUEL MIX and electric system plans of South Korea. The country’s recent energy history is presented fi rst, followed by a brief introduction to two important national energy plans: the Second National Basic Energy Plan (NBEP) of 2013 and the Sixth National Basic Plan for Electrical Energy Supply and Demand of 2012. Analyses of historical fuel data and the electric system in South Korea are summarized, and the interactions are discussed.
South Korea: An Oil and Natural Gas Importer Without Domestic Resources ProductionSouth Korea possesses energy resources in the form of coal, hydro, and renewable energy. Other energy resources, such as oil
Generation to Come
Natural Gas and Electric System Interactions in South Korea
By Jaeseok Choi

64 ieee power & energy magazine november/december 2014
and natural gas, are imported. The energy situation, electric supply, and economic condition of the country therefore are all linked with the mar-ket prices of imported resources.
Figure 1 is a map of major coal-fields in South Korea. As shown in the figure, the nation’s coal reserves are widely distributed. Because do-mestic coal is available, coal was the most important fuel in the country until 1970. Despite its low quality (yielding only 3,000–4,500 kcal/kg), domestic coal was used as a home heating fuel in winter and in electric power plants until the 1980s. After the domestic peak coal demand of 26.9 million tons occurred in 1986, domestic coal production decreased rapidly, and most domestic coal mines were closed because of their relatively expensive production costs. Coal-fired power plants then started importing high-quality coal instead of using domestic coal. Total coal consumption still increased while the domestic coal con-sumption decreased in the country after 1986.
Total energy consumption in South Korea over the last 50 years has continued to grow, as shown in Figure 2. To keep up with this growing energy demand, the country imported oil and liquefied natural gas (LNG). In 2010, South Korea was the fifth-largest net importer of oil in the world and was a significant importer of LNG. Although oil consumption has been gradually declin-ing in recent years, the majority of the energy consumption in South Korea uses oil as a fuel.
The Oil Crises: Lessons LearnedThe oil crises of the 1970s (those of 1973 and 1978) prompted South Korea to implement a national energy mix strategy and policy emphasizing diversity in the kinds and supply of energy resources. After the 1973 crisis, this strat-egy led to the construction of new nuclear power plants, LNG thermal power plants, and coal power plants. The national policy continues to be an effective strategy for sustaining energy flexibility.
The energy balance and flow in South Korea for 2012 are shown in Figure 3. Most of the LNG was imported from Indonesia, Oman, and Qatar. LNG contributed 18% of the total primary energy consumed in South Korea, a figure in excess of the nuclear contribution of 11.38%. The transpor-tation sector consumes about 18% of the nation’s total final energy, and the industrial sector consumes 62%. The two
figure 2. Energy consumption in South Korea, 1960–2010 (source: Apollo Investment Management).
figure 1. The major South Korean coalfields, which are among the country’s main energy production resources.
Pocheon
Gangneung
Gangneung
SamcheokSamcheok
Jeongseon
Bukpyeong
Mungyeong
Gyeongju
PohangDaeguGimcheon
Jeonbuk
Honam
GwangjuMasan
Ulsan
BusanMokpo
Chungnam
Gunsan
Jeonju
SuwonIncheon
SeoulGyeonggi
Boeun
Danyang
Danyang
Yeongwol
111
2
3 134
5
6
7
12
8
9
10
Gangneung
Samcheok
Jeongseo
Bukpyeong
Mungyeong
Boeun
Gyeongju
Jeonbuk
Honam
Chungnam
Gyeonggi
Danyang
Yeongwol
1
2
3
4
5
6
7
8
9
10
11
12
13
Tertiary Rock Jurassic Rock Permian Rock
Jeongseon
Yeosu
2009: Total Energy Consumed Increased by 0.5%
1960 1970
South Korea: Consumption
HydroGasOilCoalNuclear
1980 1990 2000 2010
1960 1970 1980 1990Year
Data: BP Statistical Review 2010Graphic: mamzamascience.com
2000 2010
00
20
Mill
ion
Tons
Oil
Equ
iv. p
er Y
ear
4060
8010
050
100
150
200
Mto
e
HydroGasOilCoalNuclear

november/december 2014 ieee power & energy magazine 65
largest consumers of final electri-cal energy are the industrial sec-tor (approximately 53.4%) and the commercial sector (26.4%).
The energy-related general historical outlook data are given in Figures 4–7. Figure 4 shows the exchange rate history for the South Korean won (KRW) and the U.S. dollar over the last 25 years. The KRW is the monetary unit of the Republic of Korea (South Ko-rea). The KRW averaged 989.06 to the U.S. dollar from 1981 until 2014, reaching an all-time high of 1,962.50 in December 1997 and a record low of 667.20 in July 1989. As of 5 June 2014, the currency rate was 1,020 KRW per U.S. dol-lar. Figures 5, 6, and 7 show the trend in primary energy supply and GDP, energy intensity by country, and energy consumption per capita by country over the last 30 years, respectively. The data reveal that the energy consumption density and efficiency in South Korea is low relative the figures for other developed countries. South Korea is therefore exerting considerable effort to achieve higher energy
figure 3. Energy balance and flow in South Korea, 2012.
Imports Primary Energy
278.7 mil. toe(100%)
70.6 mil. toe(25.3%)
Transformation Final Energy
208.1 mil. toe(74.7%)
Overseas Dependence96% (US$184.8 billion)
Crude OilMiddleEast (85.1%)
Asia (9.3%)Africa (1%)Qatar, Oman,Indonesia
Australia, China,Indonesia
Russia,United States,Australia
China, Australia,Vietnam
Domestic Production 4%
36.2 mil. t
927 mil. bbl
114.6 mil. t
748.3 t U
8.1 mil. t
Uranium
-Saudi (32%)-UAE (9.1%)-Kuwait (14.5%)
Oil
LNG
Bituminous
Nuclear
AnthraciteHydro
Renewable3.46%
2.1%
11.38%
26.96%
18.01%
38.09%
Refining 3 mil. b/d
19.6 mil. t
Town Gas
Heat
Electricity
Electricity
Industrial 61.64%
Naphtha etc.IndustrialResource22.08%
Residential10.24%
Commercial7.96%
Transportation17.85%
Public 2.29%
Indu
stria
l53
.4%
Pub
lic 6
.1%
Tran
spor
tatio
n0.
5%
Res
iden
tial
13.6
%C
omm
erci
al26
.4%
1,751.2 thou. toe
5,095.7 bil. kWh
NuclearBituminousLNGOilAnthraciteHydroRenewable
29.5%37.6%22.4%5.5%1.4%1.5%2.1%
2,000
1,800
1,600
1,400
1,200
1,000
800
600
1993
-02-
26
1997
-04-
30
2001
-06-
29
2005
-08-
31
2009
-10-
30
2013
-12-
31
2,000
1,800
1,600
1,400
1,200
1,000
800
600
1,200,000
1,000,000
800,000
600,000
400,000
200,000
0
81 82 83 84 85 86 87 88 89 90 91 92 93 94 95 96 97 98 99 00 01 02 03 04 05 06 07 08 09 10 11 12
0
50
100
150
200
250
300
(mil.
toe)
(bil.
KR
W)
GFP (2005 Prices)Primary Energy Supply (= PES)
figure 4. The currency exchange rate: number of KRW equivalent to US$1, 1989–2013.
figure 5. South Korean trends in primary energy supply and GDP, 1981–2012.

66 ieee power & energy magazine november/december 2014
efficiency by investing in industrial energy systems, demand response, R&D, social systems (including residential, com-munication, and traffic systems), and energy management systems. As a result, R&D has focused on achieving higher energy consumption efficiency of both systems and devices. In the near future, energy efficiency resource standards (EERSs) will be adopted.
History of Natural Gas in South Korea
General LNG HistoryLNG is a form of natural gas that can be transported over long distances; it is typically regasified prior to end use. South Korea started importing LNG in 1986, and LNG has been in the lead position for national energy consumption since then. Figure 8 shows the relative proportions of LNG consumption dedicated to town gas (retail consumption) and gas used for generating elec-tricity in South Korea during the period 1986–2011. As mentioned above, LNG accounted for 18% of total energy consumption in 2012, as compared with 16.3% in 2010. LNG is clearly a stable and significant portion of the total incremental energy consumed by South Korea as its economy continues to grow. The annual average consumption growth rates for the country’s six principal energy sources are shown in Table 1. The yearly consumption rate of LNG has exceeded 18.7% over the past ten years. Over the past 15 years, its consumption as the primary energy source, along with electrical energy, has increased at a yearly average rate of 3.5% (excluding a period from 2009 through early 2010, when a foreign monetary crisis occurred, called the “IMF period” in the country), and LNG consumption is expected to reach 39.8 mil-lion metric tons of oil equivalent (toe) in 2015.
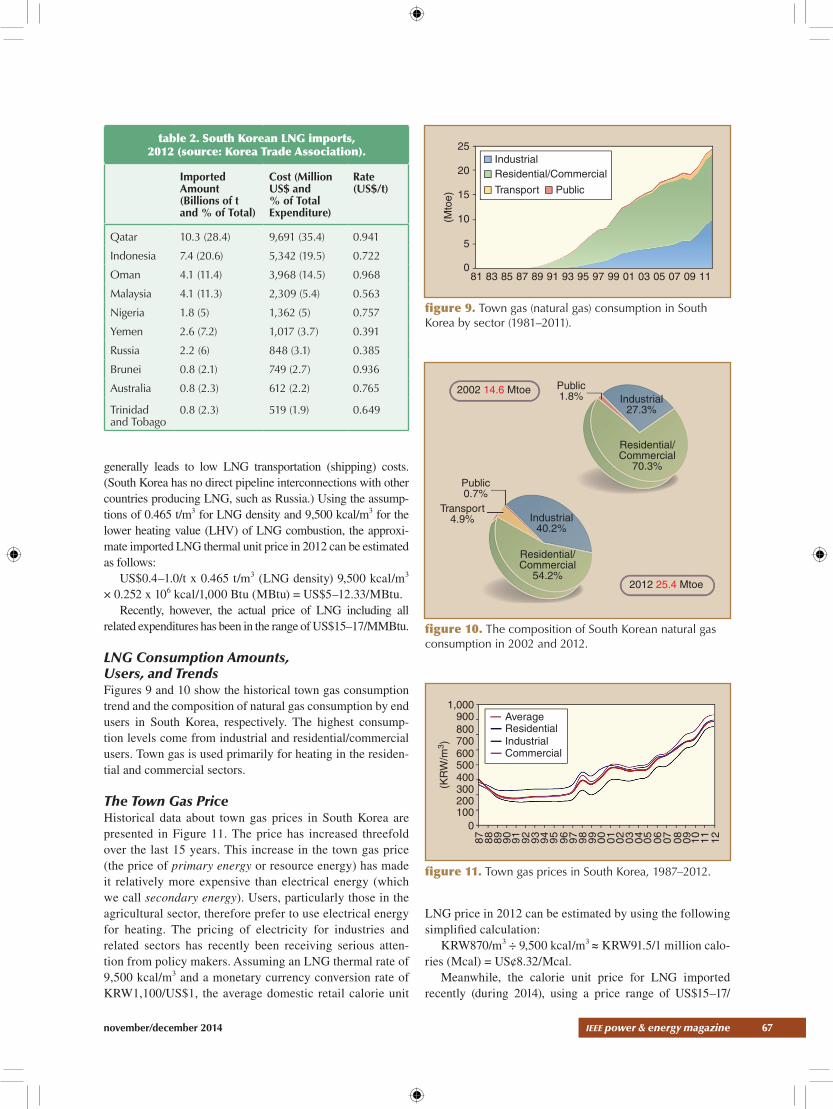
LNG Imports Table 2 shows LNG imported by South Korea in 2012. The main sources of LNG are imported from Qatar, Indonesia, Oman, and Malaysia, which respectively accounted for approxi-mately 28.4%, 20.6%, 11.4%, and 11.3% of total LNG imports in 2012. Although LNG transportation fees affect the price of LNG, South Korea has a favorable geographical location that
Energy Intensity by Country(1980,1990, 1995, 2000, 2010, 2012e)
0.35
0.3
0.25
0.2
0.15
0.1
0.05
00
5,00
0
10,0
00
15,0
00
20,0
00
25,0
00
30,0
00
35,0
00
40,0
00
45,0
00
Ene
rgy
Inte
nsity
(to
e/U
S$1
,000
)
GDP Per Capita (US$ 2006)
Korea Japan USGermany Italy UK
figure 6. Energy intensity in selected industrialized coun-tries, 1980–2012.
Energy Consumption per Capita by Country(1980,1990, 1995, 2000, 2010, 2012e)
10
89
76
45
3
12
00
5,00
0
10,0
00
15,0
00
20,0
00
25,0
00
30,0
00
35,0
00
40,0
00
45,0
00
Ene
rgy
per
Cap
ita (
toe)
GDP Per Capita (US$ 2005)
figure 7. Energy consumption per capita for selected industrialized countries, 1980–2012.
table 1. Annual average energy consumption growth rates in South Korea by energy source, 1991–2011.
Energy Sources
Yearly Average Consumption Rate (%)
1991–2000 2001–2011
Coal 4.4 6.3
Oil 7.6 0.7
LNG 20.1 8.5
Hydro –1.3 3.3
Nuclear 7.5 3
Renewable 10.3 10.9
Total 6.9 3.9
40,000
30,000
20,000
10,000
-
1987
1988
1989
1990
1991
1992
1993
1994
1995
1996
1997
1998
1999
2000
2001
2002
2003
2004
2005
2006
2007
2008
2009
2010
2011
103
Ton
Town GasGas for Generation
figure 8. LNG consumption configuration in South Korea, 1987–2011.
november/december 2014 ieee power & energy magazine 67
generally leads to low LNG transportation (shipping) costs. (South Korea has no direct pipeline interconnections with other countries producing LNG, such as Russia.) Using the assump-tions of 0.465 t/m3 for LNG density and 9,500 kcal/m3 for the lower heating value (LHV) of LNG combustion, the approxi-mate imported LNG thermal unit price in 2012 can be estimated as follows:
US$0.4–1.0/t x 0.465 t/m3 (LNG density) 9,500 kcal/m3
× 0.252 x 106 kcal/1,000 Btu (MBtu) = US$5–12.33/MBtu.Recently, however, the actual price of LNG including all
related expenditures has been in the range of US$15–17/MMBtu.
LNG Consumption Amounts, Users, and TrendsFigures 9 and 10 show the historical town gas consumption trend and the composition of natural gas consumption by end users in South Korea, respectively. The highest consump-tion levels come from industrial and residential/commercial users. Town gas is used primarily for heating in the residen-tial and commercial sectors.
The Town Gas PriceHistorical data about town gas prices in South Korea are presented in Figure 11. The price has increased threefold over the last 15 years. This increase in the town gas price (the price of primary energy or resource energy) has made it relatively more expensive than electrical energy (which we call secondary energy). Users, particularly those in the agricultural sector, therefore prefer to use electrical energy for heating. The pricing of electricity for industries and related sectors has recently been receiving serious atten-tion from policy makers. Assuming an LNG thermal rate of 9,500 kcal/m3 and a monetary currency conversion rate of KRW1,100/US$1, the average domestic retail calorie unit
LNG price in 2012 can be estimated by using the following simplified calculation:
KRW870/m3 ÷ 9,500 kcal/m3 ≈ KRW91.5/1 million calo-ries (Mcal) = US¢8.32/Mcal.
Meanwhile, the calorie unit price for LNG imported recently (during 2014), using a price range of US$15–17/
figure 9. Town gas (natural gas) consumption in South Korea by sector (1981–2011).
25
20
15
10
5
081 83 85 87 89 91 93 95 97 99 01 03 05 07 09 11
IndustrialResidential/Commercial
Transport Public
(Mto
e)
table 2. South Korean LNG imports, 2012 (source: Korea Trade Association).
Imported Amount (Billions of t and % of Total)
Cost (Million US$ and % of Total Expenditure)
Rate (US$/t)
Qatar 10.3 (28.4) 9,691 (35.4) 0.941
Indonesia 7.4 (20.6) 5,342 (19.5) 0.722
Oman 4.1 (11.4) 3,968 (14.5) 0.968
Malaysia 4.1 (11.3) 2,309 (5.4) 0.563
Nigeria 1.8 (5) 1,362 (5) 0.757
Yemen 2.6 (7.2) 1,017 (3.7) 0.391
Russia 2.2 (6) 848 (3.1) 0.385
Brunei 0.8 (2.1) 749 (2.7) 0.936
Australia 0.8 (2.3) 612 (2.2) 0.765
Trinidad and Tobago
0.8 (2.3) 519 (1.9) 0.649
2002 14.6 Mtoe
2012 25.4 Mtoe
Industrial40.2%
Industrial27.3%
Public0.7%
Public1.8%
Transport4.9%
Residential/Commercial
54.2%
Residential/Commercial
70.3%
figure 10. The composition of South Korean natural gas consumption in 2002 and 2012.
1,000
(KR
W/m
3 )
900800700600500400300200100
0
87 88 89 90 91 92 93 94 95 96 97 98 99 00 01 02 03 04 05 06 07 08 09 10 11 12AverageResidentialIndustrialCommercial
figure 11. Town gas prices in South Korea, 1987–2012.

68 ieee power & energy magazine november/december 2014
MBtu and an exchange rate of KRW1,020/US$1, can be cal-culated as follows:
US$15–17/MBtu¸ 250 Mcal/MBtu ≈ KRW60–68/Mcal = US¢5.88–6.67/Mcal.
The Natural Gas Pipeline MapFigure 12 shows the natural gas pipeline network used for delivery and distribution of virtually all the natural gas (99.9%) in South Korea and the LNG terminals in South Korea. The LNG pipeline system is analogous to a vehicle highway network rather than the electrical transmission system. Since 70% of the land the system occupies lies in mountainous areas of South Korea, the availability of rights-of-way for both vehicle highways and gas pipelines is lim-ited by the geography; electrical transmission lines, on the other hand, may be constructed over mountains. But it should be noted that underground gas pipelines have more flexibil-ity for siting compared to overhead high-voltage electrical transmission lines, especially for 765-kV transmission. LNG storage is compatible with heating use by consumers as well as large-scale LNG-fueled electrical power plants in large metropolitan cities (e.g., Seoul and Busan). (See Figure 24, which describes the power system in South Korea.) The gas network in the country is in a “loop type” configuration, as
compared with the parallel lines used only for long- distance ship-ping (transmission) of natural gas. In this sense, Korea’s high-pres-sure gas network may be regarded as a distribution network rather than a transmission network for natural gas.
Long-Term Demand Forecast for Natural Gas Table 3 shows the current long-term demand forecast for natural gas in South Korea. The total natu-ral gas demand of 38.287 million t in 2012 is projected to decrease to 37.699 million t by 2027. While the town gas demand of 20.108 million t in 2012 is forecast to grow to 29.943 million t by 2027, natural gas demand for electrical generation is expected to decrease from 18.179 million t in 2012 to 7.756 million t by 2027. The rea-son: as base-load power plants, such as nuclear and coal-fired gen-erators, are added to the system, the growth of LNG-fired power plants for supplying peak load is expected to decrease. The demand forecast for LNG used by electri-
cal power plants may vary, however, depending on the targets adopted for greenhouse gas reductions and the use of nuclear and coal-fired power plants in long-term planning.
Natural Gas and Electrical System Interactions in South Korea
Electrical Energy Generation and Demand Configuration Figure 13 summarizes various electricity statistics for South Korea in 2011.
Generation Historical data on generation facilities in South Korea over the past 30 years are presented in Figures 14–18. The figures show a growth of nearly nine times the generation capacity to 86,287 MW in 2012 as compared to 9,591 MW in 1981. This is equivalent to an annual average growth rate (AAGR) of approximately 8% in the total available gen-eration capacity. The electric power generation capacity for natural gas–fired power plants increased to a level close to that of nuclear power plants. Although the share of com-bined-cycle units in the capacity mix decreased from 24.2% of the total in 2002 to 22.9% in 2012, these units’ share
Pipeline in Operation (3,022 km)Pipeline Under Construction (1,291 km)
Ring-Shaped Nationwide Pipeline Network
IIsan Uijeongbu Chuncheon
Hongcheon
WonjuYoungin
Seoul
Suwon
Eumseong
IncheonLNG Terminal
PyeongtaekLNG Terminal
Asan
Jecheo n Yeongwol
TaebaekSamcheok LNG Terminal(Under Construction)
Uljin
Yeongduk
GoesanChonan Danyang
Yeongju
SogokAndongCheongjuBoryung
Okcheon SangjuE.Gimcheon
GeumhoPohang
Oedong
UlsanCheongdo
Hwayang
BoeunBuyeo
Nonsan
Hotan Maecheon
DalseongBuan
Gunsan
Gochang JeonjoMuju
Masan
Busan
Jeong-gwan
KimjeSunchang Hamyang
NamwonYeonggwang
JangsungOkgwa Gwangyang
Geoje
Yeosu Tongyeong LNG TerminalMokpo
Henam
figure 12. The LNG terminal and gas pipeline network in South Korea.

november/december 2014 ieee power & energy magazine 69
figure 15. South Korea’s electrical generation capacity mix in 2002 and 2012.
table 3. Long-term forecasts for natural gas demand in South Korea (millions of t).
Years
Town Gas Generation Gas
TotalResidential General Industrial SumPublic Generation
Combined Cycle
PrivateGeneration Sum
2012(actual record)
8.304 3.073 8.731 20.108 13.747 4.096 0.336 18.179 38.287
2015 8.445 3.26 10.451 22.156 12.73 4.562 0.319 17.611 39.767
2020 9.187 3.975 12.79 25.952 2.789 4.91 0.319 8.018 33.97
2027 9.535 4.781 15.627 29.943 2.501 4.936 0.319 7.756 37.699
Annual average growth rate
0.9% 3% 4% 2.7% ∆10.7% 1.3% ∆0.3% ∆5.5% ∆0.1%
South Korean Electricity Statistics
Gross Electricity Generation (2011)Total: 518.6 TWh
15.2 TWh, 3% 8 TWh, 1%
150.2 TWh, 29%
109.1 TWh, 21%
3 TWh, 1%
233.1 TWh, 45%
ElectricityConsumption (2012)9.337 KWhper Capita
Electricity Price for Household (2011)98.2 SK KRW/MWh
Population (2012)50 Million
Total CO2 Emissions (2012)563.08 Mt,CO2 in Total
Emissions per Capita (2012)11.52 t,CO2 per Capita in Total
(Incl. 5.71 t CO2 per Capitafrom Power andHeat Supply)
(Incl. 279.2 Mt CO2 inPower and Heat Supply)
HydroNuclear Gas
Renewables w/o Hydro
Coal
Oil
90,00080,00070,00060,00050,00040,00030,00020,00010,000
0
(MW
)
1981
1983
1986
1989
1992
1995
1998
2001
2004
2007
2008
2009
2010
2011
2012
Hydro Steam Combined CycleInternational Combustion NuclearOthers Peak Load
Generating Facilities
figure 13. General electricity statistics in South Korea in 2011 (source: IEA).
figure 14. Generating facilities in South Korea, 1981–2012.
2002: 81,806 MW
2012: 86,287 MW
Hydro7.9%
Hydro7.5%
Other5.2%
Steam42.1%
Steam40%
Nuclear25.3%
Nuclear24%
CombinedCycle24.2%
CombinedCycle22.9%
InternalCombustion
0.4%
InternalCombustion
0.4%

70 ieee power & energy magazine november/december 2014
of total electric power production increased from 12.7% to 21.8% over the same ten-year period. During this period the share of nuclear-sourced energy in total energy production decreased from 39.4% in 2002 to 29.6% in 2012. Figure 18 suggests that base-load nuclear energy in 2002 was partly replaced by coal and LNG electric energy production in 2012.
Electrical Energy DemandFigure 19 shows the electricity consumption (electrical energy) and final energy consumption—that is, the coal, oil, liquefied petroleum gas (LPG), LNG, and so on consumed by end users, excluding electricity consumption—for the last ten years in South Korea. The annual average growth rate of electrical energy was approximately 5.6% from 2002 to 2011, which exceeded the final energy growth rate of 2.7%. Despite the global recession, which caused final energy consumption to drop by 0.3%, electricity consumption still increased by 2.4% in 2009.
Figure 20 shows the yearly summer and winter peak demand in South Korea. Although the annual peak demand occurred during the summer through 2008, it shifted to the winter season beginning in 2009. The shift occurred because the price for electrical energy, a secondary energy source, became less expensive for winter heating than the price of primary energies, including oil, LNG, and coal. In economic theory, this condition is identified as a distortion price system by price expert analysts and designers. The addition of new LNG fueled electrical power plants is there-fore expected to depend on how well the distortion price sys-tem is corrected in the future.
Supply Power Reserve Rate The supply power reserve (SPR) rate over the last 22 years is shown in Figure 21. The SPR rate in South Korea has recently been insufficient and has caused difficulties in fre-quency control as well as stability problems in the power system. Furthermore, the available rights-of-way for trans-mission lines are too narrow and socially difficult to per-mit new line construction. Social obstacles exist as well: the proposed construction of a 765-kV line from the New Gori nuclear power plant to the North Gyungnam substation aroused protests that included the suicide of a 69-year-old man on 16 January 2012. The installation of small, dispersed LNG power plants and an undersea high-voltage direct cur-rent (HVdc) line from the northwest (Incheon) to the north-east (Sokcho) has been suggested as an alternative, although such ideas are far from being implemented at present. The undersea HVdc plan in particular has emerged as a prom-ising innovative idea for solving the challenging problems related to transmission line siting and construction.
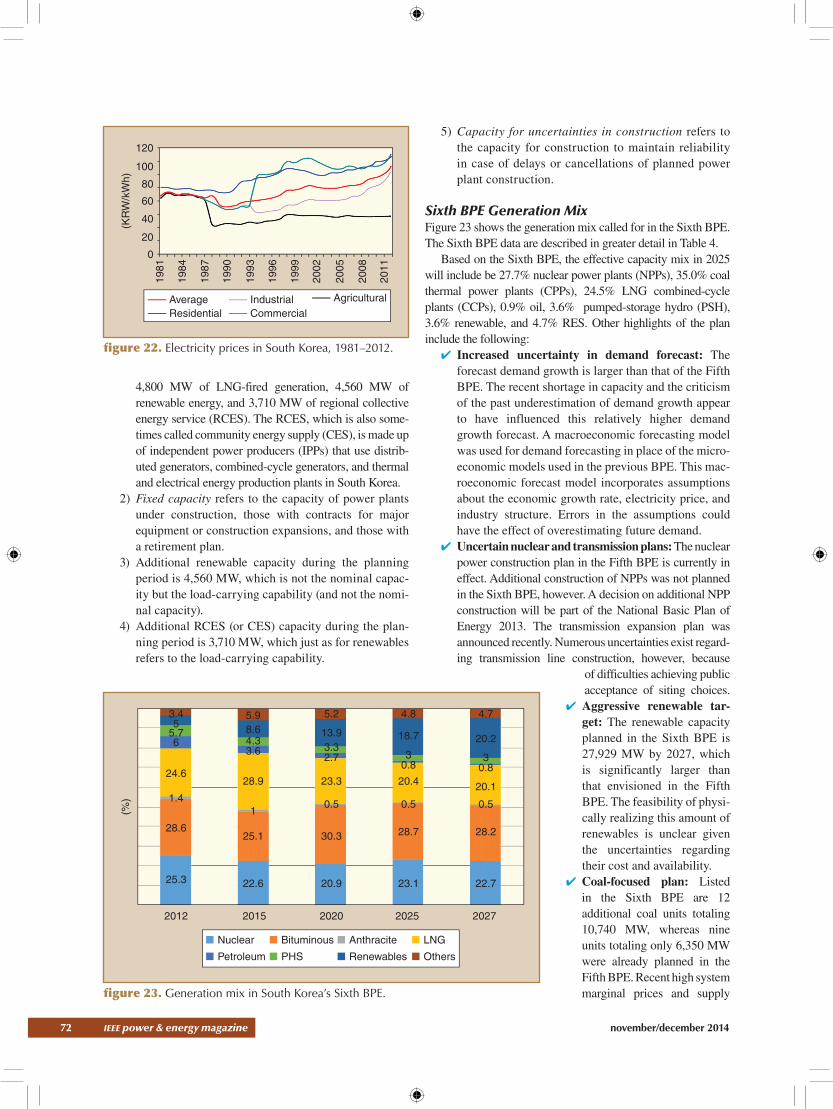
Electricity Price The price of electricity in South Korea during the period 1981–2011 is presented in Figure 22. The country does not use a
Hydro1.8%
Hydro1.5%
Steam46%
Steam46.9%
Nuclear39.4%
Nuclear29.6%
CombinedCycle12.7%
CombinedCycle21.8%
InternalCombustion
0.1%
InternalCombustion
0.1%
2002: 302,033 GWh
2012: 507,480 GWh
figure 16. South Korea’s electrical generation energy production mix in 2002 and 2012.
100,000150,000200,000250,000300,000350,000400,000450,000500,000
50,0000
1981
1983
1985
1987
1989
1991
1993
1995
1997
1999
2001
2003
2005
2007
2009
2011
Hydro NuclearCoal Heavy Oil
DieselLNG
(GW
h)
Hydro NuclearCoal Heavy Oil
DieselLNG
figure 17. South Korea’s electric energy configuration by energy source, 1981–2011.
2002: 306,474 GWh
2012: 485,993 GWh
Coal40.9%
Coal38.5%
LNG23.5%
LNG12.7%
Nuclear30.9%
Nuclear38.9%
Hydro1.6%
Hydro1.7%
Diesel0.1%
Diesel0.4%
Heavy Oil3%
Heavy Oil7.8%
figure 18. South Korea’s electric power energy mix by energy source in 2002 and 2012.

november/december 2014 ieee power & energy magazine 71
real-time pricing system but rather employs a sector-cumulative price system. Because agricultural and industrial electricity prices have been below the historical aver-age since 1987, these sectors have preferred using electrical (second energy) heating systems over gas or coal (first energy) systems. Apply-ing the currency exchange rate of KRW1,100/US$ in 2012 from Figure 4, the agriculture sector and average calorie unit electricity prices can be approximated as follows:
1) Agriculture sector price: KRW40/kWh x kWh/860 kcal ≈ KRW46.5/Mcal = US¢4.23/Mcal
2) Average price: KRW80/kWh x kWh/860 kcal ≈ KRW93/Mcal = US¢8.46/Mcal.
The average calorie unit elec-tricity price (KRW93/Mcal = US¢8.46/Mcal) is similar to the average calorie unit gas price (KRW91.5/Mcal = US¢8.32/Mcal), but the agriculture sector calorie unit electric price is only about half of the calorie unit gas price. As a result of this pricing system, agricultural consumers prefer elec-trical energy for heating during the winter.
BPEIn South Korea, the National Basic Plan for Electrical Energy Supply and Demand (BPE) is reviewed biannually. A source with a detailed summary of the reference plan for the Sixth BPE (the most recent one) is provided below in the For Further Reading section. Some of the points of note in the Sixth BPE are as follows:
1) The Sixth BPE’s reference plan was created using an optimization model called WASP (Wien Automatic Sys-tem Package), a generation expansion planning model that uses dynamic program-ming. The plan considers a target capacity reserve margin of 22%, social costs, and standard construction times of candidate power plants. This plan is not implementable
but is used to guide and evaluate construction plans of generation companies. By 2027, the reference plan out-lines an additional 10,500 MW of coal-fired generation,
figure 19. Final energy and electricity consumption in South Korea, 2002–2011.
figure 20. Yearly summer and winter peak demand in South Korea, 2002–2011.
Electricity (TTOE)
Others (TTOE)
Final Energy (%)
Elec. (%)
200,000
180,000
160,000
140,000
120,000
100,000
80,000
60,000
40,000
20,000
0(T
hous
and
toe)
2002 2003 2004 2005 2006 2007 2008 2009 2010 2011
15
10
5
0
–5
–10
(%)
8
4.9
5.46.3 6.5
4.9 5.74.5
2.4
10.1
6.5
–0.30.6
4.5
1.62.9
1.22.2
4.8
3.2
80,000
75,000
70,000
65,000
60,000
55,000
50,000
45,000
40,0002002 2003 2004 2005 2006 2007 2008 2009 2010 2011
45,77347,385
51,26454,631
58,99462,285 62,794
68,963
73,137 73,833
72,19469,886
63,21262,64560,947
55,50854,45149,990
46,38745,062
(MW
)
Summer Peak
Winter Peak
18
16
14
12
10
8
6
4
2
0
1990
1991
1992
1993
1994
1995
1996
1997
1998
1999
2000
2001
2002
2003
2004
2005
2006
2007
2008
2008
2010
2011
2012
(%) 8.3
5.46.4
10.4
7
6.2
2.8
7.3
12.4 12.9
14.916.4 17.1
13.912.2
11.310.5
9.1
7.2
7.9
6.25.5
5.2
figure 21. South Korean SPR, 1990–2012.
72 ieee power & energy magazine november/december 2014
4,800 MW of LNG-fired generation, 4,560 MW of renewable energy, and 3,710 MW of regional collective energy service (RCES). The RCES, which is also some-times called community energy supply (CES), is made up of independent power producers (IPPs) that use distrib-uted generators, combined-cycle generators, and thermal and electrical energy production plants in South Korea.
2) Fixed capacity refers to the capacity of power plants under construction, those with contracts for major equipment or construction expansions, and those with a retirement plan.
3) Additional renewable capacity during the planning period is 4,560 MW, which is not the nominal capac-ity but the load-carrying capability (and not the nomi-nal capacity).
4) Additional RCES (or CES) capacity during the plan-ning period is 3,710 MW, which just as for renewables refers to the load-carrying capability.
5) Capacity for uncertainties in construction refers to the capacity for construction to maintain reliability in case of delays or cancellations of planned power plant construction.
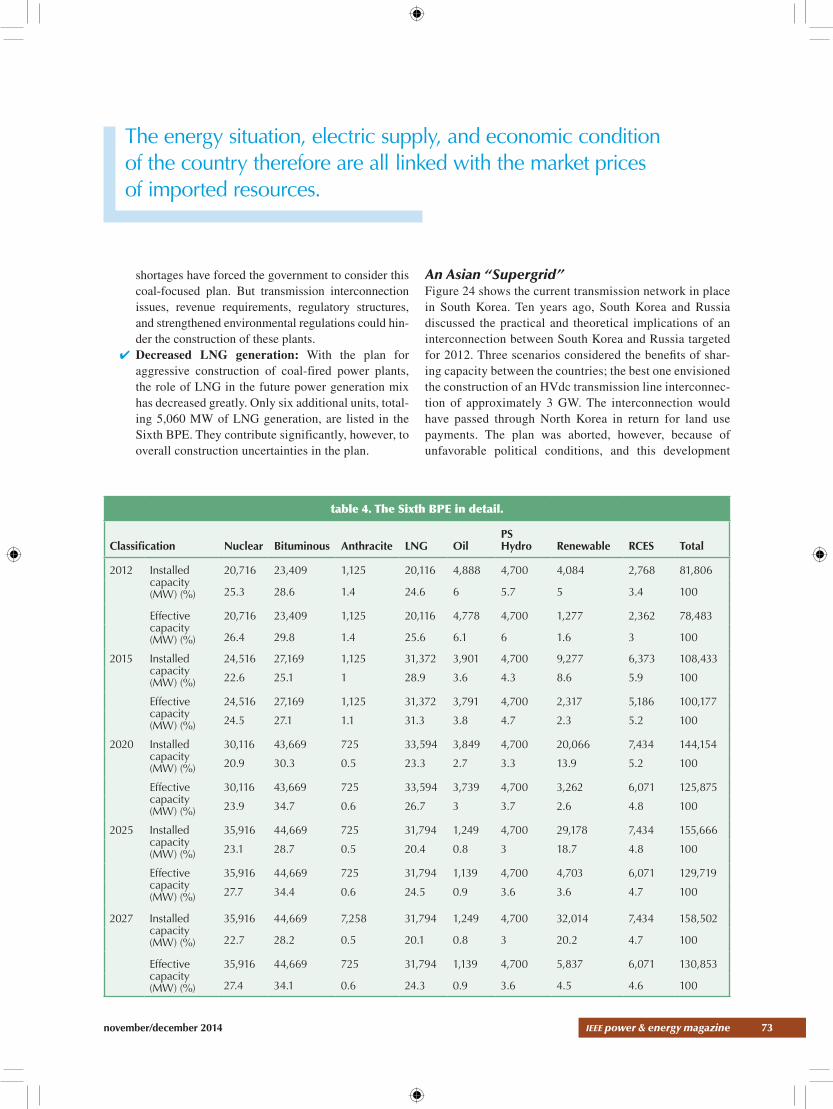
Sixth BPE Generation Mix Figure 23 shows the generation mix called for in the Sixth BPE. The Sixth BPE data are described in greater detail in Table 4.
Based on the Sixth BPE, the effective capacity mix in 2025 will include be 27.7% nuclear power plants (NPPs), 35.0% coal thermal power plants (CPPs), 24.5% LNG combined-cycle plants (CCPs), 0.9% oil, 3.6% pumped-storage hydro (PSH), 3.6% renewable, and 4.7% RES. Other highlights of the plan include the following:
✔ Increased uncertainty in demand forecast: The forecast demand growth is larger than that of the Fifth BPE. The recent shortage in capacity and the criticism of the past underestimation of demand growth appear to have influenced this relatively higher demand growth forecast. A macroeconomic forecasting model was used for demand forecasting in place of the micro-economic models used in the previous BPE. This mac-roeconomic forecast model incorporates assumptions about the economic growth rate, electricity price, and industry structure. Errors in the assumptions could have the effect of overestimating future demand.
✔ Uncertain nuclear and transmission plans: The nuclear power construction plan in the Fifth BPE is currently in effect. Additional construction of NPPs was not planned in the Sixth BPE, however. A decision on additional NPP construction will be part of the National Basic Plan of Energy 2013. The transmission expansion plan was announced recently. Numerous uncertainties exist regard-ing transmission line construction, however, because
of difficulties achieving public acceptance of siting choices.
✔ Aggressive renewable tar-get: The renewable capacity planned in the Sixth BPE is 27,929 MW by 2027, which is significantly larger than that envisioned in the Fifth BPE. The feasibility of physi-cally realizing this amount of renewables is unclear given the uncertainties regarding their cost and availability.
✔ Coal-focused plan: Listed in the Sixth BPE are 12 additional coal units totaling 10,740 MW, whereas nine units totaling only 6,350 MW were already planned in the Fifth BPE. Recent high system marginal prices and supply
120
100
80
60
40
20
0
1981
1984
1987
1990
1993
1996
1999
2002
2005
2008
2011
(KR
W/k
Wh)
AverageResidential
IndustrialCommercial
Agricultural
figure 22. Electricity prices in South Korea, 1981–2012.
figure 23. Generation mix in South Korea’s Sixth BPE.
Nuclear Bituminous Anthracite LNG
Petroleum PHS Renewables Others
3.45
5.76
24.6
1.4
28.6
25.3
5.98.64.33.6
28.9
1
25.1
22.6
5.2
13.93.32.7
23.3
0.5
30.3
20.9
4.8
18.7
30.8
20.4
0.5
28.7
23.1
4.7
20.2
30.8
20.1
0.5
28.2
22.7
2012 2015 2020 2025 2027
(%)
november/december 2014 ieee power & energy magazine 73
shortages have forced the government to consider this coal-focused plan. But transmission interconnection issues, revenue requirements, regulatory structures, and strengthened environmental regulations could hin-der the construction of these plants.
✔ Decreased LNG generation: With the plan for aggressive construction of coal-fired power plants, the role of LNG in the future power generation mix has decreased greatly. Only six additional units, total-ing 5,060 MW of LNG generation, are listed in the Sixth BPE. They contribute significantly, however, to overall construction uncertainties in the plan.
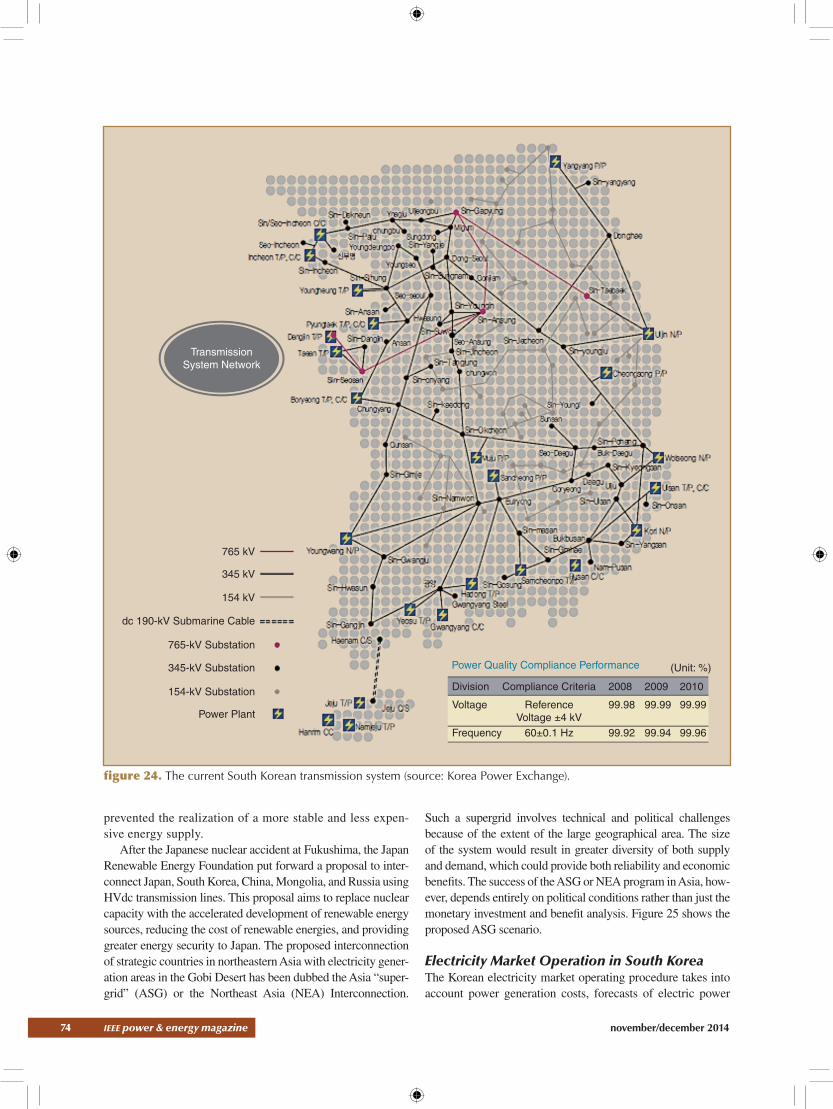
An Asian “Supergrid” Figure 24 shows the current transmission network in place in South Korea. Ten years ago, South Korea and Russia discussed the practical and theoretical implications of an interconnection between South Korea and Russia targeted for 2012. Three scenarios considered the benefits of shar-ing capacity between the countries; the best one envisioned the construction of an HVdc transmission line interconnec-tion of approximately 3 GW. The interconnection would have passed through North Korea in return for land use payments. The plan was aborted, however, because of unfavorable political conditions, and this development
table 4. The Sixth BPE in detail.
Classification Nuclear Bituminous Anthracite LNG OilPS Hydro Renewable RCES Total
2012 Installed capacity (MW) (%)
20,716 23,409 1,125 20,116 4,888 4,700 4,084 2,768 81,806
25.3 28.6 1.4 24.6 6 5.7 5 3.4 100
Effective capacity (MW) (%)
20,716 23,409 1,125 20,116 4,778 4,700 1,277 2,362 78,483
26.4 29.8 1.4 25.6 6.1 6 1.6 3 100
2015 Installed capacity (MW) (%)
24,516 27,169 1,125 31,372 3,901 4,700 9,277 6,373 108,433
22.6 25.1 1 28.9 3.6 4.3 8.6 5.9 100
Effective capacity (MW) (%)
24,516 27,169 1,125 31,372 3,791 4,700 2,317 5,186 100,177
24.5 27.1 1.1 31.3 3.8 4.7 2.3 5.2 100
2020 Installed capacity (MW) (%)
30,116 43,669 725 33,594 3,849 4,700 20,066 7,434 144,154
20.9 30.3 0.5 23.3 2.7 3.3 13.9 5.2 100
Effective capacity (MW) (%)
30,116 43,669 725 33,594 3,739 4,700 3,262 6,071 125,875
23.9 34.7 0.6 26.7 3 3.7 2.6 4.8 100
2025 Installed capacity (MW) (%)
35,916 44,669 725 31,794 1,249 4,700 29,178 7,434 155,666
23.1 28.7 0.5 20.4 0.8 3 18.7 4.8 100
Effective capacity (MW) (%)
35,916 44,669 725 31,794 1,139 4,700 4,703 6,071 129,719
27.7 34.4 0.6 24.5 0.9 3.6 3.6 4.7 100
2027 Installed capacity (MW) (%)
35,916 44,669 7,258 31,794 1,249 4,700 32,014 7,434 158,502
22.7 28.2 0.5 20.1 0.8 3 20.2 4.7 100
Effective capacity (MW) (%)
35,916 44,669 725 31,794 1,139 4,700 5,837 6,071 130,853
27.4 34.1 0.6 24.3 0.9 3.6 4.5 4.6 100
The energy situation, electric supply, and economic condition of the country therefore are all linked with the market prices of imported resources.
74 ieee power & energy magazine november/december 2014
prevented the realization of a more stable and less expen-sive energy supply.
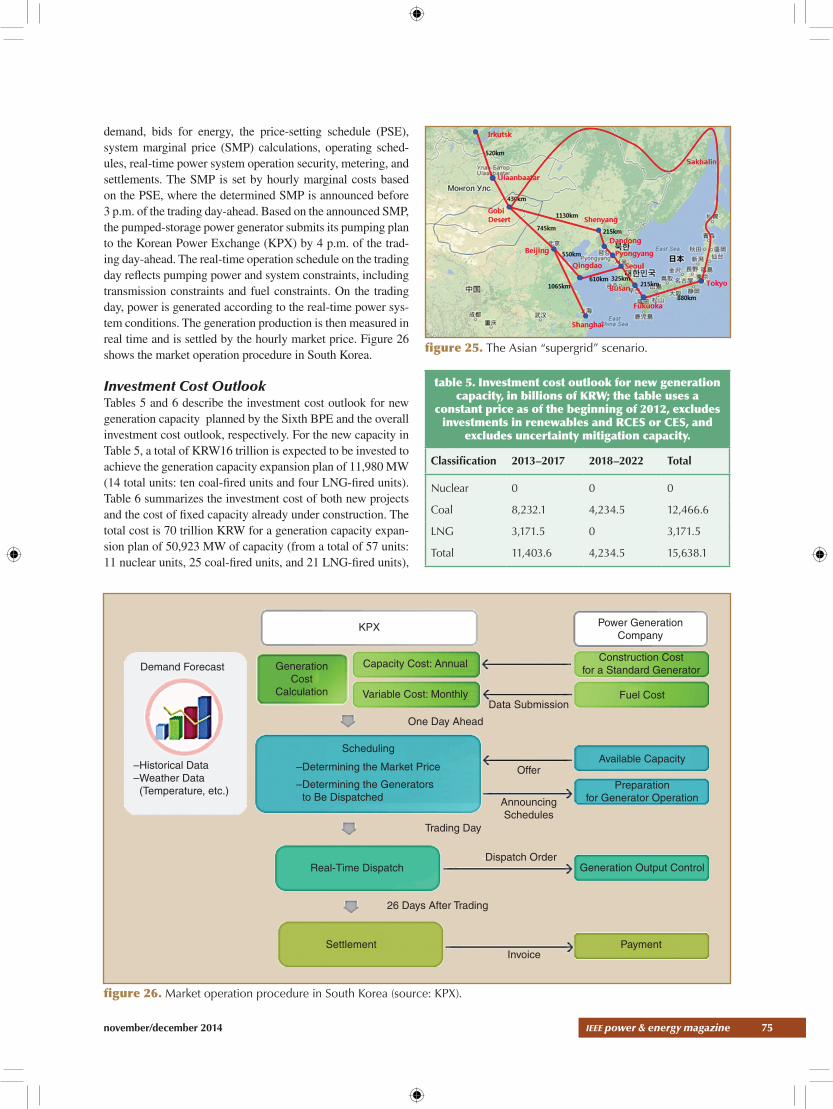
After the Japanese nuclear accident at Fukushima, the Japan Renewable Energy Foundation put forward a proposal to inter-connect Japan, South Korea, China, Mongolia, and Russia using HVdc transmission lines. This proposal aims to replace nuclear capacity with the accelerated development of renewable energy sources, reducing the cost of renewable energies, and providing greater energy security to Japan. The proposed interconnection of strategic countries in northeastern Asia with electricity gener-ation areas in the Gobi Desert has been dubbed the Asia “super-grid” (ASG) or the Northeast Asia (NEA) Interconnection.
Such a supergrid involves technical and political challenges because of the extent of the large geographical area. The size of the system would result in greater diversity of both supply and demand, which could provide both reliability and economic benefits. The success of the ASG or NEA program in Asia, how-ever, depends entirely on political conditions rather than just the monetary investment and benefit analysis. Figure 25 shows the proposed ASG scenario.
Electricity Market Operation in South KoreaThe Korean electricity market operating procedure takes into account power generation costs, forecasts of electric power
Division Compliance Criteria 2008 2009 2010
Voltage ReferenceVoltage ±4 kV
99.98 99.99 99.99
Frequency 60±0.1 Hz 99.92 99.94 99.96
765 kV
345 kV
154 kV
dc 190-kV Submarine Cable
765-kV Substation
345-kV Substation
154-kV Substation
Power Plant
Power Quality Compliance Performance (Unit: %)
TransmissionSystem Network
figure 24. The current South Korean transmission system (source: Korea Power Exchange).
november/december 2014 ieee power & energy magazine 75
demand, bids for energy, the price-setting schedule (PSE), system marginal price (SMP) calculations, operating sched-ules, real-time power system operation security, metering, and settlements. The SMP is set by hourly marginal costs based on the PSE, where the determined SMP is announced before 3 p.m. of the trading day-ahead. Based on the announced SMP, the pumped-storage power generator submits its pumping plan to the Korean Power Exchange (KPX) by 4 p.m. of the trad-ing day-ahead. The real-time operation schedule on the trading day reflects pumping power and system constraints, including transmission constraints and fuel constraints. On the trading day, power is generated according to the real-time power sys-tem conditions. The generation production is then measured in real time and is settled by the hourly market price. Figure 26 shows the market operation procedure in South Korea.
Investment Cost OutlookTables 5 and 6 describe the investment cost outlook for new generation capacity planned by the Sixth BPE and the overall investment cost outlook, respectively. For the new capacity in Table 5, a total of KRW16 trillion is expected to be invested to achieve the generation capacity expansion plan of 11,980 MW (14 total units: ten coal-fired units and four LNG-fired units). Table 6 summarizes the investment cost of both new projects and the cost of fixed capacity already under construction. The total cost is 70 trillion KRW for a generation capacity expan-sion plan of 50,923 MW of capacity (from a total of 57 units: 11 nuclear units, 25 coal-fired units, and 21 LNG-fired units),
figure 25. The Asian “supergrid” scenario.
KPX
Demand Forecast
–Historical Data–Weather Data (Temperature, etc.)
GenerationCost
Calculation
Capacity Cost: Annual
Variable Cost: MonthlyData Submission
One Day Ahead
Power GenerationCompany
Construction Costfor a Standard Generator
Fuel Cost
Available Capacity
Preparationfor Generator Operation
Generation Output Control
PaymentInvoice
Settlement
Real-Time Dispatch
26 Days After Trading
Trading Day
Dispatch Order
AnnouncingSchedules
Offer
Scheduling
–Determining the Market Price
–Determining the Generators to Be Dispatched
figure 26. Market operation procedure in South Korea (source: KPX).
table 5. Investment cost outlook for new generation capacity, in billions of KRW; the table uses a
constant price as of the beginning of 2012, excludes investments in renewables and RCES or CES, and
excludes uncertainty mitigation capacity.
Classification 2013–2017 2018–2022 Total
Nuclear 0 0 0
Coal 8,232.1 4,234.5 12,466.6
LNG 3,171.5 0 3,171.5
Total 11,403.6 4,234.5 15,638.1

76 ieee power & energy magazine november/december 2014
if new projects and fixed capacity under construction are added together.
RCES and Distributed, Small-Scale Gas Cogeneration SystemsDistrict heating and community energy heating companies, along with renewable energy companies, plan to participate in RCES operations. An RCES using LNG generally consists of combined heat and power (CHP) generation and cogen-eration. These total energy systems generate both electrical
energy (operating at high temperature) and thermal energy (operating at low temperature), and they are usually located in a community complex close to a metropolitan city. The economic and systemic effects of the RCES business model need to be evaluated, but it is considered capable of bringing the following benefits to South Korea:
✔ Stable and distributed electrical energy sources, espe-cially small-scale, distributed, LNG-fired combined-cycle plants may facilitate requirements for siting power plants, meeting clean energy goals, and satisfy-ing reliability targets for electrical energy supply.
✔ Alternative energy supplies mitigate challenging con-struction issues and expensive construction costs, and they improve power system stability because RCES operations are located near to the consumer loads.
✔ Other environmental and construction benefits of RES include reduced total energy consumption and higher efficiency, reduced air pollution through use of LNG fuel, and expeditious plant construction for these small generation systems.
Tables 7 and 8 present the RCES in 2014 and RCES in 2002 and 2012, respectively. The RCES generation in South Korea increased from 6.0% (3,230 MW) in 2002 to 12.2% (9,981 MW) in 2012, as shown in Table 8.
Conclusions After the oil crises of the 1970s, South Korea adopted a national energy strategy emphasizing diversity in the kinds and supply of energy resources. A significant number of new nuclear power plants and LNG thermal power plants were constructed under this government energy strategy. The energy diversity strategy has enabled a balance of resources in the electrical energy mix and has facilitated the integra-tion of intermittent resources.
Critical adjustments to that energy policy will be needed, however, to ensure stable supplies and sustainable economic growth. The second NBEP of the Ministry of Trade, Indus-try, and Energy was issued in 2013 and includes forecasts of energy usage. Natural gas demand in South Korea is forecast to grow by 1.7% annually, to 35.3 million toe in 2035, as com-pared with 23.7 million toe in 2011. The country’s oil demand is expected to decrease by 0.11% annually, to 99.3 million toe in 2035, as compared with 102 million toe in 2011. Coal demand for power generation is expected to increase by 0.6% annually, reaching 38.6 million toe in 2035, as compared with 33.5 million toe in 2011. Electricity consumption is forecast to
table 6. The overall investment cost outlook, in billions of KRW; the table uses a constant price as of the beginning of 2012, excludes investments
in renewables and RCES or CES, and excludes uncertainty mitigation capacity.
Classification 2013 to 2017
2018 to 2022
2023 to 2027
Total
Nuclear 11,073.6 15,271.5 1,596.5 27,941.6
Coal 24,190.7 4,234.5 — 28,425.2
LNG 13,524.7 — — 13,524.7
Total 48,789 19,506 1,596.5 69,891.5
table 7. The state of the RCES model in 2014.
Companies Plants
Private RCES In operation 30 55
Under construction 13 13
Total 43 68
Industrial RCES In operation 28 30
Under construction 7 8
Total 35 38
Private and industrial RCES
In operation 4 4
Under construction 2 2
Total 6 6
Total In operation 61 88
Under construction 23 24
Total 84 112
The proposed ASG aims to interconnect countries in northeast Asia with electricity generation areas in the Gobi Desert.

november/december 2014 ieee power & energy magazine 77
nearly double, to 70.2 million toe in 2035 from 39.1 million toe in 2011. The report assesses the effect of electricity prices on electrical demand.
The Sixth BPE in South Korea calls for the aggressive construction of coal-fired power plants, which will reduce the role of LNG in power generation. The economic and reli-ability effects of the RCES business model must therefore be evaluated. The main problems confronting the RCES model in South Korea are poor economics, exposure to high LNG prices, and the uncertainties of the electricity market system.
South Korea does not have the capacity to produce natu-ral gas, and the country imports LNG from Qatar, Oman, and Indonesia, favorable locations that minimize the LNG transportation price. South Korea remains an energy-isolated country that has no interconnecting pipelines with neighbor-ing countries. Discussions have been conducted that have con-sidered interconnecting an LNG pipeline with Russia, but this plan deemed unacceptable because of national energy security issues, especially with respect to North Korea.
The proposed ASG aims to interconnect countries in northeast Asia with electricity generation areas in the Gobi Desert. Such a “supergrid” would bring technical and politi-cal challenges because of its large geographical footprint. The project remains under negotiation as the economic opportunities are weighed against the political challenges.
An inadequate SPR rate in South Korea during recent summer and winter periods has resulted in frequency con-trol and stability problems in the power system. The prob-lem will be solved with the addition of transmission and generation facilities. Although the construction of new transmission lines on exiting rights-of-way is not pos-sible, a phased approach of undersea HVdc projects that surround the main peninsula of South Korea appears to be viable solution. Hydro, pumped storage generators, and LNG generation will provide a more important role in fre-quency regulation. The addition of distributed small-scale gas cogeneration systems will improve system performance and will be fully considered under the electricity market environment in South Korea. The economics of these dis-tributed resources is dependent upon LNG prices and the electric rate structure, which currently favors electrical usage for heating systems.
AcknowledgmentsThe author would like to thank KPX, Korea Energy Econom-ics Institute (KEEI), and the Ministry of Trade, Industry, and
Energy. Special mention goes Dr. Roy Billington, emeritus professor, University of Saskatchewan, Canada; Dr. Abdur-rahim El-Keib, former prime minister of Libya; Dr. Jae Hyung Roh, professor, Konkuk University, South Korea; and Dr. Ki Joong Kim, senior research fellow in the Gas Pol-icy Research Division of KEEI, South Korea, for providing much of the data presented and for their valuable comments and suggestions.
For Further ReadingKorea Energy Economics Institute (KEEI). (2013, Dec.). 2013 Energy Inf. Korea. [Online]. Available: http://www.ke-sis.net/flexapp/KesisFlexApp.jsp
J. Kwon, J. Choi, T.. Tran, A. A. El-Keib, and J. Wata-da, “Emissions constrained multi-criteria-best generation mix using fuzzy dynamic programming,” Int. J. Innova-tive Computing, Info. Contr., vol. 3, no. 1, pp. 41–52, Feb. 2007.
Korea Power Exchange (KPX), “Summary of the 6th ba-sic plan for long-term electricity supply and demand (2013–2027),” Annu. Rep., Dec. 2013.
KEEI, “Energy Consumption Forecasting in South Ko-rea,” vol. 14, no. 4, Dec. 2012.
Ministry of Trade, Industry and Energy, “The 11th long-term natural gas supply/demand plan (2013–2027) in South Korea,” Biannual Rep., Apr. 2013.
Ministry of Trade, Industry and Energy, “The 2nd national basic energy plan report,” MOTIE NBEP Rep., 2014.
BiographyJaeseok Choi is with Gyeongsang National University, Jin-ju, South Korea.
p&e
table 8. RCES systems in South Korea in 2002 and 2012 (source: South Korean Ministry of Trade,
Industry, and Energy).
Total Public Company
Private Company
Capacity (MW)
Mix (%)
Capacity (MW)
Mix (%)
Capacity (MW)
Mix (%)
2002 53,801 100 50,571 94 3,230 6
2012 81,806 100 71,825 87.8 9,981 12.2
The economics of these distributed resources is dependent upon LNG prices and the electric rate structure, which currently favors electrical usage for heating systems.