A framework for performance evaluation of energy...
14
Transcript of A framework for performance evaluation of energy...

Scientia Iranica E (2016) 23(4), 1904{1917
Sharif University of TechnologyScientia Iranica
Transactions E: Industrial Engineeringwww.scientiairanica.com
A framework for performance evaluation of energysupply chain by a compatible network dataenvelopment analysis model
S. Sha�ei Kaleibaria;�, R. Gharizadeh Beiraghb, R. Alizadehc and M. Solimanpurb
a. Department of Industrial Engineering, Payam Nour University, Tabriz, Iran.b. Department of Industrial Engineering, Urmia University of Technology, Urmia, Iran.c. Technology Foresight Group, Department of Management Science and Technology, Amirkabir University of Technology, Tehran,
Iran.
Received 2 September 2014; received in revised form 31 May 2015; accepted 25 July 2015
KEYWORDSNetwork DataEnvelopment Analysis(NDEA);Assurance Region(AR);Data EnvelopmentAnalytic HierarchyProcess (DEAHP);Energy supply chain;Technical e�ciency.
Abstract. Inadequate supply of energy has become one of the major problems in societiesdue to consumers' increasing demand. Economic growth is a key reason for the increasein the energy consumption. Although di�erent policies can be employed for resolving thisproblem, optimizing the e�ciency of energy suppliers can be addressed as a key policyin this regard. This paper presents an adjusted Network Data Envelopment Analysis(NDEA) model for evaluating performance of energy supply chain in Iran from productionto distribution stages. Some suggestions have been proposed to optimize the performanceof the energy supply chain. The NDEA model is adjusted by using Assurance Region (AR)to achieve more realistic and scienti�c results. Borders of the assurance region obtainedfrom Data Envelopment Analytic Hierarchy Process (DEAHP) method are entered intothe NDEA model. The results obtained from this model are compared with those ofconventional NDEA and technical e�ciency in pairs. Finally, the Spearman and Kendall's-Tau correlation tests are used for validating the results.© 2016 Sharif University of Technology. All rights reserved.
1. Introduction
There are several ways to meet the growing demandsof energy and to achieve sustainable economic growth,such as rising energy generation, utilizing advancedtechnologies, and so forth. However, considering highenergy intensity in Iran [1,2], improving the energye�ciency can be considered as a cost-e�ective wayto tackle this issue. The �rst and necessary stepfor optimizing the e�ciency is to measure the cur-
*. Corresponding author. Tel.: +98 4135557489;Fax: +98 4135557489E-mail addresses: sin shin [email protected] (S. Sha�eiKaleibari); [email protected] (R. GharizadehBeiragh); [email protected] (R. Alizadeh);[email protected] (M. Solimanpur)
rent e�ciency level of units to identify the ine�cientunits. Identifying the most e�cient units enablesthe decision makers to ascertain how ine�cient units,with similar structures and goals, cannot yield thesame outputs. Energy e�ciency can be considered indi�erent stages; the highest increase in performancewill be achievable throughout the supply chain ofenergy. Having e�cient systems and optimal use ofresources can prevent losses and wastes. Therefore, aslight increase in performance will result in signi�cantsavings. Many studies have been conducted in this areato achieve such important goals. In order to estimatethe index, Zhou et al. [3] measured economy-wideenergy e�ciency performance of a sample of OECDby the Shephard energy distance function to de�ne anenergy e�ciency index and to adopt stochastic frontier

S. Sha�ei Kaleibari et al./Scientia Iranica, Transactions E: Industrial Engineering 23 (2016) 1904{1917 1905
analysis technique. Hu et al. [4] applied the four-stage DEA procedure to calculate energy e�ciency of23 regions in Taiwan from 1998 to 2007. Wang etal. [5] adopted the framework of total factor energye�ciency index to determine the discrepancy of energye�ciency in Chinese industrial sector based on theprovincial statistical data of industrial enterprises in30 provinces from 2005 to 2009. To evaluate theperformance of 29 Electricity Distribution Divisionsof Uttarakhand province, Yadav et al. [6] used DEAinput-oriented model. They calculated technical andscale e�ciency of their decision units. In addition,they showed that the highest ine�ciency of the unitsis related to their scale ine�ciency rather than thetechnical one. See and Coelli [7] calculated the tech-nical e�ciency of thermal power plants of Malaysiausing stochastic frontier analysis method from 1998to 2005. They demonstrated that ownership, plantsize, and fuel type have a signi�cant e�ect on technicale�ciency. Alizadeh et al. [8] analyzed Iran's contri-bution in energy e�ciency and the environmentallyfriendly projects supported by United Nations. Jarait_eand Di Maria [9] used DEA model to measure envi-ronmental e�ciency and productivity for enhancingthe performance of the overall EU electricity pro-duction in Europe during 1996 to 2007. They alsoanalyzed changes in productivity and e�ciency usingeconometric techniques. Solmes in [10], explainedthe electrical industry and consumer of energy supplychain by decomposing them into their components.Solmes showed how integration of these systems resultsin energy saving. In other parts of this book, thereason for ine�ciency of supply chain system and theincreasing costs have been described. Omrani et al. [11]presented an integrated Data Envelopment Analysis(DEA), Corrected Ordinary Least Squares (COLS),Stochastic Frontier Analysis (SFA), Principal Compo-nent Analysis (PCA), and Numerical Taxonomy (NT)algorithm for performance assessment, optimizationand policy making of 38 electricity distribution unitsin Iran. Fallahi et al. [12] made changes in termsof technical e�ciency and productivity in 32 powermanagement companies in Iran during 2005 to 2009using a DEA model, and subsequently, veri�ed the sta-bility of their DEA model by a stability test. Vazhayiland Balasubramanian [13] discussed some strategiesgrouped into three portfolios; namely, power generationmix, demand side e�ciency group, and supply sidee�ciency group. Moreover, an optimization modelwas used for cost, risk, and barrier reduction. thisportfolio, subsequently, was combined with higher-levelportfolios including economic growth, energy equity,energy security, and climate sustainability. Finally,optimization is done using DEA method, and theresults were compared. Pardo Mart��nez [14] measuredenergy e�ciency development in non-energy-intensive
sectors in Germany and Colombia according to aproduction-based theoretical framework using DEAfrom 1998 to 2005. He compared performance e�ciencyof the energy sector in Germany and Colombia attwo aggregation levels, and then o�ered alternativesfor improving the existing situation. Liang et al. [15]reviewed general equilibrium impact on improving en-ergy end-use e�ciency on China's economy, energy use,and CO2 emissions in 2002. To do so, they developeda static, multi-sector computable general equilibriummodel. Bas [16] proposed a hybrid approach byAHP method, combined with SWOT-fuzzy TOPSIS, toformulate strategies with higher priorities for electricitysupply chain in Turkey. Huang et al. [17] calculatedcost e�ciency and optimal scale of Taiwan's electricitydistribution industry in short and long terms. The24 units of distribution were studied using stochas-tic meta-frontier method during 1997 to 2002, andderegulation of the electricity distribution industry wasanalyzed.
Results of performance measurements and bench-marking methods help systems to detect ine�ciencyin their subunits and to improve the e�ciency ofentire units as well as entire supply chain. Oneof the most widely used methods for performancemeasurement is Data Envelopment Analysis (DEA),which is an approach based on linear programmingdeveloped by Charnes et al. [18]. Classical methodof DEA in the performance evaluation of networkand multi-step systems does not function properlyas all these systems are considered as a whole; i.e.each Decision Making Unit (DMU) is considered as ablack box in which interactions of subunits within thesystem are ignored. Brie y, calculations are limitedto initial inputs and �nal outputs. To overcome thisproblem, NDEA was provided as a network DEA byF�are and Grosskopf [19] for the �rst time. Unliketraditional models, these models do not have a formulaand are de�ned based on the type and structureof their networks. This method can, in addition,show the interaction between the internal processesand compute the overall e�ciency and e�ciency ofthe subsystems. In recent years, extensive studieshave been conducted to overcome the drawbacks ofthe classic DEA, and di�erent solutions have beenproposed. Castelli et al. [20] evaluated the e�ectivenessof speci�c and interdependent subunits for makinglarger decision-making units. Lewis and Sexton [21]o�ered a model in which units included a networkof linked subunits, where some of the subunits pro-duced resources for other subunits, and other producedresources were consumed by other subunits. Theyformulated NDEA model for the structure of theiroutputs and inputs. Prieto and Zof��o [22] evaluatedtechnical e�ciency by comparing appropriate technolo-gies of di�erent economies, meanwhile by considering

1906 S. Sha�ei Kaleibari et al./Scientia Iranica, Transactions E: Industrial Engineering 23 (2016) 1904{1917
an analytical framework, they let the input-outputmodels to be regarded as a network. This networkof inputs and outputs was optimized using produc-tion e�ciency measures. They, additionally, imple-mented an input-output model for OECD countrieswith a network data envelopment analysis. Bai-Chenet al. [23] obtained China's energy system e�ciencyin both economic and environmental aspects usingNDEA, and showed that form of production hasa signi�cant impact on environmental performance.Chen and Yan [24] presented three NDEA models forevaluating supply chain performance, which considerthe internal structure of supply chain and their in-teractions simultaneously. They calculated losses ofinternal sources in the supply chain. Kao [25] o�ereda relational NDEA that considered the interactionswithin the system. With the idea of de�ning a dummyprocess, the primary network could become a seriesnetwork in which each of the series is considered asa parallel structure. Kao and Hwang [26] assessed thee�ect of IT on organizational performance in bankingindustry using an NDEA model. Tone and Tsutsui [27]proposed a slacks-based network DEA model, callednetwork SBM, which could deal with intermediateproducts. This model can evaluate divisional andthe overall e�ciency of decision-making units. Hsiehand Lin [28] used a model of NDEA to evaluatee�ciency and e�ectiveness of international hotels inTaiwan considering internal interactions. Moreover,they suggested some ways for increasing the e�ciencyof their performance. Matthews [29] examined riskmanagement of China's banks and divided units toenvironmental and organizational risk management.These units were, subsequently, entered as intermediateproducts into the NDEA model to calculate the amountof income e�ciency. Zhao et al. [30] presented amodel for evaluating a downtown space reservationbased on NDEA. Input of this model is obtained usingtra�c microscopic simulation data. Finally, resultswere compared and evaluated using those of radialand slacks-based network DEA models to validate themodel.
As there are many di�erences between entitiesrelated to energy supply chain, a comprehensive evalu-ation that considers all these entities simultaneously innational scale is very challenging; there has not beennotable study in this instance. This tool is mainlyrequired for authorities of energy industry to evaluateand analyze the whole energy supply chain at the sametime. A desired model for this purpose should yieldsummarized and integrated results, which facilitatesdecision making for managers and authorities as wellas performing e�ective optimization. Therefore, in thispaper, we aim to develop a model for evaluating energysupply chain including production, transmission, anddistribution stages simultaneously by considering all
the interactions and relations throughout the supplychain stages. The model, additionally, has the ability toshow which changes should be taken for ine�cient unitsto make them e�cient. However, the real optimizationwill be achievable mainly by the discretion of upperlevel managers with the aid of these directions. Themodel proposed for this purpose is a compatible Net-work Data Envelopment Analysis, and the case studyfor practical implementation is Iran's energy supplychain during 2007 to 2011 in dealing with seventeenbasic indices. The considered indices for productionstage are the cost of fuel and labor as inputs, andthe generated energy as output. For transmissionstage, the inputs are the station capacity, the lengthof transmission lines, the imported energy from neigh-boring power companies, the labor and the deliveredenergy to this section; and the outputs are energylosses, exported energy, and the energy delivered todistribution companies. Finally, in distribution stage,the input is the delivered energy from this stage, andthe outputs are the sold energy and the number ofcustomers.
In DEA model, the obtained optimal weightstotally depend on the amount and pattern of dataand this characteristic sometimes leads to assigningunreasonable weights to some indices. Consequently,the obtained e�ciency values sometimes have a gapwith reality. DEA does not consider how much aninput or output is important for decision makers; itmerely assigns weights in a way that enhances theoutput-input rate. This fact implies the objectivenessof DEA. The results obtained by objective method arebased on the values of data and their distribution. Toprevent obtaining objective results and utilizing ex-perts' viewpoint, assurance region can be applied in theDEA model. It leads to achieve more realistic results.In addition, it prevents DEA model from assigningirrational weights to indices, which are important forexperts. Therefore, the results will be both subjectiveand objective. In addition, assurance region bringsabout more discriminative results.
In order to enter assurance region into DEAmodel, it is necessary to calculate the bounds forweights. For this propose, there are several methodsfor obtaining priorities in AHP. Wang et al. [31] useda DEA model with the assurance region known asDEA/AR to overcome limits of DEAHP method suchas illogical local weights, high insensitivity to somecomparisons, and the loss of data. They, �rst, intro-duced the method of DEAHP, next provided a numer-ical example to discuss weaknesses of this method interms of calculating weights of DEA models. In anotherarticle, to solve the problems of the previous article,Wang and Chin [32] proposed a new method of DEA toset priorities in the AHP, and developed it for groupedAHP. This model obtained the best weights of indices

S. Sha�ei Kaleibari et al./Scientia Iranica, Transactions E: Industrial Engineering 23 (2016) 1904{1917 1907
from paired comparisons matrix. In this method,compatibility or incompatibility is not important, andboth cases result in optimal weights. In this paper,the two ways developed by Wang and Chin have beenexplained and the last one is applied to the model forobtaining the weights. Obtained weights have beenentered into the NDEA model as upper bounds ofassurance region. In the next step, the e�ciency valueswere computed �rst by using conventional NDEA, andthen by bounded NDEA. Subsequently, to comparethe results of these two methods, results of technicale�ciency were used. Technical e�ciency is de�ned asthe ratio of weighted outputs to weighted inputs inwhich weights were obtained by the method of Wangand Chin [32]. The results were analyzed and theircorrelation was compared in pairs by Spearman andKendal's-Tao correlation tests in order to verify andvalidate the results. Finally, some points are suggestedin the case of optimization by analyzing amounts ofslack and surplus values.
2. Methodology
2.1. Technical e�ciency as output to inputratio
E�ciency index in units that include one input (x)and one output (y) is de�ned as y
x ; if multiple inputsand outputs exist in a unit or organization, coe�cientsshould be allocated to inputs and outputs. Inputshave di�erent e�ects on making outputs. Therefore,they should be selected according to their coe�cients.Technical e�ciency can be de�ned as the ratio ofweighted outputs to weighted inputs as addressedby Cooper et al. [33]. This index is expressed asfollows:
TEj =u1y1j + u2y2j + � � �+ unynjv1x1j + v2x2j + � � �+ vmxmj
=
nPr=1
uryrjmPs=1
vsxsj;(1)
where `x' and `y' are inputs and outputs, `v' and `u'are weights of inputs and outputs, respectively, `m'is the number of inputs, `n' is the number of outputsand `j' represents jth DMU. In this study, weightsof inputs and outputs are obtained using Wang andChin's method [28]. Thus, the weights of inputs,outputs, and obtained e�ciency scores are consistentand reliable. E�ciency scores obtained by Eq. (1) isa basis for comparing the results of other methods.
2.2. Network data envelopment analysisNetwork DEA has two overall structures: series andparallel. In a decision-making unit, when di�erentparts of activities are placed along with each other,the system is series. In this case, total inputs ofsystem enter from the �rst part, and the �nal outputs
exit from the end. However, in parallel networks, allprocesses within the system have a parallel structure.Using these two structures, Kao [25] developed modelsfor evaluating network decision-making, which werede�ned based on multiplying e�ciency of subunits.The supply chain of this paper is a combination of bothtypes of structures.
2.3. DEA/AR modelIn order to avoid obtaining zero values for de�nedindexes' weights (weights of outputs and inputs forcase), there should be some boundaries for optimalweights (v�i ; u�j ) in DEA model. This will result in ane�ciency score for each DMU in which all indexes havee�ects on the obtained score, and none of them getszero weight in calculation of the e�ciency score. Thisis the reason that leads to the emergence of assuranceregion, which relatively limits the amount of assignedweights. In this paper, the model developed by Wangand Chin [32] is used to get the upper bounds of weightsin NDEA. Let:
A = (aij)n�n =
26664a11 a12 � � � a1na21 a22 � � � a2n...
... � � � ...an1 an2 � � � ann
37775 ; (2)
be a pair-wise comparison matrix (obtained accordingto experts' opinions) in which aij is the importanceof ith index versus jth index with aii = 1, andaji = 1=aij and W = (w1; � � � ; wn)T is the priorityvector. Hereafter, algorithm for calculating weightsis di�erent from standard AHP method. In DEAHP,each row of the matrix A is presented as a DMUand each column is presented as an output, whichassumes a dummy value of one as input for all DMUs.Each DMU has, therefore, an output and one dummyconstant input based on which the following input-oriented CCR model is constructed to estimate localpriorities (weights) of the pair-wise comparison matrixA:
max w1 =nXj=1
a1jvj ;
subject to:
u1 = 1;
nXj=1
aijvj � u1 � 0; i = 1; : : : ; n;
u1; vj � 0; j = 1; � � � ; n: (3)
In the above model, w1 shows e�ciency score for DMU1(�rst row of matrix) which is the �nal weight that

1908 S. Sha�ei Kaleibari et al./Scientia Iranica, Transactions E: Industrial Engineering 23 (2016) 1904{1917
can be used instead of AHP priority weight for �rstindex. For each row, Model (3) is computed and runas a DMU. However, �nal weights of indexes w� =(w�1 ; � � � ; w�n)T are calculated by Model (3) if pair-wisecomparison matrix A is fully consistent.
Wang and Chin (2009) [28] showed that Model (3)can sometimes be in con ict with inconsistent pair-wisecomparison matrix. To overcome the shortcomings ofDEAHP, they developed a method of DEA to deter-mine priorities in AHP, which produced true weightsfor the perfectly consistent pair-wise comparison ma-trix. It, additionally, could produce the best localpriorities for inconsistent pair-wise comparison matrixthat were logical and consistent with the subjectivejudgments of decision-makers. The proposed model isas follows:
maximize w1 =nXj=1
a1jvj ;
subject to:
nXj=1
nXi=1
aij
!vj = 1;
nXj=1
aijvj � nvi; i = 1; � � � ; n;
vj � 0; j = 1; � � � ; n: (4)
Solving the above linear programming model for eachwi will yield the best weight for each index or choice.In this paper, to obtain upper bounds of weightsfor NDEA, Model (4) is used. Therefore, enteringexperts' viewpoint led to preventing unrealistic DMUe�ciency.
3. Case study
Generally, energy supply chain includes generation anddistribution. Manufacturing power plants generateelectricity and distribution companies distribute thegenerated electricity among consumers. In this chain,plants (regardless of the generating way) are consideredas energy suppliers for the distribution section. Ina similar way, distribution companies are electricitysuppliers for consumers. Electricity generation anddelivering have great complexity in the supply chaindue to the climatic conditions and geographical speci-�cations of the area. Regional power companies in Iran,which are responsible for electricity production anddelivery to distribution companies, have similar goals,missions, tasks, and activities. The di�erence is oftenin the volume of activities, the extent of geography, andthe overall structure of companies which will follow thesame structural pattern.
3.1. First part of supply chain structure:Regional electricity generation companies
The prinicipal part of power industry is power gen-eration section. Management of regional electricitycompanies is responsible for constructing new powerplants as well as maintaining and monitoring old ones.
3.2. Second part of supply chain structure:Regional power transmission companies
The location of electricity power plants is determinedconsidering various technological, economic, and socialfactors such as fuel, water, and the distance to theresidential areas (to prevent environmental pollution).Consequently, a standard distance is considered usualin terms of locating power plants, and it should besupported by transmission lines, which act as suppli-ers of power for consumption centers. In addition,transmission establishment is necessary for increasingor decreasing voltage and making adjustment withthe centers of generation and consumption. In brief,the electricity generated by power plants is deliveredto the distribution network by transmission facilitiesincluding posts and transmission lines.
3.3. Third part of supply chain structure:Power distribution companies
Distribution of power is the link between the powerindustry and customers, and has multiple roles; �rst,supplies consumers and sells electricity as an economicgoods; second, has a vital technical role in maintaining,operating, and developing the distribution networks;third, maintains communication and coordination withthe upstream sectors of energy supply chain. Con-sidering the above description, Iran's electric powersupply chain network was designed, in this paper, asfollows.
System 1 shows the regional power company andSystem 2 shows the electricity distribution network.The way that this network has been developed is basedon the level of independency in the case of management.Obviously, the three major sections are independentin many �elds as well as in management. However,for example, in distribution section, despite similaritiesbetween distribution subsystems, they were assignedto private organizations with di�erent policies andmanagement methods. Therefore, it is necessary tocompare them with each other in order to �nd theweaknesses and strengths of each one. There are 16active regional power companies in Iran that all havebeen evaluated in this paper. Inputs and outputsof this network were considered according to Iran'sMinistry of Energy e�ciency, and are presented asfollows:z1j0 Cost of fuel;z2j0 Labor of generation section;z1j1 Generated energy;

S. Sha�ei Kaleibari et al./Scientia Iranica, Transactions E: Industrial Engineering 23 (2016) 1904{1917 1909
Figure 1. The energy supply chain network in Iran.
z1j2 Delivered energy to distributionsection;
z11j2 Energy delivered to the �rst
distribution company;z2
1j2 Energy delivered to the seconddistribution company;
z31j2 Energy delivered to the third
distribution company;z4
1j2 Energy delivered to the fourthdistribution company;
x1j1 Total station's capacity (mega voltampere);
x2j1 Length of transmission lines;x3j1 Imported energy from neighboring
power companies;x4j1 Labor of transmission section;x5j1 Labor of distribution section;y1j1 Energy losses of transmission;y2j1 Exported energy to nearby companies;z1j3 Total sold energy;z2j3 Number of customers.
All indexes of distribution section, i.e. labor, totalsold energy, and number of customers, are de�nedseparately for each of the parallel subsystems of thissection. Energy losses of transmission index (y1j1) is an
undesirable output, and lower values for this index aremore desirable for decision-makers. Since the objectivefunction in this study was to maximize output, theoriginal values for y1j1 were converted to (y1j1)�1 formaximizing it, which is desired for this index.
In Figure 1, the second system of supply chainhas parallel subsystems. The number of subsystems(distribution companies) is not the same in all DMUsand according to the data, each DMU may have 1, 2, 3,or 4 subsystems as distribution companies. Therefore,the mark \-" is used for some units to indicate theabsence of subsystem for distribution section of thatDMU. The raw data of this case study belongs to a�ve-year period from 2007 to 2011, which have not beenbrought for saving space. Due to the increasing numberof indexes compared to the number of DMUs, thusreducing discriminative power of NDEA, these datawere used as time series for �ve consecutive years. Infact, each year is considered as one DMU for regionalelectricity companies. Therefore, the total number ofDMUs in this article is 80. Finally, the mean valuesof e�ciency of regional power company in the past �veyears are considered as the company's e�ciency scorefor analyzing the results.
4. Modeling the designed network
According to the descriptions, a comprehensive model,which is a combination of series and parallel structuresmodel, is presented. Iran's energy supply chain net-

1910 S. Sha�ei Kaleibari et al./Scientia Iranica, Transactions E: Industrial Engineering 23 (2016) 1904{1917
Table 1. Weights of indexes.
z1j0 z2j0 z1j1 x1j1 x2j1 x3j1 x4j1 x5j3 y1j1 y2j1 z1j2 z1j3 z2j3
0.1837 0.0167 0.2280 0.1418 0.0225 0.0283 0.0381 0.0104 0.0127 0.088 0.0470 0.1146 0.0682
work can be de�ned as follows:
Ek = maxXl2lpp=3
wlpzlkp +2Xr=1p=1
uryrkp;
s.t.Xl2lpp=0
wlpzlkp +5Xi=1p=1
vixikp = 1;
0BB@Xl2lpp=3
wlpzljp +2Xr=1p=1
uryrjp
1CCA�0BB@Xl2lpp=0
wlpzljp +5Xi=1p=1
vixijp
1CCA � 0
j = 1; � � � ; 80;0BB@Xl2lpp=3
wlpzljp
1CCA�0BB@Xl2lpp=2
wlpzljp
1CCA � 0 j = 1; � � � ; 80;
w13z11j3 + w23z1
2j3 � w12z11j2 � 0 j = 1; � � � ; 80;
w13Z21j3+w23Z2
2j3� w12z21j2 � 0 j = 1; � � � ; 80;
w13z31j3 + w23z3
2j3 � w12z31j2 � 0 j = 1; � � � ; 80;
w13z41j3 + w23z4
2j3 � w12z41j2 � 0 j = 1; � � � ; 80;0BB@X
l2lpp=2
wlpzljp +2Xr=1p=1
uryrjp
1CCA�0BB@Xl2lpp=1
wlpzljp +5Xi=1p=1
vixijp
1CCA � 0
j = 1; � � � ; 80;0BB@Xl2lpp=1
wlpzljp
1CCA�0BB@Xl2lpp=0
wlpzljp
1CCA � 0
j = 1; � � � ; 8;ur; vi; wlp � 0; (5)
where:zljp lth input or output of pth step for
DMUj ;wlp Attributed weight in model;yrjp rth output of pth step for DMUj ;ur Attributed weight in model;xijp ith input of pth step for DMUj ;vi Attributed weight in model;xtijp ith input of tth electricity distribution
company in pth step for DMUj ;vi Attributed weight in model.
To enter assurance region into Model (5), weightsderived from Model (4) are used. These weights aregiven in Table 1.
By entering these weights as upper bounds, the�nal NDEA/AR model is obtained. Therefore, bytaking into account the assurance region, NDEA modelis de�ned as follows:
Ek = maxXl2lpp=3
wlpzlkp +2Xr=1p=1
uryrkp;
s.t.Xl2lpp=0
wlpzlkp +5Xi=1p=1
vixikp = 1;
0BB@Xl2lpp=3
wlpzljp +2Xr=1p=1
uryrjp
1CCA�0BB@Xl2lpp=0
wlpzljp +5Xi=1p=1
vixijp
1CCA � 0
j = 1; � � � ; 80;0BB@Xl2lpp=3
wlpzljp
1CCA�0BB@Xl2lpp=2
wlpzljp
1CCA � 0

S. Sha�ei Kaleibari et al./Scientia Iranica, Transactions E: Industrial Engineering 23 (2016) 1904{1917 1911
j = 1; � � � ; 80;
w13z11j3 + w23z1
2j3 � w12z11j2 � 0 j = 1; � � � ; 80;
w13Z21j3+w23Z2
2j3� w12z21j2 � 0 j = 1; � � � ; 80;
w13z31j3 + w23z3
2j3 � w12z31j2 � 0 j = 1; � � � ; 80;
w13z41j3 + w23z4
2j3 � w12z41j2 � 0 j = 1; � � � ; 80;0BB@X
l2lpp=2
wlpzljp +2Xr=1p=1
uryrjp
1CCA�0BB@Xl2lpp=1
wlpzljp +5Xi=1p=1
vixijp
1CCA � 0
j = 1; � � � ; 80;0BB@Xl2lpp=1
wlpzljp
1CCA�0BB@Xl2lpp=0
wlpzljp
1CCA � 0
j = 1; � � � ; 80;
0 � u1 � weight y1; 0 � u2 � weight y2;
0 � v1 � weight x1; 0 � v2 � weight x2;
0 � v3 � weight x3; 0 � v4 � weight x4;
0 � v5 � weight x5; 0 � w10 � weight w10;
0 � w20 � weight w20; 0 � w11 � weight w11;
0 � w12 � weight w12; 0 � w13 � weight w13;
0 � w23 � weight w23: (6)
Let u�r , v�i and w�lp be the optimal multipliers obtainedfrom running Model (6). Subsequently, the e�ciencyof each unit and subunit for DMUj can be de�ned asbelow:
EDistribution (1) =�w�13z
11j3 + w�23z
12j3��w�12z
11j2;
j = 1; � � � ; 80;
EDistribution (2) =�w�13Z
21j3 + w�23Z
22j3��w�12z
21j2;
j = 1; � � � ; 80;
EDistribution (3) =�w�13z
31j3 + w�23z
32j3��w�12z
31j2;
j = 1; � � � ; 80;
EDistribution (4) =�w�13z
41j3 + w�23z
42j3��w�12z
41j2;
j = 1; � � � ; 80;
Etransmition =
0BB@Xl2lpp=2
w�lpzljp +2Xr=1p=1
u�ryrjp
1CCA,0BB@X
l2lpp=1
w�lpzljp +5Xi=1p=1
v�i xijp
1CCA ;
j = 1; � � � ; 80;
Egeneration =
0BB@Xl2lpp=1
w�lpzljp
1CCA,0BB@Xl2lpp=0
w�lpzljp
1CCA ;
j = 1; � � � ; 80: (7)
5. Optimization
The optimization process presented in this article isbased on the values of slack and surplus variables forindexes. As NDEA models are linear programing, theycan be used to ascertain the indexes of units that shouldincrease or decrease according to their reference sets.The ine�cient units can be e�cient similar to the unitsin their reference set, if they can produce the targetvalues of output using the target level of inputs. Thetarget points x
oand y
oare calculated using the following
equation [34]:
(xio; yro)!�xio
= �oxio � s�i ; yio = yio + s+r
�: (8)
�o is the e�ciency score of DMUo that can be obtainedfrom dual or primary model. Input slacks (s�i ) indicateneeded reductions in related inputs, and output slacks(s+i ) represent needed increase in related outputs.
The di�erence between the actual values and targetvalues of inputs (xio � x
io) shows the reduction, while
the di�erence between the target values and observedvalues of outputs (yio � y
io) represents the amount of
outputs to be increased in order to become e�cient.

1912 S. Sha�ei Kaleibari et al./Scientia Iranica, Transactions E: Industrial Engineering 23 (2016) 1904{1917
Table 2. Obtained results from all three models.
Numberof
DMUs
Namesof DMUs
Rank TEscore
Rank NDEA/ARscore
Rank NDEAscore
1 Azarbaijan 6 2.15117 3 0.94032 4 0.943040342 Esfehan 5 2.16507 7 0.86361 10 0.863655403 Bakhtar 12 1.50894 5 0.88206 6 0.882059144 Tehran 1 3.03890 4 0.89022 5 0.890216125 Khorasan 3 2.45168 9 0.85575 7 0.871569626 Khozestan 8 1.86526 11 0.71051 12 0.710880647 Zanjan 16 0.71420 14 0.59418 16 0.595294208 Semnan 14 1.18485 12 0.67737 1 0.991037689 Sistan 15 1.08173 16 0.43135 14 0.6482197410 Gharb 13 1.32556 10 0.81023 11 0.8181762611 Fars 7 1.87375 6 0.86433 8 0.8693714612 Kerman 10 1.57442 8 0.86359 9 0.8677184413 Gilan 2 2.76235 2 0.96927 3 0.9692650614 Mazandaran 4 2.34352 1 0.97197 2 0.9720005615 Hormozgan 9 1.78090 13 0.65127 13 0.6512732016 Yazd 11 1.53606 15 0.57184 15 0.62556984
6. Results and discussion
Results of the three models using Lingo software areshown in Table 2.
According to NDEA principles, a system is e�-cient if only all its subsystems are e�cient. As a result,in such a wide network, obtaining e�ciency with thescore of 1 is extremely unlikely. In general, it can besaid that this is a frequent event in NDEA application.Thus, the criterion for judging the e�ectiveness ofDMUs is higher scores of e�ciency. The �rst column ofTable 2 shows the number of DMUs, the second is thenames of DMUs, columns 3, 5, and 7 indicate ranksof units based on three proposed models. Columns4, 6, and 8 are e�ciency scores of DMUs. In thisstudy, the basis for ranking is the results of NDEA/ARmodel. Two other methods were used for comparisonand validation. Results of the �fth column of Table 2demonstrate that DMU13 and DMU14 in NDEA/ARmethod are the most e�cient units. These units, too,achieved high e�ciency scores in two other methods.In addition, according to these results, DMU9 andDMU16 are the most ine�cient units while havinglower e�ciencies in other methods.
To verify the results of three models, non-parametric Spearman correlation test (rs) andKendall's Tau correlation test (�) were employed inSPSS Software. Table 3 reports rs between rankingsof the models, which resulted in the rejection of H0 at0.01 level. Moreover, Kendall's Tau test con�rmed this�nding at the same level of signi�cance.
Table 3. Correlation between models.
NDEA/AR&
NDEA
NDEA&
TE
NDEA/AR&
TEKendal's Tau 0.7 0.42 0.55Spearman 0.77 0.52 0.74
According to Table 3, it can be clearly seenthat the correlation rate between NDEA/AR andTE is higher than that between NDEA and TE.Furthermore, according to NDEA results (i.e. eighthcolumn in Table 2), DMU8, DMU14 and DMU13ranked �rst, second, and third, respectively, howeveraccording to NDEA/AR (i.e. seventh column), DMU14and DMU13 ranked �rst and second, respectively,and DMU8 ranked 12th which indicates that DMU8has performed poorly in the indexes important tothe experts. The most important index in termsof expertise was generating energy (z1j1) and DMU8was found very weak according to this index. Theseoutcomes, besides the higher correlation rate, indicatethat using assurance region in NDEA methods led toachieving better and more realistic results. In otherwords, the NDEA/AR model was e�ective according tothe experts' viewpoints. To analyze the increasing anddecreasing trends of e�ciency for regional electricitycompanies, calculated e�ciencies from NDEA/AR inthe last �ve years are given in Table 4.
Table 4 shows that Kerman Regional ElectricCompany (DMU12) and Gillan (DMU13) had the top

S. Sha�ei Kaleibari et al./Scientia Iranica, Transactions E: Industrial Engineering 23 (2016) 1904{1917 1913
Table 4. E�ciency score of NDEA/AR model.
Namesof
DMUs
2007 2008 2009 2010 2011
DMUs E�ciencyscores
DMUs E�ciencyscores
DMUs E�ciencyscores
DMUs E�ciencyscores
DMUs E�ciencyscores
Azarbaijan 1 0.9519691 17 0.9643588 33 0.9455851 49 0.9456086 65 0.8940663Esfehan 2 0.9655209 18 0.9711506 34 0.8624931 50 0.8022415 66 0.7166557Bakhtar 3 0.8031276 19 0.9483316 35 0.9153569 51 0.8819385 67 0.8615411Tehran 4 0.9396117 20 0.9578501 36 0.8655095 52 0.8471559 68 0.8409534Khorasan 5 0.9629956 21 0.9843991 37 0.8363535 53 0.8363739 69 0.6586421Khozestan 6 0.8265885 22 0.712349 38 0.6234209 54 0.6159828 70 0.7742332Zanjan 7 0.6712896 23 0.9343764 39 0.4179298 55 0.4949085 71 0.4523897Semnan 8 0.8431468 24 0.5232251 40 0.9293339 56 0.639341 72 0.4517816Sistan 9 0.3686625 25 0.5297801 41 0.4374939 57 0.4459096 73 0.3749249Gharb 10 0.7657869 26 0.9261429 42 0.9078139 58 0.7387821 74 0.712618Fars 11 0.9762972 27 0.9444089 43 0.9585943 59 0.7749404 75 0.6674183Kerman 12 0.9960169 28 0.9263354 44 0.9913664 60 0.8430777 76 0.5611622Gilan 13 0.9093013 29 0.9944486 45 0.9944896 61 0.9946948 77 0.953391Mazandaran 14 0.9957679 30 0.9872864 46 0.9607612 62 0.9642231 78 0.951826Hormozgan 15 0.6046937 31 0.4989872 47 0.525958 63 0.7159716 79 0.9107555Yazd 16 0.6050259 32 0.6564377 48 0.5602491 64 0.5502185 80 0.4872815
Figure 2. E�ciency comparison between four bestDMUs.
performances in 2007 and during 2008-2011, respec-tively. For further analysis, e�ciencies of the �rst fourhighly ranked regional electricity companies (DMU14,DMU13, DMU1, and DMU4) using NDEA/AR areshown in Figure 2.
According to Figure 2, during 2007 to 2011,performance of Mazandaran and Gilan companies(DMU14 and DMU13) are almost one. During �veyears, Mazandaran Regional Electric Company has hadless variation and could get the best ranks. Moreover, itis clear from Table 4 that performance of MazandaranCompany in 2007 had the highest value (0.9957679);
however, its e�ciency has been reduced over time.According to Figure 2, DMU13 from 2008 to 2011 hadfewer variations in terms of e�ciency score. However,in 2007, it had the lowest e�ciency score (0.9093013),which is the main reason for its decline in the overalle�ciency scores. Nevertheless, its performance hasimproved since 2007, and it has been the best DMUin the recent years. Table 5 shows e�ciency valuescalculated for subsystems of energy supply chain usingModels (7) for 5 years. The second column of thetable demonstrates regional electricity companies, thethird column is the e�ciency of generation section,the fourth column is the e�ciency of transmission,and the �fth to eighth columns indicate e�ciencyof distribution subsystems. In this table, mark \-" implies absence of subsystems for that particularDMU; for example, Azerbaijan and Khorasan had fourdistribution companies, while Zanjan, Semnan, Sistan,Gilan, Yazd, and Hormozgan had only one distributionsubsystem.
The third column of Table 5 shows that, ingeneration sector, Fars (DMU11), Gilan (DMU13), andMazandaran (DMU14) are the most e�cient units,whereas Semnan company is an ine�cient DMU ingenerating energy. According to the fourth column,Mazandaran (DMU14), Azerbaijan (DMU1), and Gi-lan (DMU13) are the most e�cient companies intransmitting energy, while Zanjan (DMU7) stands inthe opposite point. Results from the fourth to eighthcolumns of distribution section show that the thirdsubsystem of distribution section (i.e. Mazandaran
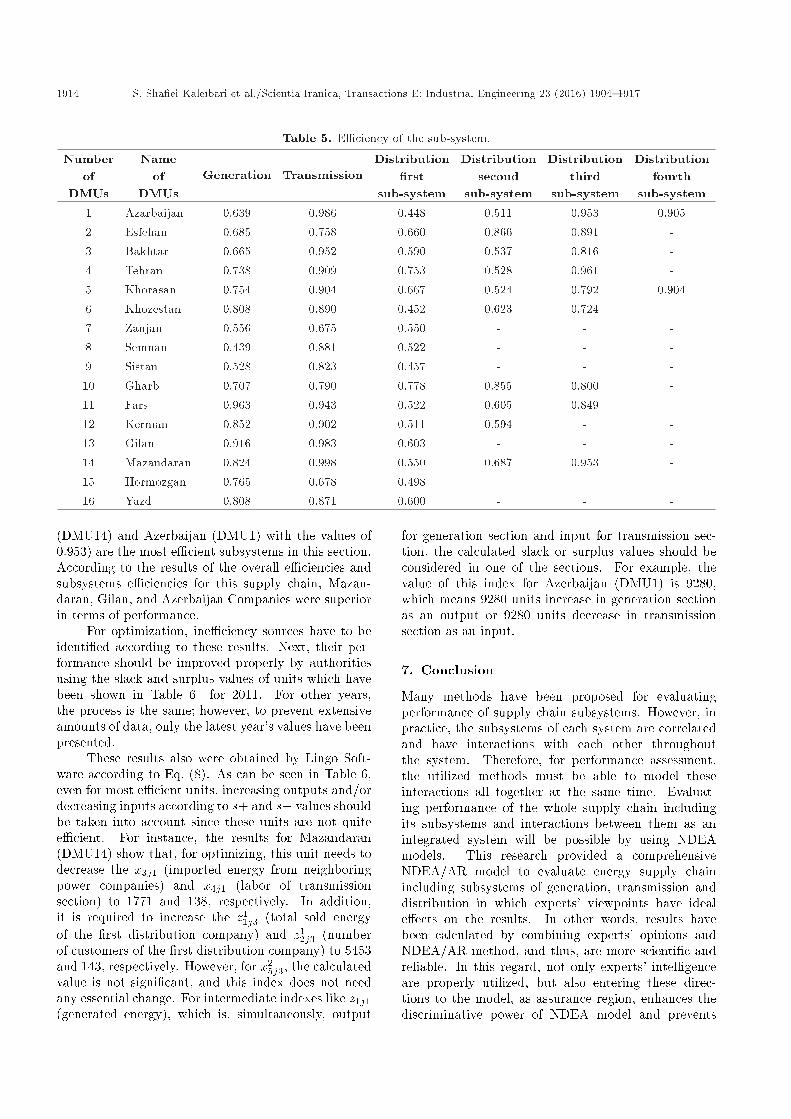
1914 S. Sha�ei Kaleibari et al./Scientia Iranica, Transactions E: Industrial Engineering 23 (2016) 1904{1917
Table 5. E�ciency of the sub-system.
Numberof
DMUs
Nameof
DMUsGeneration Transmission
Distribution�rst
sub-system
Distributionsecond
sub-system
Distributionthird
sub-system
Distributionfourth
sub-system1 Azarbaijan 0.639 0.986 0.448 0.511 0.953 0.9052 Esfehan 0.685 0.758 0.660 0.866 0.891 -3 Bakhtar 0.665 0.952 0.590 0.537 0.816 -4 Tehran 0.738 0.909 0.753 0.528 0.961 -5 Khorasan 0.754 0.904 0.667 0.524 0.792 0.9046 Khozestan 0.808 0.890 0.452 0.623 0.724 -7 Zanjan 0.556 0.675 0.550 - - -8 Semnan 0.439 0.881 0.522 - - -9 Sistan 0.528 0.823 0.457 - - -10 Gharb 0.707 0.790 0.778 0.855 0.800 -11 Fars 0.963 0.943 0.522 0.605 0.849 -12 Kerman 0.852 0.902 0.511 0.594 - -13 Gilan 0.916 0.983 0.603 - - -14 Mazandaran 0.824 0.998 0.550 0.687 0.953 -15 Hormozgan 0.765 0.678 0.498 - - -16 Yazd 0.808 0.871 0.600 - - -
(DMU14) and Azerbaijan (DMU1) with the values of0.953) are the most e�cient subsystems in this section.According to the results of the overall e�ciencies andsubsystems e�ciencies for this supply chain, Mazan-daran, Gilan, and Azerbaijan Companies were superiorin terms of performance.
For optimization, ine�ciency sources have to beidenti�ed according to these results. Next, their per-formance should be improved properly by authoritiesusing the slack and surplus values of units which havebeen shown in Table 6 for 2011. For other years,the process is the same; however, to prevent extensiveamounts of data, only the latest year's values have beenpresented.
These results also were obtained by Lingo Soft-ware according to Eq. (8). As can be seen in Table 6,even for most e�cient units, increasing outputs and/ordecreasing inputs according to s+ and s� values shouldbe taken into account since these units are not quitee�cient. For instance, the results for Mazandaran(DMU14) show that, for optimizing, this unit needs todecrease the x3j1 (imported energy from neighboringpower companies) and x4j1 (labor of transmissionsection) to 1771 and 138, respectively. In addition,it is required to increase the z1
1j3 (total sold energyof the �rst distribution company) and z1
2j3 (numberof customers of the �rst distribution company) to 5453and 143, respectively. However, for x2
5j3, the calculatedvalue is not signi�cant, and this index does not needany essential change. For intermediate indexes like z1j1(generated energy), which is, simultaneously, output
for generation section and input for transmission sec-tion, the calculated slack or surplus values should beconsidered in one of the sections. For example, thevalue of this index for Azerbaijan (DMU1) is 9280,which means 9280 units increase in generation sectionas an output or 9280 units decrease in transmissionsection as an input.
7. Conclusion
Many methods have been proposed for evaluatingperformance of supply chain subsystems. However, inpractice, the subsystems of each system are correlatedand have interactions with each other throughoutthe system. Therefore, for performance assessment,the utilized methods must be able to model theseinteractions all together at the same time. Evaluat-ing performance of the whole supply chain includingits subsystems and interactions between them as anintegrated system will be possible by using NDEAmodels. This research provided a comprehensiveNDEA/AR model to evaluate energy supply chainincluding subsystems of generation, transmission anddistribution in which experts' viewpoints have ideale�ects on the results. In other words, results havebeen calculated by combining experts' opinions andNDEA/AR method, and thus, are more scienti�c andreliable. In this regard, not only experts' intelligenceare properly utilized, but also entering these direc-tions to the model, as assurance region, enhances thediscriminative power of NDEA model and prevents

S. Sha�ei Kaleibari et al./Scientia Iranica, Transactions E: Industrial Engineering 23 (2016) 1904{1917 1915
Table 6. The slacks and surpluses values for the NDEA/AR in 2011.A
zarb
aija
n
Esf
ehan
Bak
htar
Teh
ran
Khor
asan
Khoz
esta
n
Zan
jan
Sem
nan
Sis
tan
Ghar
b
Fars
Ker
man
Gilan
Maz
andar
an
Hor
moz
gan
Yaz
d
Z1j0 0 0 0 0 0 0 0 0 0 0 0 0 0 0 0 0Z2j0 0 0 0 0 0 0 0 0 0 0 0 0 0 0 0 0Z1j1 9280 13465 0 21018 7746 5742 0 0 1517 5105 0 1639 0 0 0 0X1j1 4550 6258 0 21334 9698 15446 0 34 0 3312 4124 0 2310 0 0 0X2j1 0 2529 630 0 1268 497 349 0 0 3212 160 0 0 0 0 0X3j1 5979 5377 4463 4505 10043 3498 0 152 778 4751 5973 0 1593 1771 326 0X4j1 454 0 45 562 340 379 85 3 84 153 71 0 63 138 73 29Y1j1 0 0 0 0 0 0 0 0 0 0 0 0 0 0 0 0Y2j1 0 0 0 0 0 0 0 0 485 655 0 0 0 0 0 0z1
1j2 0 0 1199 0 0 2594 0 0 0 0 3265 0 0 0 0 0z2
1j2 0 5198 0 1490 0 2461 0 0 0 0 0 0 74 0 479 163z3
1j2 0 0 0 0 19 0 0 0 0 0 0 0 94 0 606 206z4
1j2 0 52 0 0 0 0 0 0 0 225 907 0 0 0 0 0x1
5j3 0 0 0 0 0 0 0 0 0 0 0 0 0 0 0 0x2
5j3 441 0 0 0 0 0 0 0 0 0 0 0 0 0.7 0 0x3
5j3 0 0 0 0 0 66 0 0 0 0 0 0 0 0 0 0x4
5j3 0 0 0 0 0 0 0 0 0 0 0 0 0 0 0 0z1
1j3 4239 0 0 10107 2913 1953 895 1100 588 1884 8648 2131 3530 5453 0 0z1
2j3 91 0 218 0 0 192 0 38 0 0 196 211 0 143 615 0z2
1j3 2294 1345 1713 1242 3940 0 0 0 0 742 278 0 0 0 0 0z2
2j3 21 344 104 125 456 0 0 0 0 0 75 0 0 0 0 0z3
1j3 88 0 0 0 536 0 0 0 0 0 0 0 0 0 0 0z3
2j3 0 0 0 0 71 16 0 0 0 0 0 0 0 0 0 0z4
1j3 112 0 0 0 0 0 0 0 0 0 0 0 0 0 0 0z4
2j3 0 0 0 0 0 0 0 0 0 0 0 0 0 0 0 0
ignoring some indexes' roles in calculating e�ciencyscore. Another important capability of the proposedmodel was that it calculated e�ciency of the wholesystem and subsystems simultaneously. Calculatedscores for subsystems' e�ciencies will identify ine�-cient units. Subsequently, optimization measurementscan be done within these subsystems by analyzingslack and surplus values. Finally, if these actions weredone systematically for all of the ine�cient units, ane�cient supply chain will be achievable. Reaching suchresults is the goal of all sectors, and this model hasthe ability to produce a brief and monolithic data forauthorities to detect and optimize weaknesses in thesupply chain. Furthermore, according to the di�erencesin available resources, geographical conditions andcurrent policies between countries, weights of indexmay not be the same for all regions. However, theycan be de�ned based on decision-makers' preferences.Owing to exibility of NDEA, the presented model ishighly adaptable and can be implemented for every
supply chain. Considering these issues, it seems fairto suggest that the presented model can be used as aframework for evaluating supply chain in each systemregardless of its size and location; however, it is moree�ective in policy and decision making in bigger scales.
Acknowledgement
The authors are cordially grateful for the anonymousreviewers, as this paper could not have reached thisquality without their constructive comments and usefulremarks.
References
1. Panjeshahi, M.H.P., Harati, F. and Nouzari, M.M.\Improving energy e�ciency in natural gas re�neries,using energy analysis", Chem. Eng. Trans., 21, pp.121-126 (2010).
2. Ostadi, H. and Fatehi, J. \The e�ect of energy con-

1916 S. Sha�ei Kaleibari et al./Scientia Iranica, Transactions E: Industrial Engineering 23 (2016) 1904{1917
sumption on economic growth in industrialized G8countries", Int. J. Acad. Res. Bus. Soc. Sci., 4(5), pp.355-369 (2014).
3. Zhou, P., Ang, B.W. and Zhou, D.Q. \Measuringeconomy-wide energy e�ciency performance: A para-metric frontier approach", Appl. Energy, 90(1), pp.196-200 (2012).
4. Hu, J.-L., Lio, M.-C., Yeh, F.-Y. and Lin, C.-H.\Environment-adjusted regional energy e�ciency inTaiwan", Appl. Energy, 88(8), pp. 2893-2899 (2011).
5. Wang, Z.-H., Zeng, H.-L., Wei, Y.-M. and Zhang,Y.-X. \Regional total factor energy e�ciency: Anempirical analysis of industrial sector in China", Appl.Energy, 97(0), pp. 115-123 (2012).
6. Yadav, V.K., Padhy, N.P. and Gupta, H.O. \A microlevel study of an Indian electric utility for e�ciencyenhancement", Energy, 35(10), pp. 4053-4063 (2010).
7. See, K.F. and Coelli, T. \An analysis of factorsthat in uence the technical e�ciency of Malaysianthermal power plants", Energy Econ., 34(3), pp. 677-685 (2012).
8. Alizadeh, R., Majidpour, M., Maknoon, R. and Sha�eiKaleibari, S. \Clean development mechanism in Iran:Does it need a revival?", Int. J. Global Warm. (InPress).
9. Jarait_e, J. and Di Maria, C. \E�ciency, productivityand environmental policy: A case study of powergeneration in the EU", Energy Econ., 34(5), pp. 1557-1568 (2012).
10. Solmes, L. Real Time Energy Infrastructure Invest-ment and Risk Management. Energy E�cien, L.Solmes, Springer Netherlands, pp. 1-212 (2009).
11. Omrani, H., Gharizadeh Beiragh, R. and Sha�eiKaleibari, S. \Performance assessment of Iranian elec-tricity distribution companies by an integrated co-operative game data envelopment analysis principalcomponent analysis approach", Int. J. Elect. PowerEnergy Syst., 64(0), pp. 617-625 (2015).
12. Fallahi, A., Ebrahimi, R. and Ghaderi, S.F. \Mea-suring e�ciency and productivity change in powerelectric generation management companies by usingdata envelopment analysis: A case study", Energy,36(11), pp. 6398-6405 (2011).
13. Vazhayil, J.P. and Balasubramanian, R. \Optimiza-tion of India's power sector strategies using weight-restricted stochastic data envelopment analysis", En-ergy Policy, 56(0), pp. 456-465 (2013).
14. Pardo Mart��nez, C. \Energy e�ciency development inGerman and Colombian non-energy-intensive sectors:a non-parametric analysis", Energy E�cien., 4(1), pp.115-131 (2011).
15. Liang, Q.-M., Fan, Y. and Wei, Y.-M. \The e�ectof energy end-use e�ciency improvement on China'senergy use and CO2 emissions: a CGE model-basedanalysis", Energy E�cien., 2(3), pp. 243-262 (2009).
16. Bas, E. \The integrated framework for analysis ofelectricity supply chain using an integrated SWOT-fuzzy TOPSIS methodology combined with AHP: Thecase of Turkey", Int. J. Elect. Power Energy Syst.,44(1), pp. 897-907 (2013).
17. Huang, Y.-J., Chen, K.-H. and Yang, C.-H. \Coste�ciency and optimal scale of electricity distribution�rms in Taiwan: An application of metafrontier anal-ysis", Energy Econ., 32(1), pp. 15-23 (2010).
18. Charnes, A., Cooper, W.W. and Rhodes, E. \Measur-ing the e�ciency of decision making units", Eur. J.Oper. Res., 2(6), pp. 429-444 (1978).
19. F�are, R. and Grosskopf, S. \Network DEA", Socio.Econ. Plan. Sci., 34(1), pp. 35-49 (2000).
20. Castelli, L., Pesenti, R. and Ukovich, W. \DEA-likemodels for e�ciency evaluations of specialized andinterdependent units", Eur. J. Oper. Res., 132(2), pp.274-286 (2001).
21. Lewis, H.F. and Sexton, T.R. \Network DEA: e�-ciency analysis of organizations with complex internalstructure", Comput. Oper. Res., 31(9), pp. 1365-1410(2004).
22. Prieto, A.M. and Zof��o, J.L. \Network DEA e�ciencyin input-output models: With an application to OECDcountries", Eur. J. Oper. Res., 178(1), pp. 292-304(2007).
23. Bai-Chen, X., Ying, F. and Qian-Qian, Q. \Doesgeneration form in uence environmental e�ciency per-formance? An analysis of China's power system",Appl. Energy, 96(0), pp. 261-271 (2012).
24. Chen, C. and Yan, H. \Network DEA model for supplychain performance evaluation", Eur. J. Oper. Res.,213(1), pp. 147-155 (2011).
25. Kao, C. \E�ciency decomposition in network dataenvelopment analysis: A relational model", Eur. J.Oper. Res., 192(3), pp. 949-962 (2009).
26. Kao, C. and Hwang, S.-N. \E�ciency measurementfor network systems: IT impact on �rm performance",Decis. Support Syst., 48(3), pp. 437-446 (2010).
27. Tone, K. and Tsutsui, M. \Network DEA: A slacks-based measure approach", Eur. J. Oper. Res., 197(1),pp. 243-252 (2009).
28. Hsieh, L.-F. and Lin, L.-H. \A performance evaluationmodel for international tourist hotels in Taiwan-Anapplication of the relational network DEA", Int. J.Hosp. Manag., 29(1), pp. 14-24 (2010).
29. Matthews, K. \Risk management and managerial e�-ciency in Chinese banks: A network DEA framework",Omega, 41(2), pp. 207-215 (2013).
30. Zhao, Y., Triantis, K., Murray-Tuite, P. and Edara,P. \Performance measurement of a transportationnetwork with a downtown space reservation system: Anetwork-DEA approach", Transp. Res. Part E: Logist.Transp. Rev., 47(6), pp. 1140-1159 (2011).
S. Sha�ei Kaleibari et al./Scientia Iranica, Transactions E: Industrial Engineering 23 (2016) 1904{1917 1917
31. Wang, Y.-M., Chin, K.-S. and Poon, G.K.K. \A dataenvelopment analysis method with assurance region forweight generation in the analytic hierarchy process",Decis. Support Syst., 45(4), pp. 913-921 (2008).
32. Wang, Y.-M. and Chin, K.-S. \A new data envel-opment analysis method for priority determinationand group decision making in the analytic hierarchyprocess", Eur. J. Oper. Res., 195(1), pp. 239-250(2009).
33. Cooper, W.W., Seiford, L.M. and Tone, K., A Compre-hensive Text with Models, Applications, References andDEA-Solver Software. Data Envelopment Analysis,Springer US: 1-490 (2007).
34. Azadeh, A., Ghaderi, S.F., Omrani, H. and Eivazy,H. \An integrated DEA-COLS-SFA algorithm for op-timization and policy making of electricity distributionunits", Energy Policy, 37(7), pp. 2605-2618 (2009).
Biographies
Saeed Sha�ei Kaleibari received his BSc degreein Industrial Engineering from Payam Noor Univer-sity of Tabriz, Iran. His research interests includesupply chain management and logistics, optimizationmethods, e�ciency and productivity analysis (DEA,SFA, etc.), decision support systems, multiple criteriadecision making, game theory, simulation, renewableenergies and climate policy. He has also severalpublications in international journals.
Ramin Gharizadeh Beiragh received his BSc andMSc degrees in Industrial Engineering from PayamNoor University of Tabriz, Iran, and from Urmia
University of Technology, Urmia, Iran respectively. Hisresearch interests are multiple criteria decision mak-ing, dame theory, e�ciency and productivity analysis(DEA, SFA, etc.), production planning, and control.He has several publications in international journals.
Reza Alizadeh received his BSc degree in IndustrialEngineering from Urmia University of Technology,Urmia, Iran, and holds a Master degree in TechnologyForesight from Amirkabir University of Technology(AUT), Tehran, Iran. He has been honored throughreceipt of the distinguished Master's Thesis Award ofAUT in 2014. He is a researcher at Future StudiesResearch Institute of AUT and Sustainability O�ce ofAUT. Also, he is a member of Iranian National EliteFoundation. His research interests include energy andclimate policy, strategic management, technology pol-icy and foresight, decision-making, and sustainability.He has more than ten papers in international journalsand conferences.
Maghsud Solimanpur is a Professor of IndustrialEngineering in the Faculty of Engineering at UrmiaUniversity, Urmia, Iran. He received his BSc and MScdegrees from Sharif University of Technology in 1994and 1997, respectively. Subsequently, he received hisPhD from the Indian Institute of Technology Delhi,New Delhi, India, in 2003. His research interestsare design of cellular manufacturing systems, facilitiesplanning and layout, optimization of manufacturingprocesses, meta-heuristics, etc. He has published morethan 100 papers in di�erent journals of repute andconferences.