A Forest Cover Change Study Gone...
29
A Forest Cover Change Study Gone Bad Lessons Learned(?) Measuring Changes in Forest Cover in Madagascar Ned Horning Center for Biodiversity and Conservation American Museum of Natural History ([email protected])
Transcript of A Forest Cover Change Study Gone...

A Forest Cover Change Study Gone Bad
Lessons Learned(?) Measuring Changes in Forest Cover in
Madagascar
Ned Horning Center for Biodiversity and Conservation
American Museum of Natural History ([email protected])
Overview of the project
Goal:
Use available data to determine the rates of forest loss in the periphery of six protected areas in Madagascar to see if USAID interventions were having an impact.
Datasets:
• 1950 Forest maps (1:100,000) based on photography acquired in the late 1940s
• 1991/1992 black and white aerial photography 1:40,000
• 1993/1994 Landsat TM images

The issues
1. Land cover classes ill defined
2. Post-classification overlay used to derive results
3. Inappropriate data sets
4. Incorrect equations
5. Results indiscriminately modified
6. Accuracy not assessed
The land cover classes were not well defined
• Three classes were interpreted (primary forest, secondary forest, and other) and none were defined
• Primary and secondary forest classes can be very difficult to differentiate using satellite imagery
• Variations within the secondary class were severe since the image analysis was performed by several different groups without significant training
Typical land cover accuracy figures
• Forest/nonforest, water/no water, soil/vegetated: accuracies in the high 90%
• Conifer/hardwood: 80-90% • Genus: 60-70% • Species: 40-60% • Bottom line: The greater the detail (precision) the lower the
per class accuracy
• Note: If including a Digital Elevation Model (DEM) in the classification accuracy typically improves by up to 10%
Recommendations
• Use the fewest number of classes that are practical - forest/non-forest in this case
• Clearly describe land cover classes before the analysis phase (an interpretation key can be helpful)
• Define classes that can be reliably interpreted using the available data
• Provide sufficient training

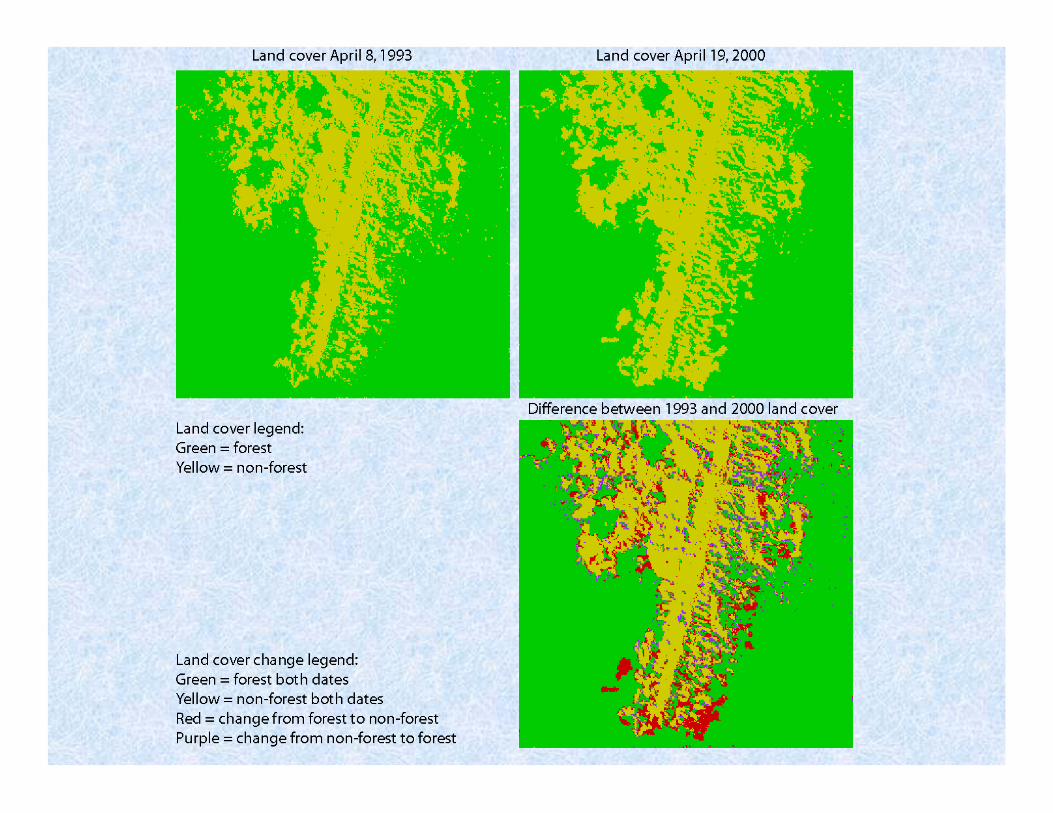
Used post-classification overlay to derive results
• Post-classification is the most common change detection method and is rarely the best choice, especially when the change-class of interest comprises a small percent of the entire area
• The errors from the individual layers are present in the final change image
• Error estimates for individual layers (dates) were not known
• Geometric registration errors were compounded since different data sets were compared using automated methods

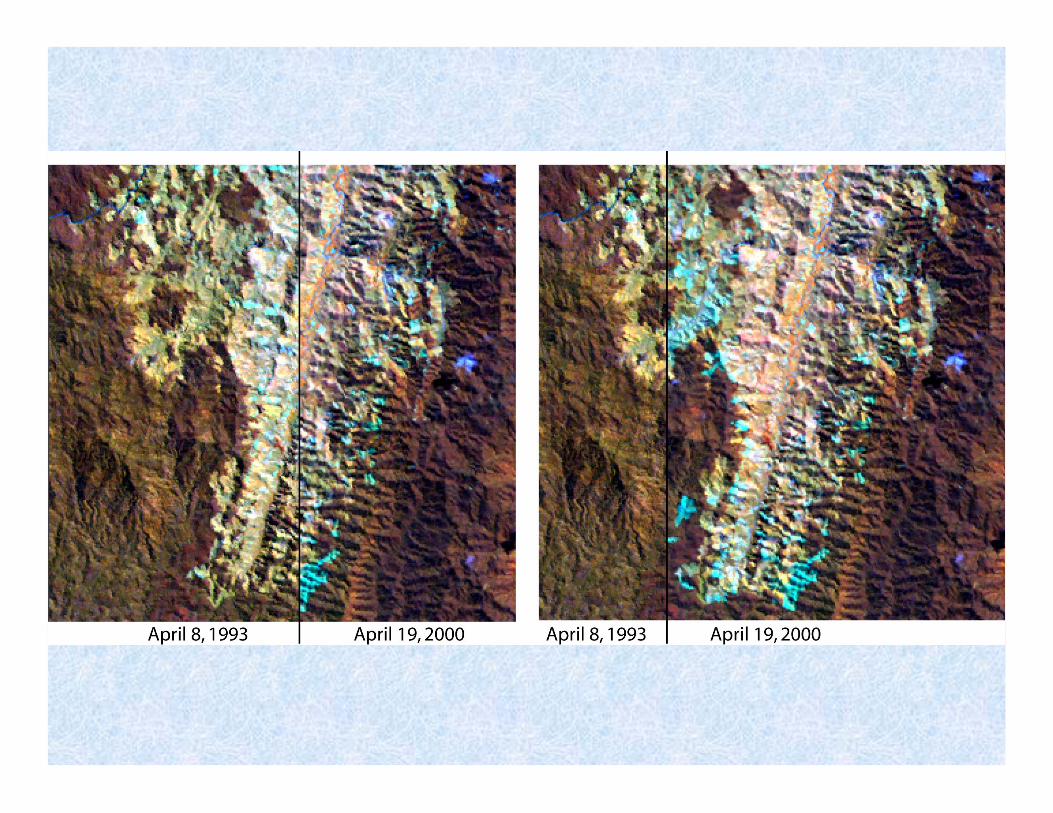
• Compare two classified images or thematic maps (post-classification)
• Visually superimpose or flicker/swipe images from two dates then manually digitize change
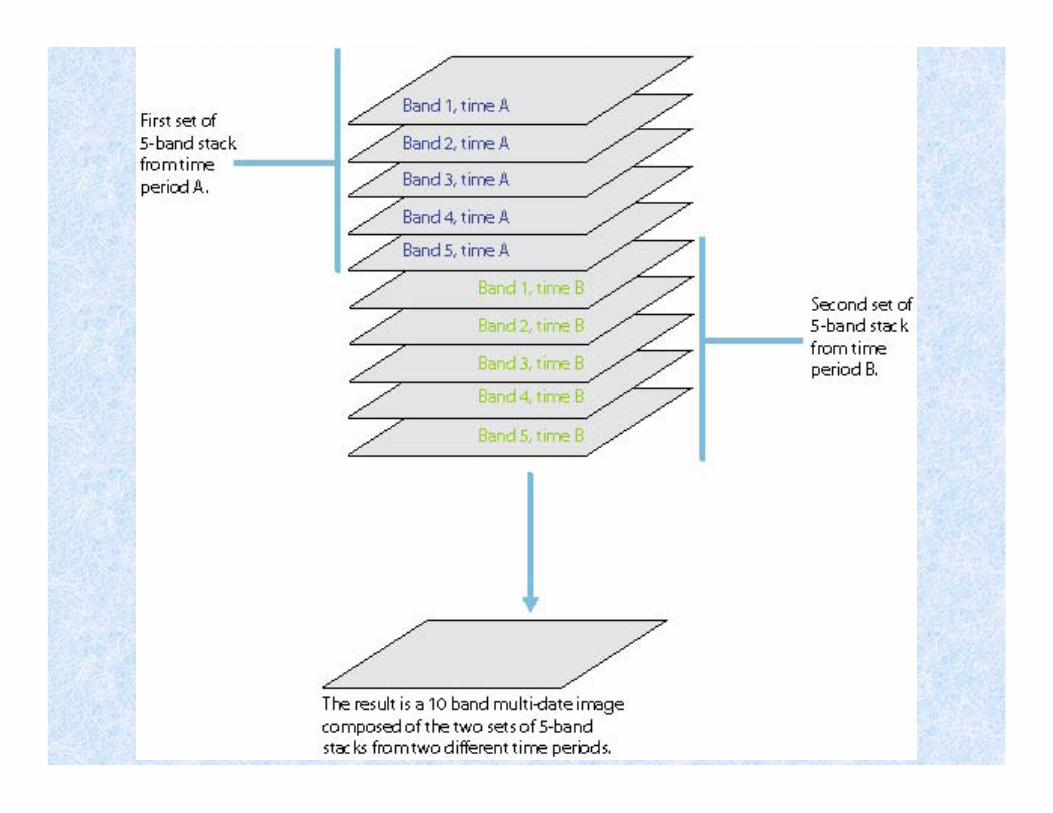
• Multi-date composite classification
• Image math to calculate difference or ratio images
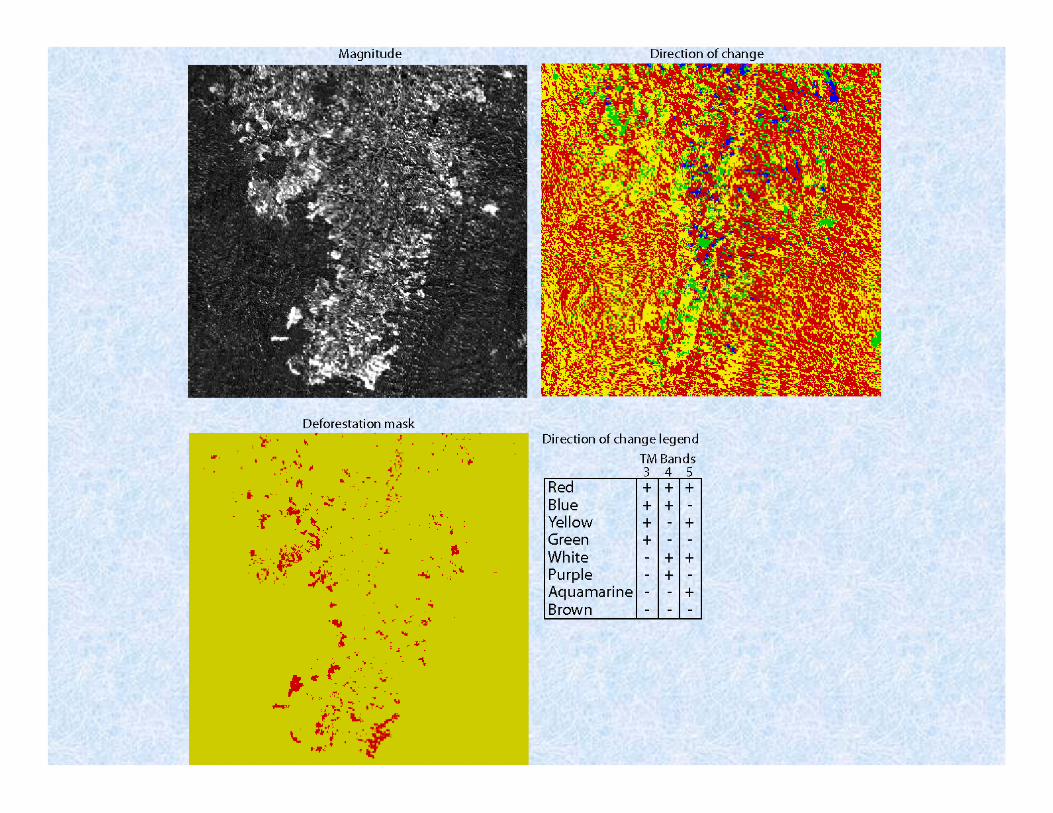
• Spectral change vectors (direction and intensity)
Common change detection techniques
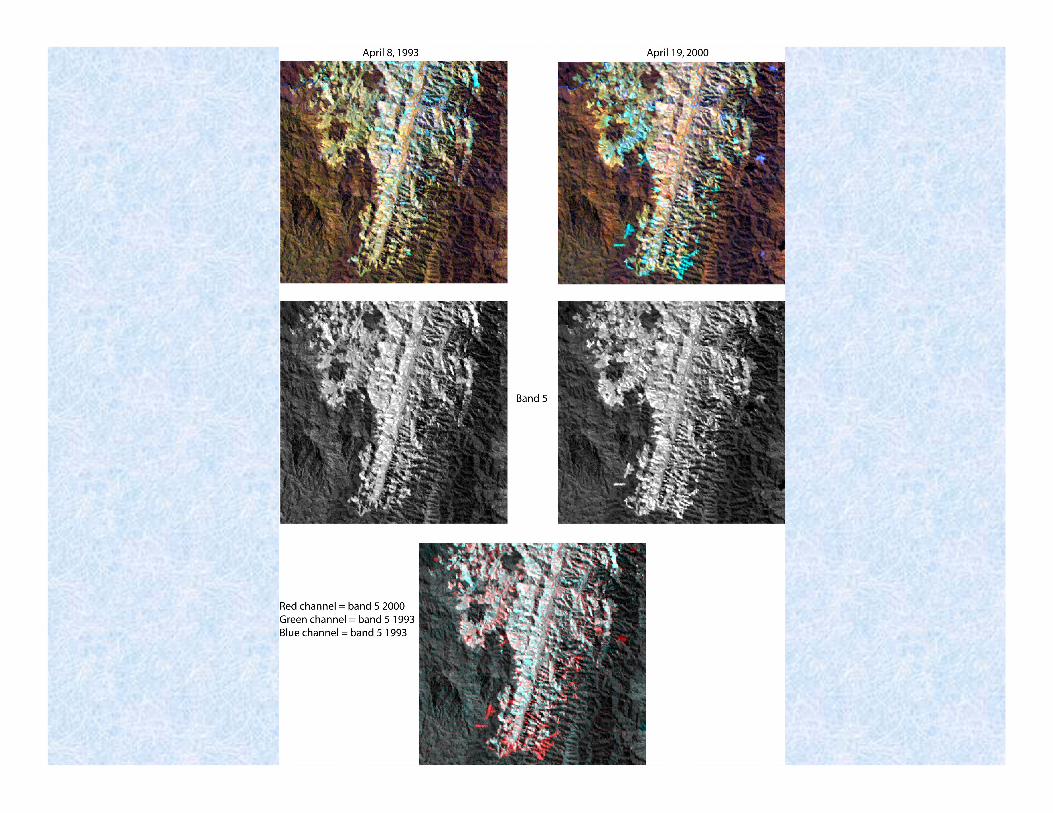
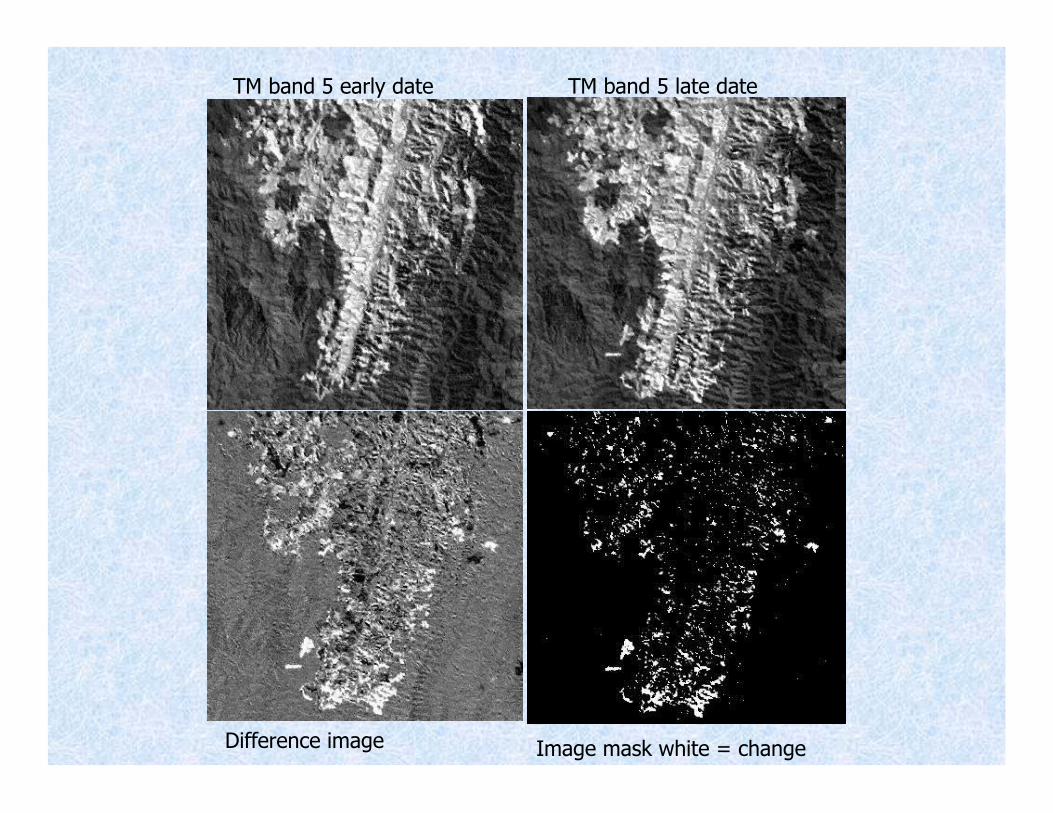
TM band 5 early date TM band 5 late date
Difference image Image mask white = change

Recommendations
• Avoid post-classification approach if possible – use direct measurement techniques to map change
• Editing land cover maps can be used to update land cover and create change maps
• If different groups participate in the analysis it is critical that they all follow the same guidelines and their work must be inspected for quality control

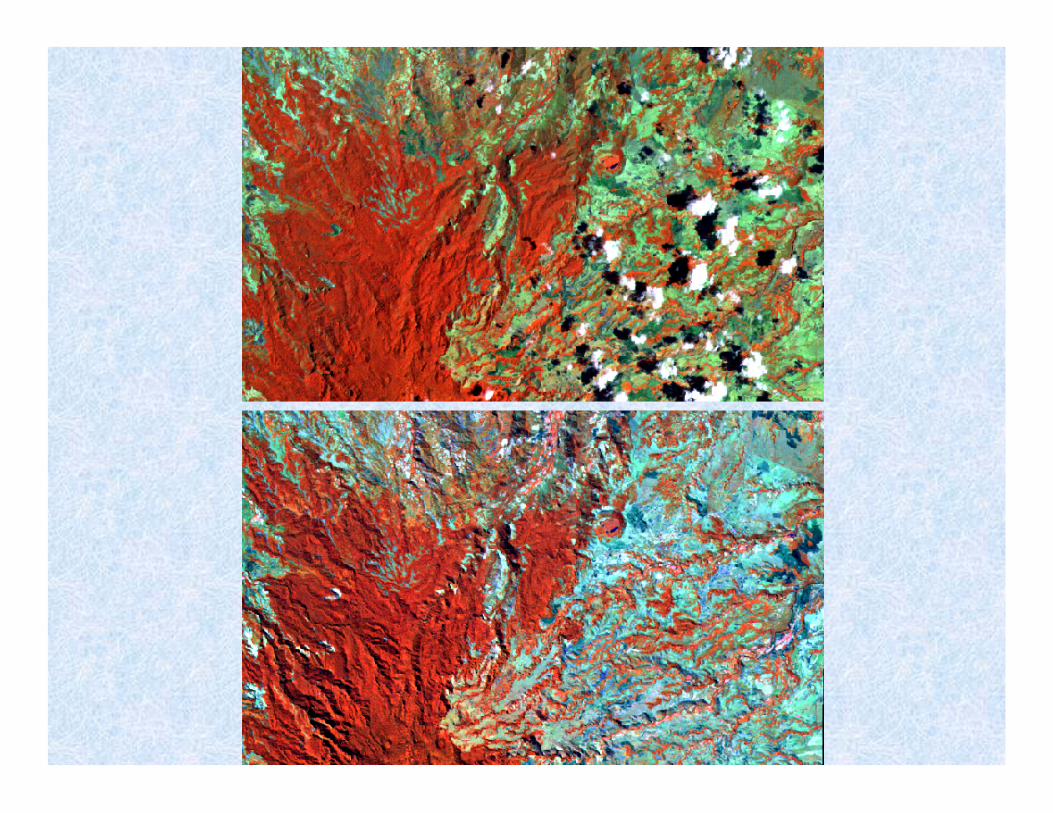
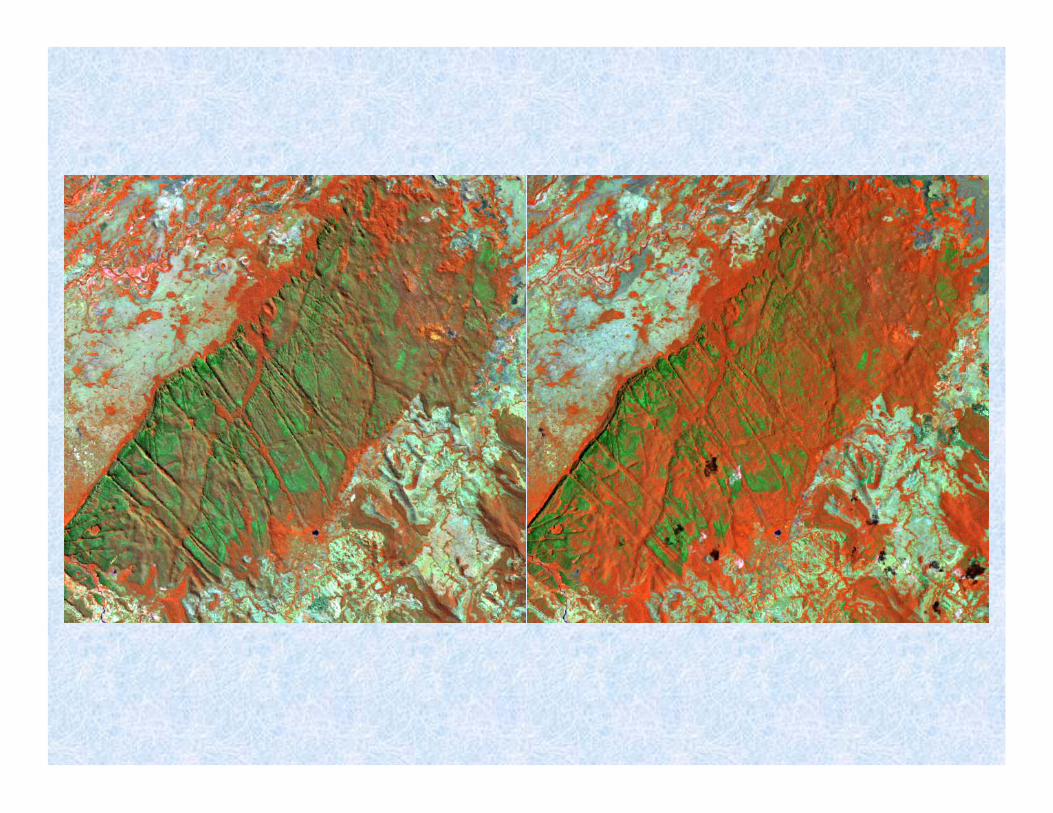
The data sets and interpretation methods were not appropriate
• Different data set types were used for each time period and season of image acquisition varied significantly
• The original photos used to create the forest cover maps were available
• The 1991/1992 aerial photos were not orthorectified and were interpreted manually without a stereoscope or other suitable instrument
• Landsat TM data are not well suited for monitoring change in small areas, especially when the time interval is short and the terrain variation is significant
• The Landsat TM images were converted to 255-color index images
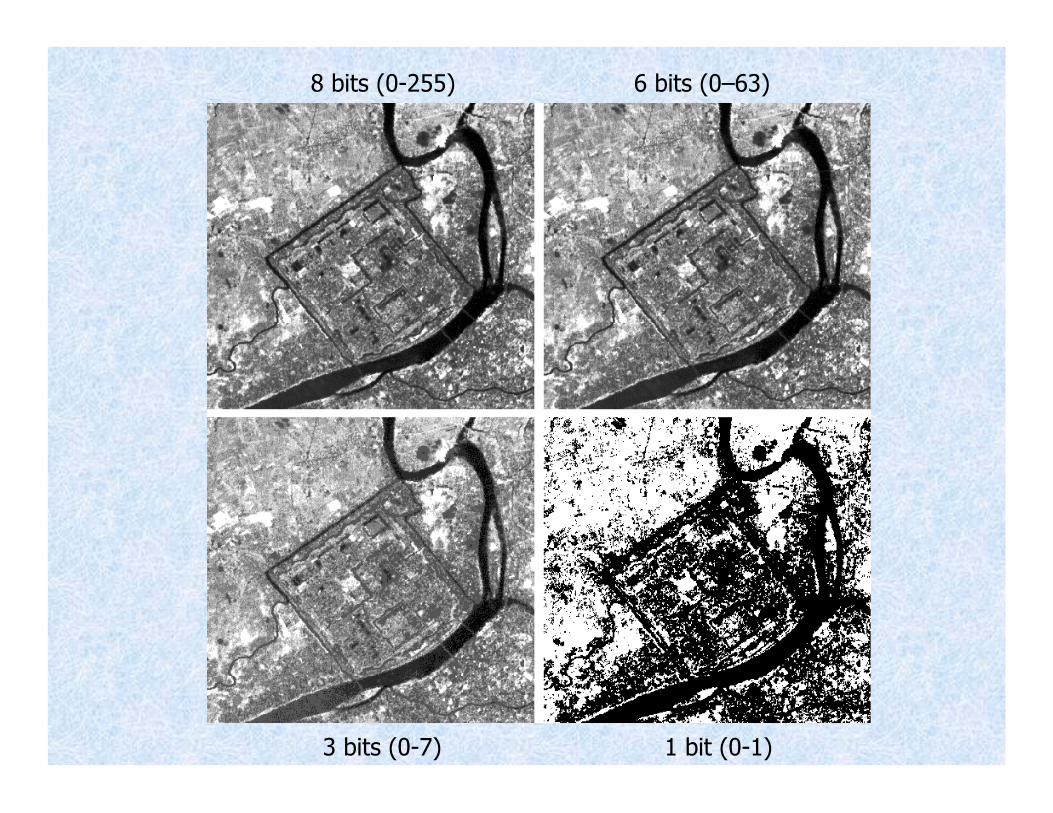
8 bits (0-255) 6 bits (0–63)
3 bits (0-7) 1 bit (0-1)
Recommendations
• Use aerial photos from the 1940’s and 1950’s in place of the forest cover maps
• Interpret aerial photos using appropriate techniques and if possible work with orthophotos
• If Landsat TM data are to be used the area of interest should be enlarged and/or the time interval between images/photos should be lengthened
• If possible select imagery from similar seasons
• Do not reduce the quantization of the Landsat TM images
• Take into account the desired accuracy and precision of the results when selecting data sets

The equation was incorrect
• The original formula for the 1991/92 – 1993/94 period was:
Change%=((forest T1-forest T2) * 100/(forest T2 * 3))
• The last part of the formula should have been (forest T1 * 3).
• The time period should not have been static (3).

Recommendations
• Calculate forest cover change like this:
For each target zone calculate:
• %forest loss = forest T1 – forest T2 / forest T1 * 100
• Annual forest loss = %forest loss / ((2nd date-1st date) / 365)
• Weighted %annual loss = annual forest loss * (forest T1 / sum of forest T1 for all zones)
Average forest loss for all areas:
average forest loss = sum of weighted % annual loss for all zones
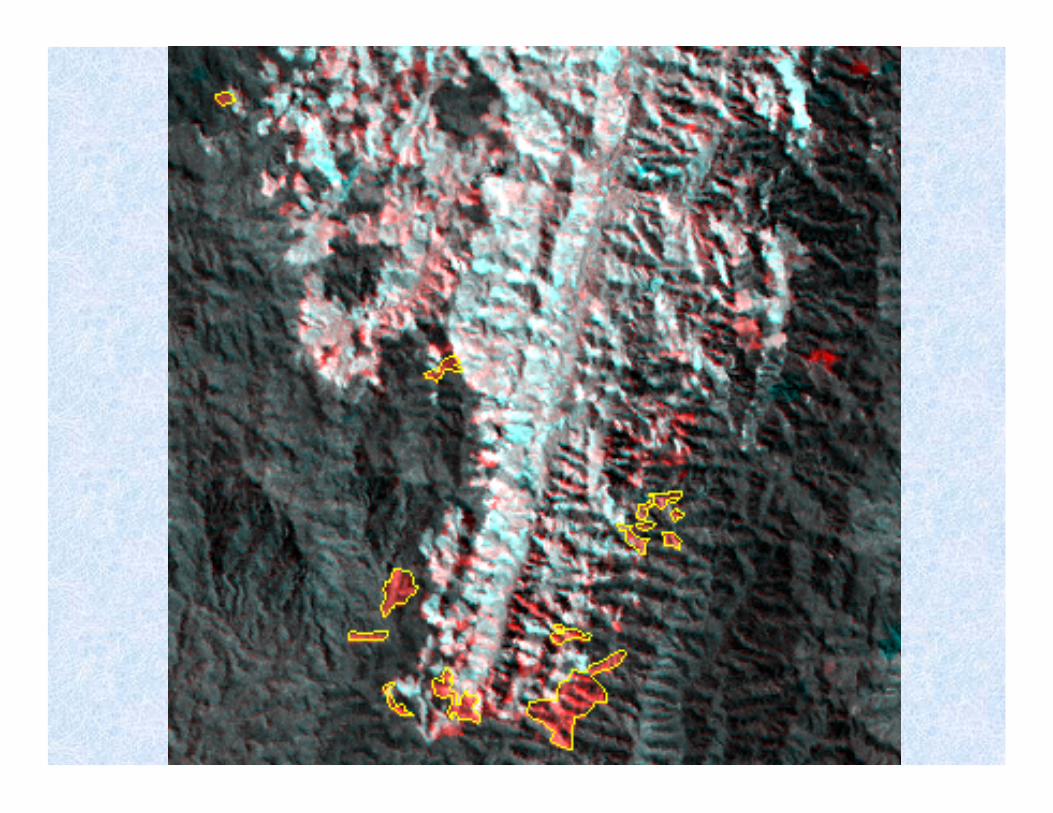
The results were indiscriminately modified
• The non-forest to primary forest change class was often modified or eliminated
• The modifications were haphazard but biased
• The results happened to match the client’s perceived rate of deforestation

Recommendations
• Do not bias the results simply because they don’t appear to be correct
• Procedures for compiling data must be very clear and an effort should be made to verify the procedures are being followed

An accuracy assessment was not carried out
• The results were reviewed by several people but there was no attempt to assess the accuracy
• The project was rushed in order to produce results to meet a deadline
Recommendations
• Budget enough money to carry out an accuracy assessment
• Plan ahead to avoid the last minute rush

Consequences
• The rate of deforestation was overestimated by an order of magnitude
• The bottom line was that the results could not be used
• The client had to drop the deforestation indicator and reassessed the process used to monitor changes in forest cover
Lessons learned?
• Extracted from a 2003 USAID Program Data Sheet:
“From 1993 - 2001, the rate of forest loss was 2.6% and 3.5% in USAID zones, compared to 6.7% loss in comparable non-intervention zones. “