A Field Programmable Gate Array (FPGA) Based Non-Linear ...
12
International Journal of Prognostics and Health Management, 2153-2648, 2021 1 A Field Programmable Gate Array (FPGA) Based Non-Linear Filters for Gas Turbine Prognostics Jayant Kumar Nayak 1 , Vatsala Prasad 1 , and Ranjan Ganguli 2 1 Electrical and Electronics Engineering, Manipal Institute of Technology, Manipal, India [email protected], [email protected] 2 Professor, Aerospace Engineering, Indian Institute of Science, Bangalore, India [email protected] ABSTRACT The removal of noise from signals obtained through the health monitoring systems in gas turbines is an important consideration for accurate prognostics. Several filters have been designed and tested for this purpose, and their performance analysis has been conducted. Linear filters are inefficient in the removal of outliers and noise because they cause smoothening of the sharp features in the signal which can indicate the onset of a fault event. On the other hand, non- linear filters based on image processing methods can provide more precise results for gas turbine health signals. Among others, the weighted recursive median (WRM) filter has been shown to provide greater accuracy due to its weight adaptability depending on the signal type. However, sampling data at high rates is possible which needs hardware implementation of the filter. In this paper, the design, simulation and implementation of WRM filters on the FPGA (Field Programmable Gate Arrays) platforms Vivado Design Suite by Xilinx and Quartus Pro Lite Edition 19.3 has been performed. The architectural detail and performance result with the FPGA filters when subjected to abrupt and gradual fault signal is presented. 1. INTRODUCTION A gas turbine engine forms the core propulsion system of most aircraft, supplying it with power to maintain its flight. Therefore, it becomes essential to undertake steps so as to ensure their healthy working condition. Over the course of its constant usage and because of the strenuous conditions under which it operates, the engine may undergo faults. These faults include foreign/domestic object damage, corrosion, erosion and/or fouling. Health monitoring methods to track and prevent these faults, predict remaining life and suggest future actions has become a widely researched domain, and the technology is constantly developing (Volponi, 2014; Borguet, Henriksson, McKelvey and Léonard, 2011). Several investigations have been carried out to review the developments in this area (Zhao, Wen and Li, 2016; Fentaye, Baheta, Gilani and Kyprianidis, 2019). The basic parameters that are used to determine the health of engines, namely, exhaust gas temperature (EGT), low rotor speed (N1), high rotor speed (N2), and fuel flow (WF), are susceptible to deviations and noise contaminations, due to a variety of factors which may involve channel noise or measurement errors at the source itself. Methods to check and inhibit the noise have inspired numerous researchers, which can be broadly classified under filtering, neural networks, least-square estimation and probabilistic approaches. High quality measurement data is the key to accurate prognostics. The use of linear filters, such as the FIR (finite impulse response) filter in smoothing out deviations of data from a baseline case caused due to the existence of noise, their advantages and disadvantages has been discussed in detail in by Ganguli (2012). Ganguli (2012) demonstrated the superiority of non-linear filters such as median filter in removing the outliers in gas path measurement data, and successfully simulated a non-linear idempotent median filter which preserved the sharp changes in the signal which herald a fault event. The Kalman filter, which determines an estimate of unknowns whose measurements are taken over time, also finds widespread use in gas turbine prognostics. A Kalman filter-based algorithm for the estimation of engine performance with proof pertaining to flight simulation and actual data was presented (Luppold, Roman, Gallops and Kerr, 1989). This finds application in flight maintenance and aircraft performance diagnostics. Pourbabaee, Meskin and Khorasani (2016) proposed a multiple-model scheme based on a hybrid Kalman filter to track fault detection, isolation and identification (FDII), and compared the soundness of their model over various other multiple model schemes which make use of Kalman filters. A hybrid Kalman filter _____________________ Jayant Kumar Nayak et al. This is an open-article distributed under the terms of the Creative Commons Attribution 3.0 United States License, which permits unrestricted use, distribution, and reproduction in any medium, provided the original author and source are credited. https://doi.org/10.36001/IJPHM.2021.v12i3.2960
Transcript of A Field Programmable Gate Array (FPGA) Based Non-Linear ...
International Journal of Prognostics and Health Management, 2153-2648, 2021
1
A Field Programmable Gate Array (FPGA) Based Non-Linear
Filters for Gas Turbine Prognostics
Jayant Kumar Nayak1, Vatsala Prasad1, and Ranjan Ganguli2
1Electrical and Electronics Engineering, Manipal Institute of Technology, Manipal, India
[email protected], [email protected]
2Professor, Aerospace Engineering, Indian Institute of Science, Bangalore, India
ABSTRACT
The removal of noise from signals obtained through the
health monitoring systems in gas turbines is an important
consideration for accurate prognostics. Several filters have
been designed and tested for this purpose, and their
performance analysis has been conducted. Linear filters are
inefficient in the removal of outliers and noise because they
cause smoothening of the sharp features in the signal which
can indicate the onset of a fault event. On the other hand, non-
linear filters based on image processing methods can provide
more precise results for gas turbine health signals. Among
others, the weighted recursive median (WRM) filter has been
shown to provide greater accuracy due to its weight
adaptability depending on the signal type. However,
sampling data at high rates is possible which needs hardware
implementation of the filter. In this paper, the design,
simulation and implementation of WRM filters on the FPGA
(Field Programmable Gate Arrays) platforms Vivado Design
Suite by Xilinx and Quartus Pro Lite Edition 19.3 has been
performed. The architectural detail and performance result
with the FPGA filters when subjected to abrupt and gradual
fault signal is presented.
1. INTRODUCTION
A gas turbine engine forms the core propulsion system of
most aircraft, supplying it with power to maintain its flight.
Therefore, it becomes essential to undertake steps so as to
ensure their healthy working condition. Over the course of its
constant usage and because of the strenuous conditions under
which it operates, the engine may undergo faults. These faults
include foreign/domestic object damage, corrosion, erosion
and/or fouling. Health monitoring methods to track and
prevent these faults, predict remaining life and suggest future
actions has become a widely researched domain, and the
technology is constantly developing (Volponi, 2014;
Borguet, Henriksson, McKelvey and Léonard, 2011). Several
investigations have been carried out to review the
developments in this area (Zhao, Wen and Li, 2016; Fentaye,
Baheta, Gilani and Kyprianidis, 2019).
The basic parameters that are used to determine the health of
engines, namely, exhaust gas temperature (EGT), low rotor
speed (N1), high rotor speed (N2), and fuel flow (WF), are
susceptible to deviations and noise contaminations, due to a
variety of factors which may involve channel noise or
measurement errors at the source itself. Methods to check and
inhibit the noise have inspired numerous researchers, which
can be broadly classified under filtering, neural networks,
least-square estimation and probabilistic approaches. High
quality measurement data is the key to accurate prognostics.
The use of linear filters, such as the FIR (finite impulse
response) filter in smoothing out deviations of data from a
baseline case caused due to the existence of noise, their
advantages and disadvantages has been discussed in detail in
by Ganguli (2012). Ganguli (2012) demonstrated the
superiority of non-linear filters such as median filter in
removing the outliers in gas path measurement data, and
successfully simulated a non-linear idempotent median filter
which preserved the sharp changes in the signal which herald
a fault event. The Kalman filter, which determines an
estimate of unknowns whose measurements are taken over
time, also finds widespread use in gas turbine prognostics. A
Kalman filter-based algorithm for the estimation of engine
performance with proof pertaining to flight simulation and
actual data was presented (Luppold, Roman, Gallops and
Kerr, 1989). This finds application in flight maintenance and
aircraft performance diagnostics. Pourbabaee, Meskin and
Khorasani (2016) proposed a multiple-model scheme based
on a hybrid Kalman filter to track fault detection, isolation
and identification (FDII), and compared the soundness of
their model over various other multiple model schemes which
make use of Kalman filters. A hybrid Kalman filter
_____________________ Jayant Kumar Nayak et al. This is an open-article distributed under the terms
of the Creative Commons Attribution 3.0 United States License, which
permits unrestricted use, distribution, and reproduction in any medium, provided the original author and source are credited.
https://doi.org/10.36001/IJPHM.2021.v12i3.2960

INTERNATIONAL JOURNAL OF PROGNOSTICS AND HEALTH MANAGEMENT
2
architecture consisting of linearized KF (LKF) and Extended
KF (EKF), master filters and federated filtering structure was
demonstrated and its robustness in sensing faults was
established by Lu, HuangY., Huang J., and Qiu (2018). Its
performance was noted to be better than other centralized
KFs, due to the combination of linear and non-linear KFs
which provides an optimum state estimate. In another work,
Lu et al developed a novel Extended Kalman Filter (EKF)
algorithm approach for estimation of the deterministic state
of gas turbine engines (Lu, Ju and Huang, 2016).
A hybrid structure was proposed which consisted of the
particle filtering technique to determine the state of the
parameters which define the health of the system
(Daroogheh, Baniamerian, Meskin and Khorasani, 2015).
The observations were fed into an artificial neural network
that provides predictions for future state of the parameters
when the cause of damage to the turbine is known. The study
was conducted on performance degradation caused by
fouling and the resultant hybrid network proved to be better
than typical neural networks. Another feasible technique for
fault detection in the Exhaust Gas Temperature (EGT) is
based on applying a convolutional neural network to obtain
the value difference between two consecutive observations in
EGT profile, which improves the sensitivity of anomaly
detection (Liu, Liu, Yu, Kang, Yan, Wang, and Pecht, 2018).
A methodology based on dynamic neural network has been
verified and its advantages have been studied in recognizing
faults in a turbofan engine (Tayarani-Bathaie, Vanini, and
Khorasani, 2012).
Several genetic algorithm-based methods have been
suggested for the improvement in the accuracy of prediction
in faults of gas turbine engines. For example, a genetic
algorithm based multi-point performance technique has been
studied, which carries out calibration of the simulated data
and the actual engine performance at different off-design
settings, wherein the algorithm is employed to find optimum
scaling factor functions (Li, Ghafir, Wang, Singh, Huang and
Feng, 2011). The algorithm was tested on a single spool
turboshaft gas turbine and showed significant improvement
in performance. However, its credibility is challenged by
drawbacks such as excessive time consumption and search
for an appropriate range of scaling factor coefficients to
obtain optimum scaling factor functions. To overcome this,
another method based on the least square method has been
proposed, which provides a more deterministic alternative to
find this range (Li, Ghafir, Wang, Singh, Huang and Feng,
2012).
All prognostic methods depend on high quality data for their
successful performance. However, filters and other
algorithms used for prognostics can be expensive in terms of
computation time and may not have real time capability. A
hardware implementation of the filters used for gas turbine
prognostics is therefore attractive. The growth of FPGA
(Field Programmable Gated Array) usage in the consumer
domain has seen a rapid increase over the past years, making
its way into a variety of industrial applications such as that of
automation, computation, networking and communication,
aerospace etc. Particularly in communication, the wireless
sensor networks deployed for radio interfaces for aerospace
systems has been explored, by means of prototyping a Single
Carrier Frequency Division Multiple Access (SC-FDMA) on
models such as the Virtex 2,4,5 and Stratix 3 (Henaut,
Dragomirescu and Plana, 2009). FPGAs provide
performance that is comparable to that of custom-made chips
at a reasonable cost and proves to be a more viable
alternative. However, FPGA are prone to soft errors (Fay,
Campbell, Miller and Connors, 2007) that due to which their
usage in the aerospace industry has been limited. But with
technological advancement in the design techniques of
FPGAs their potential is being progressively exploited. The
autonomous systems that are deployed on rovers for
planetary exploration require the capability to learn so as to
deal with unexpected circumstances when in flight. For this
purpose as well, the implementation of neural network on
FPGA has been studied (Gankidi and Thangavelautham,
2017). In the domain of aircraft, the use of filters for fault
detection in gas turbines is being researched consistently. It
is of interest, thus, to view the performance of these filters
when implemented on FPGAs, so as to verify their potential
use in the measurement of deviation from ideal behaviour of
gas turbine engines that serves the purpose of health
monitoring. This prognostics filter problem is useful to
further the spread of FPGA technology in the prognostics
community. This paper presents the simulation results of the
averaging, median, recursive median as well as the weighted
recursive median on the Xilinx Vivado Design Suite as well
as the Intel Quartus Development Suite and presents the
results of the comparative study performed when test data is
fed into these filters.
Another commonly used processor is the GPU which stands
for Graphical Processing Unit. GPUs and FPGA are popular
competitors for various applications such as robotics, image
processing, computer vision, machine learning, deep learning
etc. In principle, all the complex calculations could be done
using CPUs but for certain applications, the other processors
make it more energy-efficient and process the heavy
calculations faster. There are a few reasons for the selection
of FPGA as a processor above GPU for this application.
The first advantage for FPGA is software portability.
Programs for GPU are written using high-level languages and
so it is faster and easier to debug codes. The FPGA can be
programmed using hardware description languages such as
VHDL or Verilog which take longer to debug, thereby
increasing the development time. But, when there is a need to
switch or upgrade to a hardware of the latest generation, the
process of transferring the program in case of GPU might be
challenging if the program is written considering certain
architectural specification. In the case of FPGAs, the transfer
INTERNATIONAL JOURNAL OF PROGNOSTICS AND HEALTH MANAGEMENT
3
of codes among Xilinx FPGA and Altera FPGA is not
straightforward. But transferring codes from low to high-
performance FPGA of the same family of Xilinx or Altera
FPGA is comparatively simpler. Moreover, once the design
is ready with an efficient program, the design can be used to
design ASICs (Application Specific Integrated Circuits). The
new generation Hardware description languages such as
Chisel and Bluespec System Verilog(BSV) have also
emerged to reduce the development time in FPGA.
Hardware advantage is the second attractive aspect of FPGA.
FPGA are independent and can perform without the need of
a CPU whereas GPUs can only be used as co-processors
which means it is not PC-independent. Hence, it can be said
that the FPGAs are more portable when it comes to the size
of the hardware required for a similar task. GPUs were
designed to achieve high operational parallelism but when
there is no requirement for high parallel computations, a
significant drop in the performance of the GPU is observed.
On the other hand, FPGAs provide high flexibility which
improves performance significantly in case of lesser data.
The flow of data in an FPGA is from the input, through the
designed circuit to the output. In the GPU, the flow of data
happens back and forth between the CPU and the GPU due
to which there is a higher consumption of energy. Therefore,
FPGA turns out to be a better hardware choice which can be
incorporated with the engine of the aircraft as it is both
portable and energy-efficient (HajiRassouliha,, Taberner,
Nash and Nielsen, 2018).
Health monitoring of aircraft can also be done using
emerging technologies such as neural networks as discussed
by Volponi, DePold, Ganguli and Daguang, (2000). Here
they designed a health monitoring model using a neural
network taking inputs from all the different modules of the
gas turbine. For implementing such neural network-based
models on the hardware it would become imperative to look
into the advancements in GPUs and FPGAs which take place
in the near future. GPUs are naturally better for
implementation of emerging machine learning and deep
learning algorithms. For example, the convolutional neural
network models which involve calculations with matrices
and GPU were made for such parallel matrix computation to
enhance graphics (Krizhevsky, Sutskever and Hinton, 2012).
However, the advancements in FPGA technology with the
inclusion of CPUs also known as SoC (System on chip) has
made them a formidable competitor of GPUs in this domain
as well. FPGA-CPU SoCs were used to design their cloud-
scale which is indicative of the future possibilities and trends
(Caulfield, Chung, Putnam, Angepat, Fowers, Haselman,
Heil, Humphrey, Kaur, Kim, Lo, Massengill, Ovtcharov,
Papamichael, Woods, Lanka, Chiou and Burger, 2016).
2. BACKGROUND ON FILTERS
2.1. Averaging Filter
An average filter, also known as the mean filter, belongs to
the category of linear filters. The primary action performed
by this one-dimensional windowed filter is smoothing of a
signal. Given a filter of length N, it traverses across the signal
and computes the average of the data points that is contained
within the window length, according to the formula:
𝑌 = ∑𝑥𝑖
𝑁
𝑁
𝑖=1
(1)
where xi represents the ith data point, and Y is the output. One
of the drawbacks of the use of averaging filter for noise
removal is that it smoothens out the steep changes in the
signal which can precede a fault event, and does not provide
good results in the removal of outliers. However, the moving
average filter remains popular in industry. A low window
length filter keeps unwanted smoothing low. In this paper, we
have implemented a 4 point averaging filter on both the
Xilinx and Intel platforms.
2.2. Median Filter
The median filter belongs to the class of non-linear filters,
wherein the window length, N, may contain even or odd
sample values. In the case where N is odd, the sample values
within the window is arranged in ascending order, and the
middle value of the window is the output of the filter. In the
case of N is even, the average of N/2 and N/2+1 is taken as
the output. Thus, an element of averaging is introduced in the
even length median filter. While an odd size median filter
must return one of the input data points as the output, the even
length filter typically returns a different value. An even
length median filter can be considered as a hybrid of a median
and mean filter. A median filter can be formulated as:
𝑌 = 𝑚𝑒𝑑𝑖𝑎𝑛 (𝑥𝑘−𝑛, 𝑥𝑘−𝑛+1, … , 𝑥𝑘+𝑛)
(2)
Here xk represents the data points. The median filter has been
found to be very efficient in the removal of non-Gaussian
noise. Unlike the averaging filter, the median does not
smooth out sharp changes in the trend of data samples and is
suitable for detecting outliers in the gas turbine signals. In the
case of data with Gaussian noise, however, it takes numerous
iterations for the filter output to converge to an optimum
value. Our design comprises of a median filter with N=5. The
data point at N=3, after sorting, is taken as the median in a
given window.
2.3. Recursive Median Filter
The recursive median filter, or the RM filter, advances the
simple median (SM) filter. For the purpose of calculating the

INTERNATIONAL JOURNAL OF PROGNOSTICS AND HEALTH MANAGEMENT
4
output, the RM filter considers data outputs from previous
iterations as well. It can be mathematically expressed as:
𝑌 = 𝑚𝑒𝑑𝑖𝑎𝑛 (𝑦𝑘−𝑛, 𝑦𝑘−𝑛+1, … , 𝑥𝑘 , … , 𝑥𝑘+𝑛) (3)
Here yk is the output of the preceding iteration and xk are the
current data points. The recursive median filter is known to
provide much better performance than the median filter in the
removal of outliers in the fault signal. The blurring caused in
the output signal when an RM filter is passed over it, remains
one of its main disadvantages. In this paper, an RM filter with
a window length of N=5 is implemented.
2.4. Weighted Recursive Median Filter
The primary difference between the Weighted Recursive
Median filter (WRM filter) and the Recursive Median Filter
(RM filter) is that the data samples used in the RM filter are
assigned certain pre-determined weight values to obtain the
output of the WRM filter. These weights are assigned
depending on the application. The WRM filter overcomes the
disadvantages that are noted in RM filters such as blurring
and produces better performance in terms of the rate at which
the output is obtained (Verma and Ganguli, 2005; Payuna and
Ganguli, 2010). The WRM filter can be expressed as:
𝑌 = 𝑚𝑒𝑑𝑖𝑎𝑛 (𝑚𝑘−𝑛 ∗ 𝑦𝑘−𝑛, 𝑚𝑘−𝑛+1 ∗ 𝑦𝑘−𝑛+1
… 𝑚𝑘 ∗ 𝑥𝑘 , … , 𝑚𝑘+𝑛 ∗ 𝑥𝑘+𝑛)
(3)
Where yk are the output of preceding iterations, xk are the
current data points and mk are the weights associated with
them. The optimal weights chosen for obtaining the best
filtered output was determined using the algorithm that
tackles the optimization problem given as (Payuna and
Ganguli, 2010):
𝐹(𝑤−2, 𝑤−1, 𝑤0, 𝑤1 , 𝑤2)
=1
𝑀∑
1
𝑁∑ |𝑧�̂� − 𝑧𝑗
𝑜|
𝑁
𝑗=1
𝑀
𝑖=1
(4)
3. TEST SIGNALS
A typical basic jet engine essentially has sensors for low rotor
speed depicted as N1, high rotor speed as N2, fuel flow
measurement as WF, and the exhaust gas temperature as EGT
as shown in Fig 1. While modern engines have more sensors
for pressure and temperature measurements, these four
sensors are ubiquitous in operational jet engines, including
older models. The data values provided by these sensors are
utilized for determining the conditions of five different
modules of the jet engine namely: fan denoted as FAN, low-
pressure compressor as LPC, high-pressure compressor as
HPC, the low-pressure turbine and the high-pressure turbines
as LPT and HPT respectively. The data generated from the
sensors help in the detection of any deviations in the behavior
of the modules compared to the expected behavior. The
deviations in the modules are realized by observing the
deviations in the sensor values represented as ΔN1, ΔN2,
ΔWF and ΔEGF (Turner and Bajwa,1999).
Fig 1: Representation of Basic Measurements in Gas
Turbine
The output signals of any sensor are not ideal signals that can
be analyzed or used directly. The presence of noise in any
output signal from the sensor is inevitable. But the presence
of noise is not supposed to govern the judgement made on the
condition and functioning of the engine. In order to detect
these gas turbine faults, the signal needs to be pre-processed.
For this, the performance of the filter needs to be verified. To
represent this in mathematical form, the signals with noise
can be described using the equations below:
X = Xo + α (5)
Where the Xo represents the ideal signal, i.e. the signal
without noise, α represents the noise component, which is the
reason for the deviation or the deltas in the signals. X is the
complete output signal from the sensor. For the purpose of
decision making and analysis it is necessary to have a signal
with noise component being as small as possible else it could
give erroneous prognostic results. Therefore, for noise
reduction the sensors’ output is to be passed through a
function. Let that function be represented by F(.). This
function could be any filter, linear or non-linear, operating on
the sensor output signal X. The filter is given as:
𝑋 ̂ = 𝐹(𝑋) = 𝐹(𝑋𝑜 + 𝛼) (6)
Where X̂ is the signal obtained after filtering.
For better understanding and visualization, in this paper three
signals are considered:
1. Step signal
2. Ramp signal
3. Combination of step and ramp signal
The unit step response in Fig 2 is considered as it mimics
abrupt faults. The ramp is considered to represent the gradual

INTERNATIONAL JOURNAL OF PROGNOSTICS AND HEALTH MANAGEMENT
5
faults as shown in Fig 3. Fig 4 represents a combination of
both the step signal and the ramp signal, which demonstrates
an abrupt fault followed by a gradual fault. These signals are
considered as the jet engine is susceptible to these three kinds
of faults in real world scenarios. To make these signals more
practical, the ideal signal is generated and white Gaussian
noise is added to it. The standard deviation of the Gaussian
noise generated is σ =3.6262, σ =3.0541 and σ =3.2210 for
step signal, ramp signal and combination signal respectively.
The signal thus generated occurs between 0 sec ≤ t ≤ 50 sec,
with 250 data points. The signals simulated on MATLAB
were sampled at every 0.2 sec. The resulting 250 samples
were fed into the VERILOG simulation at 5 nsec interval, and
the obtained outputs were plotted against the original
samples, on MATLAB. As the signal along with the noise
after sampling has values with non-integer decimal precision
as well, so for the purpose of simplicity in implementation on
FPGA, the sampled points with decimal values are
approximated to their nearest integer. In a window length of
N=5, each point being 4bit in length, the maximum height of
the signal (along with the noise) needs to be below the
magnitude of 15 considering only integer values. With a
similar approach, these points can have more bits which will,
in turn, increase the magnitude that can be considered for a
signal. For example, considering 5-bit numbers will increase
the magnitude limit to 32. In case of requirement of better
precision, the method of mapping can be used. Consider the
situation where we have a 5-bit number, therefore, we can
have 32 digital levels. Let us say we require a maximum
magnitude of 8; then we can divide 8 into 32 levels, every
level representing 0.25. Similarly, this can be done for any
number of bits.
Fig 2: Step Signal Representing HPC Fault and its repair.
Fig 3: Ramp Signal Representing HPT Fault and its repair.
Fig 4: Combination Signal Representing a HPC fault and its
repair followed by HPT fault and its repair

INTERNATIONAL JOURNAL OF PROGNOSTICS AND HEALTH MANAGEMENT
6
4. INTRODUCTION TO FPGAS
A Field Programmable Gated Array – or FPGA, is an
integrated circuit that possesses the capability of performing
digital logic and application specific computations that can
be customized by the end users depending on their need.
Since its functionality is defined after it has been
manufactured, therefore the term – “Field Programmable”.
FPGA’s were originally brought into use in the 1980s as an
alternative to PROMS (Programmable Read Only Memory)
and PLDs (Programmable Logic Devices), because these
were hard-wired, meaning that they could not be
reprogrammed. With the advent of reprogrammable end-user
chip technology, the growth of FPGA usage in the consumer
market has seen an enormous increase over the past years,
making its way into a variety of industrial domains such as
automation, computation, networking and communication
etc. Major companies are bringing about advanced
technology in the form of high speed processors, dedicated
computation blocks, large memory blocks in their FPGA
devices.
Fig 5: The process of generation of data
An FPGA is a semiconductor chip, consisting of millions of
logic cells that can be programmed to perform any logic
function. They are used to obtain the same level of
performance, but at a visibly lower cost than its other
alternatives such as that of a customized one-time
programmable ASIC. Its structure consists of fundamental
elements, which are enumerated next.
1. Input-Output Blocks (I/O Blocks): The logic gates
that are present in the FPGA require inputs on which
it operates, thereby giving the output for which it has
been designed. For this purpose, FPGAs contains a
large number of I/O pins and GPIOs (General
Purpose Input Outputs) such as switches, push
buttons etc. These direct the electrical signals into
the logic circuitry and drive the output ports such as
LEDs, displays etc.
2. Look-up Tables (LUTs): The smallest block in an
FPGA is a Look-Up Table, which performs logic
operations on the input received. Essentially, it is
similar to a truth table, which holds values of the
output that is desired for input combinations. In
general, an N input LUT accesses 2N memory
locations. It will contain (M=2^N) configuration
bits, and is capable of implementing 2^M functions.
3. Flip Flops: Flip Flops are used as memory elements
in FPGAs, wherein the output computed by the logic
circuit is stored. It holds onto the value stored, till a
new value is fed into it.
Xilinx manufactures commercially available
reprogrammable FPGAs, whose basic architecture is array-
based. An array based structure implies that the logic blocks
that make up a chip, is in the form of a 2-D matrix, and are
linked to each other through both vertical and horizontal
interconnects. The interconnect present in the chips are
reprogrammable. These logic blocks are known as CLBs
(Configurable Logic Blocks) in Xilinx, and are made up of
Look-Up Tables.
In the FPGAs manufactured by INTEL, the basic logic block,
is known as a Logic Element (LE), similar to a CLB present
in a chip in the Xilinx FPGAs. Each of these logic elements
is made up of one LUT, which can take up to four inputs to
perform logic operations. For the output, one single flip flop
is present in each LE.
The overall process of generating data and simultaneously
programming the FPGA is shown in Fig 5.
5. FPGA IMPLEMENTATION
5.1. Intel Quartus Development Suite
The family of FPGAs offered by Intel (previously, Altera)
contain dedicated and specialized high-performance DSP
blocks, logic modules for logic implementation and large
block memory on the system chip.
The design and synthesis for the purpose of the filter
implementation was carried out on the Quartus Prime Lite
Edition 19.1 on Windows. For the current problem, Cyclone
V was chosen for the implementation. Modelsim-Intel FPGA
Edition was used for simulation and optimization of the
Verilog HDL program. The results of the filter design
parameters when synthesized on the software are tabulated in
Table 1.
The Weighted Recursive Median consumes the most logic
modules in the design, while the simple median filter uses the
least. The weights considered for the WRM filter are
[4,1,3,2,4], [4,1,2,2,3] and [2,2,2,1,3] for Step, Ramp and
combinational signals respectively. The WRM filter also
exhibits the maximum average fan-out, which indicates that
it its power usage remains the highest amongst all. We deduce

INTERNATIONAL JOURNAL OF PROGNOSTICS AND HEALTH MANAGEMENT
7
that the design of the median filter is the most efficient in
terms of design and logic unit utilization on the chip.
Filters/
Parameter
s
Logic
Utilizatio
n in
ALMs
(56,480)
I/O
Pins
(480
)
Averag
e Fan
Out
Combinatio
n ALUT
Usage
Average 13 45 1.45 20
Median 1 35 0.50 0
Recursive
Median
96 48 2.74 190
Weighted
Recursive
Median
154 28 3.56 291
Table 1: Compilation and Synthesis Results of Quartus
Development Suite
5.2. Xilinx Vivado Development Suite
Xilinx is a company that provides FPGAs to meet various
requirements, such as greater performance, high end
complicated operations at affordable costs. There are
primarily five families of the FPGAs, namely VIRTEX,
KINTEX, ARTIX, ZYNQ and SPARTAN, all of which are
designed to meet the needs demanded by field-specific
applications. There are certain FPGAs with on-chip processor
features, known as System-on-Chips, for making the
processing quicker and providing advanced capabilities to the
devices.
For the implementation of the filters, the Xilinx board
Nexys4 DDR which belongs to the ARTIX-7 low voltage
family is used. The Nexys4 DDR kit has 15,850 logic slices,
each with four 6-input LUTs and 8 flip-flops. The software
used for the hardware description is the VIVADO Design
Suite 2019.2. This software enables us to design and simulate
the coded Verilog HDL program. Using the RTL analysis, the
schematic based on the code can be obtained. At the end of
the RTL analysis, the peak memory requirement is known.
The VIVADO suite also facilitates synthesising the Verilog
code which is specific to the board in use. After the synthesis,
the board specific schematic is attained that has the
descriptions of the number of input output ports, flip-flops,
LUTs and DSP blocks used. Following the implementation
of the filters, the descriptions shown in the software are
tabulated in Table 2.
From the values in Table 2, it can be observed that the
average filter’s implementation uses the highest number of
I/O ports. The Recursive Median Filter needs the highest
peak memory. The Weighted Recursive Median filter
implementation uses the highest flip-flops and LUT. The
weights considered for the WRM filter are [4,1,3,2,4],
[4,1,2,2,3] and [2,2,2,1,3] for Step, Ramp and combinational
signals respectively. These values might vary with the FPGA
board and the algorithms used for implementation. For
Median, Recursive Median and Weighted Recursive Median
filters the sorting method used here is bubble sort. Usage of
some other sorting algorithm will yield different results.
Filters/
Parameters
Peak
Memory
(MB)
I/O
Ports
Flip
Flops
LUT
Usage
Average 1414.855 68 0 1
Median 1481.805 28 0 0
Recursive
Median
2022.215 28 0 0
Weighted
Recursive
Median
1649.820 12 3 113
Table 2: Compilation and Synthesis Results of Vivado
Development Suite
Fig 6: RTL Schematic of Averaging filter
The data is generated through MATLAB and decimal
truncated, following which it is fed into the VERILOG code.
The code is repeatedly modified till a synthesizable design is
obtained. Fig 6 and Fig 7 depicts the RTL synthesis diagram
obtained of the average and recursive median filter
respectively, after compilation of the Verilog program.

INTERNATIONAL JOURNAL OF PROGNOSTICS AND HEALTH MANAGEMENT
8
Fig 7: RTL Schematic of Recursive Median Filter.
6. PERFORMANCE ANALYSIS OF FILTERS
The noise can get added to the signal during the creation or
even during the transmission of data. It is also possible that
the noise at times overpowers the signal itself. This becomes
a concern as the signal is completely corrupted and retrieval
becomes a difficult challenge. Various methodologies are
used for signal cleaning and noise removal. The next hurdle
is to identify the best possible solution for the removal of
noise from the signal. The extent of denoising is compared by
certain parameters such as:
1. PSNR: peak signal to noise ratio; which is the ratio
of the maximum possible power of the signal to that
of the power of the noise that affects the signal’s
representation.
2. MSE: mean squared error; it is squared to remove
the negative components of the noisy signal and is
averaged out to give more weightage to the larger
deviations. Lesser the value of MSE the better in the
considered signal.
3. SNR: signal to noise ratio; it the comparison of the
RMS value of the ideal or expected signal to that of
the RMS of the noise content of the signal.
4. RMSE: Root mean squared error, it quantifies how
far or close is the spread of noise from the original
signal. (Hore and Ziou, 2010; Saladi and Prabha,
2017)
The motive of considering all these parameters for
comparison is to obtain a clear demarcation between the
signals which are compared. In this paper, the outputs of the
filters are compared using the SNR parameter. Any ratio
more than 1:1 indicates that the signal has more required
component, than the noise component. The larger the value
of the SNR the better is the obtained output. This can be
represented by the equation:
𝑆𝑁𝑅 = 20 ∗ log10
𝑅𝑀𝑆 𝑆𝑖𝑔𝑛𝑎𝑙
𝑅𝑀𝑆 𝑁𝑜𝑖𝑠𝑒
(7)
A complete removal of noise is not possible with these filters,
but any improvement in the signal by reducing the noise
component can result in better performance. As per the
tabulated values in Table 3, it can clearly be seen that the
filter with the best performance is the Weighted Recursive
Median filter followed by Recursive, Median and Average in
the same order. The results obtained below are from the
FPGA simulation. The input for the simulation was a noisy
signal whose data points were rounded off to the nearest
integer. For simplicity 4-bit numbers were taken which could
give numbers between 0-15 only and the peak of the signal
considered was 15. Thereby leaving no scope for decimal
values. Hence the outputs obtained were also integers. The
results are based on the above considerations.
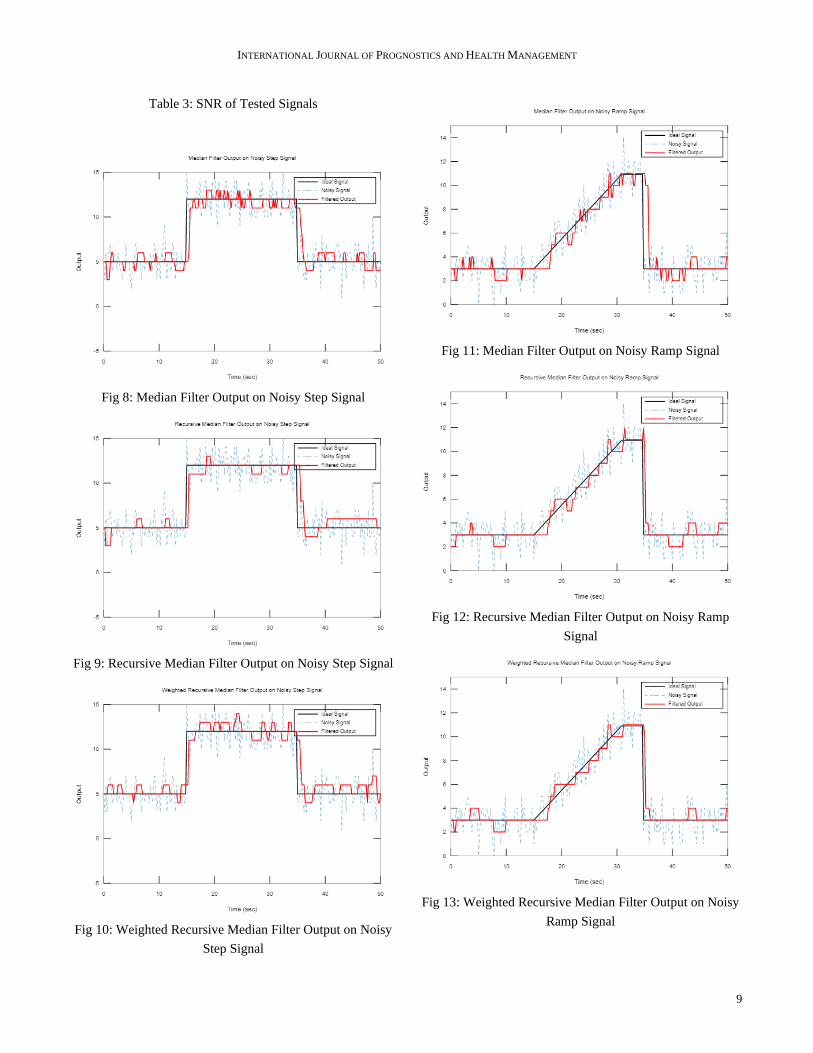
The increment in the window length of the filter results in the
improvement, which is what essentially occurs in the
Weighted Recursive Median Filter. It is necessary to select
the correct set of weights for the WRM filter for better
performance. Fig. 8-16 illustrates the plots of the obtained
filtered output. On implementing the same filters on
MATLAB with non-truncated input values and comparing
the results, we note that the filter designs on FPGA perform
with a relative error of (4%-15%).
Filters /
Signals
Step
(σ=3.6262)
Ramp
(σ=3.0541)
Combination
(Step and
Ramp)
(σ=3.2210)
Average 8.130 9.841 10.391
Median 16.552 13.500 12.599
Recursive
Median
16.640 16.248 13.248
Weighted
Recursive
Median
(Weights)
17.068
(4,1,3,2,4)
16.560
(4,1,2,2,3)
13.471
(2,2,2,1,3)
INTERNATIONAL JOURNAL OF PROGNOSTICS AND HEALTH MANAGEMENT
9
Table 3: SNR of Tested Signals
Fig 8: Median Filter Output on Noisy Step Signal
Fig 9: Recursive Median Filter Output on Noisy Step Signal
Fig 10: Weighted Recursive Median Filter Output on Noisy
Step Signal
Fig 11: Median Filter Output on Noisy Ramp Signal
Fig 12: Recursive Median Filter Output on Noisy Ramp
Signal
Fig 13: Weighted Recursive Median Filter Output on Noisy
Ramp Signal

INTERNATIONAL JOURNAL OF PROGNOSTICS AND HEALTH MANAGEMENT
10
Fig 14: Median Filter Output on Noisy Combination Signal
Fig 15: Recursive Median Filter Output on Noisy
Combination Signal
Fig 16: Weighted Recursive Median Filter Output on Noisy
Combination Signal
7. DISCUSSION
Based on the numerical analysis performed, we deduce that
the weighted recursive median filter provides the most
effective results in the removal of noise from data. The
averaging filter performs poorly and succeeds in removing
nominal noise from the faulty signal generated. This is
primarily due to the fact that the averaging filter causes
smoothening of the data points near sharp changes in the
measurement signal which leads to loss of vital attributes
contained in the signal that can prove to be essential to the
task of the removal and isolation of faults from the noisy
signal as suggested by Payuna and Ganguli, (2010). The
average filter also fares poorly in the preservation of edges
present in the test signal, thus causing performance
degradation. Therefore, the averaging filter is not the ideal
choice for noise removal and fault isolation.
The median filter, on the other hand performs well in the
feature preservation for the faulty signals, unlike the linear
averaging filter. This can be seen through the reported results
which show significantly better performance metrics when
tested on the error signals. Median filters are more sensitive
to the existence of outliers in the data. Its variant, the
recursive median filter achieves even better results. The
outcome obtained depicts the superior performance in fault
isolation, and therefore is better suited than the previously
noted filters, as it takes into account the output values of
previous iterations as well.
The weighted recursive median, which involves the
assignment of weights to the recursive median filter exhibits
the greatest efficiency in filtering out noise, as it allows the
fine-tuning of the filter according to the signal under test.
It should be mentioned that the results in this paper use
simulated data. Using simulated data allows easy comparison
of the algorithms in terms of error norms as the ideal signal
is known. However, our work can easily be used by
practitioners working in companies who may have access to
real world test data.
8. CONCLUSION
The performance of linear and non-linear filters are evaluated
through their implementation on FPGAs for the purpose of
improved prognostics of gas turbine engines, wherein the
filters are employed to detect and isolate faults in the data
signals. The signals modelled for this task include the step
signal which represents an abrupt fault and a ramp signal
which indicates a gradual fault occurring in the data received
from measurements of the engine. Two different platforms,
namely the Vivado Design Software Suite by Xilinx and the
Quartus Pro Lite Edition by Intel are used for the design and
simulation of the filters. The filters modelled are a five point
averaging filter, which is a linear filter; a simple median
filter, a recursive median filter, which comprise of window
length of N=5 and a weighted recursive median filter that are

INTERNATIONAL JOURNAL OF PROGNOSTICS AND HEALTH MANAGEMENT
11
non-linear in nature. The architectural difference between the
two designing platforms is noted. Finally, the performance
analysis of the filters was conducted based on the signal-to-
noise ratio obtained, by recording the difference in the SNR
of the noisy data and subsequently, the data received after
filtering. It was hence, shown that the weighted recursive
median filter provides superior results than the other filters
designed for testing. In subsequent research, the real-time
implementation of the proposed filters can be carried out on
FPGA to highlight the performance benefits offered by the
devices such as high sampling rate for input data,
input/output rates, etc.
The FPGA implementation of the denoising filters is likely to
spread this technology in the prognostics community and lead
to considerable benefits in terms of real time implementation.
REFERENCES
Volponi, A. (2014) Gas turbine engine health management:
Past, present, and future trends. J. Eng. Gas
Turbines Power 2014, 136. doi: 10.1115/1.4026126
Borguet S., Henriksson M., McKelvey T. & Léonard O.
(2011). A study on engine health monitoring in the
frequency domain, J. Eng. Gas Turbines Power.,
Vol. 133 Issue 8 doi: 10.1115/1.4002832
Zhao N., Wen, X., & Li, S. (2016). A Review on gas turbine
anomaly detection for implementing health
management Volume 1: Aircraft Engine; Fans and
Blowers; Marine. doi: 10.1115/GT2016-58135
Fentaye A., Baheta A., Gilani S., & Kyprianidis K. (2019). A
review on gas turbine gas-path diagnostics: State-of-
the-art methods, challenges and opportunities
Aerospace, 6(7), 83 doi: 10.3390/aerospace6070083
Ganguli R. (2012) Jet engine gas-path measurement filtering
using center weighted idempotent median filters,
Journal of Propulsion and Power Vol. 19 Issue 5.
doi: 10.2514/2.6186
Luppold R., Roman J., Gallops G., & Kerr L. (1989).
Estimating in-flight engine performance variations
using kalman filter concepts. 25th Joint Propulsion
Conference. doi: 10.2514/6.1989-2584
Pourbabaee B., Meskin N., & Khorasani K. (2016). Sensor
Fault Detection, Isolation, and Identification Using
Multiple Model Based Hybrid Kalman Filter for Gas
Turbine Engines. IEEE Transactions on Control
Systems Technology, Vol. 24, Issue 4 doi:
10.1109/TCST.2015.2480003
Lu F., Huang Y., Huang J., & Qiu X. (2018). A Hybrid
Kalman Filtering Approach Based on Federated
Framework for Gas Turbine Engine Health
Monitoring IEEE Access: The Multidisciplinary
Open Access Journal, Vol 6. doi:
10.1109/ACCESS.2017.2780278
Lu F., Ju H., & Huang J. (2016). An improved extended
Kalman filter with inequality constraints for gas
turbine engine health monitoring Aerospace Science
and Technology, Vol. 58, 36–47. doi:
10.1016/j.ast.2016.08.008
Daroogheh N., Baniamerian A., Meskin N., & Khorasani K.
(2015) A hybrid prognosis and health monitoring
strategy by integrating particle filters and neural
networks for gas turbine engines IEEE Conference
on Prognostics and Health Management(PHM) doi:
10.1109/ICPHM.2015.7245020
Liu, J., Liu, J., Yu, D., Kang, M., Yan, W., Wang, Z., &
Pecht, M. (2018) Fault detection for gas turbine hot
components based on a convolutional neural
network Energies, Vol 11 Issue 8. doi:
10.3390/en11082149
Tayarani-Bathaie, S. S., Vanini, Z. N. S., & Khorasani K.
(2012). Fault detection of gas turbine engines using
dynamic neural networks. 2012 25th IEEE
Canadian Conference on Electrical and Computer
Engineering (CCECE) doi:
10.1109/CCECE.2012.6334837
Y. G. Li , Ghafir A., Wang L., Singh R., Huang K. & Feng
X.(2011). Nonlinear multiple points gas turbine off-
design performance adaptation using a genetic
algorithm, J. Eng. Gas Turbines Power, Vol. 133
Issue 7. doi: 10.1115/1.4002620
Li, Y. G., Abdul Ghafir, M. F., Wang, L., Singh, R., Huang,
K., Feng, X., & Zhang, W. (2012). Improved
multiple point nonlinear genetic algorithm based
performance adaptation using least square method,
J. Eng. Gas Turbines Power, Vol 134 Issue 3. doi:
10.1115/1.4004395
Henaut J., Dragomirescu D., & Plana R. (2009). FPGA based
high date rate radio interfaces for aerospace wireless
sensor systems 2009 Fourth International
Conference on Systems doi:
10.1109/ICONS.2009.28
Fay D., Campbell S., Miller G., & Connors D. (2007).
Teaching fault tolerant FPGA design for aerospace
applications. 2007 IEEE International Conference
on Microelectronic Systems Education (MSE’07).
doi: 10.1109/MSE.2007.81
Gankidi P. R., & Thangavelautham J. (2017). FPGA
architecture for deep learning and its application to
planetary robotics. 2017 IEEE Aerospace
Conference doi: 10.1109/AERO.2017.7943929
Verma R., & Ganguli R. (2005). Denoising jet engine gas
path measurements using nonlinear filters

INTERNATIONAL JOURNAL OF PROGNOSTICS AND HEALTH MANAGEMENT
12
IEEE/ASME Transactions on Mechatronics, Vol. 10
Issue 4. doi: 10.1109/TMECH.2005.852454
Payuna U. & Ganguli R., (2010) Jet engine health signal
denoising using optimally weighted recursive
median filters J. Eng. Gas Turb. Power vol. 132
Issue 4 doi: 10.1115/1.3200907
Hore A & Ziou D. (2010) Image quality metrics: PSNR vs.
SSIM. 20th International Conference on, pp. 2366–
2369. IEEE Pattern Recognition (ICPR), 2010. doi:
10.1109/ICPR.2010.579
Saladi S., & Prabha, N. (2017). Analysis of denoising filters
on MRI brain images. International Journal of
Imaging Systems and Technology, vol.27 Issue 3
doi: 10.1002/ima.22225
Turner K. & Bajwa A. (1999) A survey of aircraft engine
health monitoring systems AIAA/ ASME/ SAE/
ASEE Joint Propulsion Conference and Exhibit 20-
24 June 1999 doi: 10.2514/6.1999-2528
Fahmy S.A, Cheung P. & Luk W. (2009) High-throughput
one-dimensional median and weighted median
filters on FPGA IET Computers & Digital
Techniques 2009 doi: 10.1049/iet-cdt.2008.0119
Benkrid K., Crookes D., & Benkrid A. (n.d.). (2002) Design
and implementation of a novel algorithm for general
purpose median filtering on FPGAs 2002 IEEE
International Symposium on Circuits and Systems.
doi: 10.1109/ISCAS.2002.1010482
Hyeong-Seok Yu, Joon-Yeop Lee, & Jun-Dong Cho (1999)
A fast VLSI implementation of sorting algorithm for
standard median filters Twelfth Annual IEEE
International ASIC/SOC Conference doi:
10.1109/ASIC.1999.806540
HajiRassouliha, A., Taberner, A. J., Nash, M. P., & Nielsen,
P. M. F. (2018). Suitability of recent. hardware
accelerators (DSPs, FPGAs, and GPUs) for
computer vision and image processing algorithms.
Signal Processing: Image Communication, 68, 101–
119. doi:10.1016/j.image.2018.07.007
Volponi, A. J., DePold, H., Ganguli, R., & Daguang, C.
(2000). The Use of Kalman Filter and Neural
Network Methodologies in Gas Turbine
Performance Diagnostics: A Comparative Study.
Volume 4: Manufacturing Materials and
Metallurgy; Ceramics; Structures and Dynamics;
Controls, Diagnostics and Instrumentation;
Education. doi:10.1115/2000-gt-0547
Krizhevsky A., Sutskever I., Hinton G.E. (2012) ImageNet
Classification with deep convolutional neural
networks, Adv. Neural Inf. Process. Syst., 2012, pp.
1–9.
Caulfield A. M., Chung E.S, Putnam A., Angepat H., Fowers
J., Haselman M., Heil S., Humphrey M., Kaur P.,
Kim J.Y, Lo D., Massengill T., Ovtcharov K.,
Papamichael M., Woods L., Lanka S., Chiou D. and
Burger D. (2016) A cloud-scale acceleration
architecture, 2016 49th Annual IEEE/ACM
International Symposium on Microarchitecture
(MICRO), Taipei, 2016, pp. 1-13, doi:
10.1109/MICRO.2016.7783710.