A Fatigue Model for Spur Gear Contacts Operating Under ...cecs.wright.edu/~sheng.li/papers/A fatigue...
11
S. Li 1 e-mail: [email protected] A. Kahraman e-mail: [email protected] M. Klein e-mail: [email protected] The Gear and Power Transmission Research Laboratory, Department of Mechanical and Aerospace Engineering, The Ohio State University, 201 West 19th Avenue, Columbus, OH 43210 A Fatigue Model for Spur Gear Contacts Operating Under Mixed Elastohydrodynamic Lubrication Conditions This paper presents a model to predict the crack formation fatigue lives of spur gear con- tacts operating under mixed lubrication conditions where surface roughnesses introduce intermittent metal-to-metal contacts and severe stress concentrations. The proposed model consists of several submodels, including (i) a gear load distribution model to determine the normal tooth force distribution along the tooth surface, incorporating any profile modifications and manufacturing deviations, (ii) a mixed elastohydrodynamic lubrication model customized to handle transient contact conditions of gears, (iii) a stress formulation that assumes the plane strain condition to compute the transient elastic stress fields on and below the tooth surface induced by the mixed lubrication surface pressure and shear stress distributions, and (iv) a multi-axial fatigue model to predict the crack nucleation life distribution. The proposed spur gear fatigue model is used to simulate the contacts of gear pairs having different surface roughness amplitudes. The predictions are compared to the measured gear fatigue stress-life data for each surface condition to assess the model accuracy in the prediction of the crack nucleation fatigue lives as well as the location of the critical failure sites. [DOI: 10.1115/1.4005655] Keywords: gear contact fatigue, multi-axial fatigue prediction, gear lubrication 1 Introduction As one of the most common gear failures, pitting is the contact surface fatigue failure, which often takes place in the dedendum region below the pitch line with negative sliding. Contacting gear tooth surfaces might have roughness amplitudes (caused by manu- facturing finishing processes such as grinding, shaving, or honing) that are comparable to lubricant film thickness, such that surface asperities can penetrate the fluid film and come into direct contact. Under such mixed lubrication condition where the local asperity contacts and the elastohydrodynamic lubricant film share the nor- mal load, the roughness irregularities significantly elevate the local surface pressures to the magnitudes that are much higher than the maximum Hertzian pressure. Under heavy loading condi- tion, these pressure peaks might even exceed the surface hardness, causing the material yielding and crack formation. The resultant stress fields exhibit extreme stress concentration sites close to the surface which facilitate the occurrence of the contact fatigue fail- ures at or near tooth surfaces. Additionally, as the gears roll in mesh, the contact radii of curvature, surface velocities, and normal tooth force are all time dependent. These transient effects intro- duce fluid film fluctuations into the contact to alter the lubrication behavior [1]. This paper aims at developing a high cycle contact fatigue model for spur gear contacts under mixed elastohydrody- namic lubrication (EHL) conditions considering all the transient effects associated with the rough surface gear contacts to predict the crack nucleation life distribution along the tooth profile. The model is also intended to predict the site of the crack nucleation (surface, near surface, or subsurface) in relation to the operating conditions, lubricant parameters, and surface roughness ampli- tudes. In addition, this study includes a set of gear contact fatigue experiments for the validation of the proposed model. Most of the contact fatigue studies in the literature focused on the twin-disk type of rolling contact fatigue (RCF) problems. Sev- eral of these studies [2–4] assumed ideally smooth contact surfaces with no lubrication. The phenomenon of surface crack formation was explained to be mainly due to the Coulomb friction along the contacting surfaces captured by the product of the Hertzian pressure and the assumed friction coefficient. With the smooth surface and dry contact conditions present, Jiang and Sehitoglu [5] investigated the ratcheting failures under pure rolling condition. Cheng et al. [6] proposed a persistent slip band based semi-analytical approach, examining the crack formation mechanism on the grain scale. Glo- dez ˇ et al. [7,8] included the crack propagation phase into the RCF modeling. Flas ˇker et al. [9] studied the surface crack propagation incorporating the EHL effects through the empirical smooth surface lubrication formulae. Davoli et al. [10] applied multi-axial fatigue criteria to spur gear contacts, assuming smooth and dry contact con- dition. The normal tooth force was obtained using very simplified formulation. Qiao et al. [11] and Snidle and Evans [12] studied the lubricated gear tooth surface fatigue by treating any instantaneous tooth contact as an independent line contact of a cylinder pair. The determination of the tooth force, however, was not given. Several multi-axial critical plane fatigue criteria were compared to claim that all yielded similar results. It was shown that the maximum fa- tigue damage occurred very close to the surface due to the rough- ness irregularities. The studies of Refs. [13–15] investigated the pitting failure under mixed lubrication regime. Epstein et al. [13] and Zhu et al. [14] examined the influence of surface finish on fa- tigue life using a Weibull model based fatigue criterion. Li and Kahraman [15] presented a full contact fatigue model for point con- tacts, proposing a Lagrangian–Eulerian approach to include the sur- face roughness effect on pitting fatigue. The predictions showed evident competition between the surface and the subsurface crack nucleation and correlated well with the experimental measurements using a two-disk set-up. The studies listed above considered a contact with constant ge- ometry, constant surface velocities as well as constant normal load, which is not representative for gear contacts. On the other 1 Corresponding author. Contributed by the Power Transmission and Gearing Committee of ASME for publication in the JOURNAL OF MECHANICAL DESIGN. Manuscript received June 19, 2011; final manuscript received November 12, 2011; published online March 15, 2012. Assoc. Editor: Prof. Philippe Velex. Journal of Mechanical Design APRIL 2012, Vol. 134 / 041007-1 Copyright V C 2012 by ASME Downloaded 31 Mar 2012 to 164.107.168.39. Redistribution subject to ASME license or copyright; see http://www.asme.org/terms/Terms_Use.cfm
Transcript of A Fatigue Model for Spur Gear Contacts Operating Under ...cecs.wright.edu/~sheng.li/papers/A fatigue...

S. Li1e-mail: [email protected]
A. Kahramane-mail: [email protected]
M. Kleine-mail: [email protected]
The Gear and Power Transmission
Research Laboratory,
Department of Mechanical and
Aerospace Engineering,
The Ohio State University,
201 West 19th Avenue,
Columbus, OH 43210
A Fatigue Model for Spur GearContacts Operating Under MixedElastohydrodynamic LubricationConditionsThis paper presents a model to predict the crack formation fatigue lives of spur gear con-tacts operating under mixed lubrication conditions where surface roughnesses introduceintermittent metal-to-metal contacts and severe stress concentrations. The proposedmodel consists of several submodels, including (i) a gear load distribution model todetermine the normal tooth force distribution along the tooth surface, incorporating anyprofile modifications and manufacturing deviations, (ii) a mixed elastohydrodynamiclubrication model customized to handle transient contact conditions of gears, (iii) a stressformulation that assumes the plane strain condition to compute the transient elastic stressfields on and below the tooth surface induced by the mixed lubrication surface pressureand shear stress distributions, and (iv) a multi-axial fatigue model to predict the cracknucleation life distribution. The proposed spur gear fatigue model is used to simulate thecontacts of gear pairs having different surface roughness amplitudes. The predictions arecompared to the measured gear fatigue stress-life data for each surface condition toassess the model accuracy in the prediction of the crack nucleation fatigue lives as wellas the location of the critical failure sites. [DOI: 10.1115/1.4005655]
Keywords: gear contact fatigue, multi-axial fatigue prediction, gear lubrication
1 Introduction
As one of the most common gear failures, pitting is the contactsurface fatigue failure, which often takes place in the dedendumregion below the pitch line with negative sliding. Contacting geartooth surfaces might have roughness amplitudes (caused by manu-facturing finishing processes such as grinding, shaving, or honing)that are comparable to lubricant film thickness, such that surfaceasperities can penetrate the fluid film and come into direct contact.Under such mixed lubrication condition where the local asperitycontacts and the elastohydrodynamic lubricant film share the nor-mal load, the roughness irregularities significantly elevate thelocal surface pressures to the magnitudes that are much higherthan the maximum Hertzian pressure. Under heavy loading condi-tion, these pressure peaks might even exceed the surface hardness,causing the material yielding and crack formation. The resultantstress fields exhibit extreme stress concentration sites close to thesurface which facilitate the occurrence of the contact fatigue fail-ures at or near tooth surfaces. Additionally, as the gears roll inmesh, the contact radii of curvature, surface velocities, and normaltooth force are all time dependent. These transient effects intro-duce fluid film fluctuations into the contact to alter the lubricationbehavior [1]. This paper aims at developing a high cycle contactfatigue model for spur gear contacts under mixed elastohydrody-namic lubrication (EHL) conditions considering all the transienteffects associated with the rough surface gear contacts to predictthe crack nucleation life distribution along the tooth profile. Themodel is also intended to predict the site of the crack nucleation(surface, near surface, or subsurface) in relation to the operatingconditions, lubricant parameters, and surface roughness ampli-tudes. In addition, this study includes a set of gear contact fatigueexperiments for the validation of the proposed model.
Most of the contact fatigue studies in the literature focused onthe twin-disk type of rolling contact fatigue (RCF) problems. Sev-eral of these studies [2–4] assumed ideally smooth contact surfaceswith no lubrication. The phenomenon of surface crack formationwas explained to be mainly due to the Coulomb friction along thecontacting surfaces captured by the product of the Hertzian pressureand the assumed friction coefficient. With the smooth surface anddry contact conditions present, Jiang and Sehitoglu [5] investigatedthe ratcheting failures under pure rolling condition. Cheng et al. [6]proposed a persistent slip band based semi-analytical approach,examining the crack formation mechanism on the grain scale. Glo-dez et al. [7,8] included the crack propagation phase into the RCFmodeling. Flasker et al. [9] studied the surface crack propagationincorporating the EHL effects through the empirical smooth surfacelubrication formulae. Davoli et al. [10] applied multi-axial fatiguecriteria to spur gear contacts, assuming smooth and dry contact con-dition. The normal tooth force was obtained using very simplifiedformulation. Qiao et al. [11] and Snidle and Evans [12] studied thelubricated gear tooth surface fatigue by treating any instantaneoustooth contact as an independent line contact of a cylinder pair. Thedetermination of the tooth force, however, was not given. Severalmulti-axial critical plane fatigue criteria were compared to claimthat all yielded similar results. It was shown that the maximum fa-tigue damage occurred very close to the surface due to the rough-ness irregularities. The studies of Refs. [13–15] investigated thepitting failure under mixed lubrication regime. Epstein et al. [13]and Zhu et al. [14] examined the influence of surface finish on fa-tigue life using a Weibull model based fatigue criterion. Li andKahraman [15] presented a full contact fatigue model for point con-tacts, proposing a Lagrangian–Eulerian approach to include the sur-face roughness effect on pitting fatigue. The predictions showedevident competition between the surface and the subsurface cracknucleation and correlated well with the experimental measurementsusing a two-disk set-up.
The studies listed above considered a contact with constant ge-ometry, constant surface velocities as well as constant normalload, which is not representative for gear contacts. On the other
1Corresponding author.Contributed by the Power Transmission and Gearing Committee of ASME for
publication in the JOURNAL OF MECHANICAL DESIGN. Manuscript received June 19,2011; final manuscript received November 12, 2011; published online March 15,2012. Assoc. Editor: Prof. Philippe Velex.
Journal of Mechanical Design APRIL 2012, Vol. 134 / 041007-1Copyright VC 2012 by ASME
Downloaded 31 Mar 2012 to 164.107.168.39. Redistribution subject to ASME license or copyright; see http://www.asme.org/terms/Terms_Use.cfm

hand, a complete fatigue analysis along the tooth profile from thestart of active profile (SAP) to the tip is required to determine theweak spots (in terms of failure) such that microgeometry modifi-cations can be applied to improve the tooth fatigue strength. Themain objective of this study is to develop a spur gear contact fa-tigue model that is capable of performing the complete tooth sur-face pitting analysis continuously along the tooth profile,incorporating the main transient gear contact parameters, includ-ing contact radii of curvature, surface tangential velocities, andnormal tooth force. As the second objective of this work, theresults of a spur gear pitting experimental study are presented andcompared to the model predictions to demonstrate the capabilityof the proposed model under different contact conditions.
It is assumed that the gear sets operate far away from theresonances such that the dynamic effects can be ignored and thequasi-static tooth force can be used. The thermal effects on theEHL behavior are also assumed to be negligible (energy equationscan be incorporated with the EHL formulation to include any in-stantaneous thermal effects) and other failure modes such as scuff-ing and wear are not considered. The changes in the surfaceroughness profiles during the run-in stage are excluded by usingthe after run-in surface roughness profiles and assuming that theprofiles remain the same after the run-in takes place [16,17]. Anylubricant additive effects are not considered and only one lubri-cant (an automatic transmission fluid) is considered. Further, onlythe crack nucleation life is included here as the experimental stud-ies such as Rahman et al. [18] and Hoffmann et al. [19] indicatedthat the crack propagation life was rather small compared to thecrack nucleation life for high cycle pitting fatigue. Meanwhile,pure elastic stress fields are assumed since the high cycle fatigueproblem, whose life is in excess of 1� 106 cycles is of primary in-terest. The measured residual stress field is superimposed onto theload induced stress component prior to the multi-axial fatigueevaluation. Any potential effect of the variation of the materialhardness with depth is not taken into account in the present study.
2 Modeling Methodology
The modeling methodology of gear contact fatigue consists offour major components as illustrated in Fig. 1. They are (i) a gearload distribution model to determine the normal tooth force distri-bution along the tooth surface, (ii) a gear EHL model to predictthe transient normal pressure pðx; tÞ and surface shear qðx; tÞ
distributions along the contacting tooth surfaces, (iii) a stress dis-tribution formulation to determine the time histories of the tran-sient stress fields imposed by pðx; tÞ and qðx; tÞ as the contactpasses by, and (iv) a multi-axial fatigue model to evaluate thecrack nucleation lives of all points on and below the tooth surface.The gear load distribution model employed [20] uses the formula-tion proposed by Conry and Seireg [21] and was briefly discussedin Li and Kahraman [1]. This model considers all the essentialcomponents of the gear tooth compliance (tooth bending, baserotation, shear, and Hertzian deformations) as well as any inten-tional profile modification and manufacturing error to predict theload distribution. The remaining three components of the gearcontact fatigue prediction methodology are described in the fol-lowing sections.
2.1 Gear Transient Mixed EHL Model. The model of Liand Kahraman [1] is used here to simulate the lubricated roughsurface gear contact starting from the SAP to the tooth tip (or incase of a driven gear, from the tip to the SAP) in a continuousmanner. The detailed formulation and discretization scheme usedfor the solution were described fully in Refs. [1] and [22]. Onlythe governing equations are presented here to highlight the criticalfeatures of the model in simulating the gear contact conditions.
Characterizing a spur gear contact as a line contact problem,the one-dimensional transient Reynolds equation governs thelubrication characteristics of the contact areas where hydrody-namic fluid film separates the surfaces
@
@xf@pðx; tÞ@x
� �¼ @ urðtÞqðx; tÞhðx; tÞ½ �
@xþ @ qðx; tÞhðx; tÞ½ �
@t(1a)
In the areas where the asperities interact (i.e., metal-to-metal con-tacts with no fluid film in between), the reduced form of Eq. (1a)is employed [1,15,22–24]
@ urðtÞhðx; tÞ½ �@x
þ @hðx; tÞ@t
¼ 0 (1b)
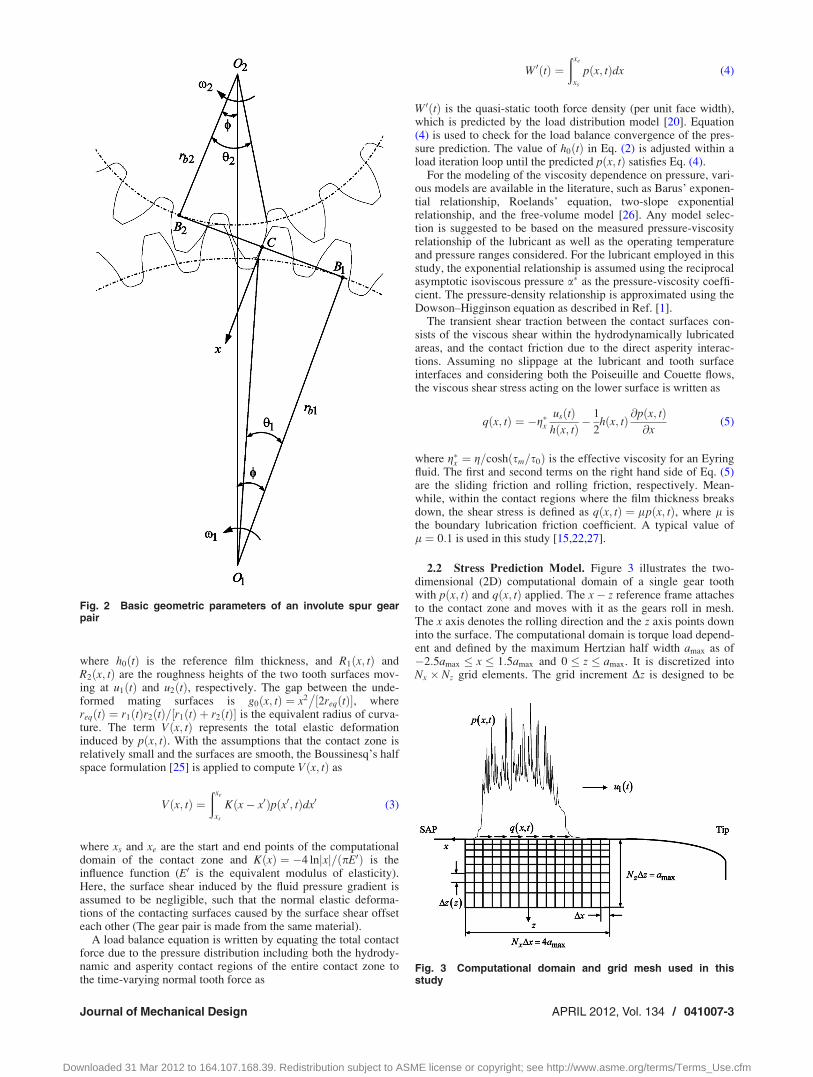
In these equations, x is the coordinate along the rolling (tooth pro-file) direction and travels with the contact along the line of action(Fig. 2), t is the time, and pðx; tÞ, hðx; tÞ, and qðx; tÞ denote the in-stantaneous pressure, film thickness, and density distributions of thefluid across the contact. The rolling velocity urðtÞ ¼ ½u1ðtÞþu2ðtÞ�=2 is the instantaneous average of the time varying pinionand gear surface velocities u1ðtÞ and u2ðtÞ. Referring to Fig. 2,u1ðtÞ ¼ x1r1ðtÞ and u2ðtÞ ¼ x2r2ðtÞ, where x1 and x2 are thenominal angular velocities of the gears, and r1ðtÞ ¼ B1C ¼ rb1h1ðtÞand r2ðtÞ ¼ B2C ¼ rb2h2ðtÞ are the time-varying radii of curvature(rb1 and rb2 are the base circle radii). Assuming an Eyring fluid, thenon-Newtonian effects are incorporated in the flow coefficient as[1,15]
f ¼ qh3
12gcosh
sm
s0
� �(1c)
where g is the lubricant viscosity, s0 is the pressure dependentEyring stress [22], and sm is the mean viscous shear stress deter-mined by sm=s0 ¼ sinh�1½gusðtÞ=ðs0hÞ�. Here, the instantaneoussliding velocity usðtÞ ¼ u1ðtÞ � u2ðtÞ is also time dependent. Des-ignating gear 1 as the driving gear, the kinematics of involutegearing states that u1ðtÞ < u2ðtÞ when the contact is below thepitch line along the line segment B1C in Fig. 2, u1ðtÞ ¼ u2ðtÞ (nosliding, pure rolling) when the contact is at the pitch point C, andu1ðtÞ > u2ðtÞ when the contact is at the addendum region (alongthe line segment B2C in Fig. 2) of the driving gear.
The local film thickness at the position x and time t is defined as
hðx; tÞ ¼ h0ðtÞ þ g0ðx; tÞ þ Vðx; tÞ � R1ðx; tÞ � R2ðx; tÞ (2)Fig. 1 Flowchart of the gear contact fatigue methodology
041007-2 / Vol. 134, APRIL 2012 Transactions of the ASME
Downloaded 31 Mar 2012 to 164.107.168.39. Redistribution subject to ASME license or copyright; see http://www.asme.org/terms/Terms_Use.cfm
where h0ðtÞ is the reference film thickness, and R1ðx; tÞ andR2ðx; tÞ are the roughness heights of the two tooth surfaces mov-ing at u1ðtÞ and u2ðtÞ, respectively. The gap between the unde-formed mating surfaces is g0ðx; tÞ ¼ x2
�½2reqðtÞ�, where
reqðtÞ ¼ r1ðtÞr2ðtÞ=½r1ðtÞ þ r2ðtÞ� is the equivalent radius of curva-ture. The term Vðx; tÞ represents the total elastic deformationinduced by pðx; tÞ. With the assumptions that the contact zone isrelatively small and the surfaces are smooth, the Boussinesq’s halfspace formulation [25] is applied to compute Vðx; tÞ as
Vðx; tÞ ¼ðxe
xs
Kðx� x0Þpðx0; tÞdx0 (3)
where xs and xe are the start and end points of the computationaldomain of the contact zone and KðxÞ ¼ �4 ln xj j=ðpE0Þ is theinfluence function (E0 is the equivalent modulus of elasticity).Here, the surface shear induced by the fluid pressure gradient isassumed to be negligible, such that the normal elastic deforma-tions of the contacting surfaces caused by the surface shear offseteach other (The gear pair is made from the same material).
A load balance equation is written by equating the total contactforce due to the pressure distribution including both the hydrody-namic and asperity contact regions of the entire contact zone tothe time-varying normal tooth force as
W0ðtÞ ¼ðxe
xs
pðx; tÞdx (4)
W0ðtÞ is the quasi-static tooth force density (per unit face width),which is predicted by the load distribution model [20]. Equation(4) is used to check for the load balance convergence of the pres-sure prediction. The value of h0ðtÞ in Eq. (2) is adjusted within aload iteration loop until the predicted pðx; tÞ satisfies Eq. (4).
For the modeling of the viscosity dependence on pressure, vari-ous models are available in the literature, such as Barus’ exponen-tial relationship, Roelands’ equation, two-slope exponentialrelationship, and the free-volume model [26]. Any model selec-tion is suggested to be based on the measured pressure-viscosityrelationship of the lubricant as well as the operating temperatureand pressure ranges considered. For the lubricant employed in thisstudy, the exponential relationship is assumed using the reciprocalasymptotic isoviscous pressure a� as the pressure-viscosity coeffi-cient. The pressure-density relationship is approximated using theDowson–Higginson equation as described in Ref. [1].
The transient shear traction between the contact surfaces con-sists of the viscous shear within the hydrodynamically lubricatedareas, and the contact friction due to the direct asperity interac-tions. Assuming no slippage at the lubricant and tooth surfaceinterfaces and considering both the Poiseuille and Couette flows,the viscous shear stress acting on the lower surface is written as
qðx; tÞ ¼ �g�xusðtÞ
hðx; tÞ �1
2hðx; tÞ @pðx; tÞ
@x(5)
where g�x ¼ g=coshðsm=s0Þ is the effective viscosity for an Eyringfluid. The first and second terms on the right hand side of Eq. (5)are the sliding friction and rolling friction, respectively. Mean-while, within the contact regions where the film thickness breaksdown, the shear stress is defined as qðx; tÞ ¼ lpðx; tÞ, where l isthe boundary lubrication friction coefficient. A typical value ofl ¼ 0:1 is used in this study [15,22,27].
2.2 Stress Prediction Model. Figure 3 illustrates the two-dimensional (2D) computational domain of a single gear toothwith pðx; tÞ and qðx; tÞ applied. The x� z reference frame attachesto the contact zone and moves with it as the gears roll in mesh.The x axis denotes the rolling direction and the z axis points downinto the surface. The computational domain is torque load depend-ent and defined by the maximum Hertzian half width amax as of�2:5amax � x � 1:5amax and 0 � z � amax. It is discretized intoNx � Nz grid elements. The grid increment Dz is designed to be
Fig. 2 Basic geometric parameters of an involute spur gearpair
Fig. 3 Computational domain and grid mesh used in thisstudy
Journal of Mechanical Design APRIL 2012, Vol. 134 / 041007-3
Downloaded 31 Mar 2012 to 164.107.168.39. Redistribution subject to ASME license or copyright; see http://www.asme.org/terms/Terms_Use.cfm

variable such that it gets smaller near the surface where localstress concentrations due to the surface roughness are expected.The Dx increment is kept constant and sufficiently small (on theorder of micrometer) to capture the measured surface roughnessvariations accurately.
As the contact zone moves along the tooth profile, the materialpoints on and below the surface experience the transient stressfields of the normal components (rx, ry, and rz) and the shearcomponent rxz with the plane strain assumption. The y direction isperpendicular to the x and z axes in a Cartesian coordinate systemorientation. In order to determine the stress components inducedby the distributions of pðx; tÞ and qðx; tÞ, the perfectly smoothelastic half space formulations [25] are used to find the stressesfor the grid nodes along the tooth surface as
rxðx; 0; tÞ ¼ �pðx; tÞ � 2
p
ðxe
xs
qðs; tÞðx� sÞ ds (6a)
rzðx; 0; tÞ ¼ �pðx; tÞ (6b)
rxzðx; 0; tÞ ¼ �qðx; tÞ (6c)
The stress components at the grid nodes below the surface aregiven as
rxðx; z; tÞ ¼ �2z
p
ðxe
xs
pðs; tÞðx� sÞ2
ðx� sÞ2 þ z2h i2
ds� 2
p
ðxe
xs
q s; tð Þðx� sÞ3
ðx� sÞ2 þ z2h i2
ds
(7a)
rzðx;z; tÞ ¼�2z3
p
ðxe
xs
pðs; tÞ
ðx� sÞ2þ z2h i2
ds�2z2
p
ðxe
xs
qðs; tÞðx� sÞ
ðx� sÞ2þ z2h i2
ds
(7b)
rxzðx;z; tÞ ¼�2z2
p
ðxe
xs
pðs; tÞðx� sÞ
ðx� sÞ2þ z2h i2
ds�2z
p
ðxe
xs
qðs; tÞðx� sÞ2
ðx� sÞ2þ z2h i2
ds
(7c)
Here, the influence of local asperity geometry on the near surfacestress concentration is not considered. In addition, the stress com-ponent ry is not evaluated since the multi-axial fatigue criteria donot require it under the line contact condition. It is noted here thatEqs. (6) and (7) have the form of convolution and can be numeri-cally evaluated using the Discrete Fourier Transform (DFT) con-volution technique [15].
For most of the fatigue criteria, the fatigue damage assessmentrequires the mean and alternating components of the shear andnormal stresses on a certain plane. Therefore, the multi-axialstress time histories for each material point of interest must bedetermined while the contact passes by. Considering gear j(j ¼ 1; 2), a X � Z reference frame that is fixed on the gear toothis defined with its origin positioned at the SAP of the straightenedtooth profile with the X axis being tangent to the surface pointingtoward the tooth tip and the Z axis representing the depth into thematerial. The fixed X � Z coordinate frame and the moving x� zcoordinate frame are related according to
X ¼ X0 þð
ujðtÞdt
� �� x (8a)
Z ¼ z (8b)
where X0 is the position of the x� z frame at t ¼ 0. With this, thehistories of the stress components ri (i ¼ x; z and xz) of any arbi-trary grid point fixed in the X � Z frame can be defined as
RIðX; Z; tÞ ¼ ri X0 þð
ujðtÞdt� X
� �;Z; t
� �(9)
where I ¼ X; Z or XZ. Any residual stresses caused by the surfacemachining and heat treatment processes (measured along the z
axis) can be superimposed onto the predicted elastic stress fields,which alters the mean values while leaving the alternating stressamplitudes unchanged.
2.3 Multi-Axial Contact Fatigue Life Model. The criticalplane approach has been frequently used in the multi-axial fatiguelife prediction, showing reasonable correlations to fatigue experi-ments [28–32]. Various forms of critical plane fatigue criteriahave been proposed according to the fatigue failure mechanismsobserved and the damage parameters selected. For rough surfacegear contacts subjected to mixed EHL condition, the fracturemode is rather complicated for surface nucleated local failures,making it difficult to select the most appropriate form of the criti-cal plane fatigue criteria. The alternative fatigue approach thatdoes not require the preknowledge of the fracture mode is the so-called characteristic plane approach [33] that evaluates the fatiguedamage on a material plane, on which the contribution of thehydrostatic stress on fatigue is minimum. This plane may or maynot represent the fracture plane. The characteristic plane basedmulti-axial fatigue method was used earlier to generic point con-tacts under mixed EHL condition [15]. The fatigue predictionswere shown to correlate well with the pitting experiments using atwin-disk setup, not only in terms of the life cycles but also interms of the critical failure locations.
In this work, the critical plane fatigue criterion proposed by Sus-mel and Lazzarin [31,32] and the characteristic plane fatigue crite-rion [15,33] are both implemented for the rough surface gear contactfatigue analysis. It is noted here any other suitable multi-axialfatigue criterion can also be used with the proposed methodology.
Defining the critical plane as the plane with the maximum shearstress amplitude, the maximum normal stress ðrmaxÞc and theshear stress amplitude ðsaÞc acting on this critical plane are usedto define the stress ratio # ¼ ðrmaxÞc
�ðsaÞc. Susmel and Lazzar-
in’s criterion [31,32] predicts the fatigue life Nf as
Nf ¼sað ÞcSNr
� �k
Nr (10)
where SNrand k are the fatigue strength corresponding to the ref-
erence life cycle Nr and the inverse slope of the modified WohlerS-N curve, respectively. Both of these parameters are functions ofthe stress ratio #. The modified Wohler curve describes the rela-tionship between the maximum shear stress amplitude and thenumber of cycles to failure [31]. In the absence of the measuredmodified Wohler curves at different stress ratio values, SNr
and kcan be approximated as [31]
SNr¼ # SNr
j#¼1�SNrj#¼0
� �þ SNr
j#¼0 (11a)
k ¼ # kj#¼1�kj#¼0
� �þ kj#¼0 (11b)
Here, # ¼ 1 and # ¼ 0 correspond to the fully reversed axial andtorsional loading conditions, respectively.
The gear material properties, namely, the fully reversed purebending fatigue strength and fully reversed pure torsion fatiguestrength, define the angle a at which the characteristic plane ispositioned from the macro fatigue fracture plane (the plane expe-riencing the maximum normal stress amplitude). This angle hasthe expression of Ref. [33]
a ¼ 1
2cos�1 �s2 þ
ffiffiffiffiffiffiffiffiffiffiffiffiffiffiffiffiffiffiffiffiffiffiffiffiffiffiffiffiffiffiffiffiffiffiffiffiffiffiffiffiffiffiffiffiffiffiffiffiffiffiffiffiffiffiffiffiffiffiffiffiffiffis4 � ð1� 3s2Þð�1þ 5s2 � 4s4Þ
p�1þ 5s2 � 4s4
" #(12)
Here, s ¼ StN
�Sb
N where SbN and St
N are the fully reversed bendingand fully reversed torsion fatigue strength of the material at finitefatigue life cycles of N (s < 1 for nonextremely brittle materials[33]). Assuming that the mean shear stress effect is negligible, thefatigue criterion is defined on the characteristic plane as [33]
041007-4 / Vol. 134, APRIL 2012 Transactions of the ASME
Downloaded 31 Mar 2012 to 164.107.168.39. Redistribution subject to ASME license or copyright; see http://www.asme.org/terms/Terms_Use.cfm

1
b 1� rm;max
Sr
� � r2a þ
SbN
StN
� �2
s2a þ jr2
a;H
" #12
¼ SbN (13)
where b ¼ffiffiffiffiffiffiffiffiffiffiffiffiffiffiffiffiffiffiffiffiffiffiffiffiffiffiffiffiffiffiffiffiffiffiffiffiffiffiffiffiffiffiffiffis2 cos2ð2aÞ þ sin2ð2aÞ
q, and ra, sa, and ra;H are the
normal stress amplitude, shear stress amplitude, and the hydro-static stress amplitude acting on the characteristic plane, respec-tively. The mean normal stress effect is included through thecorrection term ð1� rm;max
�SrÞ where rm;max is the mean normal
stress on the macrofracture plane and Sr is a reference stress thatdefines the extent of the mean stress effect and is determinedthrough the uniaxial fatigue data or approximated using the ulti-mate tensile strength of the material. For the material consideredin this study, Sr ¼ 1:25 GPa. The characteristic planes passingthrough the material points of interest are searched in the 2D planewith a 2 deg increment. The fatigue lives are then determined bysolving Eq. (13) numerically.
In order to enhance the statistical meaning of the predictionsand capture the tooth-to-tooth surface roughness variations, thedeterministic gear contact fatigue analysis is repeated for manytimes, each time using different roughness profiles measured fromdifferent gear teeth. These predictions are then analyzed statisti-cally to obtain the median, 10th and 90th percentile lives of thegear pairs.
3 Comparison to Gear Pitting Experiments
An experimental study consisting of a number of gear pittingtests was conducted with the objective to validate the model pre-dictions. Although the test machines used in these experimentswere standard FZG, the test specimens were different from thestandard FZG pitting gears. The basic design parameters of thetest gears are listed in Table 1. The microgeometry modificationsincluding linear tip relief and circular lead crown (specified inTable 1) were applied to both the pinion and the gear to adjust theload distribution pattern. These specimens were made of a typicalgear steel (AISI 8620) and case hardened to achieve a tooth sur-face hardness of 60 HRC with the case depth of 1.3 mm. All ofthe tests were performed under dip lubricated condition with atypical automatic transmission fluid controlled at 90 �C. The rota-tional speed of the 17-tooth gear was maintained at 2200 rpm cor-responding to the pitch line tangential surface velocity of 3.3 m=s.Six loading levels defined by the normalized pitch line Hertzianpressure of pp ¼ pp
�pr ¼ 1:71, 1.62, 1.50, 1.34, 1.29, and 1.14
(pp is the pitch line Hertzian pressure and pr is a reference pres-sure) were used. A total pitted area greater than 3.8 mm2 on a sin-gle tooth or 16 mm2 on all teeth was used as the pitting failurecriterion. Any test with the wear depth exceeding 12 lm wasconsidered as a wear failure and excluded from the pitting data-base. For each test, the gears were inspected every 10% of the
anticipated life expectancy, with the inspections alternatingbetween the visual ones and the ones involving physical measure-ments (including pit size, surface roughness, and wearaccumulation).
The gears having two different surface textures were consid-ered. One batch of shaved gears has the average root-mean-square(RMS) roughness amplitudes of 0.41 lm and 0.45 lm for the pin-ion (17-tooth) and gear (26-tooth) surfaces, respectively. Theother batch is superfinished with the average RMS roughness of0.13 lm on both surfaces. The measured example surface rough-ness profiles in the tooth profile direction (after 4 h of run-in pro-cess) of these two surface finishes are compared in Fig. 4,showing substantial roughness amplitude reduction through thesuperfinishing process. Figure 5 shows the pitting failure imagesof the shaved pinions (left column) and the superfinished pinions(right column) at the highest loading level of pp ¼ 1:71 and a me-dian loading level of pp ¼ 1:50. The positions of the lower tips ofthese pits where the failures were initiated and were identified tobe in the neighborhood of the lowest point of single tooth contactwith the roll angle of 16:7 deg. The maximum depths of the pitsproduced in this work vary between 0.15 mm and 0.42 mmdepending on the extent of the crack growth and how early thepits were identified during the tests. Although the formed pits inFig. 5 passed the crack nucleation stage, the crack propagationlives were found to be a small portion of the total life. Forinstance, the images of a pinion surface at different contact cyclesduring its test (Fig. 6) reveal no signs of pitting up to 64� 106
cycles. Besides these physical inspections, no observable crackwas found in the visual inspection at 72� 106 cycles, such thatthe crack propagation life can be roughly estimated to be less than13% of the total life. This observation is in line with the experi-mental studies of Rahman et al. [18] and Hoffmann et al. [19].The former observed surface initiated pitting failure under themixed lubrication condition with the crack nucleation life consti-tuting 99.77% of the total life. The latter used the same materialand same type of lubricant as those in this study and showed thecrack nucleation life constitutes 75% of the total life. Even underthe full film elastohydrodynamic lubrication condition, the pitswere observed to be surface nucleated and grow at 30 deg angleinto the material [19].
Table 1 Basic design parameters of the pitting test spur gearpairs
Parameter Pinion Gear
Module (mm) 4.23Center distance (mm) 91.50Number of teeth 17 26Pressure angle (deg) 22.5Face width (mm) 14.00 20.29Pitch diameter (mm) 71.97 110.07Base diameter (mm) 66.49 101.69Outside diameter (mm) 80.02 117.11Roll angle at start of first Linear tip relief (deg) 25 25First linear tip relief magnitude (lm) 10 5Roll angle at start of second linear tip relief (deg) 31 28Second linear tip relief magnitude (lm) 41 30Circular crown (lm) 10 10 Fig. 4 Measured example surface roughness profiles for (a)
shaved gear surfaces and (b) superfinished gear surfaces
Journal of Mechanical Design APRIL 2012, Vol. 134 / 041007-5
Downloaded 31 Mar 2012 to 164.107.168.39. Redistribution subject to ASME license or copyright; see http://www.asme.org/terms/Terms_Use.cfm

Fig. 5 Pitting failure images for shaved gear pairs (left column) and superfinished gear pairs(right column) under the loading levels of (a) and (c) pp ¼ 1:71 and (b) and (d) pp ¼ 1:50
Fig. 6 Surface images of an example superfinished pinion at the contact cycles of (a) 0,(b) 18.4 3 106, (c) 36.7 3 106, (d) 55.1 3 106, (e) 64.2 3 106, and (f) 82.6 3 106 for pp ¼ 1:34.
041007-6 / Vol. 134, APRIL 2012 Transactions of the ASME
Downloaded 31 Mar 2012 to 164.107.168.39. Redistribution subject to ASME license or copyright; see http://www.asme.org/terms/Terms_Use.cfm

These gear pitting experiments are simulated using the fatiguemodel presented in Sec. 2. The computational domain defined inFig. 3 is discretized with Nx ¼ 512 in the x direction such thatDx ¼ 2:3 lm. Through comparisons to the predictions withNx ¼ 1024, this grid density was deemed sufficiently accurate. Finermeshes can be used within the same methodology to refine the pre-dictions when necessary. In the z direction, Nz ¼ 30 with variableincrement, starting at Dz ¼ 1:8 lm for the first layer and increasingby a factor of 1.1 for each consecutive layer. A total of 500 timeinstances are used to define the travel of the contact from the SAPto the tip corresponding to a time increment of Dt ¼ 3:8 ls. Thelubricant used has the ambient density of q0 ¼ 824 kg=m
3, the
ambient viscosity of g0 ¼ 0:006 Pa s, and the reciprocal asymptoticisoviscous pressure of a� ¼ 12:6 GPa�1 at 90 �C. The Eyring stresshas the ambient value of 5 MPa and is assumed to be linearlydependent on the pressure starting at 0.8 GPa with the slope of 0.05.It was shown [34], the exponential relationship could be used toapproximate the general pressure-viscosity relationship if a� is usedas the pressure-viscosity coefficient. Thus, the pressure-viscositybehavior is described by the exponential relationship using a� in thisstudy. To include the surface roughness differences from tooth totooth, eight different measured pinion-gear surface roughness profilepairs are used for each of the pitting fatigue analysis under differentloading and surface conditions.
Due to the circular lead crown, the tooth force varies along theface width. This variation cannot be represented by a single linecontact. The gear set is thus discretized into a number of very thinspur gear slices (11 slices in this work), and the fatigue analysis isperformed for each slice individually while only the results for thecenter slice which has the highest loading condition are presented.For example, loading level at pp ¼ 1:50, the variation of the pre-dicted normal tooth force density W0 as a function of the pinionroll angle h1 is plotted in Fig. 7 for the center gear slice. Underthis loading condition, the example instantaneous solutions ofpðx; tÞ, hðx; tÞ, and qðx; tÞ of the gears with shaved tooth surfacesare shown in Figs. 8–10 for one of the surface roughness pairs.Here, Figs. 8–10 represent the instances when the contact is at thelowest point of single tooth contact (LPSTC) with h1 ¼ 16:7 deg,the operating pitch point (h1 ¼ 24:6 deg) and the highest point ofsingle tooth contact (HPSTC) with h1 ¼ 33:9 deg, respectively. Inthese figures, the asperity contacts (with zero film thickness) arecommon, resulting in sharp normal pressure and surface shearspikes. At the LPSTC in Fig. 8, the negative sliding (us < 0)causes positive surface shear on the pinion tooth surface, whilethe opposite is true in Fig. 10 for the HPSTC.
In Figs. 8–10, the corresponding instantaneous rx, rz, and rxz
distributions are also displayed. Due to the local surface irregular-ities, severe stress concentrations are observed at the near surface
locations. Especially for rxz, its near surface (z < 10 lm) ampli-tude exceeds its maximum amplitude within the subsurface region(z > 50 lm). It should be noted that even the depth of the maxi-mum subsurface orthogonal shear stress amplitude is pulled up to-ward the surface owing to the surface roughness effects. It is alsointeresting to see this depth increases as the contact moves fromthe LPSTC to the operating pitch and then to the HPSTC.
The histories of the stress components are used to search for thecritical plane or characteristic plane and assess the fatigue damageaccording to the two different fatigue criteria presented above foreach grid point on and below the tooth surface. The fully reversedbending and fully reversed torsion fatigue strength employed wereexperimentally determined using through hardened specimens withthe same tooth surface hardness of 60 HRC. To minimize the influ-ence of surface roughness on the fatigue strength measurements todefine Sb
N and StN , the specimens were polished to arrive at the
RMS roughness amplitudes less than 0.2 lm. The predicted lower10th percentile, median and upper 10th percentile life distributionsalong the entire tooth are plotted in Figs. 11 and 12 for the shavedand superfinished gears at pp ¼ 1:50, respectively. In these figures,the crack nucleation fatigue life predictions of the critical planeapproach (left column) and the characteristic plane approach (rightcolumn) are compared directly. Both approaches predict that thecritical failure position is in the dedendum region of the tooth.However, the two criteria yield different depth of the crack nuclea-tion site, subsurface initiation for the critical plane approach andsurface initiation for the characteristic plane approach. A moredetailed comparison in terms of the position and the correspondingslide-to-roll ratio SR ¼ us=ur of the critical crack nucleation site islisted in Tables 2 and 3. It is seen the characteristic plane approachpredicts failures closer to the LPSTC compared to the critical plane
Fig. 7 Central tooth force density distribution along the pinionroll angle at pp ¼ 1:50
Fig. 8 Predicted instantaneous (a) pðx ; tÞ (solid line) andhðx ; tÞ (dashed line), (b) qðx ; tÞ, (c) rx , (d) rz , and (e) rxz distribu-tions at the LPSTC for shaved gears at pp ¼ 1:50
Journal of Mechanical Design APRIL 2012, Vol. 134 / 041007-7
Downloaded 31 Mar 2012 to 164.107.168.39. Redistribution subject to ASME license or copyright; see http://www.asme.org/terms/Terms_Use.cfm

Fig. 10 Predicted instantaneous (a) pðx ; tÞ (solid line) andhðx ; tÞ (dashed line), (b) qðx ; tÞ, (c) rx , (d) rz , and (e) rxz distribu-tions at the HPSTC for shaved gears at pp ¼ 1:50
Fig. 11 Predicted (a) lower 10th percentile life, (b) median life, and (c) upper 10th percen-tile life distributions at pp ¼ 1:50 for shaved gears. (a1-c1) Critical plane approach predic-tions and (a2-c2) characteristic plane approach predictions.
Fig. 9 Predicted instantaneous (a) pðx ; tÞ (solid line) andhðx ; tÞ (dashed line), (b) qðx ; tÞ, (c) rx , (d) rz , and (e) rxz distribu-tions at the pitch point for shaved gears at pp ¼ 1:50
041007-8 / Vol. 134, APRIL 2012 Transactions of the ASME
Downloaded 31 Mar 2012 to 164.107.168.39. Redistribution subject to ASME license or copyright; see http://www.asme.org/terms/Terms_Use.cfm

approach. As the load decreases, the crack formation depth movesupward from 116 lm to 48 lm for the shaved surfaces, and from144 lm to 112 lm for the superfinished surfaces according to thecritical plane criterion. The reduced roughness amplitudes on thesuperfinished surfaces are shown to have less influence on the crackdepth. However, the characteristic plane criterion predicts that thecracks initiate on the surface for both surface textures under all theload levels, agreeing with the experimental observations of Blue-stein [16] and Klein [17] on these tests. The predictions using thecharacteristic plane criterion also compare better to the experimentsin terms of the roll angles at which the cracks form. This suggests
the characteristic plane criterion represents the observed failuremechanism better.
In Fig. 13(a), the lower 10th, median and upper 10th fatiguelives obtained by using the characteristic plane criterion is
Fig. 12 Predicted (a) lower 10th percentile life, (b) median life, and (c) upper 10th percen-tile life distributions at pp ¼ 1:50 for superfinished gears. (a1-c1) Critical plane approachpredictions and (a2-c2) characteristic plane approach predictions.
Table 2 Comparison of the position of the critical cracknucleation site predictions between the critical plane and thecharacteristic plane criteria for shaved surfaces
Critical plane approach Characteristic plane approach
pp z (lm) h1 (deg) SR z (lm) h1 (deg) SR
1.71 116 19.69 �0.34 0 19.43 �0.361.62 97 18.12 �0.46 0 17.42 �0.511.50 80 18.88 �0.40 0 17.87 �0.481.34 71 21.20 �0.24 0 16.76 �0.561.29 69 17.12 �0.53 0 16.56 �0.571.14 48 17.37 �0.51 0 16.46 �0.58
Table 3 Comparison of the position of the critical cracknucleation site predictions between the critical plane and thecharacteristic plane criteria for superfinished surfaces
Critical plane approach Characteristic plane approach
pp z (lm) h1 (deg) SR z (lm) h1 (deg) SR
1.71 144 18.17 �0.45 0 17.52 �0.501.62 135 18.38 �0.43 0 17.42 �0.511.50 126 19.23 �0.37 0 17.17 �0.521.34 112 17.77 �0.48 0 16.61 �0.57
Fig. 13 Comparisons of the pitting lives between the modelprediction using the characteristic plane approach and the ex-perimental measurements for (a) shaved gear pairs and (b)superfinished gear pairs
Journal of Mechanical Design APRIL 2012, Vol. 134 / 041007-9
Downloaded 31 Mar 2012 to 164.107.168.39. Redistribution subject to ASME license or copyright; see http://www.asme.org/terms/Terms_Use.cfm

compared to the experimental data for the shaved specimens in theform of the stress-life curve. In the process, the measured total fa-tigue lives are used to estimate the crack nucleation life, since thecrack propagation life has been shown to be a small portion of thetotal life [18,19]. The measurements at the six load levels are repre-sented by 48 data points. With the exception of the lowest loadlevel, the others are all well populated. A reasonably good agree-ment is observed between the measured and the predicted life val-ues. Likewise, Fig. 13(b) compares the measurements consisting of30 test points to the predictions for the superfinished surfaces. It isagain observed that the model predictions are in a good agreementwith the measured fatigue lives. Comparing the two surface finishesat pp ¼ 1:71, the measured mean fatigue lives are 5.8� 106 cycles(shaved) and 9.9� 106 cycles (superfinished), representing morethan 70% increase in life with the surface roughness amplitudereduction. For the lower loading level of pp ¼ 1:34, however, themeasured mean lives for the two surface finishes only show 37% oflife improvement (from 61.2� 106 cycles to 83.6� 106 cycles).This might be due to the moderate amounts of wear accumulated onthe tooth surfaces for the shaved gears which experienced more than20� 106 cycles under the lower loading levels. Although this wearamount did not reach the imposed wear failure criterion of 12 lm, itcould relieve the contact pressure and extend the service life. Forthe higher loading levels, most of the pits were produced before anynoticeable wear was observed. For the superfinished gears, negligi-ble wear was found for all the loading conditions. Since the modeldoes not include the effect of surface wear, the predicted lives devi-ate from the measurements when pp � 1:34 for shaved surfaces.
4 Conclusion
In this study, a model to predict the crack formation fatiguelives of spur gear contacts operating under mixed lubrication con-ditions was proposed. The model consists of a gear load distribu-tion model to determine the normal tooth force distribution alongthe tooth profile, incorporating any profile modifications and man-ufacturing deviations, a mixed EHL model customized to handletransient contact conditions of gears, a stress formulation thatassumes plane strain condition to compute the transient elasticstress fields on and below the tooth surface induced by the surfacestresses, and a multi-axial fatigue model to predict the cracknucleation life distribution. Two different multi-axial fatigueapproaches were implemented to evaluate the gear contact fatiguewith different surface roughness amplitudes. The predictions werecompared to measured gear fatigue stress-life data for each sur-face condition, showing the characteristic plane criterion is rea-sonably accurate in predicting the crack nucleation fatigue lives aswell as the location of the critical failure sites.
Acknowledgment
Authors thank General Motors Powertrain for sponsoring thisresearch activity.
Nomenclatureamax ¼ maximum half-Hertzian width
f ¼ flow coefficientg0 ¼ gap between the mating surfaces before any elastic
deformation occursh ¼ film thickness
h0 ¼ reference film thicknessNx;Nz ¼ number of grid elements of the computational domain
in the x and z directions, respectivelyp ¼ contact pressure
pp ¼ pitch line Hertzian pressurepp ¼ normalized pitch line Hertzian pressure, pp ¼ pp
�pr
pr ¼ reference pressureq ¼ surface shear stress
r1; r2 ¼ contact radii of curvature of surface 1 and 2,respectively
R1; R2 ¼ surface roughness height on surface 1 and 2,respectively
SR ¼ slide-to-roll ratio, SR ¼ us=ur
SbN ; S
tN ¼ fully reversed bending and torsion fatigue strength cor-
responding to the fatigue life of NSr ¼ material reference strength
t ¼ timeu1; u2 ¼ tooth tangential surface velocities gear 1 and gear 2,
respectivelyur ¼ rolling velocity, ur ¼ ðu1 þ u2Þ=2us ¼ sliding velocity, us ¼ u1 � u2
V ¼ elastic deformationW0 ¼ tooth force density along the contact line
x;X ¼ coordinate along the rolling direction of the referenceframe attached to the contact zone and the referenceframe attached to the tooth, respectively
z;Z ¼ coordinate points into the material of the referenceframe attach to the contact zone and the referenceframe attached to the tooth, respectively
a ¼ angle between the characteristic plane and the macro-fracture plane
a� ¼ reciprocal asymptotic isoviscous pressureg ¼ lubricant viscosity
g0 ¼ ambient lubricant viscosityg�x ¼ effective lubricant viscosityq ¼ lubricant density
q0 ¼ ambient lubricant densityrx; rz ¼ normal stress components in the x and z directions,
respectivelyrxz ¼ shear stress componentra ¼ normal stress amplitude on the characteristic plane
ra;H ¼ hydrostatic stress amplitude on the characteristic planerm;max ¼ normal stress amplitude on the macrofracture planeðrmaxÞc ¼ maximum normal stress on the critical plane
s0 ¼ lubricant reference shear stresssa ¼ shear stress amplitude on the characteristic plane
ðsaÞc ¼ shear stress amplitude on the critical planex1; x2 ¼ angular velocities of gear 1 and gear 2, respectively
References[1] Li, S., and Kahraman, A., 2010, “A Transient Mixed Elastohydrodynamic
Lubrication Model for Spur Gear Pairs,” ASME J. Tribol., 132(1), p. 011501.[2] Ringsberg, J. W., Loo-Morrey, M., Josefson, B. L., Kapoor, A., and Beynon,
J. H., 2000, “Prediction of Fatigue Crack Initiation for Rolling ContactFatigue,” Int. J. Fatigue, 22(3), pp. 205–215.
[3] Ringsberg, J. W., 2001, “Life Prediction of Rolling Contact Fatigue Crack Ini-tiation,” Int. J. Fatigue, 23(7), pp. 575–586.
[4] �Sraml, M., Flasker, J., and Potrc, I., 2003, “Numerical Procedure for Predictingthe Rolling Contact Fatigue Crack Initiation,” Int. J. Fatigue, 25(7), pp.585–595.
[5] Jiang, Y., and Sehitoglu, H., 1999, “A Model for Rolling Contact Fatigue,”Wear, 224(1), pp. 38–49.
[6] Cheng, W., Cheng, H. S., Mura, T., and Keer, L. M., 1994, “MicromechanicsModeling of Crack Initiation Under Contact Fatigue,” ASME J. Tribol., 116(1),pp. 2–8.
[7] Glodez, S., Winter, H., and Stuwe, H. P., 1997, “A Fracture Mechanics Modelfor the Wear of Gear Flanks by Pitting,” Wear, 208(1–2), pp. 177–183.
[8] Glodez, S., Flasker, J., and Ren, Z., 1997, “A New Model for the NumericalDetermination of Pitting Resistance of Gear Teeth Flanks,” Fatigue Fract. Eng.Mater. Struct., 20(1), pp. 71–83.
[9] Flasker, J., Fajdiga, G., Glodez, S., and Hellen, T. K., 2001, “Numerical Simu-lation of Surface Pitting Due to Contact Loading,” Int. J. Fatigue, 23(7), pp.599–605.
[10] Davoli, P., Bernasconi, A., and Carnevali, L., 2003, “Application of MultiaxialCriteria to Contact Fatigue Assessment of Spur Gears,” Proceedings of ASMEDesign Engineering Technical Conferences and Computers and Information inEngineering Conference, September 2003, Chicago, IL, Paper No.DETC2003=PTG-48001.
[11] Qiao, H., Evans, H. P., and Snidle, R. W., 2008, “Comparison of Fatigue ModelResults for Rough Surface Elastohydrodynamic Lubrication,” J. Eng. Tribol.,222(3), pp. 381–393.
[12] Snidle, R. W., and Evans, H. P., 2010, “Mixed Lubrication and Prediction ofSurface Fatigue in Gear Tooth Contacts,” Proceedings of International Confer-ence on Gears, Technical University of Munich, October 2010, VDI-Berichte,Dusseldorf, Germany, VDI-Berichte No. 2108.
041007-10 / Vol. 134, APRIL 2012 Transactions of the ASME
Downloaded 31 Mar 2012 to 164.107.168.39. Redistribution subject to ASME license or copyright; see http://www.asme.org/terms/Terms_Use.cfm

[13] Epstein, D., Keer, L. M., Wang, Q. J., Cheng, H. S., and Zhu, D., 2003, “Effectof Surface Topography on Contact Fatigue in Mixed Lubrication,” Tribol.Trans., 46(4), pp. 506–513.
[14] Zhu, D., Ren, N., and Wang, Q. J., 2009, “Pitting Life Prediction Based on a3D Line Contact Mixed EHL Analysis and Subsurface von Mises Stress Calcu-lation,” ASME J. Tribol., 131(4), p. 041501.
[15] Li, S., and Kahraman, A., 2011, “A Fatigue Model for Contacts Under MixedElastohydrodynamic Lubrication Condition,” Int. J. Fatigue, 33(3), pp.427–436.
[16] Bluestein, J. M., 2008, “An Experimental Study of the Impact of Various ToothSurface Treatments on Spur Gear Pitting Life,” M.S. thesis, The Ohio StateUniversity, Columbus, OH.
[17] Klein, M., 2009, “An Experimental Investigation of the Engineered SurfaceTreatments on Gear Pitting Life,” M.S. thesis, The Ohio State University,Columbus, OH.
[18] Rahman, Z., Ohba, H., Yoshioka, T., and Yamamoto, T., 2009, “Incipient Dam-age Detection and Its Propagation Monitoring of Rolling Contact Fatigue byAcoustic Emission,” Tribol. Int., 42(6), pp. 807–815.
[19] Hoffmann, G., Hanejko, F. G., and Slattery, R. H., 2006, “Crack Initiation andPropagation in RCF, a New Approach to Understanding Pitting Failure ofHighly Loaded Gears,” SAE World Congress, Detroit.
[20] LDP, 2011, Gear Load Distribution Program, Gear and Power TransmissionResearch Laboratory, The Ohio State University, Columbus, OH.
[21] Conry, T. F., and Seireg, A., 1973, “A Mathematical Programming Techniquefor the Evaluation of Load Distribution and Optimal Modifications for GearSystems,” J. Eng. Ind., 95(11), pp. 1115–1122.
[22] Li, S., and Kahraman, A., 2010, “Prediction of Spur Gear Mechanical PowerLosses Using a Transient Elastohydrodynamic Lubrication Model,” Tribol.Trans., 53(4), pp. 554–563.
[23] Li, S., Vaidyanathan, A., Harianto, J., and Kahraman, A., 2009, “Influence ofDesign Parameters on Mechanical Power Losses of Helical Gear Pairs,” J. Adv.Mech. Des., Syst., Manuf., 3(2), pp. 146–158.
[24] Zhu, D., 2007, “On Some Aspects of Numerical Solutions of Thin-Film andMixed Elastohydrodynamic Lubrication,” J. Eng. Tribol., 221(5), pp. 561–579.
[25] Johnson, K. J., 1985, Contact Mechanics, Cambridge University Press, Cambridge.[26] Doolittle, A. K., 1951, “Studies in Newtonian Flow. II. The Dependence of the
Viscosity of Liquids on Free-Space,” J. Appl. Phys., 22(12), pp. 1471–1475.[27] Wu, S., and Cheng, H. S., 1991, “A Friction Model of Partial-EHL Contacts and
Its Application to Power Loss in Spur Gears,” Tribol. Trans., 34(3), pp. 398–407.[28] Matake, T., 1977, “An explanation of fatigue limit under combined stress,”
Bull. JSME, 20(141), pp. 257–263.[29] McDiarmid, D. L., 1991, “A General Criterion for High Cycle Multiaxial Fa-
tigue Failure,” Fatigue Fract. Eng. Mater. Struct., 14(4), pp. 429–453.[30] McDiarmid, D. L., 1994, “A Shear Stress Based Critical-Plane Criterion of
Multiaxial Fatigue Failure for Design and Life Prediction,” Fatigue Fract. Eng.Mater. Struct., 17(12), pp. 1475–1484.
[31] Susmel, L., and Lazzarin, P., 2002, “A Bi-Parametric Wohler Curve for HighCycle Multiaxial Fatigue Assessment,” Fatigue Fract. Eng. Mater. Struct.,25(1), pp. 63–78.
[32] Susmel, L., and Lazzarin, P., 2003, “A Stress-Based Method to Predict LifetimeUnder Multiaxial Fatigue Loadings,” Fatigue Fract. Eng. Mater. Struct., 26(12),pp. 1171–1187.
[33] Liu, Y., and Mahadevan, S., 2007, “A Unified Multiaxial Fatigue DamageModel for Isotropic and Anisotropic Materials,” Int. J. Fatigue, 29(2), pp.347–359.
[34] Blok, H., 1963, “Inverse Problems in Hydrodynamic Lubrication and DesignDirectives for Lubricated Flexible Surfaces,” Proceedings of the InternationalSymposium on Lubrication and Wear, University of Houston, TX.
Journal of Mechanical Design APRIL 2012, Vol. 134 / 041007-11
Downloaded 31 Mar 2012 to 164.107.168.39. Redistribution subject to ASME license or copyright; see http://www.asme.org/terms/Terms_Use.cfm