A Comparison Study of Offshore Wind Support Structures ... · A Comparison Study of Offshore Wind...
15
NREL is a national laboratory of the U.S. Department of Energy Office of Energy Efficiency & Renewable Energy Operated by the Alliance for Sustainable Energy, LLC This report is available at no cost from the National Renewable Energy Laboratory (NREL) at www.nrel.gov/publications. Contract No. DE-AC36-08GO28308 A Comparison Study of Offshore Wind Support Structures with Monopiles and Jackets for U.S. Waters Preprint Rick Damiani, Katherine Dykes, and George Scott National Renewable Energy Laboratory To be presented at “The Science of Making Torque from Wind” (TORQUE 2016) Munich, Germany October 5‒7, 2016 Conference Paper NREL/CP-5000-66099 August 2016
-
Upload
truongcong -
Category
Documents
-
view
243 -
download
0
Transcript of A Comparison Study of Offshore Wind Support Structures ... · A Comparison Study of Offshore Wind...
NREL is a national laboratory of the U.S. Department of Energy Office of Energy Efficiency & Renewable Energy Operated by the Alliance for Sustainable Energy, LLC
This report is available at no cost from the National Renewable Energy Laboratory (NREL) at www.nrel.gov/publications.
Contract No. DE-AC36-08GO28308
A Comparison Study of Offshore Wind Support Structures with Monopiles and Jackets for U.S. Waters Preprint Rick Damiani, Katherine Dykes, and George Scott National Renewable Energy Laboratory
To be presented at “The Science of Making Torque from Wind” (TORQUE 2016) Munich, Germany October 5‒7, 2016
Conference Paper NREL/CP-5000-66099 August 2016

NOTICE
The submitted manuscript has been offered by an employee of the Alliance for Sustainable Energy, LLC (Alliance), a contractor of the US Government under Contract No. DE-AC36-08GO28308. Accordingly, the US Government and Alliance retain a nonexclusive royalty-free license to publish or reproduce the published form of this contribution, or allow others to do so, for US Government purposes.
This report was prepared as an account of work sponsored by an agency of the United States government. Neither the United States government nor any agency thereof, nor any of their employees, makes any warranty, express or implied, or assumes any legal liability or responsibility for the accuracy, completeness, or usefulness of any information, apparatus, product, or process disclosed, or represents that its use would not infringe privately owned rights. Reference herein to any specific commercial product, process, or service by trade name, trademark, manufacturer, or otherwise does not necessarily constitute or imply its endorsement, recommendation, or favoring by the United States government or any agency thereof. The views and opinions of authors expressed herein do not necessarily state or reflect those of the United States government or any agency thereof.
This report is available at no cost from the National Renewable Energy Laboratory (NREL) at www.nrel.gov/publications.
Available electronically at SciTech Connect http:/www.osti.gov/scitech
Available for a processing fee to U.S. Department of Energy and its contractors, in paper, from:
U.S. Department of Energy Office of Scientific and Technical Information P.O. Box 62 Oak Ridge, TN 37831-0062 OSTI http://www.osti.gov Phone: 865.576.8401 Fax: 865.576.5728 Email: [email protected]
Available for sale to the public, in paper, from:
U.S. Department of Commerce National Technical Information Service 5301 Shawnee Road Alexandria, VA 22312 NTIS http://www.ntis.gov Phone: 800.553.6847 or 703.605.6000 Fax: 703.605.6900 Email: [email protected]
Cover Photos by Dennis Schroeder: (left to right) NREL 26173, NREL 18302, NREL 19758, NREL 29642, NREL 19795.
NREL prints on paper that contains recycled content.

A comparison study of offshore wind support
structures with monopiles and jackets for U.S. waters
R Damiani1, K Dykes1, G Scott1
1 NREL, 15013 Denver West Parkway, Golden, CO 80401, USA
E-mail: [email protected]
Abstract. U.S. experience in offshore wind is limited, and high costs are expected unlessinnovations are introduced in one or multiple aspects of the project, from the installed technologyto the balance of system (BOS). The substructure is the main single component responsible forthe BOS capital expenditure (CapEx) and thus one that, if improved, could yield significantlevelized cost of energy (LCOE) savings. For projects in U.S. waters, multimember, latticestructures (also known as jackets) can render required stiffness for transitional water depthsat potentially lower costs than monopiles (MPs). In this study, we used a systems engineeringapproach to evaluate the LCOE of prototypical wind power plants at six locations along theeastern seaboard and the Gulf of Mexico for both types of support structures. Using a referencewind turbine and actual metocean conditions for the selected sites, we calculated loads fora parked and an operational situation, and we optimized the MP- and jacket-based supportstructures to minimize their overall mass. Using a suite of cost models, we then computed theirassociated LCOE. For all water depths, the MP-based configurations were heavier than theirjacket counterparts, but the overall costs for the MPs were less than they were for jackets upto depths of slightly less than 30 m. When the associated manufacturing and installation costswere included, jackets resulted in lower LCOE for depths greater than 40 m. These results canbe used by U.S. stakeholders to understand the potential for different technologies at differentsites, but the methodology illustrated in this study can be further employed to analyze theeffects of innovations and design choices throughout wind power plant systems.
1. IntroductionOffshore wind power promises to deliver an essential contribution to a clean, robust, anddiversified U.S. energy portfolio [1]. However, the lack of domestic experience with offshorewind technology has contributed to considerable uncertainty in estimates of the potential costof domestic offshore wind energy, which remains high even in the most optimistic predictions.Significant cost drivers lie in the BOS activities. Experience in Europe has shown that costs areraised by project management inefficiencies, supply chain bottlenecks [2], as well as technologylimitations. Offshore wind turbines have largely used marinized land-based machines mountedon oil and gas (O&G) derived platforms. Innovations in turbine and support structure designhave the potential to streamline manufacturing and installation, and reduce material costs.According to [3], the substructure and foundation are responsible for 14% of the total offshorewind power plant LCOE, and the largest uncertainty in LCOE is attributable to its sensitivityto CapEx.
MPs and lattice structures (or jackets, a common term used for lattice substructures fromthe O&G industry experience) are among the most popular substructures for offshore wind.
This report is available at no cost from the National Renewable Energy Laboratory (NREL) at www.nrel.gov/publications.1

Ninety-one percent of the 2014 installations were MPs, whereas some 5% were jackets [4]. MPsare easy to fabricate and to install in shallow waters (≤ 20 m), but they require progressivelymore material tonnage to guarantee modal performance in deeper waters, where installationalso becomes more expensive. Lattice substructures can deliver needed structural stiffness byincreasing the substructures footprint and by concentrating mass away from the neutral axis,but this is at the expense of more laborious fabrication than that of the MPs.
In the United States, analyses have shown that economic wind development would occur overtransitional water depths (depths of 30–60 m and distances from shore of 5–50 nmi), where theestimated capacity potential for Class 4 wind and above exceeds 600 GW [5; 6]. Several studies,e.g., [7; 8], have shown that MPs are progressively unfeasible as projects are sited in deeperwaters and use larger turbine sizes (6 MW+). Yet, in Europe, new extra-large and extra-extra-large MPs are being proposed and deployed in more challenging sites (depths > 30 m) and forlarger turbines (ratings > 6 MW) [9].
Although the support structure plays an important role in defining the system’s reliabilityand performance characteristics, it also affects costs associated with the BOS as well as with theoperation and maintenance (O&M). The link between these costs and the main environmentaldesign drivers must be recognized and understood (see also [10]) for the industry to flourish in theUnited States and to avoid mistakes observed in past experience. Selecting the proper supportstructure is one of the most important questions to address for U.S. offshore wind development,and it is one that must be resolved in a multidisciplinary context that encompasses both thetechnical aspects of the structural design and the BOS aspects of logistics and installation costs.
In this study, we made use of an integrated modeling tool, the Wind-Plant IntegratedSystem Design & Engineering Model (WISDEM™) developed at the National Renewable EnergyLaboratory (NREL), to perform a system-level nonlinear optimization of wind power plants.Using an integrated model set with combined physics and cost modeling capabilities allows forthe direct exploration of trade-offs in the design of different subsystems. We compared LCOEestimates for prototypical wind power plants composed of 100 5-MW turbines sited along theEastern Seaboard and in the Gulf of Mexico. For each of the six sites, the analysis was conductedwith both an MP and with a typical four-legged jacket as substructure configuration. The hubheight was fixed throughout the sites, but the tower geometry was allowed to change dependingon the structural requirements and the varying deck heights, which were identified based onthe local wave crest conditions. Preliminary designs of the support structures were achieved viaJacketSE and TowerSE (design tools within WISDEM) driven by a gradient-based optimization,which had the objective to minimize the support structure mass.
For this analysis, several plant cost models were used for the nonturbine cost elements of theLCOE. The LCOE analysis showed that jackets become more economical than MPs at sites inwaters deeper than 45 m.
Section 2 presents the primary metocean conditions for the sites analyzed, whereas the detailsof the methods used and the results of the analysis are given in Section 3 and 4, respectively.Conclusions and areas of future work are presented in Section 5.
2. Metocean dataThe modeling tool required information on wind and wave conditions at each site to establishwave loading, deck height, and other parameters. Six sites were chosen to represent a range ofwater depths. Each site was at (or very near, as in the case of Site 6) the location of a NationalOceanic and Atmospheric Administration buoy to provide an accurate measure of the metoceanclimate at the site. Note that deck height was calculated for each location based on the waveconditions and supplied as an input to the support structure optimizations. The selected sitesare identified in Table 1 and Fig. 1. The key metocean parameters are given in Table. 2.
This report is available at no cost from the National Renewable Energy Laboratory (NREL) at www.nrel.gov/publications.2

Table 1. The six buoy sites analyzed(a).
Case Buoy ID Name Region Lon (deg) Lat (deg)1 41013 ‘FRYING PAN SHOALS’ ‘atl’ -77.743 33.4362 42035 ‘GALVESTON’ ‘gulf’ -94.413 29.2323 44025 ‘LONG ISLAND ‘atl’ -73.164 40.2514 41035 ‘ONSLOW BAY’ ‘atl’ -77.280 34.4765 44008 ‘SE NANTUCKET’ ‘atl’ -69.247 40.5026 42036 ‘W TAMPA’ ‘gulf’ -84.517 28.500
a From National Data Buoy Center (NDBC) http://www.ndbc.noaa.gov/ and U.S.Army Corps of Engineers Wave Information Studies (WIS) http://wis.usace.army.
mil/.
Figure 1. Locations of NDBC buoys.
2.1. Calculated parametersA few parameters had to be extrapolated or calculated from the buoy and WIS records, includingmaximum and breaking wave heights, surge height, and maximum wave crests at different returnperiods.
The height of a breaking wave at a site is calculated as 0.78 times the water depth.Significant wave heights (Hs50 and Hs100) with a return period of 50 and 100 yr are calculated byextrapolating from the largest wave events recorded at a site. If the breaking wave height at asite is lower than the extrapolated wave height, then the breaking wave height is used. Maximumwave heights (Hmx50 and Hmx100) are also estimated for each return period by multiplying therespective significant wave height by 1.86.
The deck heights of the substructures were calculated to clear the 1000-yr wave-crest heightsand accounting for a 1.5 m run-up. To determine the 1000-yr wave crests, highest astronomicaltide (HAT ), 1000-yr storm surge heights, and the 1000-yr maximum wave height had to beobtained. The 1000-yr wave heights and the HAT s were extrapolated from the maximum waveheights in the buoy records. Surge height is difficult to estimate at offshore sites. When datafrom nearby coastal water level measurement stations were available, the published extremevalue distribution was used to compute the extreme surge height. These values can be regardedas conservative (high) because coastal areas will usually have higher surge heights than openocean sites.
This report is available at no cost from the National Renewable Energy Laboratory (NREL) at www.nrel.gov/publications.3

We utilized [11] 1, which includes the shape and scale parameters of a Gumbell ExtremeValue distribution distribution to the data of each offshore station, to analyze two or threestations close to each of our proposed wind power plants. Through the R library evd [12], wecomputed the magnitudes of the 1000-yr surges.
These derived metocean parameters for the six sites are given in Table 2.
Table 2. Key metocean parameters for the six sites analyzed.
Case No.ws(a)
WaterDepth
Hs50(b) Hmx50
(b)Tmx50(c)HAT (d) δ1000
(d) Hmx1000(b) Deck
Heightm s−1 m m m sec m m m m
1 9.74 23.50 10.82 18.33 13.34 1.26 1.25 18.33 13.202 8.06 12.80 7.24 9.98 10.91 0.47 6.00 9.98 13.003 9.33 40.80 9.48 17.63 12.48 0.33 2.50 23.26 16.004 9.52 9.70 10.46 7.57 13.11 0.83 0.90 7.57 7.005 9.26 65.80 12.15 22.60 14.13 0.79 1.54 28.31 18.006 7.58 50.60 7.63 14.19 11.20 0.84 1.50 17.81 12.70
a Annual average wind speed adjusted to 90 meters above sea level (MASL) using shear exponent of0.12.b 50-yr significant wave height (Hs50), 50-yr maximum wave height (Hmx50), and 1000-yr maximumwave height (Hmx1000) are given as trough-to-peak differences in meters.c Peak wave spectral period (Tmx50) is in seconds.d Highest astronomical tide (HAT ), 1000-yr storm surge (δ1000) and deck height are given as MASL.
2.2. Wind dataWind data for this study was licensed from AWS Truepower, Inc. (AWS) and consisted ofgridded data at a resolution of 200 m, with separate shape files for annual, monthly, and diurnaldistributions of wind speed and wind direction. Original wind data was at 100 MASL, but itwas scaled downward slightly to adjust to 90 MASL.
3. Analysis methodThe analysis carried out in this study made use of various tools available within the WISDEMsoftware suite. WISDEM integrates a variety of models for the entire wind energy system,including turbine and plant equipment, O&M, energy production, and cost modeling [13]. Thetool set allows for trade-off studies and guides the design of components as well as the overallsystem toward a configuration that minimizes the LCOE through multidisciplinary optimization.The main submodules used in this study include RotorSE, DriveSE, TowerSE, JacketSE [14],PlantEnergySE, TurbineCostsSE, and PlantCostsSE. RotorSE, a module that can calculate loadson rotor blades, has been described in detail in [15]. DriveSE [16] can calculate reaction loadsat the interface with the tower, and together with RotorSE it was run a priori and produced theultimate limit state loads that were inputs to the support structure sizing tools, i.e., TowerSEand JacketSE. The latter two modules, which were at the core of the optimization, are describedin more detail in Section 3.1. PlantEnergySE, TurbineCostsSE, and PlantCostsSE are brieflydescribed in Sections 3.2 and 3.3.
1 The report is an analysis of data from 112 long-term stations from the National Water Level ObservationNetwork.
This report is available at no cost from the National Renewable Energy Laboratory (NREL) at www.nrel.gov/publications.4
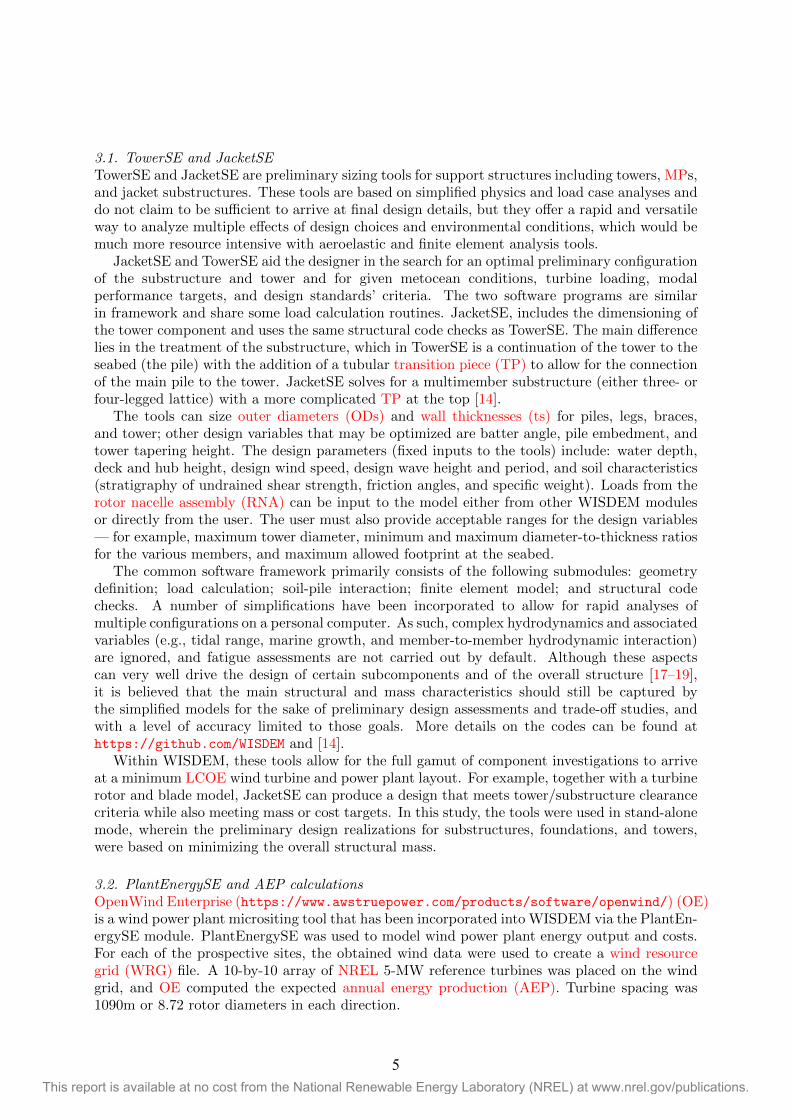
3.1. TowerSE and JacketSETowerSE and JacketSE are preliminary sizing tools for support structures including towers, MPs,and jacket substructures. These tools are based on simplified physics and load case analyses anddo not claim to be sufficient to arrive at final design details, but they offer a rapid and versatileway to analyze multiple effects of design choices and environmental conditions, which would bemuch more resource intensive with aeroelastic and finite element analysis tools.
JacketSE and TowerSE aid the designer in the search for an optimal preliminary configurationof the substructure and tower and for given metocean conditions, turbine loading, modalperformance targets, and design standards’ criteria. The two software programs are similarin framework and share some load calculation routines. JacketSE, includes the dimensioning ofthe tower component and uses the same structural code checks as TowerSE. The main differencelies in the treatment of the substructure, which in TowerSE is a continuation of the tower to theseabed (the pile) with the addition of a tubular transition piece (TP) to allow for the connectionof the main pile to the tower. JacketSE solves for a multimember substructure (either three- orfour-legged lattice) with a more complicated TP at the top [14].
The tools can size outer diameters (ODs) and wall thicknesses (ts) for piles, legs, braces,and tower; other design variables that may be optimized are batter angle, pile embedment, andtower tapering height. The design parameters (fixed inputs to the tools) include: water depth,deck and hub height, design wind speed, design wave height and period, and soil characteristics(stratigraphy of undrained shear strength, friction angles, and specific weight). Loads from therotor nacelle assembly (RNA) can be input to the model either from other WISDEM modulesor directly from the user. The user must also provide acceptable ranges for the design variables— for example, maximum tower diameter, minimum and maximum diameter-to-thickness ratiosfor the various members, and maximum allowed footprint at the seabed.
The common software framework primarily consists of the following submodules: geometrydefinition; load calculation; soil-pile interaction; finite element model; and structural codechecks. A number of simplifications have been incorporated to allow for rapid analyses ofmultiple configurations on a personal computer. As such, complex hydrodynamics and associatedvariables (e.g., tidal range, marine growth, and member-to-member hydrodynamic interaction)are ignored, and fatigue assessments are not carried out by default. Although these aspectscan very well drive the design of certain subcomponents and of the overall structure [17–19],it is believed that the main structural and mass characteristics should still be captured bythe simplified models for the sake of preliminary design assessments and trade-off studies, andwith a level of accuracy limited to those goals. More details on the codes can be found athttps://github.com/WISDEM and [14].
Within WISDEM, these tools allow for the full gamut of component investigations to arriveat a minimum LCOE wind turbine and power plant layout. For example, together with a turbinerotor and blade model, JacketSE can produce a design that meets tower/substructure clearancecriteria while also meeting mass or cost targets. In this study, the tools were used in stand-alonemode, wherein the preliminary design realizations for substructures, foundations, and towers,were based on minimizing the overall structural mass.
3.2. PlantEnergySE and AEP calculationsOpenWind Enterprise (https://www.awstruepower.com/products/software/openwind/) (OE)is a wind power plant micrositing tool that has been incorporated into WISDEM via the PlantEn-ergySE module. PlantEnergySE was used to model wind power plant energy output and costs.For each of the prospective sites, the obtained wind data were used to create a wind resourcegrid (WRG) file. A 10-by-10 array of NREL 5-MW reference turbines was placed on the windgrid, and OE computed the expected annual energy production (AEP). Turbine spacing was1090m or 8.72 rotor diameters in each direction.
This report is available at no cost from the National Renewable Energy Laboratory (NREL) at www.nrel.gov/publications.5
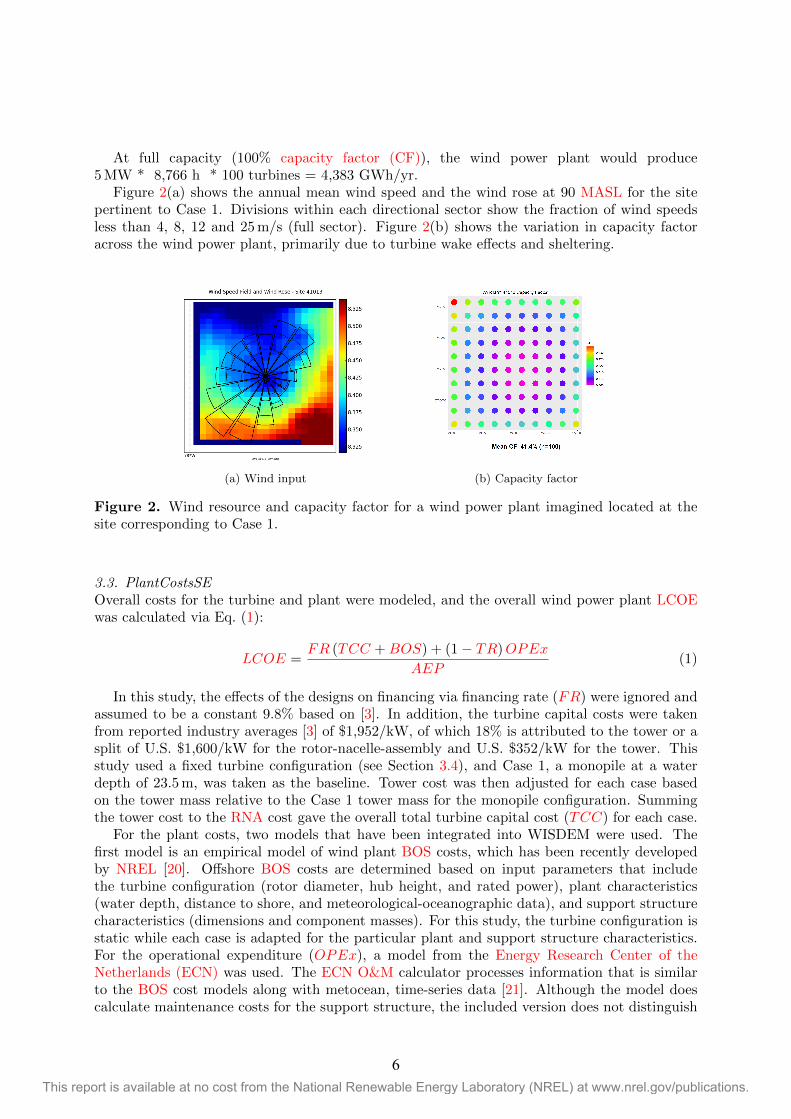
At full capacity (100% capacity factor (CF)), the wind power plant would produce5 MW * 8,766 h * 100 turbines = 4,383 GWh/yr.
Figure 2(a) shows the annual mean wind speed and the wind rose at 90 MASL for the sitepertinent to Case 1. Divisions within each directional sector show the fraction of wind speedsless than 4, 8, 12 and 25 m/s (full sector). Figure 2(b) shows the variation in capacity factoracross the wind power plant, primarily due to turbine wake effects and sheltering.
(a) Wind input (b) Capacity factor
Figure 2. Wind resource and capacity factor for a wind power plant imagined located at thesite corresponding to Case 1.
3.3. PlantCostsSEOverall costs for the turbine and plant were modeled, and the overall wind power plant LCOEwas calculated via Eq. (1):
LCOE =FR (TCC +BOS) + (1 − TR)OPEx
AEP(1)
In this study, the effects of the designs on financing via financing rate (FR) were ignored andassumed to be a constant 9.8% based on [3]. In addition, the turbine capital costs were takenfrom reported industry averages [3] of $1,952/kW, of which 18% is attributed to the tower or asplit of U.S. $1,600/kW for the rotor-nacelle-assembly and U.S. $352/kW for the tower. Thisstudy used a fixed turbine configuration (see Section 3.4), and Case 1, a monopile at a waterdepth of 23.5 m, was taken as the baseline. Tower cost was then adjusted for each case basedon the tower mass relative to the Case 1 tower mass for the monopile configuration. Summingthe tower cost to the RNA cost gave the overall total turbine capital cost (TCC) for each case.
For the plant costs, two models that have been integrated into WISDEM were used. Thefirst model is an empirical model of wind plant BOS costs, which has been recently developedby NREL [20]. Offshore BOS costs are determined based on input parameters that includethe turbine configuration (rotor diameter, hub height, and rated power), plant characteristics(water depth, distance to shore, and meteorological-oceanographic data), and support structurecharacteristics (dimensions and component masses). For this study, the turbine configuration isstatic while each case is adapted for the particular plant and support structure characteristics.For the operational expenditure (OPEx), a model from the Energy Research Center of theNetherlands (ECN) was used. The ECN O&M calculator processes information that is similarto the BOS cost models along with metocean, time-series data [21]. Although the model doescalculate maintenance costs for the support structure, the included version does not distinguish
This report is available at no cost from the National Renewable Energy Laboratory (NREL) at www.nrel.gov/publications.6

Table 3. Baseline turbine parameters.
Parameter Value UnitRating 5 MW
Rotor diameter 125 mHub height 90 mRNA mass 350 t
Unfactored peak thrust (DLC1/DLC2) 1.28e3/188 kNUnfactored moment (DLC1/DLC2) 8.96e2/1.31e2 kN m
Nominal wind speed at max thrust (DLC1/DLC2) 30/70 m s−1
Target system first eigenfrequency 0.26 Hz
between support structure types, so the operational expenditures depend only on the case siteand not on the substructure type. The setup for the model was based on a study of integratedinstallation and O&M [22]. The full set of plant costs for each case was then incorporated in thecost of energy equation, Eq. (1), to compare the impact of different support structures designsat different types of wind power plant sites with varied water depths.
3.4. Case study assumptionsThe reference turbine used for this study was the NREL 5-MW turbine [23] with main parametersgiven in Table 3. The target first natural frequencies, based on a soft-stiff design approach [24],represent the modal performance requested for the various system layouts. Table 2 shows therange of main environmental parameters that were considered; for simplicity, soil characteristicswere fixed throughout the various cases at an average stiffness soil profile (friction angles ≥35 deg).
Because of the simplifications in the physics of the used software programs, and because of thelimited number of load cases considered, additional conservatism was provided by the employeddrag (cd) and added mass (cm) coefficients, the choice of a worst-case loading scenario, andadditional safety factors. Based on verification runs with other codes [14], the substructure cdand cm values were doubled with respect to those recommended by [25]; and for the tower, thewind cd was set at 2 to account for transition piece drag; further, wave loads calculated onthe main jacket legs were multiplied by a factor of 4 to account for hydrodynamics effects onsecondary members of the substructure otherwise ignored.
Two characteristic load cases were investigated. One, similar to the InternationalElectrotechnical Commission (IEC) DLC 1.6 [26], assumes maximum turbine rotor thrust andmaximum wave load aligned along the base of the structure. The other load case, similar to theIEC DLC 6.1 [26], assumes the machine idling during an extreme (50-yr) wind and wave event.The loads from the RNA were precalculated by RotorSE and DriveSE as was stated earlier.
Both TowerSE and JacketSE were run in stand-alone mode to obtain minimum overallmass configurations of support structures based on MPs and jacket substructures, respectively,including the mass of the tower, four-legged jacket, transition piece, and pile(s).
3.5. Optimizer parametersThe optimization made use of Sparse NOnlinear OPTimizer (SNOPT), a gradient-based, sparsesequential quadratic programming method as implemented in Python [27]. The final accuracyin the optimization and the feasibility tolerance were set at 10−3. For each support structuretype, the design variables and constraints are listed in Tables 4 and 5. Constraint functions werebased on structural integrity and manufacturability criteria (see also [14]).
This report is available at no cost from the National Renewable Energy Laboratory (NREL) at www.nrel.gov/publications.7

Table 4. Design variables and constraints for the monopile optimizations.
Description # of Variables/Constraints
Tower and monopile ODs 3
Tower, TP, and MP ts 4
Utilization against shell and global buckling 68
Utilization against strength 34
Utilization against fatigue 34
Eigenfrequency lower limit 1
Tower taper ratio (manufacturability) 1
Diameter-to-thickness ratio (manufacturability) 7
4. ResultsThe overall support structure mass as computed by the optimizer is given in Table 6, where thecomparison between MP and jacket includes the steel of the piles.
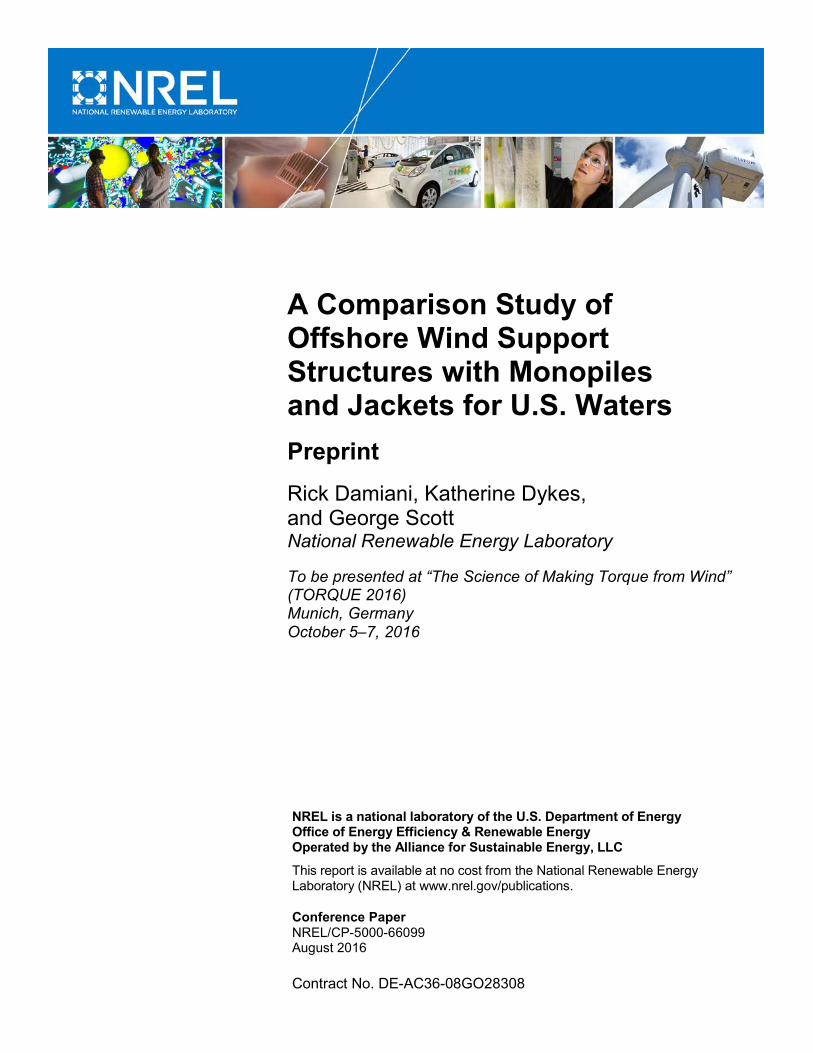
The first key finding is that the mass of monopile-tower combination is greater than thejacket-tower combination for all cases. For the MP in all cases, the frequency constraint provedto be the binding constraint and pushed the structure to a more massive configuration withdiameters and thicknesses above the lower bounds of their respective, allotted ranges (withthe exception of tower-top thickness). At low water depths, overall structural mass is similaramong jackets and MPs, but for the deepest site, the support structure mass when using theMPs is nearly double that computed for jacket-based systems. A verification step showed goodagreement between the optimization results and industry trends data for the MPs [28] (thoughthere is mass underprediction for the TP), as shown in Figure 3. In general, we expect theMP mass to increase significantly with water depth; it is this increase in mass, along with theassociated difficulties in the installation, that cause a decrease in the attractiveness for the MPswhen moving to deeper water sites.
For the jacket substructure, the comparison to industry trends data [28] shows less agreementthan for the MP (see Figure 4). Very few data points are available for jackets from the industry(four points on the graph), and it is striking that the data associated with the shallowest site(at a water depth less than 10 m) indicate a mass comparable to that at a site three times asdeep. It is speculated that factors other than normal reliability sizing contributed to a largerthan normal mass for the project in shallow water. Further, the industry data points at ∼25 mare for 6-MW turbine installations, which are expected to be associated with higher loads thanthose from a 5-MW turbine as assumed in this study. If these data points are scaled by theratio of the power ratings, they would align closer to the calculated jacket mass trend. Thetrend in the piles’ mass might be affected by the same considerations, and, in addition, actualsoil conditions might have promoted the use of larger piles than those calculated in this studyfor a generic soil.
Although the mass of the monopile-tower support structure is greater than the jacket-towersupport structure for all cases, the overall cost impact on LCOE of the support structures resultsin the monopile being economically more favorable than the jacket for water depths up to 40 m.Summaries of the calculated costs are given in Table 7 and Table 8 for the MP- and jacket-basedwind power plants, respectively.
This report is available at no cost from the National Renewable Energy Laboratory (NREL) at www.nrel.gov/publications.8
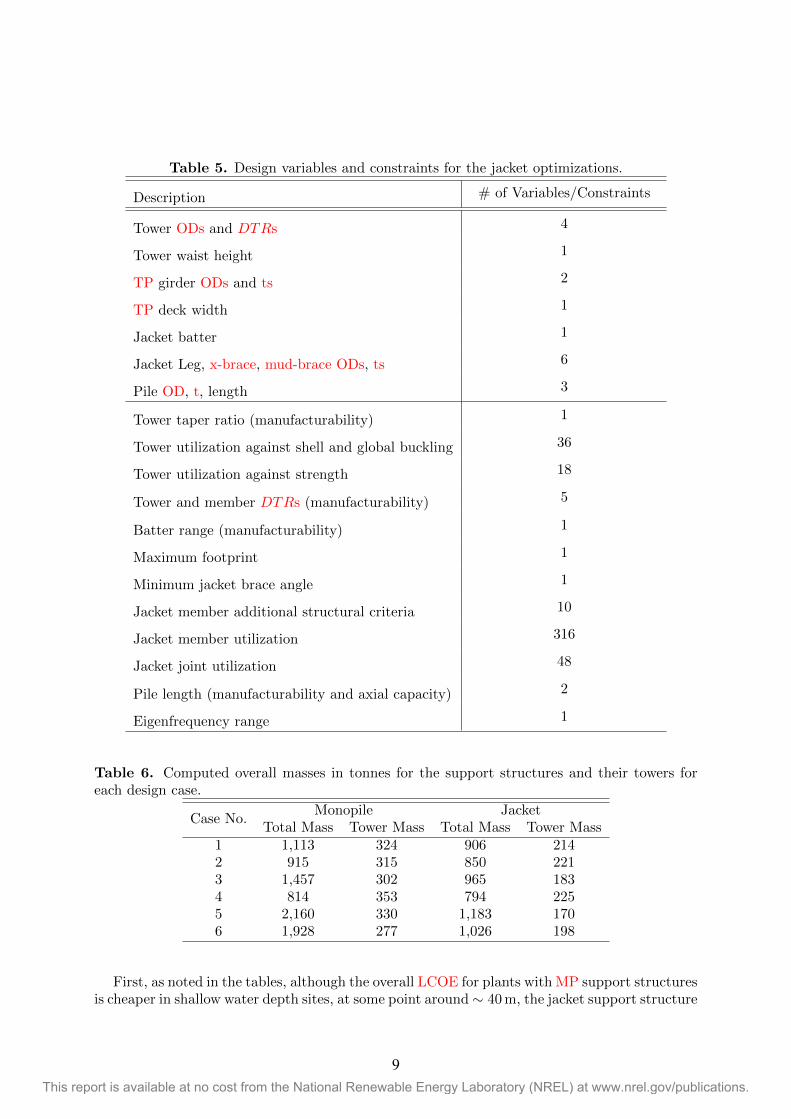
Table 5. Design variables and constraints for the jacket optimizations.
Description # of Variables/Constraints
Tower ODs and DTRs 4
Tower waist height 1
TP girder ODs and ts 2
TP deck width 1
Jacket batter 1
Jacket Leg, x-brace, mud-brace ODs, ts 6
Pile OD, t, length 3
Tower taper ratio (manufacturability) 1
Tower utilization against shell and global buckling 36
Tower utilization against strength 18
Tower and member DTRs (manufacturability) 5
Batter range (manufacturability) 1
Maximum footprint 1
Minimum jacket brace angle 1
Jacket member additional structural criteria 10
Jacket member utilization 316
Jacket joint utilization 48
Pile length (manufacturability and axial capacity) 2
Eigenfrequency range 1
Table 6. Computed overall masses in tonnes for the support structures and their towers foreach design case.
Case No.Monopile Jacket
Total Mass Tower Mass Total Mass Tower Mass1 1,113 324 906 2142 915 315 850 2213 1,457 302 965 1834 814 353 794 2255 2,160 330 1,183 1706 1,928 277 1,026 198
First, as noted in the tables, although the overall LCOE for plants with MP support structuresis cheaper in shallow water depth sites, at some point around ∼ 40 m, the jacket support structure
This report is available at no cost from the National Renewable Energy Laboratory (NREL) at www.nrel.gov/publications.9

Figure 3. Comparison of optimization results for monopile and transition piece masses withindustry data trends.
Figure 4. Comparison of optimization results for jacket and pile masses with industry datatrends.
becomes the more cost-effective approach. For each case analyzed, Fig. 5 shows the structureBOS difference and the overall LCOE difference when using the MP compared to the jacketsupport structures. Fig. 5a shows that the crossover point from the calculated, linearized trendsin BOS costs occurs around a water depth of ∼35 m. Although MPs are much simpler tomanufacture, as they become larger for deeper waters, the overall material costs overtake themanufacturing costs, and the overall MP BOS costs become greater than those for the jackets.However, the costs for MP installation and assembly are still cheaper than those of the jacketcounterparts up to water depths of ∼ 50 m. Beyond this depth, the extremely heavy MP wouldrequire a different type of vessel for transportation and installation, which is reflected in a stepchange in BOS cost. For this reason, and as shown in Fig. 5b, around ∼ 45 m, the jackets
This report is available at no cost from the National Renewable Energy Laboratory (NREL) at www.nrel.gov/publications.10

Table 7. Computed AEP and costs for the various cases with MP support structures.
Case No.AEP TCC BOS O&M LCOEGWh $M $B $M $/MWh
1 1,815.65 976 2.21 70.28 195.12 1,544.88 971 1.71 65.70 195.83 2,071.86 964 2.07 70.51 163.94 1,638.29 992 1.37 67.24 166.95 2,240.18 979 3.48 74.31 215.06 1,214.24 950 2.89 65.70 342.4
Table 8. Computed AEP and costs for the various cases with jacket support structures.
Case No.AEP TCC BOS O&M LCOEGWh $M $B $M $/MWh
1 1,815.65 916 2.44 70.3 204.62 1,544.88 920 1.90 65.7 204.63 2,071.86 900 2.18 70.5 166.04 1,638.29 922 1.59 67.2 175.25 2,240.18 892 3.50 74.3 212.16 1,214.24 908 2.81 65.7 332.3
become the cheaper option with respect to plant cost impacts and overall LCOE.
(a) Comparison of MP to jacket support structurecost
(b) Support structure influence on plant costs and LCOE
Figure 5. BOS costs (a) and LCOE difference (b) of the MP- and jacket-based supportstructures as a function of water depth.
5. ConclusionsWe proposed a case study to assess the economical applicability of MP and jackets assubstructure layouts for typical sites along the U.S. Eastern Seaboard and Gulf of Mexico. Weused tools available within WISDEM combined with a gradient-based optimizer. One-hundred-turbine, 500-MW wind power plants were envisioned at six sites, where metocean conditionswere collected from reliable buoy data and numerical reanalysis. Results showed that the MP
This report is available at no cost from the National Renewable Energy Laboratory (NREL) at www.nrel.gov/publications.11

is preferable to jackets up to water depths of approximately 40 m. The first U.S. offshore windpower plant, which will use 6-MW turbines, is being built with jacket substructures, althoughwater depth is lower than 40 m. This emphasizes the fact that other factors may have played abigger role than pure economics in that case, such as the unavailability of large MP constructionand installation entities in New England. Nevertheless, the methods proposed in this studycan be used by U.S. stakeholders to evaluate various aspects of the project and their effects onthe LCOE, including metocean conditions, turbine characteristics, and technology innovations.Future work will account for other DLCs and a full dynamic analysis of the turbine system,which will include the effect of fatigue loading and lead to more accurate estimates of the costs.
AcknowledgmentsThis work was supported by the U.S. Department of Energy (DOE) under Contract No. DE-AC36-08GO28308 with the National Renewable Energy Laboratory (NREL). Funding for thework was provided by the DOE Office of Energy Efficiency and Renewable Energy, Wind andWater Power Technologies Office. We acknowledge the insight and feedback on this paper byAaron Smith and Ben Maples of NREL.
References[1] Musial W and Ram B 2010 Large-scale offhore wind power in the United States –
Assessment of opportunities and barriers Tech. Rep. NREL/TP-500-40745 NREL Golden,CO
[2] BVG Associates 2012 Offshore wind cost reduction pathways technology work streamTechnical report The Crown Estate
[3] Mone C, Smith A, Maples B and Hand M 2015 Cost of wind energy review Technical ReportTP-5000-63267 NREL Golden, CO
[4] EWEA 2015 The European offshore wind industry—key trends and statistics 2014 Tech.rep. European Wind Energy Association
[5] Elliott D, Schwartz M, Haymes S, Heimiller D and Musial W 2011 Assessment of offshorewind energy potential in the United States National Renewable Energy Laboratory PosterPO-7A20-51332 NREL Golden, CO
[6] Musial W and Butterfield S 2005 Deepwater offshore wind technology research requirementsWindPower 2005 (Denver, CO: AWEA)
[7] Musial W D, Butterfield S and Ram B 2006 Energy from offshore wind Offshore TechnologyConference (Houston, TX)
[8] De Vries et al 2011 Final report WP4.2: Support structure concepts for deep water sitesTechnical Report UpWind WP4 D4.2.8 Final Report project Upwind Contract No. 019945(SES6)
[9] A2SEA 2013 A2SEA News 6–9 Winter Edition
[10] Damiani R, Ning A, Maples B, Smith A and Dykes K 2016 Wind Energy In review
[11] Zervas C 2013 Extreme water levels of the United States 1893-2010 Tech. Rep. NOSCO-OPS 067 National Oceanic and Atmospheric Administration Silver Spring, MD URLhttp://tidesandcurrents.noaa.gov/publications/NOAA_Technical_Report_NOS_
COOPS_067a.pdf
[12] Stephenson A G 2002 R News 2 31–32 URL http://cran.r-project.org/doc/Rnews/
Rnews_2002-2.pdf
[13] Dykes K, Meadows R, Felker F, Graf P, Hand M, Lunacek M, Michalakes J, Moriarty P,Musial W and Veers P 2011 Applications of systems engineering to the research, design,
This report is available at no cost from the National Renewable Energy Laboratory (NREL) at www.nrel.gov/publications.12
and development of wind energy systems Technical Report NREL/TP-5000-52616 NRELGolden, Colorado
[14] Damiani R 2016 JacketSE—an offshore wind turbine jacket sizing tool—theory manualTechnical Report NREL/TP-5000-65417 NREL Golden, CO
[15] Ning A, Damiani R and Moriarty P 2013 Objectives and constraints for wind turbineoptimization 51st AIAA Aerospace Sciences Meeting and 31st ASME Wind EnergySymposium (Houston, TX: AIAA)
[16] Guo Y, Parsons T, King R, Dykes K and Veers P 2015 An analytical formulation for sizingand estimating the dimensions and weight of wind turbine hub and drivetrain componentsTechnical Report NREL/TP-5000-63008 NREL Golden, CO
[17] Cordle A, McCann G and de Vries W 2011 Design drivers for offshore wind turbine jacketsupport structures ASME 2011 30th International Conference on Ocean, Offshore andArctic Engineering—OMAE2011 (Rotterdam, The Netherlands: ASME) pp 419–428
[18] Zwick D, Schafhirt S, Brommundt M, Muskulus M, Narasimhan S, Mechineau J andHaugsen P 2014 J. of Physics: Conference Series 555
[19] Molde H, Zwick D and Muskulus M 2014 J. of Physics: Conference Series 555
[20] Maness M, Maples B, Mone C and Stehly T 2016 The NREL offshore wind balance-of-system model: Modeling and analysis techniques Tech. Rep. TP-5000-xxxx NREL Golden,CO (forthcoming)
[21] ECN 2007 Accurate estimaton of maintenance costs of offshore wind farms with ECNsoftware tool Energy Center of the Netherlands URL https://www.ecn.nl/news/item/
accurate-estimation-of-maintenance-costs-offshore-wind-farms-with-ecn-
software-tool/
[22] Maples B, Saur G, Hand M, van de Pietermen R and Obdam T 2013 Installation, operation,and maintenance strategies to reduce the cost of offshore wind energy Technical Report TP-5000-57403 NREL Golden CO
[23] Jonkman J, Butterfield S, Musial W and Scott G 2015 Definition of a 5-MW reference windturbine for offshore system development Tech. Rep. NREL/TP-500-38060 NREL Golden,CO
[24] Damiani R and Song H 2013 A jacket sizing tool for offshore wind turbines within thesystems engineering initiative Offshore Technology Conference (Houston, Texas, USA:Offshore Technology Conference)
[25] API 2014 Planning, designing and constructing fixed offshore platforms - working stressdesign API Recommended Practice 2A-WSD
[26] IEC 2009 61400-3 wind turbines—part 3: Design requirements for offshore wind turbines
[27] Gill P E, Murray W and Saunders M A 2005 SIAM REVIEW 47 99–131
[28] NREL Offshore wind project database internal, unpublished
This report is available at no cost from the National Renewable Energy Laboratory (NREL) at www.nrel.gov/publications.13