A big opportunity - PwC · At the end of 2015, both UniCredit and Intesa Sanpaolo showed a...
24
The Italian Unlikely to Pay Market A big opportunity www.pwc.com/it
Transcript of A big opportunity - PwC · At the end of 2015, both UniCredit and Intesa Sanpaolo showed a...

The Italian Unlikely to Pay MarketA big opportunity
www.pwc.com/it


Pier Paolo MasenzaPartnerM: +39 348 [email protected]
Stefano SenatoreSenior ManagerM: +39 346 0690033 [email protected]
Contributors
Napoleone Del Gallo Di Roccagiovine
Contacts

4 | The Italian Unlikely to Pay market | A big opportunity
Contents
The Italian Non Performing Exposure market 05
The Unlikely to Pay segment 07
1 Unlikely to Pay distribution among 20 banks 08
2 Unlikely to Pay infl ows and outfl ows from 2013 to 2015 - Top 20 Italian banks 10
3 Unlikely to Pay coverage ratio - Top 20 Italian banks 17
4 Our view 18
5 Non Performing Exposures classifi cations 19
6 Outfl ows - Top 20 Italian banks 20

PwC | 5
The Italian Non Performing Exposure market

6 | The Italian Unlikely to Pay market | A big opportunity
Asset Quality
The Italian banking market continues to experience challenges surrounding asset quality with NPE at €331bn at the end of Jun 2016.
After reaching its peak at the end of 2015 at €341bn (Cagr 2008-2015 @22%), the Italian NPE recorded a 3.1% decrease in 1H2016.
The UTP, 37% of total NPE in 1H16, experienced a decreasing trend starting from 2015 and such trend is confirmed in 1H2016. The declining trend of UTP is driven by lower inflows from performing and past due.
Starting from 2018, we expect that a higher portion of performing loans might be at risk to be reclassifi ed as under-performing following the introduction of a different valuation approach (from “ex post” to “forward looking”).
The transition to IFRS 9 (from IAS 39) will be critical as banks will be required to accrue provisions based on expected losses and not only upon the occurrence of specifi c events (e.g. “impairment tests”). Banks will be asked to adopt a “forward looking” approach and as such to anticipate losses at the fi rst signals of deterioration. As a result, specifi c instruments as well as right structure and skilled people to proactively monitor borrowers’ performances will be required.
4259
78107
125156
184200 197
33
57
66
74
91
109
131127 123
9
16
12
13
21
18
1214
10
2008 2009 2010 2011 2012 2013 2014 2015 H1-2016
Bad Loans (€ bn) Unlikely to Pay (€bn) Past Due (€bn)
331341
326
283
237
194
157
132
85
PwC | 7
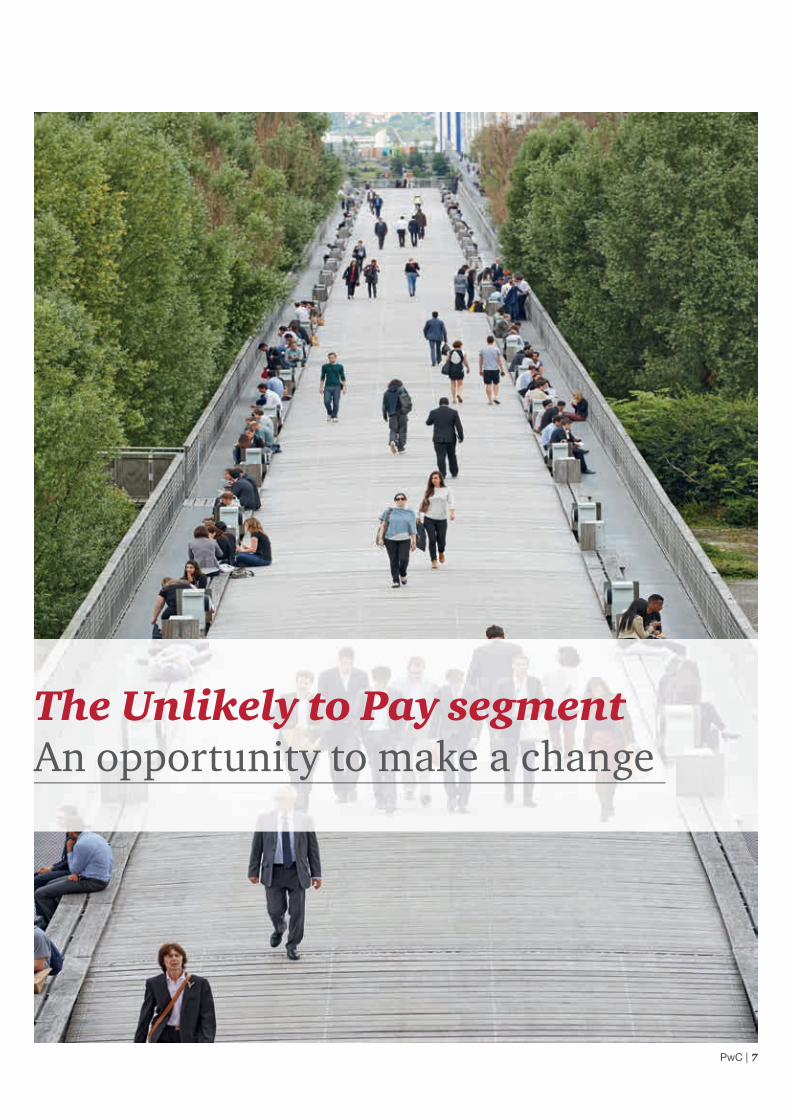
The Unlikely to Pay segmentAn opportunity to make a change
8 | The Italian Unlikely to Pay market | A big opportunity
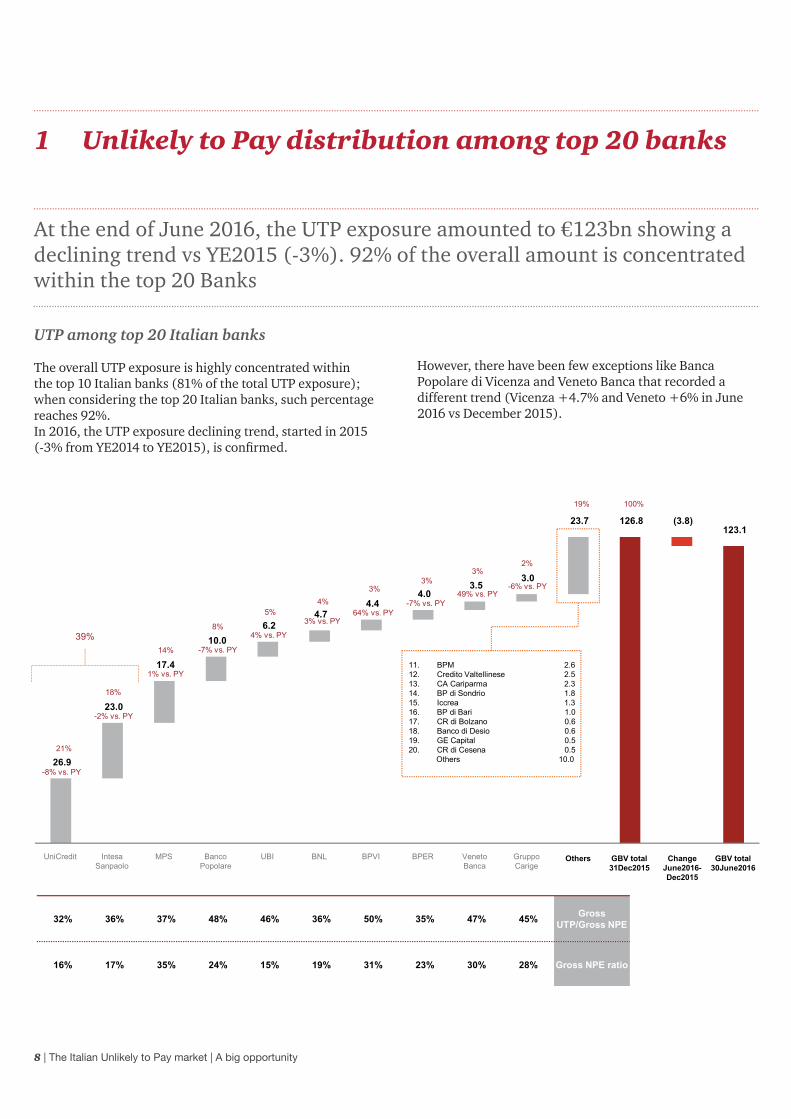
1 Unlikely to Pay distribution among top 20 banks
At the end of June 2016, the UTP exposure amounted to €123bn showing a declining trend vs YE2015 (-3%). 92% of the overall amount is concentrated within the top 20 Banks
UTP among top 20 Italian banks
The overall UTP exposure is highly concentrated within the top 10 Italian banks (81% of the total UTP exposure); when considering the top 20 Italian banks, such percentage reaches 92%. In 2016, the UTP exposure declining trend, started in 2015 (-3% from YE2014 to YE2015), is confi rmed.
However, there have been few exceptions like Banca Popolare di Vicenza and Veneto Banca that recorded a different trend (Vicenza +4.7% and Veneto +6% in June 2016 vs December 2015).
32% 36% 37% 48% 46% 36% 50% 35% 47% 45% Gross UTP/Gross NPE
16% 17% 35% 24% 15% 19% 31% 23% 30% 28% Gross NPE ratio
26.9
23.0
17.4
10.0 6.2
4.7 4.4
4.0 3.5
3.0
23.7 126.8 (3.8)123.1
GRUPPOUNICREDIT
GRUPPOBANCARIO
INTESASANPAOLO
GRUPPO MONTEDEI PASCHI DI
SIENA
GRUPPO BANCOPOPOLARE
GRUPPOUNIONE DIBANCHEITALIANE
GRUPPOBANCARIO
BANCANAZIONALE DEL
LAVORO
GRUPPOBANCARIO
BANCAPOPOLARE DI
VICENZA
GRUPPO BANCAPOPOLAREDELL'EMILIAROMAGNA
GRUPPOBANCARIO
VENETO BANCA
GRUPPOCARIGE
Other Total 2015 var 06.2016-2015 Totale 06.2016Others GBV total
31Dec2015GBV total
30June2016Change
June2016-Dec2015
UniCredit MPS Banco Popolare
UBI BNL BPVI BPER Veneto Banca
GruppoCarige
Intesa Sanpaolo
-8% vs. PY
21%
18%
-2% vs. PY
14%
1% vs. PY
8%
-7% vs. PY
5%
4% vs. PY
4%
3% vs. PY
3%
64% vs. PY
3%
-7% vs. PY
3%
49% vs. PY
2%
-6% vs. PY
19% 100%
11. BPM 2.612. Credito Valtellinese 2.513. CA Cariparma 2.314. BP di Sondrio 1.815. Iccrea 1.316. BP di Bari 1.017. CR di Bolzano 0.618. Banco di Desio 0.619. GE Capital 0.520. CR di Cesena 0.5
Others 10.0
39%

PwC | 9

10 | The Italian Unlikely to Pay market | A big opportunity
2 Unlikely to Pay infl ows and outfl ows from 2013 to 2015 – Top 20 Italian banks
In 2015, about 56% of the UTP remained UTP while 22% turned to bad loans with the remainder either collected or back to performing
Outfl ows and Infl ows
In 2015, total outfl ows of the top 20 Italian banks decreased from €60.9bn to €50.8bn primarily driven by lower outfl ows to bad loans (33% in 2014 vs. 22% in 2015).
2015 infl ows decreased by €22m driven by lower infl ow from performing exposures (36% in 2014 vs. 22% in 2015)
as well as by lower infl ows from non performing (23% in 2014 vs. 13% in 2015).
UTP remained UTP during 2015 amounted to €65bn i.e. 56%. As highlighted below, in 2014, such percentage was signifi cantly lower.
(1) Calculated as sum of “incagli” (including “incagli oggettivi”) and restructured exposures(2) €3.3bn reconciliation gap due to change in defi nitions
(6%)
(12%)
(33%)(6%)
36%
23%
11%
(5%)
(13%)
(22%)(3%)
22%
13%
10%
Exposure31Dec13
Toperforming
Collected To badloans
Others Fromperforming
From nonperforming
Otherinflows
Exposure31Dec14
Toperforming
Collected To badloans
Others Fromperforming
From nonperforming
Otherinflows
Exposure31Dec15(1)
(60.9)
74.1
(50.8)51.7
OutflowsOutflows
InflowsInflows
(2)
Rem
ain
UTP
Rem
ain
UTP
105.9
119.1 116.8
56%
43%

PwC | 11
Outflows and inflows | Unicredit
Outflows and inflows | Intesa Sanpaolo
29.1
(5%)
(20%)
(27%)
(7%)
18%
16%
17% 26.9
Exposure 31Dec14 To performing Collected To bad loans Others From performing From nonperforming
Other inflows Exposure 31Dec15
(17.3)Outflows
15.0Inflows
Rem
ain
UTP
Rem
ain
UTP
23.4
(7%)
(10%)
(22%)(4%)
17%
16% 7%
23.0
Exposure 31Dec14 To performing Collected To bad loans Others From performing From nonperforming
Other inflows Exposure 31Dec15
(10.0)Outflows
9.5Inflows
Rem
ain
UTP
Rem
ain
UTP

12 | The Italian Unlikely to Pay market | A big opportunity
Outflows and inflows | MPS
Outflows and inflows | Banco Popolare
17.2
(5%)
(7%)
(21%) (2%)
19%
10%
7% 17.4
Exposure 31Dec14 To performing Collected To bad loans Others From performing From nonperforming
Other inflows Exposure 31Dec15
(6.0)Outflows
6.2Inflows
10.8
(7%)
(11%)
(15%) (2%)
17% 2%
8% 10.0
Exposure 31Dec14 To performing Collected To bad loans Others From performing From nonperforming
Other inflows Exposure 31Dec15
(3.7)Outflows
2.9Inflows

PwC | 13
Outflows and inflows | UBI
Outflows and inflows | BNL
5.9
(3%)
(10%)
(21%)(4%)
24%
13% 6%
6.2
Exposure 31Dec14 To performing Collected To bad loans Others From performing From nonperforming
Other inflows Exposure 31Dec15
(2.3)Outflows
2.6Inflows
Rem
ain
UTP
4.5
(4%)(5%)
(34%) (2%)
26%
20% 2% 4.7
Exposure 31Dec14 To performing Collected To bad loans Others From performing From nonperforming
Other inflows Exposure 31Dec15
(2.0)Outflows
2.2Inflows

14 | The Italian Unlikely to Pay market | A big opportunity
Outflows and inflows | Banca Popolare di Vicenza
Outflows and inflows | BPER
2.7
(1%)(7%)
(32%) (1%)
85%
18% 2% 4.4
Exposure 31Dec14 To performing Collected To bad loans Others From performing From nonperforming
Other inflows Exposure 31Dec15
(1.1)Outflows
2.8Inflows
4.3
(6%)
(25%)
(19%) (1%)
27% 3%
13% 4.0
Exposure 31Dec14 To performing Collected To bad loans Others From performing From nonperforming
Other inflows Exposure 31Dec15
(2.1)Outflows 1.8
Inflows

PwC | 15
Outflows and inflows | Veneto Banca
Outflows and inflows | Carige
2.4
(3%)(9%)
(13%) (3%)
68% 10%
3.5
Exposure 31Dec14 To performing Collected To bad loans Others From performing From nonperforming
Other inflows Exposure 31Dec15
(0.7)Outflows
1.8Inflows
3.2
(4%)
(11%)
(12%) (3%)
12% 2%
10% 3.0
Exposure 31Dec14 To performing Collected To bad loans Others From performing From nonperforming
Other inflows Exposure 31Dec15
(1.0)Outflows
0.8Inflows

16 | The Italian Unlikely to Pay market | A big opportunity

PwC | 17
3 Unlikely to Pay coverage ratio - Top 20 Italian banks
General need to increase UTP coverage ratio. The top 20 Italian banks average coverage ratio was at 27.6% in 2015. Banks with high proportion of UTP over total NPE might need to implement a more proactive management
UTP Coverage ratios vs. Gross UTP ratios
At the end of 2015, both UniCredit and Intesa Sanpaolo showed a reassuring below average Gross UTP ratio (5.2% and 6% respectively), despite a different UTP coverage ratio (34% for UniCredit and 25% for Intesa Sanpaolo).
MPS, third group in terms of UTP exposures, showed above average Gross UTP ratio (13%) with an average UTP coverage ratio at 29%.Veneto Banca, Carige, Banca Popolare di Vicenza show below average coverage ratios and above 12% gross UTP ratios.
NPE breakdown by bank
64% 62% 57% 50% 52% 62% 49% 62% 46% 51%
32% 36% 37% 48% 46% 36% 50% 35% 47% 44%
3% 2% 6% 1% 2% 2% 2% 2% 7% 4%
UniCredit IntesaSanpaolo
MPS BancoPopolare
UBI BNL BPVI BPER VenetoBanca
GruppoCARIGE
54% 50% 53% 45% 44% 59% 56% 58% 47% 61%
44% 44% 45% 43% 52% 32% 42% 38%41%
36%
2% 6% 2% 11% 3% 9% 2% 4% 12% 3%
BPM CreditoValtellinese
CACariparma
BP diSondrio
ICCREA BP di Bari CR diBolzano
Banco diDesio
GE Capital CR diCesena
Bad loans Unlikely to pay Past due
Bubble size: Unlikely to Pay gross exposure
UniCredit
Intesa Sanpaolo
MPS
Banco Popolare
UBI
BNL
BPVI
BPERVeneto Banca
CARIGE
BPM
Credito Valtellinese
CA Cariparma
BP di Sondrio
ICCREA
Banca Popolare di Bari
CR di Bolzano
Banco di Desio e della Brianza
GE CapitalCR di Cesena
10%
15%
20%
25%
30%
35%
40%
2% 4% 6% 8% 10% 12% 14% 16%
UTP
Cov
erag
e ra
tio 3
1Dec
15
Gross UTP ratio 31Dec15
Avg. Top 20 (7.4%)
Avg. Top 20 (27.6%)

18 | The Italian Unlikely to Pay market | A big opportunity
4 Our view
UTP need to be moved out of their hybrid condition. Different options might be available and vary case by case
The unlikelihood judgement
The exposures are classifi ed as Unlikely to Pay in light of the unlikelihood that relevant debtors will fulfi l their credit obligations.
The unlikelihood judgement is made by the Bank based on a varied spectrum of signals and issues.
The range of signals and issues may be very wide and differs case by case but a common feature is that each of them is recoverable and / or is manageable if tackled properly and timely. Time is of essence.
What should banks do?
Market risks(external variables
such as those regarding the
environment where the borrowers
operate)
Operational risks
(risks concerning the operational structure of the
borrowers)
Financial risks (financial soundness of the borrowers and
/ or relevant customers and / or
suppliers)
Perform budget/BP analysis and ad hoc reclassifications1
Regularly monitor the Central Credit Register to be informed on the total exposure to the system and relevant
movements2
Use early warning indicators: from internal (companies and individuals)
and external sources3
Produce and regularly update an overall rating on borrowers’ overall risk based
upon info gathered from several sources4
NPE operating model: dedicated workout units, standard procedures for
classification and segmentation5
There are several options to move the UTP out of their hybrid condition
UTP
Sale (Several factors
impacting such pattern e.g. alive counterparty, NBV, P&L immediate
impact)
Forbearance measures
(12 months from allowance)
Equity / Senior debt
solutions
Collection
Activities
Per
form
ing B
adloan
s

PwC | 19
5 Non Performing Exposures classifi cations
How to defi ne and what to include within the “Unlikely to Pay” category
Non-Performing Exposures
The commonly used term non-performing loans (“NPL”) is based on different defi nitions across Europe.To overcome problems, EBA has issued a common defi nition of Non-Performing Exposures (“NPE”) which is used for supervisory reporting purposes.
In Italy, banks are also required to distinguish among different classes of NPE: (i) Bad Loans, (ii) Unlikely to Pay and (iii) Past-Due; the sum of these 3 categories corresponds to the Non-Performing Exposures referred to in the EBA ITS.
Old New Defi nition of risk category
Past DueEspisizioni scadute> 90 giorni
Past Due more than 90 days loans (debt) Esposizioni scadute
Including FNPE*
RestructuredCrediti ristrutturati
Unlikely to PayInadempienze probabibli
Including FNPE*WatchlistIncagli
Bad LoansSofferenze
Bad LoansSofferenze
Including FNPE*
NPE • Exposure to any borrower whose loans are not included in other categories and who, at the date of the balance sheet closure, have Past Due amounts or unauthorized overdrawn positions of more than 90 days.
• A sub-segment is now represented by the Forborne Non-Performing Exposures (“FNPE”), credits granted to a counterparty in fi nancial diffi culties and which are not classifi ed as Bad Loans and have been subject to the modifi cation of the terms and conditions of the contract or refi nancing.
• The classifi cation of loans in this category is the result of the judgment of the bank about the debtors’ unlikelihood to fulfi l its credit obligations. This category substitutes the old sub-standard loans (“Incagli”) and restructured loans (“Crediti Ristrutturati”).
• A sub-segment of the Unlikely to Pay is now represented by the FNPE.
• Exposure to a borrower in a position of insolvency (not necessarily recognised by a Court) or a substantially similar situation, irrespective of the presence of any collateral. Same as previous classifi cation of Bad Loans or “Sofferenze”.
• A sub-segment of the Bad Loans is now represented by the FNPE.
*FNPE: Forborne Non-Performing ExposuresSource: EBA, EBA/ITS/2013/03/rev1 24/7/2014
FNPE may become a Forborne Performing Exposure if:• 12 months have passed from last allowance• No past due from last allowance occurred

20 | The Italian Unlikely to Pay market | A big opportunity
6 Outfl ows - Top 20 Italian banks
The average collection rate does not represent a signifi cant indicator to read the Italian system as it changes signifi cantly from bank to bank
From UTP to Performing in 2015
From UTP to Collected in 2015
5% 7%
5% 7%
3% 4% 1%
6% 3% 4% 5%
GRUPPO UNICREDIT GRUPPO BANCARIOINTESA SANPAOLO
GRUPPO MONTE DEIPASCHI DI SIENA
GRUPPO BANCOPOPOLARE
GRUPPO UNIONE DIBANCHE ITALIANE
GRUPPO BANCARIOBANCA NAZIONALE
DEL LAVORO
GRUPPO BANCARIOBANCA POPOLARE
DI VICENZA
GRUPPO BANCAPOPOLAREDELL'EMILIAROMAGNA
GRUPPO BANCARIOVENETO BANCA
GRUPPO CARIGE Totale 20
10%
2% 5%
3% 5%
2% 0% 3%
6% 8%
5%
BPM CREDITOVALTELLINESE
CARIPA CREDITAGRICOLE
POPOLARE DISONDRIO
BANCARIO ICCREA POPOLARE DI BARI RISPARMIO DIBOLZANO
GRUPPO BANCO DIDESIO E DELLA
BRIANZA
GE CAPITAL RISPARMIO DICESENA
Totale 20
Average Top 20
UniCredit MPS Banco Popolare
UBI BNL BPVI BPER VenetoBanca
GruppoCarige
Intesa Sanpaolo
Average Top 20
BPM CreditoValtellinese
CA Cariparma
BPdi Sondrio
ICCREA BP di Bari CR di Bolzano
Banco di Desio
GE Capital CR di Cesena
20%
10% 7% 11% 10% 5% 7%
25%
9% 11% 13%
GRUPPO UNICREDIT GRUPPO BANCARIOINTESA SANPAOLO
GRUPPO MONTE DEIPASCHI DI SIENA
GRUPPO BANCOPOPOLARE
GRUPPO UNIONE DIBANCHE ITALIANE
GRUPPO BANCARIOBANCA NAZIONALE
DEL LAVORO
GRUPPO BANCARIOBANCA POPOLARE
DI VICENZA
GRUPPO BANCAPOPOLAREDELL'EMILIAROMAGNA
GRUPPO BANCARIOVENETO BANCA
GRUPPO CARIGE Totale 20
9% 9% 5%
19% 12% 12%
17% 16%
8% 7% 13%
BPM CREDITOVALTELLINESE
CARIPA CREDITAGRICOLE
POPOLARE DISONDRIO
BANCARIO ICCREA POPOLARE DI BARI RISPARMIO DIBOLZANO
GRUPPO BANCO DIDESIO E DELLA
BRIANZA
GE CAPITAL RISPARMIO DICESENA
Totale 20
Average Top 20
UniCredit MPS Banco Popolare
UBI BNL BPVI BPER VenetoBanca
GruppoCarige
Intesa Sanpaolo
Average Top 20
BPM CreditoValtellinese
CA Cariparma
BPdi Sondrio
ICCREA BP di Bari CR di Bolzano
Banco di Desio
GE Capital CR di Cesena

PwC | 21
From UTP to Bad Loans in 2015
Remained UTP in 2015
27% 22% 21% 15% 21% 34% 32%
19% 13% 12% 22%
GRUPPO UNICREDIT GRUPPO BANCARIOINTESA SANPAOLO
GRUPPO MONTE DEIPASCHI DI SIENA
GRUPPO BANCOPOPOLARE
GRUPPO UNIONE DIBANCHE ITALIANE
GRUPPO BANCARIOBANCA NAZIONALE
DEL LAVORO
GRUPPO BANCARIOBANCA POPOLARE
DI VICENZA
GRUPPO BANCAPOPOLAREDELL'EMILIAROMAGNA
GRUPPO BANCARIOVENETO BANCA
GRUPPO CARIGE Totale 20
20% 19% 18% 24% 12% 17% 20%
33% 12%
63%
22%
BPM CREDITOVALTELLINESE
CARIPA CREDITAGRICOLE
POPOLARE DISONDRIO
BANCARIO ICCREA POPOLARE DI BARI RISPARMIO DIBOLZANO
GRUPPO BANCO DIDESIO E DELLA
BRIANZA
GE CAPITAL RISPARMIO DICESENA
Totale 20
Average Top 20
UniCredit MPS Banco Popolare
UBI BNL BPVI BPER VenetoBanca
GruppoCarige
Intesa Sanpaolo
Average Top 20
BPM CreditoValtellinese
CA Cariparma
BPdi Sondrio
ICCREA BP di Bari CR di Bolzano
Banco di Desio
GE Capital CR di Cesena
41% 57% 65% 65% 62% 55% 59% 50%
71% 70% 56%
GRUPPO UNICREDIT GRUPPO BANCARIOINTESA SANPAOLO
GRUPPO MONTE DEIPASCHI DI SIENA
GRUPPO BANCOPOPOLARE
GRUPPO UNIONE DIBANCHE ITALIANE
GRUPPO BANCARIOBANCA NAZIONALE
DEL LAVORO
GRUPPO BANCARIOBANCA POPOLARE
DI VICENZA
GRUPPO BANCAPOPOLAREDELL'EMILIAROMAGNA
GRUPPO BANCARIOVENETO BANCA
GRUPPO CARIGE Totale 20
58% 71% 72%
54% 70% 68% 63%
48%
71%
21%
56%
BPM CREDITOVALTELLINESE
CARIPA CREDITAGRICOLE
POPOLARE DISONDRIO
BANCARIO ICCREA POPOLARE DI BARI RISPARMIO DIBOLZANO
GRUPPO BANCO DIDESIO E DELLA
BRIANZA
GE CAPITAL RISPARMIO DICESENA
Totale 20
Average Top 20
UniCredit MPS Banco Popolare
UBI BNL BPVI BPER VenetoBanca
GruppoCarige
Intesa Sanpaolo
Average Top 20
BPM CreditoValtellinese
CA Cariparma
BPdi Sondrio
ICCREA BP di Bari CR di Bolzano
Banco di Desio
GE Capital CR di Cesena

22 | The Italian Unlikely to Pay market | A big opportunity


© 2017 PricewaterhouseCoopers Advisory SpA. All rights reserved. PwC refers to PricewaterhouseCoopers Advisory SpA and may sometimes refer to the PwC network. Each member firm is a separate legal entity. Please see www.pwc.com/structure for further details. This content is for general information purposes only, and should not be used as a substitute for consultation with professional advisors.
www.pwc.com/it