Florence, 2 April 2004 - Intesa Sanpaolo
27
1 Morgan Stanley Morgan Stanley The The Southern European Banks Conference Southern European Banks Conference 2004 2004 Giorgio Giorgio Spriano Spriano Head of Head of Corporate Development Corporate Development Florence Florence , 2 , 2 April April 2004 2004
Transcript of Florence, 2 April 2004 - Intesa Sanpaolo

1
Morgan StanleyMorgan Stanley
The The Southern European Banks ConferenceSouthern European Banks Conference 20042004
Giorgio Giorgio SprianoSpriano
Head of Head of Corporate DevelopmentCorporate Development
FlorenceFlorence, 2 , 2 AprilApril 20042004
2
DISCLAIMER
This presentation has been prepared by Sanpaolo IMI and provides information on the management’s business plans and strategies. As such, the presentation contains forward-looking information which reflects management’s current views with respect to certain future events and the financial performance of the Group. These views are based upon assumptions of future events which may not prove to be accurate and actual results may differ materially from those projected or implied in the forward-looking statements. Undue reliance should not, therefore, be placed on such forward-looking information and Sanpaolo IMI assumes no responsibility to update any such forward-looking information.

3AGENDAAGENDA
! Q4 2003 results
! Group strategy
! Outlook for 2004
! Conclusions

4SOLID OPERATIONAL PERFORMANCE & POSITIVE OPERATING TRENDSSOLID OPERATIONAL PERFORMANCE & POSITIVE OPERATING TRENDS
€ MM
2,717
(4,610)
7,482
3,036
3,716
2003
Operating income
Administrative costs
Net interest andother banking income
Net commissions
Net interest income
+7.9+5.97,066
+0.7+0.7(4,578)
%Q/Q change
% Y/Y change
2002 pro forma
+16.4
+8.6
+1.7 -0.53,653
+13.82,795
+25.82,334
CHALLENGING SCENARIO
! H103 negative economic growth
! FY03 weak GDP growth ( +0.4% vs +1.5% budget estimates )
! Average Euribor rate –99 bps Y/Y
! Salary inflation of 3.8% following introductionof new labor contract
! One off integration costs
− Indirect personnel costs up 23%
− IT costs 22 €MM
POSITIVE OPERATING TRENDS
! Selective loan growth of 0.6%
− residential mortgages
− consumer banking
− Banca OPI
! Average spread on customer business up 10 bps
! Confirmation of asset gathering strength (11 € BN)
! Good cost discipline and headcount reduction of 1,752 people
5
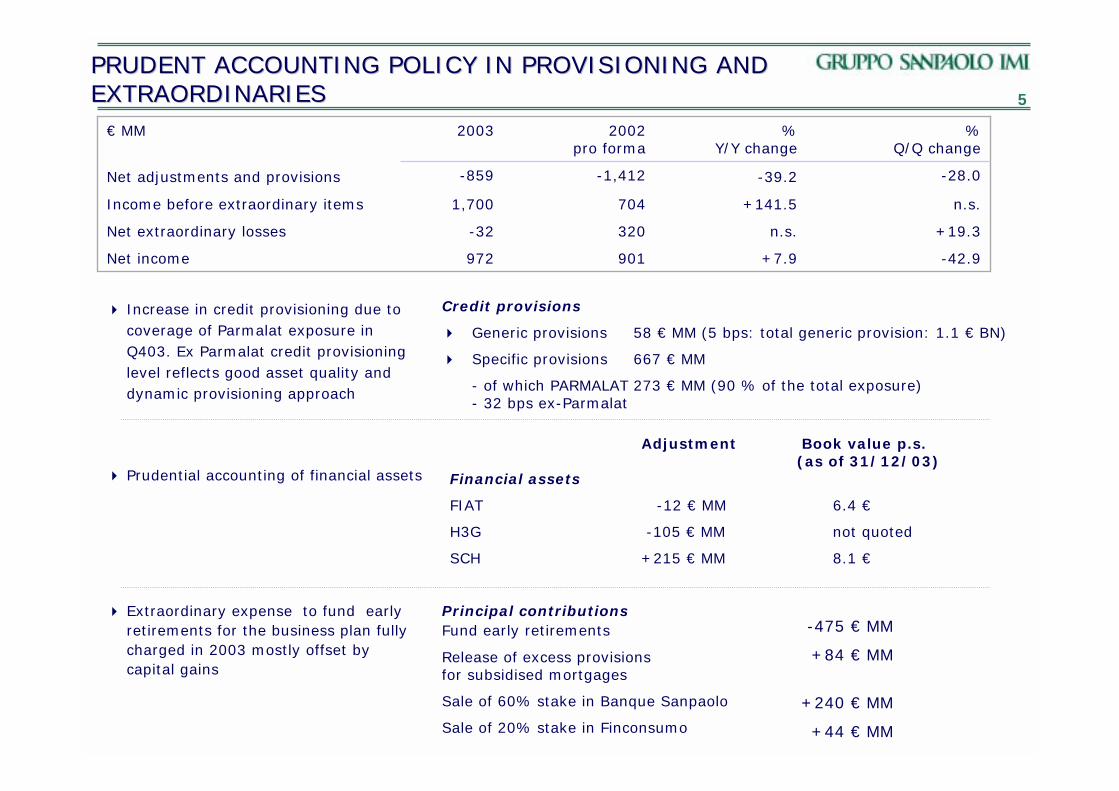
PRUDENT ACCOUNTING POLICY IN PROVISIONING AND PRUDENT ACCOUNTING POLICY IN PROVISIONING AND EXTRAORDINARIESEXTRAORDINARIES
972
-32
1,700
-859
2003
Net income
Net extraordinary losses
Income before extraordinary items
Net adjustments and provisions
€ MM
+19.3n.s.320
-42.9+7.9901
%Q/Q change
% Y/Y change
2002 pro forma
+141.5
-39.2 -28.0-1,412
n.s.704
Credit provisions
! Generic provisions 58 € MM (5 bps: total generic provision: 1.1 € BN)
! Specific provisions 667 € MM
- of which PARMALAT 273 € MM (90 % of the total exposure)- 32 bps ex-Parmalat
! Increase in credit provisioning due to coverage of Parmalat exposure in Q403. Ex Parmalat credit provisioning level reflects good asset quality and dynamic provisioning approach
Adjustment Book value p.s. (as of 31/12/03)
Financial assets
FIAT -12 € MM 6.4 €
H3G -105 € MM not quoted
SCH +215 € MM 8.1 €
! Prudential accounting of financial assets
! Extraordinary expense to fund early retirements for the business plan fully charged in 2003 mostly offset by capital gains
Principal contributionsFund early retirements
Release of excess provisionsfor subsidised mortgages
Sale of 60% stake in Banque Sanpaolo
Sale of 20% stake in Finconsumo
-475 € MM
+84 € MM
+240 € MM
+44 € MM

6GOOD ASSET QUALITY AND ADEQUATE COVERAGE RATIOSGOOD ASSET QUALITY AND ADEQUATE COVERAGE RATIOS
€ MM
(*) Includes 91 € MM of reserve for credit risks
31/12/03
0.3%
0.5%
-9.7%
-6.2%
-8.2%
Var. Y/Y
129,502
123,069
2,069
4,364
6,433
Gross exposure
Total loans
Performing loans
! Problem loans
! Non-performing loans
Doubtful loans
33.8%1,370699-4.6%
0.90%(*)122,0581,0110.6%
CoverageNet exposureTotal adjustmentsVar. Y/Y
4,903
3,193
3,892 60.5%2,5413.0%
73.2%1,1717.1%
3.8%124,5990.7%
! Net NPLs and net problem loans down 6.2% and 9.7% respectively
! Net loans to countries at risk down to 22 million euro
! NPL and net watchlist coverage levels up to 73.2% and 33.8% respectively
! NPL and watchlist ratios down to 0.9 and 1.1% respectively
! Level of general reserve maintained
1.0%0.9%NPL’S ratio
1.2%1.1%Watchlist ratio
31/12/02 pro forma
31/12/03

72003 GROUP TARGETS EXCEEDED2003 GROUP TARGETS EXCEEDED
Net Income (€ MM)
Cost/Income (%)
65.1%61.9%
65.5%
2002 pro forma 2003 plan 2003
1 ROE (%)
8.3%9.0%8.8%
2002 pro forma 2003 plan 2003
901
972935
2002 proforma
2003 plan 2003
+4%
Gross Operating Profit (€ MM)
2,3342,7172,384
2002 pro forma 2003 plan 2003
+14%
1 Total administrative expenses (excluding direct and indirect taxes) and amortization (excluding value adjustments on goodwill and merger and consolidation differences)/total income (including other net operating income)

8AGENDAAGENDA
! Q4 2003 results
! Group strategy
!Enhance performance in core banking business
!Cost control
!Optimisation of business portfolio
! Outlook for 2004
! Conclusions
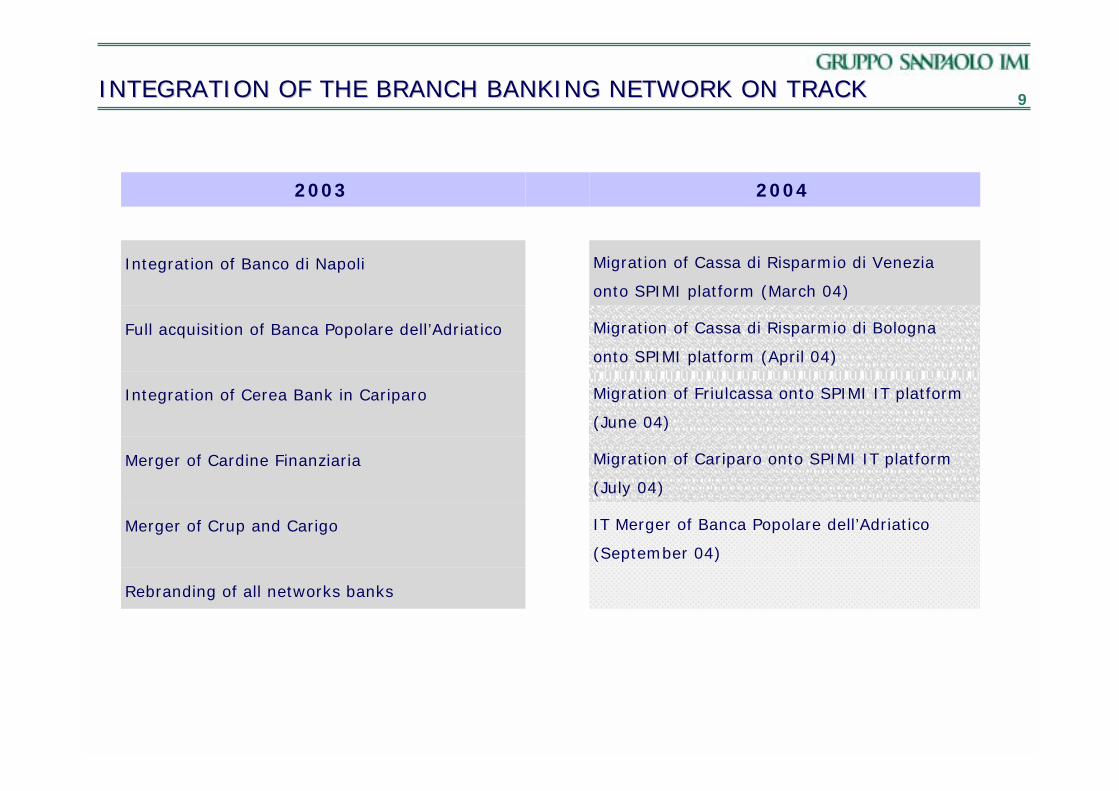
9INTEGRATION OF THE BRANCH BANKING NETWORK ON TRACKINTEGRATION OF THE BRANCH BANKING NETWORK ON TRACK
IT Merger of Banca Popolare dell’Adriatico
(September 04)
Merger of Crup and Carigo
Rebranding of all networks banks
Migration of Cassa di Risparmio di Bologna
onto SPIMI platform (April 04)
Full acquisition of Banca Popolare dell’Adriatico
20042003
Migration of Cassa di Risparmio di Venezia
onto SPIMI platform (March 04)
Integration of Banco di Napoli
Migration of Friulcassa onto SPIMI IT platform
(June 04)
Integration of Cerea Bank in Cariparo
Migration of Cariparo onto SPIMI IT platform
(July 04)
Merger of Cardine Finanziaria

10EXTENSION OF THE BRANCH DISTRIBUTION MODELEXTENSION OF THE BRANCH DISTRIBUTION MODEL
Retail Headquarters
!Single head office on single operating and back office platform
!Divisional model to meet needs of customer segments and ensure necessary co-ordination
2003
Area Management
!Local character maintained through brand and legal entity
!Empowers area management structure to manage and coordinate different local market and customer needs
Branch network
!3,000 branches with good national foot print and high concentration coverage
!Specialisation through dedicated branches and modular approach to branch business
!Multi-channel approach
BRANCH BANKING SPECIALISATION(1)
8,500 1,2002,200
2,000
1,450
151
+63(2)
SME Division
150
69
Private & Retail Division
Professional roles(3)
Specialist branches
and modules
≥ 5 % - < 12%≥ 2 % - < 5%≥ 1% - < 2%< 1%
≥ 12 % - < 20%≥ 20%
1) Numbers do not include ex-Cardine banks2) Additional teams3) In addition to 2,000 branch managers

11CONSOLIDATING LEADERSHIP IN RETAIL AND SME BANKINGCONSOLIDATING LEADERSHIP IN RETAIL AND SME BANKING
! Strong asset gathering capacity 12 €BN
! Selective loan growth, +4.4%
− new residential mortgage lending 3.9 € BN
! Successful development of corporate derivative business
! Significant potential still to be unlocked
--11,953TFA net inflow
+44.63,3474,839! AUM net inflow
+0.82,9562,981Branches
€ MM
N°
-3.731,48530,316Employees
+4.476,33079,725Net customer loans
+0.676,44176,936!Direct deposits
86,684
91,411
255,031
2003
!Administered
!AUM
TFA
KEY AGGREGATES (*)
+6.6239,287
+8.883,997
%2002pro forma
+9.978,849
(*) BRANCH BANKING NETWORK (Sanpaolo, SPBdN, ex-Cardine Banks)

12AGENDAAGENDA
! Q4 2003 results
! Group strategy
!Enhance performance in core banking business
!Cost control
!Optimisation of business portfolio
! Outlook for 2004
! Conclusions

13RIGHT SIZING THE COST BASERIGHT SIZING THE COST BASE
Efficiencies through concentration and centralisation
Cost savings through adoption of Group target operating platform
Optimising staffing levels in domestic banking, by reducing headcount by 2000
ACTION
Logistics
MOI Implementation
Human resources
AREA
Group administrative costs (€ MM)
CAGR: ~1%CAGR: 1.0%
4,551 4,648
2000 2002
4,578
2002 2005
(*)
(*) Proforma without Banque Sanpaolo, Finconsumo and IMIWeb, plus Epta, Cariforlì and Intereuropa
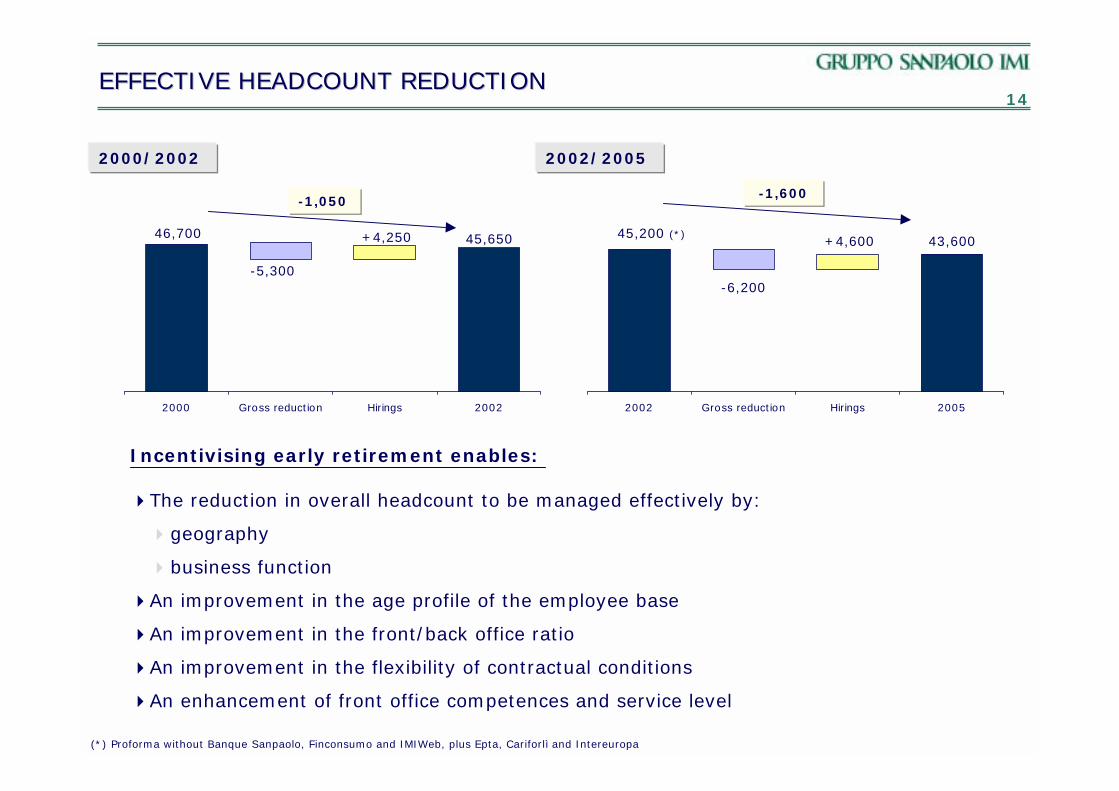
14EFFECTIVE HEADCOUNT REDUCTIONEFFECTIVE HEADCOUNT REDUCTION
2000 Gross reduction Hirings 2002
46,700
-5,300
+4,250 45,650
-1,050
2000/2002 2002/2005
2002 Gross reduction Hirings
45,200 (*)
-6,200
+4,600
-1,600
2005
43,600
Incentivising early retirement enables:
!The reduction in overall headcount to be managed effectively by:
!geography
!business function
!An improvement in the age profile of the employee base
!An improvement in the front/back office ratio
!An improvement in the flexibility of contractual conditions
!An enhancement of front office competences and service level
(*) Proforma without Banque Sanpaolo, Finconsumo and IMIWeb, plus Epta, Cariforlì and Intereuropa

15AGENDAAGENDA
! Q4 2003 results
! Group strategy
!Enhance performance in core banking business
!Cost control
!Optimisation of business portfolio
! Outlook for 2004
! Conclusions

16
!
ACTIONS TAKEN IN 2003ACTIONS TAKEN IN 2003
Sale of Banque Sanpaolo to CNCE
! Acquisition of control of Inter-Europa Bank completing the selective presence in Eastern Europe
Foreign Network
! Disposal of IMIWEB! Extension of Sanpaolo internet banking to all retail networks
Retail Banking
Personal Financial Services
Wealth Management
Consumer Banking
BUSINESS AREA
! Operational integration ofSanpaolo Invest into Banca Fideuram
!Rationalisation of Eptaconsors
!Sale of stake in Adria Vita
! Strengthening of WealthManagement with Eptaconsors
! Acquisition of minorities inNoricum Vita
! Sale of 50% stake inFinconsumo to SCH
! Development of consumer banking in Finemiro
RATIONALISATIONFOCUS
17
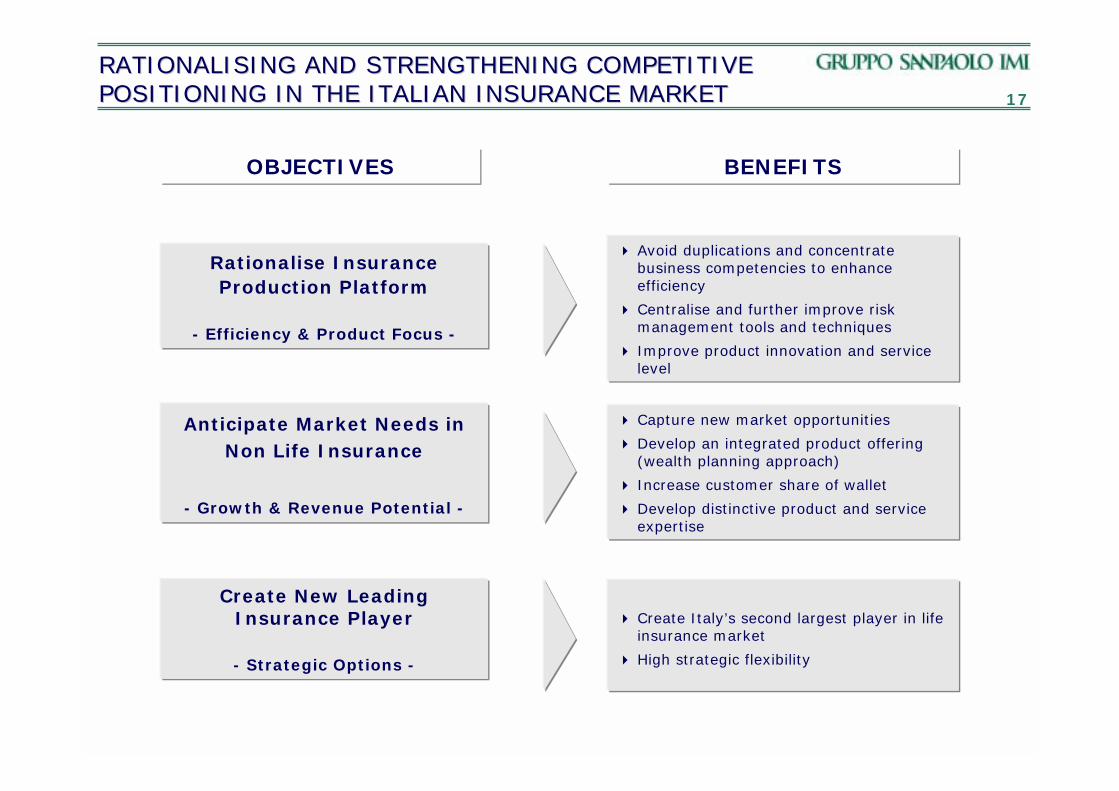
RATIONALISING AND STRENGTHENING COMPETITIVE RATIONALISING AND STRENGTHENING COMPETITIVE POSITIONING IN THE ITALIAN INSURANCE MARKETPOSITIONING IN THE ITALIAN INSURANCE MARKET
OBJECTIVES BENEFITS
! Avoid duplications and concentrate business competencies to enhance efficiency
! Centralise and further improve risk management tools and techniques
! Improve product innovation and service level
Rationalise Insurance Production Platform
- Efficiency & Product Focus -
! Capture new market opportunities
! Develop an integrated product offering (wealth planning approach)
! Increase customer share of wallet
! Develop distinctive product and service expertise
Anticipate Market Needs in Non Life Insurance
- Growth & Revenue Potential -
Create New Leading Insurance Player
- Strategic Options -
! Create Italy’s second largest player in life insurance market
! High strategic flexibility

18AGENDAAGENDA
! Q4 2003 results
! Group strategy
! Outlook for 2004
! Conclusions

19A CHALLENGING SCENARIOA CHALLENGING SCENARIO
Resilience in corporate sector to difficult macroscenario
Slow introduction of structural reform
Greater propensity to pay for quality servicesMore demanding customers
Higher customer turnover levels create opportunitiesLow levels of customer satisfaction
Opportunity to develop asset managementbusiness
Negative customer sentiment as a result of Italian corporate scandals
Leading businesses in high value addedsectors
Uncompetitive businesses in mature sectors
Development of premium pricing for brand qualityand service levels
Low risk adjusted return in corporate lending
Structurally lower level of corporateindebtedness to GDP than EU average
High corporate leverage
Structural repricing of liabilitiesAverage Euribor rates lower than 2003with risk of further policy cut
Export driven business hit by strong euro
Weakening consensus view for Italian GDP growth
BLACK
Development of new markets in emerging economies
Strong growth in retail and public sector lending
WHITE
20
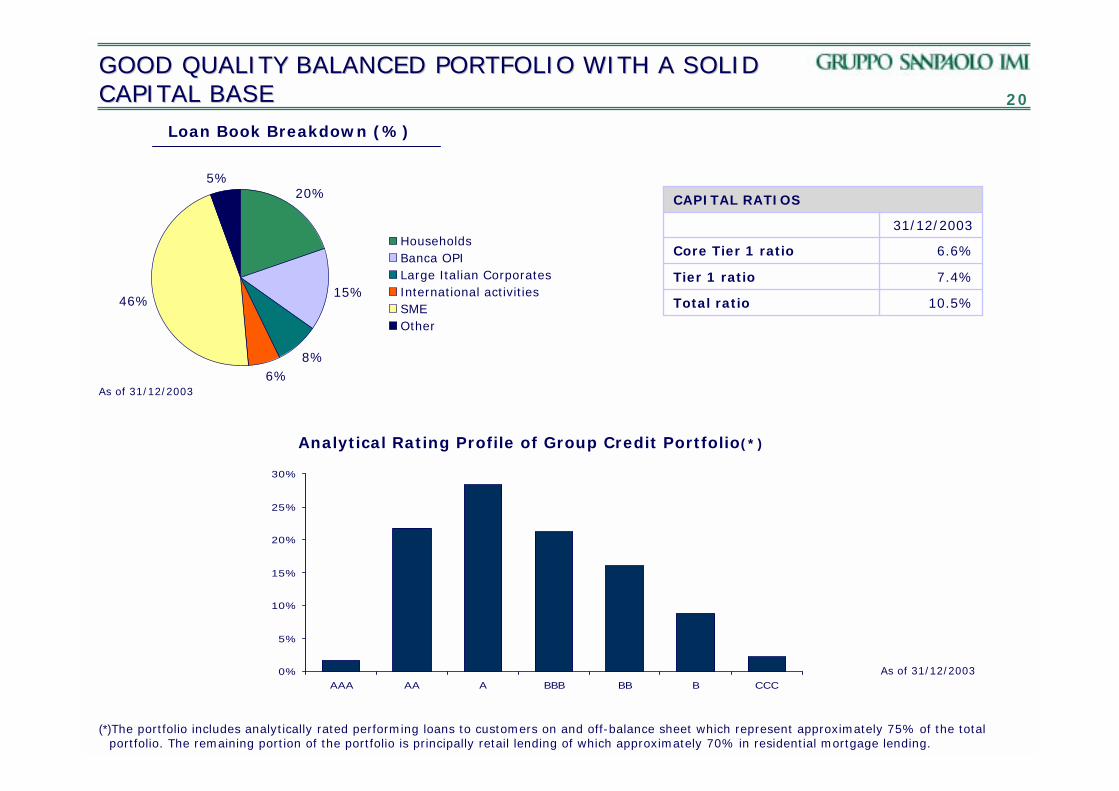
GOOD QUALITY BALANCED PORTFOLIO WITH A SOLID GOOD QUALITY BALANCED PORTFOLIO WITH A SOLID CAPITAL BASE CAPITAL BASE
Loan Book Breakdown (%)
0%
5%
10%
15%
20%
25%
30%
AAA AA A BBB BB B CCC
Analytical Rating Profile of Group Credit Portfolio(*)
20%
15%
8%6%
46%
5%
HouseholdsBanca OPILarge Italian CorporatesInternational activitiesSMEOther
As of 31/12/2003
31/12/2003
Total ratio
Tier 1 ratio
Core Tier 1 ratio
CAPITAL RATIOS
7.4%
10.5%
6.6%
As of 31/12/2003
(*)The portfolio includes analytically rated performing loans to customers on and off-balance sheet which represent approximately 75% of the total portfolio. The remaining portion of the portfolio is principally retail lending of which approximately 70% in residential mortgage lending.
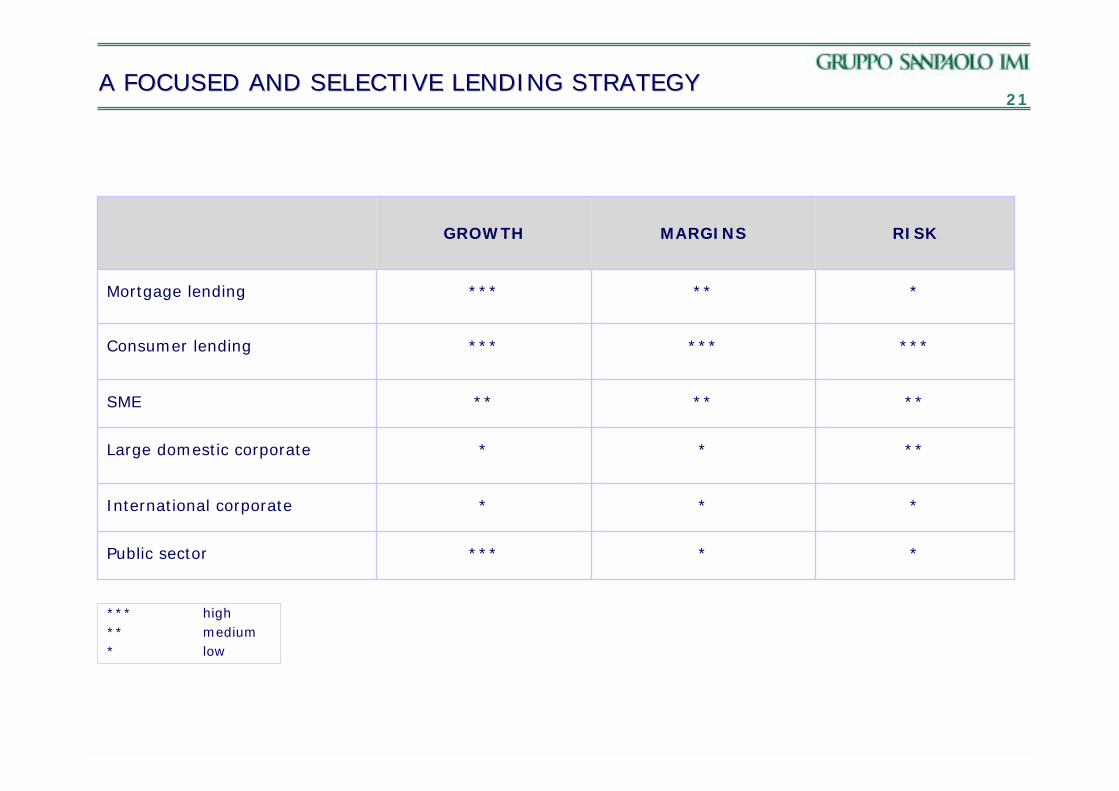
21A FOCUSED AND SELECTIVE LENDING STRATEGY A FOCUSED AND SELECTIVE LENDING STRATEGY
*****Public sector
*
*
**
***
**
MARGINS
**International corporate
***Large domestic corporate
******Consumer lending
SME
Mortgage lending
****
****
RISKGROWTH
*** high** medium* low
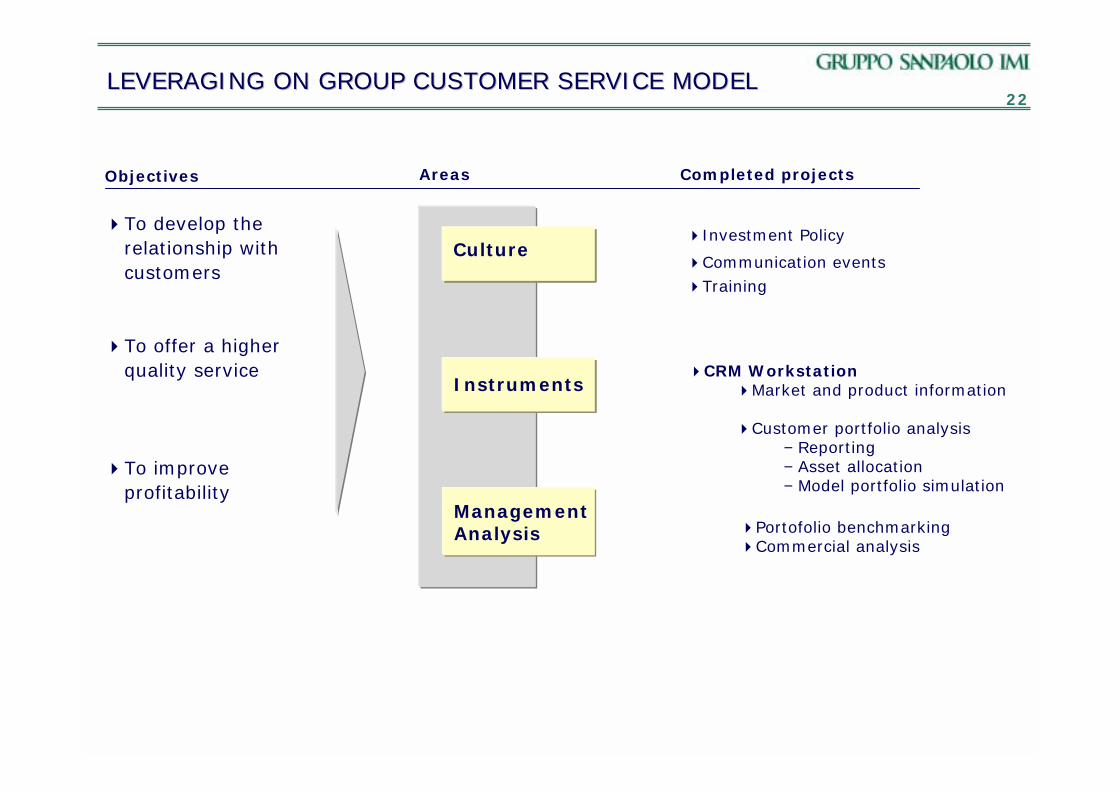
22LEVERAGING ON GROUP CUSTOMER SERVICE MODELLEVERAGING ON GROUP CUSTOMER SERVICE MODEL
Cultura
Strumenti
!Investment Policy
Objectives
!To develop the relationship with customers
!To offer a higher quality service
!To improve profitability
Culture
Management Analysis
Instruments
Areas
!Communication events!Training
!CRM Workstation!Market and product information
!Customer portfolio analysis− Reporting− Asset allocation− Model portfolio simulation
!Portofolio benchmarking!Commercial analysis
Completed projects
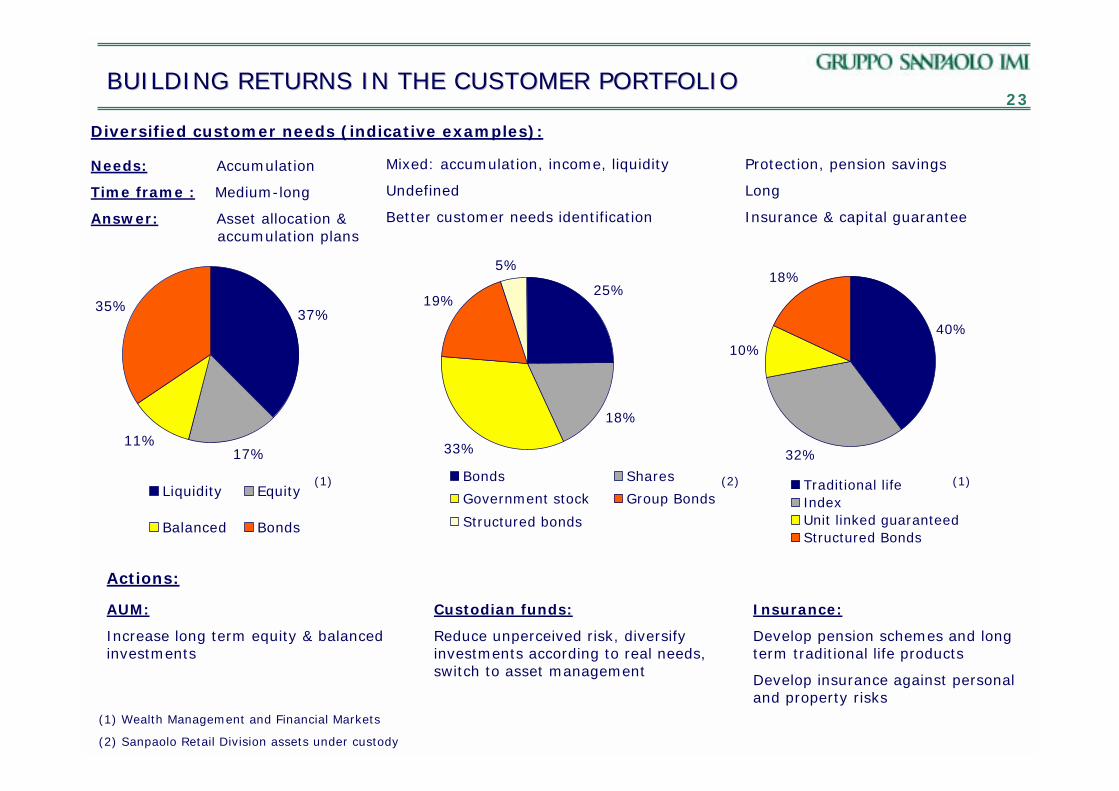
23BUILDING RETURNS IN THE CUSTOMER PORTFOLIOBUILDING RETURNS IN THE CUSTOMER PORTFOLIO
Diversified customer needs (indicative examples):
25%
18%
33%
19%
5%
Bonds Shares
Government stock Group Bonds
Structured bonds
37%
17%11%
35%
Liquidity Equity
Balanced Bonds
Needs: Accumulation
Time frame : Medium-long
Answer: Asset allocation & accumulation plans
Mixed: accumulation, income, liquidity
Undefined
Better customer needs identification
Protection, pension savings
Long
Insurance & capital guarantee
40%
32%
10%
18%
Traditional lifeIndexUnit linked guaranteedStructured Bonds
(1) (1)(2)
Actions:
Custodian funds:
Reduce unperceived risk, diversify investments according to real needs, switch to asset management
Insurance:
Develop pension schemes and long term traditional life products
Develop insurance against personal and property risks
AUM:
Increase long term equity & balanced investments
(1) Wealth Management and Financial Markets
(2) Sanpaolo Retail Division assets under custody

24
SUSTAINABLE COMMERCIAL POLICIES:SUSTAINABLE COMMERCIAL POLICIES:EG. REDDITIVITÀ SOSTENIBILEEG. REDDITIVITÀ SOSTENIBILE
ObjectivesStarting point
Improving risk/return profile of customers, to meet their financial needs
Improving profitability through the conversion of inefficient investments
Portfolio details Risk analysisAnalysis of customer needs and risk profile
Rebalancing using product matrix
Flows management
Large amounts of corporate bonds in customer portfolios
1
Redditività sostenibile
Deterioration in profitability of customer financial assets
2
Business process
+9 bsp
4.9 MM €
328 MM €
5.2 BN €
(started end 2003)
Sanpaolo Banco di Napoli
3.9 BN €3.6 BN € !assets rebalanced
60 MM €55 MM €!economic impact
46.2 BN €41 BN €!assets involved
+13 bsp+13.5 bsp!average profitability
(started in April 2003)
P&R DivisionSanpaoloKey Figures as of 31/12/03

25AGENDAAGENDA
! Q4 2003 results
! Group strategy
!Enhance performance in core banking business
!Cost control
!Optimisation of business portfolio
! Outlook for 2004
! Conclusions

26CONCLUSIONSCONCLUSIONS
The Group’s improving performance and business objectives are based on:
! A consistent and coherent business strategy
! A clear focus on risk adjusted return enabling the creation of
shareholder value
! A commitment to high service levels and the asset quality of
the Group and customer portfolios
! A strong competitive positioning in core businesses
! A sustainable approach to business growth

272005 GROUP TARGETS2005 GROUP TARGETS
Cost/Income (%)
65.2%61.9%
55%
2002 2003 2005
Gross Operating Profit (€ MM)
1
2,3342,717
2002 2003 2005
CAGR 17%
Net Income (€ MM)
ROE (%)
901 972
2002 2003 2005
8.4% 9.0%
15%
2002 2003 2005
CAGR 26%
1 Total administrative expenses (excluding direct and indirect taxes) and amortization (excluding value adjustments on goodwill and merger and consolidation differences)/total income (including other net operating income)