A Appendix: Policy details
17
A Appendix: Policy details This section provides details on policy data collection and policy design and implementation. We collected and coded information on all major public health policies and economic policies in the eight study countries using official government sources. Table A1 links to these government web pages, as well as general databases we used to cross-check data. Our data reflect the amount of aid pledged by governments between March 11 and August 1, 2020; therefore discrepancies may arise with respect to eventual execution. Table A2 describes major loan and employment programs while Table A3 describes all cash transfer programs targeted at informal workers. These tables show that the majority of aid expired by late 2020 or early 2021. Table A1: Policy sources Country Government web pages Argentina https://www.argentina.gob.ar/coronavirus/medidas-gobierno https://www.argentina.gob.ar/economia/medidas-economicas-COVID19/ingresofamiliardeemergencia https://www.argentina.gob.ar/produccion/medidas-pymes-covid#2 https://www.boletinoficial.gob.ar/detalleAviso/primera/227113/20200324 Bolivia https://www.economiayfinanzas.gob.bo https://www.economiayfinanzas.gob.bo/ Brazil https://calendariobolsafamilia2020.net/quem-tem-direito-ao-bolsa-familia-2020/amp/ https://servicos.mte.gov.br/bem/ https://www.bndes.gov.br/wps/portal/site/home https://www.caixa.gov.br/caixacomsuaempresa/caixa-e-sebrae/Paginas/default.aspx Colombia https://id.presidencia.gov.co/especiales/200317-medidas-enfrentar-coronavirus/index.html https://coronaviruscolombia.gov.co/Covid19/acciones/acciones-de-economia.html https://www.mintrabajo.gov.co/web/guest/inicio https://ingresosolidario.dnp.gov.co/ https://www.bancoldex.com/soluciones-financieras/lineas-de-credito/ https://www.fng.gov.co/ES/Paginas/Unidos_por_Colombia_FNG.aspx https://coronaviruscolombia.gov.co/Covid19/acciones/acciones-31-marzo.html Chile https://www.gob.cl/planeconomicoemergencia/inyeccion/ https://www.tgr.cl/plan-covid-19/ https://prensa.presidencia.cl/comunicado.aspx?id=151422 Mexico https://www.nafin.com/portalnf/content/financiamiento/impulso-nafin-estados.html https://www.gob.mx/salud Peru https://www.gob.pe/busquedas?contenido[]=normasinstitucion[]=mtpereason=sheet General databases ACAPS COVID-19 Dataset (https://data.humdata.org/dataset/acaps-covid19-government-measures-dataset) Americas Society Council of the Americas Where is the Coronavirus in Latin America? (https://www.as-coa.org/articles/ where-coronavirus-latin-america) International Monetary Fund Policy Responses to COVID19 (https://www.imf.org/en/Topics/imf-and-covid19/ Policy-Responses-to-COVID-19) 2
Transcript of A Appendix: Policy details

A Appendix Policy details
This section provides details on policy data collection and policy design and implementationWe collected and coded information on all major public health policies and economic policies inthe eight study countries using official government sources Table A1 links to these governmentweb pages as well as general databases we used to cross-check data Our data reflect the amountof aid pledged by governments between March 11 and August 1 2020 therefore discrepanciesmay arise with respect to eventual execution
Table A2 describes major loan and employment programs while Table A3 describes all cashtransfer programs targeted at informal workers These tables show that the majority of aidexpired by late 2020 or early 2021
Table A1 Policy sources
Country Government web pages
Argentina httpswwwargentinagobarcoronavirusmedidas-gobierno
httpswwwargentinagobareconomiamedidas-economicas-COVID19ingresofamiliardeemergencia
httpswwwargentinagobarproduccionmedidas-pymes-covid2
httpswwwboletinoficialgobardetalleAvisoprimera22711320200324
Bolivia httpswwweconomiayfinanzasgobbo
httpswwweconomiayfinanzasgobbo
Brazil httpscalendariobolsafamilia2020netquem-tem-direito-ao-bolsa-familia-2020amp
httpsservicosmtegovbrbem
httpswwwbndesgovbrwpsportalsitehome
httpswwwcaixagovbrcaixacomsuaempresacaixa-e-sebraePaginasdefaultaspx
Colombia httpsidpresidenciagovcoespeciales200317-medidas-enfrentar-coronavirusindexhtml
httpscoronaviruscolombiagovcoCovid19accionesacciones-de-economiahtml
httpswwwmintrabajogovcowebguestinicio
httpsingresosolidariodnpgovco
httpswwwbancoldexcomsoluciones-financieraslineas-de-credito
httpswwwfnggovcoESPaginasUnidos_por_Colombia_FNGaspx
httpscoronaviruscolombiagovcoCovid19accionesacciones-31-marzohtml
Chile httpswwwgobclplaneconomicoemergenciainyeccion
httpswwwtgrclplan-covid-19
httpsprensapresidenciaclcomunicadoaspxid=151422
Mexico httpswwwnafincomportalnfcontentfinanciamientoimpulso-nafin-estadoshtml
httpswwwgobmxsalud
Peru httpswwwgobpebusquedascontenido[]=normasinstitucion[]=mtpereason=sheet
General databasesACAPS COVID-19 Dataset (httpsdatahumdataorgdatasetacaps-covid19-government-measures-dataset)Americas Society Council of the Americas Where is the Coronavirus in Latin America (httpswwwas-coaorgarticleswhere-coronavirus-latin-america)International Monetary Fund Policy Responses to COVID19 (httpswwwimforgenTopicsimf-and-covid19Policy-Responses-to-COVID-19)
2
Table A2 Major small business loan and employment programs
Country Name and description Loan Programs Employment Programs Expiration GDP
Workingcapital
Debtrefi-nancing
Deferredpay-ments
Salarycover-age
Unemploy-mentbenefits
Argentina Asistencia al Trabajo y la Produccion(ATP) reductionpostponement of em-ployer contributions salary paid by the Statefor private sector workers unemploymentbenefits
X X X 2021-01-10(extendedmonthly)
30
Fondo de Garantıas Argentino(FOGAR) tax exemption for bankloans and debts financing for SMEs
X X 2021-03-20 70
Bolivia Programa Especial de Apoyo a La Mi-cro Pequena y Mediana Empresa five-year loans to safeguard employment
X Ongoing 050
Plan de Emergencia de Apoyo al Em-pleo y Estabilidad Laboral credits equiv-alent to two national minimum wages perworker per month for a maximum of twomonths
X X 2020-09-16 066
Brazil Programa Emergencial de Acesso aCredito (PEAC) guarantee program forSMEs that reduced the risk of default for thecredit granting financial institutions
X X 2020-12-31 007
Programa Emergencial de Manutencaodo Emprego e da Renda employmentprogram supporting works with suspendedemployment contracts or reduced hours pro-vides benefit equivalent to what workerwould have received as unemployment insur-ance
X 2020-12-31 071
Programa Emergencial de Suporte aEmpregos loans for SMEs to over payrollfor up to 4 months
X 2020-10-31 047
Credit Lines from SMEs from CaixaEconomica Federal and Sebrae loansfrom state-owned banks for SMEs to coverworking capital
X Ongoing 010
Chile Fondo de Garantıas para Pequenos Em-presarios (FOGAPE) credit line which in-cludes working capital credits equivalent tothree months of sales
X X Until fundsrun out
98
Ley de Proteccion al Empleo seriesof laws which prevents companies from fir-ing workers due to COVID-19 and providesbenefits to unemployed and underemployedworkers
X 2021-12-21
Colombia Colombia Responde loans for businessesin tourist air transport and entertainmentsectors
X X Until fundsrun out
02
Colombia Responde Para Todos loansfor businesses in all sectors besides agricul-ture
X X Until fundsrun out
03
Unidos por Colombia special guaran-tee program for all businesses impacted byCOVID-19
X X Until fundsrun out
98
Dominican Republic Loans from Central Bank short term liq-uidity for SMEs
X Until fundsrun out
30
Fondo de Apoyo Solidario al EmpleadoI y II employment protection program forSMEs which includes unemployment benefitsand salary contributions
X X 2020-07-01 30
Mexico Medidas de Proteccion y Apoyo Unem-ployment insurance for up to three monthsdeferral of monthly payments payroll sup-port membership
X X X 2020-07-30 008
Credito ISSSTE Loans to support re-tirees pensioners and workers affiliatedwith ISSSTE
X 2020-05-05 14
Creditos Solidarios a Palabra Loans fordomestic workers and independent workers
X 2020-06-15 02
Tandas de Bienestar Loans for SMESwho have been excluded from traditional fi-nancial services
X Ongoing 01
Peru Reactiva Peru extensive loan program forsmall medium and large businesses acrossmany sectors
X X 2020-11-30 811
Suspension Perfecta de Labores liquid-ity equivalent to monthly compensation forworkers not working or laid off as a result ofCOVID-19
X 2021-05-05 001
Fondo de Apoyo Empresarial paraMYPEs (FAE-MYPE) creation of guar-antee fund for loans to SMEs
X X 2020-12-31 004
Notes For loan programs expiration date is defined as the last day the program accepted applications rather than theend of the loan forgiveness period for example For employment programs expiration date is defined as the end of theprogram
3
Table A3 Cash transfer programs targeted at informal workers
Country Name Description Automatic Expiration GDP
Argentina Ingreso Familiar de Emergencia (IFE) Transfer for households with a householdhead between 18 and 65 who works in do-mestic service is an informal worker is amonostributista social (categories A and B)or households receiving AUH or Progresarsocial programs household must not have aformal source of labor income or receive anypensions
Yes 2020-08-31 021
Bolivia Bono Universal For adults between ages 18 and 60 whodo not receive any other government trans-fers (for retirement widowhood disability ormeritorious) nor wages from public or pri-vate institutions nor pensions or rents
Yes 2020-08-21 045
Bono Canasta Familiar (BCF) For current beneficiaries of social assistanceprograms who are not formal workers
Yes 2020-08-21 016
Brazil Auxilio Emergencial Transfer for households with a single motheras household head or with individuals whosemain source of income comes from beinginformal workers or self-employed unem-ployed or microentrepeneurs these house-holds must not be beneficiaries of Bolsa Fa-milia
No 2021-01-27 135
Chile Ingreso Familiar de Emergencia Transfer for households whose source of in-come is mainly from informal sources Theamount depends on the number of people inthe household and decreases according to thepercentage of income that is formal pension-ers from Pension Solidaria de la Vejez receivea smaller amount of aid
No 2021-09-07 015
Bono de Emergencia COVID-19 Households with individuals receiving Sub-sidio Familiar (SUF) households in theSistema de Seguridades y Oportunidadesdatabase households who belong to the 60most vulnerable according to the RegistroSocial de Hogares database and householdswho do not have a formal income throughemployment or pension and do not have anySUF beneficiaries This totals to around 3million households
Yes 2020-04-30 008
Colombia Ingreso Solidario Households under extreme poverty povertyor economic vulnerability that do not re-ceive any social program (Familias en accionJovenes en accion Colombia Mayor) but be-long to SISBEN
Yes 2020-11-15 004
Dominican Republic Quedate en Casa 17 billion Dominican pesos in cash transfersto vulnerable households including informalworkers
Yes 2021-05-01 034
Parsquoti Parsquoti is introduced to support independentworkers providing RD 5000 a month to eachbeneficiary in May and June
Yes 2020-12-31 005
Peru Bono YoMeQuedoEnCasa Cash transfer of 380 PEN (later extended to760) for poor families
Yes 30 days post-pandemic
016
Notes We only include policies specifically targeted at informal workers however several transfer programs also could applyto informal workers andor their families such as Colombiarsquos ldquoFamilias en Accionrdquo program or the Dominican RepublicrsquosldquoComer es Primordquo program Mexico neither expanded existing programs nor introduced new transfers for informal workers
B Appendix Survey details
Participants were recruited via Facebook advertisements targeted at business owners in eightcountries in the Latin American region Argentina Bolivia Brazil Colombia Dominican Re-public Mexico and Peru Figure B1 provides a photo of the advertisements used for recruitingfor the survey Advertisements were targeted at people living aged 25 or older and targetedpeople who matched
bull Behaviors Small business owners
bull Employers Business Owner
bull Interests Small Business
bull Job title Owner and Founder
4
Figure B1 Facebook advertisement used for recruitment
We used four instruments in the study
bull A short version of the baseline survey which was used from March 29 to April 19 2020 inthe eight study countries
bull A long version of the baseline survey which was used from April 19 to May 31 2020
bull A first follow-up survey the ldquoJuly Follow-Uprdquo which was used from June 25to August 202020
bull A second follow-up survey the ldquoNovember Follow-Uprdquo which was used from November 5to December 18 2020
There were two versions of the baseline survey The short baseline survey distributed throughFacebook was completed by respondents across the eight countries in the study On April19 2020 we emailed respondents who had completed the short baseline survey and requestedthey complete a longer version of the survey which repeated questions about employment andexpectations and included a broader set of questions with a particular focus on respondentsrsquoaccess to programs For respondents who answered both versions of the survey we reportrespondentsrsquo answers to the longer survey19 We stopped distributing the short version whilewe distributed this longer version to second-time respondents hence the gap in new intake fromApril 19 to May 9 2020 On May 9 2020 we started distributing the longer version on Facebookin six of the eight study countries
The follow-up surveys repeated questions about employment expectations and access toaid and included a comprehensive set of questions about business outcomes Our first follow-upwas completed by 1964 business owners and the second follow-up was completed by 1281 firmowners
19This also allows us a cover a longer time period
5
C Appendix Details on survey respondents
This section provides details on the number of survey respondents over time the geographicdistribution of respondents across the Latin American region distribution of firm size of respon-dents to our survey compared to administrative data and summary statistics for key variables
Table C1 Valid survey responses by week
Week N
Baseline survey
2020-03-29 - 2020-03-31 3 7302020-04-01 - 2020-04-07 13 3062020-04-08 - 2020-04-14 4 0072020-04-15 - 2020-04-21 3 0512020-04-22 - 2020-04-28 2 0162020-04-29 - 2020-05-05 9812020-05-06 - 2020-05-12 3 8722020-05-13 - 2020-05-19 3 1172020-05-20 - 2020-05-26 2722020-05-27 - 2020-05-31 51
July follow up
2020-06-25 - 2020-06-30 5342020-07-01 - 2020-07-07 6732020-07-08 - 2020-07-14 7432020-07-15 - 2020-07-21 5232020-07-22 - 2020-07-28 1 0532020-07-29 - 2020-08-04 2702020-08-05 - 2020-08-10 1802020-08-12 - 2020-08-16 6
November follow up
2020-11-05 - 2020-11-10 5822020-11-11 - 2020-11-17 4212020-11-18 - 2020-11-24 6622020-11-25 - 2020-12-01 4502020-12-02 - 2020-12-07 2452020-12-09 - 2020-12-14 552020-12-16 - 2020-12-18 140
Note Table shows number of valid survey responses by week
6
Figure C1 Distribution of baseline survey across Latin America
Note Figure shows number of valid survey responses by country for the baseline survey
Figure C2 Firm size distribution by week
Note Figure shows the proportion of daily respondents in three size bins based on their FTE employment in January(0-45 employees 5-95 employees 10-50 employees)
7
Figure C3 Firm size distribution survey compared to administrative data
Notes Figure shows the share of firms with fewer than 150 employees in each employment category incountryrsquos administrative data (in light blue) and the survey respondents (in dark blue) Official employmentdata for Argentina and Chile was only available in the 1-85 bin and 9-150 bin Administrative data ondistribution of firm size was not available in Bolivia
8
Table C2 Descriptive statisticsBaseline July follow up November follow up
Mean SD N Mean SD N Mean SD N
Jan FTE employees 683 1165 34 403 621 795 1 968 604 726 1 283Informal firm 031 046 8 196 027 044 1 376 029 045 1 237Sector Manufacturing 004 019 7 840 004 020 1 337 004 019 971Sector Construction 005 022 7 840 005 022 1 337 005 023 971Sector Retail 035 048 7 840 033 047 1 337 035 048 971Sector Services 038 049 7 840 039 049 1 337 038 049 971Sector Other 018 038 7 840 019 040 1 337 018 038 971Firm age 915 1017 7 810 840 877 1 333 819 837 964
Years of education 1463 223 7 932 1481 213 1 341 1486 211 972Female 044 050 7 424 042 049 1 274 043 050 944Age Group 18 - 24 002 014 7 930 001 012 1 341 001 011 971Age Group 25 - 34 025 043 7 930 021 040 1 341 021 041 971Age Group 35 - 49 053 050 7 930 054 050 1 341 053 050 971Age Group 50+ 021 040 7 930 024 043 1 341 025 043 971
Already laid off workers 058 049 33 307 055 050 1 948 067 047 1 158Expect to lay off workers 062 048 30 177 055 050 915 033 047 990Recover two years 068 047 28 763 077 042 1 665 074 044 1 111Expect to recover ever 092 027 28 683 096 021 1 755 095 021 1 109Aware of programs 027 044 28 815 045 050 1 176 048 050 1 238Aware of programs to cover wages 012 032 26 932 034 047 981Aware of subsidized loans 015 035 26 932 039 049 981Expected prob of bankruptcy 050 028 27 608 037 030 1 762 025 030 307Closed 009 029 10 359 006 023 1 953 007 026 1 273Applied 016 036 8 514 044 050 1 727 066 047 702Perc revenue loss 6920 2463 6 780 7039 2555 932 7197 2504 1 194Approve of policies for SMEs 033 047 4 588 028 045 908 027 044 1 047Approve of policies for workers 043 049 4 588 039 049 908 037 048 1 047Gov reaction was appropriate 043 050 4 556 031 046 906 029 046 1 036Received help 005 021 3 184 017 037 1 574 033 047 717
Notes We restrict the analysis to businesses with fewer than 150 FTE employees and we only include respondents whocomplete at least the first question regarding employment in January The first panel shows firm characteristics the secondpanel shows firm ownersrsquo characteristics and the third panel shows outcomes The questions with lower observations countswere only asked in the extended baseline survey The questions on awareness about specific aspects of programs were notasked in the November follow-up survey Not all respondents complete the entire survey
D Appendix Trends over time
This section provides additional results on the evolution of expectations and awareness in theearly months of the pandemic Table D1 is a table version of Figure 2 from the paper FigureD1 shows the evolution of awareness by type of program and firm size The top panel showsthat less than 50 percent of firm owners were aware of any programs to help their businesswhile even fewer were aware of programs that covered wages or offered subsidized loans Thebottom panel shows that there were substantial gaps in awareness across firm size bins at thebeginning of the pandemic as well as marked differences in their evolution over the first threeweeks Businesses with more than five employees were substantially more aware of programsfrom the onset and learned about programs more quickly than smaller firms Tables D2 andD3 are a table versions of Figure D1
9
Table D1 Trends in expectations in first three months of pandemicRecover two years Recover ever Prob bankrupt Expect future layoffs Past layoffs Prop of Jan workers working
Week of March 29 0812lowastlowastlowast 0941lowastlowastlowast 0316lowastlowastlowast 0383lowastlowastlowast 0215lowastlowastlowast 0971lowastlowastlowast
(0070) (0028) (0046) (0083) (0078) (0065)Week of April 1 0769lowastlowastlowast 0936lowastlowastlowast 0349lowastlowastlowast 0396lowastlowastlowast 0329lowastlowastlowast 0837lowastlowastlowast
(0069) (0027) (0045) (0082) (0077) (0064)Week of April 8 0749lowastlowastlowast 0928lowastlowastlowast 0370lowastlowastlowast 0400lowastlowastlowast 0388lowastlowastlowast 0771lowastlowastlowast
(0069) (0027) (0045) (0082) (0078) (0064)Week of April 15 0696lowastlowastlowast 0919lowastlowastlowast 0380lowastlowastlowast 0417lowastlowastlowast 0401lowastlowastlowast 0759lowastlowastlowast
(0069) (0027) (0045) (0082) (0078) (0064)Week of May 6 0797lowastlowastlowast 0965lowastlowastlowast 0323lowastlowastlowast 0349lowastlowastlowast 0383lowastlowastlowast 0828lowastlowastlowast
(0069) (0027) (0046) (0083) (0078) (0064)Week of May 13 0772lowastlowastlowast 0967lowastlowastlowast 0325lowastlowastlowast 0332lowastlowastlowast 0422lowastlowastlowast 0802lowastlowastlowast
(0069) (0027) (0045) (0082) (0078) (0064)N 25085 25007 23971 26727 29387 25830
Notes lowastlowastlowastp lt 001 lowastlowastp lt 005 lowastp lt 01 Note Table shows results from baseline survey between March 29th and May19th The weeks of May 20th and May 27th are omitted All regressions control for a third order polynomial in the numberof full-time equivalent employees in January country dummies years of education dummies gender age group dummiesfirm sector and firm age Decreasing sample size is a result of within-survey attrition
Figure D1 ldquoAre you aware of any state or federal programs that could help your businessrdquo
Note Figure shows results from baseline survey between March 29th and May 19th The weeks of May 20th and May27th are omitted All regressions control for a third order polynomial in the number of full-time equivalent employees inJanuary the day of the week the survey was completed awareness of programs at baseline years of education dummiesgender age group dummies firm sector firm age country dummies and the date the survey was completed The omittedgroup for country is Argentina The omitted group for firm owner age group is 35-39 years old See Table D2 for a tableversion of this figure
10
Table D2 Trends in awareness in first three months of pandemic
Aware of programs Aware of subsidized loans Aware of programs to cover wages
Week of March 29 0363lowastlowastlowast 0167lowastlowast 0240lowastlowastlowast
(0077) (0070) (0067)Week of April 1 0376lowastlowastlowast 0206lowastlowastlowast 0254lowastlowastlowast
(0076) (0069) (0067)Week of April 8 0414lowastlowastlowast 0230lowastlowastlowast 0274lowastlowastlowast
(0076) (0069) (0067)Week of April 15 0435lowastlowastlowast 0263lowastlowastlowast 0292lowastlowastlowast
(0076) (0069) (0067)Week of May 6 0463lowastlowastlowast 0330lowastlowastlowast 0356lowastlowastlowast
(0076) (0069) (0067)Week of May 13 0460lowastlowastlowast 0347lowastlowastlowast 0350lowastlowastlowast
(0077) (0070) (0067)N 24884 23336 23336
Notes lowastlowastlowastp lt 001 lowastlowastp lt 005 lowastp lt 01 Note Table shows results from baseline survey between March 29th and May 19th Theweeks of May 20th and May 27th are omitted All regressions control for a third order polynomial in the number of full-time equivalentemployees in January country dummies years of education dummies gender age group dummies firm sector and firm age Decreasingsample size is a result of within-survey attrition Estimates are based on the response to the question ldquoAre you aware of any federal orstate programs that could help your business during this crisisrdquo and thus may capture a combination of awareness of the program aswell as comprehension of how the program works who is eligible and how to apply
Table D3 Trends in awareness in first three months of pandemic by firm size
0-45 FTE 5+ FTE
Week of March 29 0159lowast 0612lowastlowastlowast
(0094) (0112)Week of April 1 0165lowast 0643lowastlowastlowast
(0093) (0110)Week of April 8 0207lowastlowast 0668lowastlowastlowast
(0093) (0111)Week of April 15 0222lowastlowast 0702lowastlowastlowast
(0093) (0111)Week of May 6 0265lowastlowastlowast 0709lowastlowastlowast
(0093) (0111)Week of May 13 0250lowastlowastlowast 0718lowastlowastlowast
(0093) (0110)N 15065 9897
Notes lowastlowastlowastp lt 001 lowastlowastp lt 005 lowastp lt 01 Note Table shows results from baseline survey between March 29th and May19th The weeks of May 20th and May 27th are omitted All regressions control for a third order polynomial in the numberof full-time equivalent employees in January country dummies years of education dummies gender age group dummiesfirm sector and firm age Decreasing sample size is a result of within-survey attrition Estimates are based on the responseto the question ldquoAre you aware of any federal or state programs that could help your business during this crisisrdquo andthus may capture a combination of awareness of the program as well as comprehension of how the program works who iseligible and how to apply
E Appendix Principal Component Analysis
This section provides details on our use of Principal Component Analysis (PCA) for dimensionreduction of results We use reduce ten individual outcomes from the baseline sample to threeindexes expectations outcomes and approval The ldquoExpectation indexrdquo is composed of ques-tions about recovery future layoffs and future closure or bankruptcy the ldquoOutcome indexrdquo iscomposed of questions about revenue loss past layoffs and permanent closure and the ldquoAp-proval indexrdquo is composed of questions about approval of policies for SMEs workers and the
11
governmentrsquos overall response Table E1 shows the rotation of each variable at baseline Weproject the July and November samples onto the baseline PCA
Table E2 shows the indexes created by averaging z-scores of the individual outcomes ratherthan by PCA As expected we find similar though smaller coefficients on the association betweenreceiving aid and expectations outcomes and approval In addition we see the same trendsemerge receiving aid was associated with the largest improvements in expectations in the short-term improvements in outcomes and expectations were driven by firms with more than fiveemployees and the association between receiving aid and improved outcomes and expectationswas weakest in November
Table E1 Rotation of baseline variables for PCAExpectations Outcomes Approval
Recover two years -0538Recover ever -0486Expect future layoffs 0423Prob bankruptcy 0544Perc revenue loss 0579Past layoffs 0609Permanently closed 0542Approve of SME programs -0633Approve of programs for workers -0644Gov response was appropriate -0430
Note Table shows the rotation of baseline variables within each index
Table E2 Indexes using with average of standardized outcomesAll 0-45 FTE 5+ FTE
April July Nov April July Nov April July Nov
Expectation index (avg) 0186lowastlowastlowast 0210lowastlowastlowast 0124lowastlowast 0184lowast 0183lowastlowastlowast 0012 0190lowastlowast 0248lowastlowastlowast 0186lowastlowast
(0062) (0049) (0060) (0095) (0068) (0085) (0084) (0072) (0094)Outcome index (avg) 0065 0201lowastlowastlowast 0136lowastlowast 0117lowast 0090lowast 0046 0024 0287lowastlowastlowast 0137lowast
(0047) (0037) (0056) (0067) (0053) (0086) (0061) (0053) (0077)Approval index (avg) 0393lowastlowastlowast 0206lowastlowastlowast 0282lowastlowastlowast 0569lowastlowastlowast 0036 0073 0255lowastlowast 0316lowastlowastlowast 0469lowastlowastlowast
(0090) (0056) (0073) (0132) (0071) (0103) (0118) (0086) (0105)
Number of respondents 3179 1572 717 1823 945 404 1356 627 313
Notes lowastlowastlowastp lt 001 lowastlowastp lt 005 lowastp lt 01 The first three columns show results for the full sample while the remainingcolumns show results conditional on firm size bins All regressions control for a third order polynomial in the number ofFTE employees in January awareness of programs at baseline years of education dummies gender age group dummiesfirm sector firm age country dummies and the date the survey was completed The ldquoExpectation indexrdquo is composed ofquestions about recovery future layoffs and future closure or bankruptcy the ldquoOutcome indexrdquo is composed of questionsabout revenue loss past layoffs and permanent closure and the ldquoApproval indexrdquo is composed of questions about approvalof policies for SMEs workers and the governmentrsquos overall response
F Appendix Additional results related to access to aid
This section provides additional results to supplement the analysis of who applied for aid andthe benefits associated with receiving aid Tables F2 F1 and F3 supplement Table 2 fromthe paper The first repeats the analysis in the main paper with additional controls for thenumber of cases and deaths per million people in the country at the time of the study as wellas government stringency The second repeats the analysis but with four size bins for firmsseparating firms with no employees in January from the 0 to 45 group The third restricts thesample to respondents who completed at least one of the follow-up surveys
Tables F4 F5 and F3 show the individual outcomes associated with each index in Table 3as well as provide robustness Table F5 extends Table 3 by controlling for the number of casesand deaths per million people in the country at the time of the study as well as government
12
stringency Table F3 restricts the analysis to the sub-sample who completed the original baselinesurvey and then completed either of the the follow-up surveys
Table F1 Access to aid and firm characteristics (four employment groups)Aware of programs Applied Received help
April July Nov April July Nov April July Nov
0 FTE minus0079lowastlowast minus0008 minus0298lowastlowastlowast minus0099lowastlowastlowast minus0166lowastlowast minus0200 minus0013 minus0146lowastlowastlowast minus0121(0033) (0087) (0097) (0025) (0067) (0135) (0026) (0054) (0111)
05-45 FTE minus0086lowastlowastlowast minus0101lowastlowast minus0168lowastlowastlowast minus0074lowastlowastlowast minus0118lowastlowastlowast minus0165lowastlowastlowast minus0028lowastlowast minus0133lowastlowastlowast minus0274lowastlowastlowast
(0015) (0043) (0040) (0013) (0034) (0048) (0012) (0030) (0050)5-95 FTE minus0032lowast minus0024 minus0130lowastlowastlowast minus0034lowastlowast minus0068lowast minus0084 minus0031lowastlowast minus0103lowastlowastlowast minus0136lowastlowast
(0017) (0046) (0044) (0014) (0038) (0052) (0013) (0034) (0056)Informal minus0080lowastlowastlowast minus0087lowastlowast minus0149lowastlowastlowast minus0035lowastlowastlowast minus0150lowastlowastlowast minus0126lowastlowast minus0006 minus0082lowastlowastlowast minus0091lowastlowast
(0014) (0037) (0035) (0009) (0033) (0057) (0008) (0021) (0045)Years of schooling 0020lowastlowastlowast 0018lowastlowast 0001 0005lowastlowastlowast 0006 minus0001 0007lowastlowastlowast 0012lowastlowast 0009
(0003) (0007) (0008) (0002) (0007) (0011) (0002) (0005) (0010)Aware of programs (April) 0322lowastlowastlowast 0219lowastlowastlowast 0185lowastlowastlowast 0157lowastlowastlowast 0054 0076lowastlowastlowast 0113lowastlowastlowast 0093lowastlowast
(0033) (0033) (0009) (0028) (0039) (0008) (0023) (0038)Recover in two years (April) 0060lowastlowastlowast 0060lowast 0031 minus0008 minus0008 0051 0007 0010 minus0001
(0011) (0032) (0033) (0009) (0026) (0043) (0008) (0020) (0041)
Mean 0349 0451 0477 0156 0441 0661 0045 0168 0331N 8426 1027 1091 7643 1567 635 3184 1453 648
Notes lowastlowastlowastp lt 001 lowastlowastp lt 005 lowastp lt 01 All regressions control for day of week country dummies and the date thesurvey was completed All regressions also include controls for industry age dummies firm age and gender but coefficientswere largely not statistically significant nor large and are not displayed as they largely did not predict the outcomes Theomitted category for firm-size bins is firms with 10-150 FTE employees
Table F2 Access to aid and firm characteristics (additional controls)Aware of programs Applied Received help
April July Nov April July Nov April July Nov
0-45 FTE minus0064lowastlowastlowast minus0080lowastlowastlowast minus0095lowastlowastlowast minus0054lowastlowastlowast minus0079lowastlowastlowast minus0120lowastlowastlowast minus0009 minus0072lowastlowastlowast minus0191lowastlowastlowast
(0011) (0030) (0031) (0009) (0025) (0040) (0008) (0020) (0039)Informal minus0085lowastlowastlowast minus0087lowastlowast minus0152lowastlowastlowast minus0036lowastlowastlowast minus0154lowastlowastlowast minus0129lowastlowast minus0007 minus0083lowastlowastlowast minus0091lowastlowast
(0014) (0037) (0035) (0009) (0033) (0057) (0008) (0021) (0045)Years of schooling 0020lowastlowastlowast 0019lowastlowast 0002 0006lowastlowastlowast 0007 minus00002 0008lowastlowastlowast 0012lowastlowast 0009
(0003) (0007) (0008) (0002) (0007) (0011) (0002) (0005) (0010)Aware of programs (April) 0323lowastlowastlowast 0225lowastlowastlowast 0185lowastlowastlowast 0161lowastlowastlowast 0053 0077lowastlowastlowast 0114lowastlowastlowast 0091lowastlowast
(0034) (0033) (0009) (0028) (0040) (0008) (0023) (0039)Recover in two years (April) 0061lowastlowastlowast 0060lowast 0025 minus0008 minus0011 0045 0007 0004 minus0006
(0011) (0032) (0033) (0009) (0026) (0043) (0008) (0021) (0041)
Mean 0349 0451 0477 0156 0441 0661 0045 0168 0331N 8426 1027 1091 7643 1567 635 3184 1453 648
Notes lowastlowastlowastp lt 001 lowastlowastp lt 005 lowastp lt 01 All regressions control for day of week country dummies the date the survey wascompleted total COVID-19 cases per million people by country total COVID-19 deaths per million people by country andgovernment stringency by country All regressions also include controls for industry age dummies firm age and genderbut coefficients were largely not statistically significant nor large and are not displayed as they largely did not predict theoutcomes The omitted category for firm-size bins is firms with 5-150 FTE employees
13
Table F3 Access to aid and firm characteristics (balanced panel)Aware of programs Applied Received help
April July Nov April July Nov April July Nov
0-45 FTE minus0067lowastlowast minus0080lowastlowastlowast minus0095lowastlowastlowast minus0058lowastlowast minus0080lowastlowastlowast minus0120lowastlowastlowast 0001 minus0072lowastlowastlowast minus0191lowastlowastlowast
(0031) (0030) (0031) (0024) (0025) (0040) (0016) (0020) (0039)Informal minus0092lowastlowastlowast minus0087lowastlowast minus0155lowastlowastlowast minus0031 minus0153lowastlowastlowast minus0131lowastlowast minus0008 minus0083lowastlowastlowast minus0092lowastlowast
(0035) (0037) (0035) (0022) (0033) (0057) (0017) (0022) (0045)Years of schooling 0031lowastlowastlowast 0019lowastlowast 0002 0006 0007 minus0001 0008lowastlowast 0012lowastlowast 0009
(0007) (0007) (0008) (0006) (0007) (0011) (0004) (0005) (0010)Aware of programs (May) 0320lowastlowastlowast 0221lowastlowastlowast 0189lowastlowastlowast 0159lowastlowastlowast 0056 0065lowastlowastlowast 0114lowastlowastlowast 0093lowastlowast
(0033) (0033) (0025) (0028) (0039) (0016) (0023) (0038)Recover in two years (May) 0029 0060lowast 0022 minus0031 minus0012 0046 minus0008 0004 minus0005
(0033) (0032) (0033) (0025) (0026) (0043) (0018) (0021) (0041)
Mean 0322 0451 0477 0171 0441 0661 0048 0168 0331N 1068 1027 1091 1057 1567 635 798 1453 648
Notes lowastlowastlowastp lt 001 lowastlowastp lt 005 lowastp lt 01 The baseline sample is restricted to respondents who completed either of thefollow-up surveys and were in the control group All regressions control for day of week country dummies and the date thesurvey was completed All regressions also include controls for industry age dummies firm age and gender but coefficientswere largely not statistically significant nor large and are not displayed as they largely did not predict the outcomes Theomitted category for firm-size bins is firms with 5-150 FTE employees
Table F4 Access to aid and expectations outcomes and approval of government policies (fullresults)
All 0-45 FTE 5+ FTE
April July Nov April July Nov April July Nov
Expectation index 0272lowastlowastlowast 0290lowastlowastlowast 0176lowastlowast 0267lowast 0247lowastlowast 0032 0279lowastlowast 0349lowastlowastlowast 0243lowast
(0093) (0069) (0086) (0142) (0096) (0120) (0125) (0101) (0134)Recover in two years 0046 0063lowastlowast 0027 0040 0029 0006 0056 0116lowastlowastlowast 0020
(0035) (0030) (0038) (0052) (0043) (0055) (0049) (0044) (0054)Recover ever 0001 0019 0045lowastlowast minus0016 0030lowast 0019 0011 0007 0062lowastlowast
(0019) (0013) (0019) (0032) (0015) (0028) (0023) (0022) (0029)Expect future layoffs minus0141lowastlowastlowast minus0152lowastlowastlowast minus0040 minus0173lowastlowast minus0183lowastlowastlowast minus0020 minus0125lowastlowast minus0139lowastlowast minus0060
(0044) (0046) (0042) (0068) (0068) (0063) (0057) (0068) (0060)Prob of closure or bankruptcy minus0076lowastlowastlowast minus0089lowastlowastlowast 0024 minus0083lowastlowast minus0062lowastlowast 0110 minus0071lowastlowast minus0121lowastlowastlowast minus0012
(0022) (0020) (0049) (0032) (0030) (0076) (0032) (0026) (0093)
Outcome index 0104 0338lowastlowastlowast 0211lowastlowast 0188lowast 0152lowast 0074 0037 0482lowastlowastlowast 0201lowast
(0075) (0063) (0089) (0107) (0089) (0137) (0098) (0089) (0122)Perc rev loss (Mar-Sep) minus2707 minus11112lowastlowastlowast minus4129lowast minus3889 minus1632 minus0857 minus2247 minus17768lowastlowastlowast minus4839
(2022) (2775) (2463) (3008) (4389) (3734) (2796) (3721) (3546)Past layoffs minus0039 minus0110lowastlowastlowast minus0029 minus0082 minus0084lowast minus0032 0006 minus0115lowastlowast 0047
(0042) (0035) (0040) (0058) (0047) (0061) (0054) (0049) (0053)Permanently closed 0000 minus0017lowastlowastlowast minus0050lowastlowastlowast 0000 minus0013lowastlowast minus0010 0000 minus0019lowast minus0088lowastlowastlowast
(0000) (0006) (0019) (0000) (0006) (0027) (0000) (0012) (0027)
Approval index 0485lowastlowastlowast 0273lowastlowastlowast 0375lowastlowastlowast 0716lowastlowastlowast 0052 0109 0305lowastlowast 0415lowastlowastlowast 0600lowastlowastlowast
(0113) (0072) (0093) (0166) (0091) (0133) (0146) (0109) (0135)Approve of SME policies 0158lowastlowastlowast 0233lowastlowastlowast 0199lowastlowastlowast 0277lowastlowastlowast 0090 0112lowast 0058 0314lowastlowastlowast 0279lowastlowastlowast
(0047) (0051) (0045) (0065) (0072) (0066) (0061) (0071) (0067)Approve of policies for workers 0162lowastlowastlowast 0148lowastlowastlowast 0127lowastlowastlowast 0231lowastlowastlowast 0001 0019 0107lowast 0207lowastlowastlowast 0216lowastlowastlowast
(0044) (0054) (0049) (0062) (0073) (0069) (0059) (0075) (0072)Gov reaction was appropriate 0132lowastlowastlowast 0041 0061 0159lowastlowast minus0047 minus0034 0101 0072 0190lowastlowastlowast
(0046) (0048) (0046) (0065) (0066) (0062) (0063) (0071) (0066)
Number of respondents 3184 1607 717 1825 964 404 1356 643 313
Notes lowastlowastlowastp lt 001 lowastlowastp lt 005 lowastp lt 01 The first three columns show results for the full sample while the remainingcolumns show results conditional on firm size bins All regressions control for a third order polynomial in the number ofFTE employees in January awareness of programs at baseline years of education dummies gender age group dummiesfirm sector firm age country dummies and the date the survey was completed Missing values have been imputed basedon data after April 19 2020 when we began asking firm owners if they had received aid
14
Table F5 Access to aid and expectations outcomes and approval of government policies (fullresults with additional controls)
All 0-45 FTE 5+ FTE
April July Nov April July Nov April July Nov
Expectation index 0274lowastlowastlowast 0289lowastlowastlowast 0172lowastlowast 0267lowast 0245lowastlowast 0031 0283lowastlowast 0342lowastlowastlowast 0252lowast
(0092) (0069) (0086) (0141) (0096) (0124) (0123) (0102) (0133)Recover in two years 0048 0062lowastlowast 0026 0040 0028 0006 0058 0114lowastlowastlowast 0022
(0036) (0030) (0038) (0052) (0044) (0057) (0049) (0044) (0053)Recover ever 0001 0019 0044lowastlowast minus0015 0029lowast 0016 0012 0004 0065lowastlowast
(0019) (0013) (0019) (0031) (0015) (0028) (0022) (0022) (0029)Expect future layoffs minus0141lowastlowastlowast minus0152lowastlowastlowast minus0041 minus0175lowastlowast minus0183lowastlowastlowast minus0034 minus0125lowastlowast minus0143lowastlowast minus0062
(0044) (0047) (0042) (0068) (0069) (0063) (0057) (0068) (0061)Prob of closure or bankruptcy minus0077lowastlowastlowast minus0089lowastlowastlowast 0022 minus0082lowastlowast minus0062lowastlowast 0134lowast minus0072lowastlowast minus0120lowastlowastlowast minus0070
(0022) (0020) (0050) (0032) (0030) (0080) (0031) (0026) (0097)
Outcome index 0100 0337lowastlowastlowast 0207lowastlowast 0179lowast 0154lowast 0070 0036 0467lowastlowastlowast 0198(0076) (0063) (0089) (0109) (0089) (0137) (0098) (0089) (0124)
Perc rev loss (Mar-Sep) minus2543 minus11156lowastlowastlowast minus4139lowast minus3649 minus1798 minus1072 minus2141 minus17206lowastlowastlowast minus4934(2029) (2765) (2471) (3046) (4402) (3825) (2802) (3680) (3585)
Past layoffs minus0038 minus0110lowastlowastlowast minus0027 minus0078 minus0084lowast minus0023 0006 minus0110lowastlowast 0050(0042) (0035) (0040) (0057) (0047) (0060) (0054) (0049) (0054)
Permanently closed 0000 minus0017lowastlowastlowast minus0049lowastlowastlowast 0000 minus0013lowastlowast minus0009 0000 minus0018 minus0088lowastlowastlowast
(0000) (0006) (0019) (0000) (0006) (0027) (0000) (0012) (0027)
Approval index 0488lowastlowastlowast 0270lowastlowastlowast 0372lowastlowastlowast 0711lowastlowastlowast 0047 0096 0314lowastlowast 0405lowastlowastlowast 0612lowastlowastlowast
(0114) (0072) (0093) (0166) (0090) (0136) (0149) (0109) (0134)Approve of SME policies 0160lowastlowastlowast 0232lowastlowastlowast 0197lowastlowastlowast 0279lowastlowastlowast 0084 0098 0062 0310lowastlowastlowast 0281lowastlowastlowast
(0047) (0051) (0045) (0065) (0072) (0067) (0063) (0071) (0067)Approve of policies for workers 0162lowastlowastlowast 0147lowastlowastlowast 0125lowastlowastlowast 0225lowastlowastlowast minus00002 0007 0114lowast 0205lowastlowastlowast 0218lowastlowastlowast
(0045) (0053) (0048) (0063) (0073) (0070) (0061) (0074) (0071)Gov reaction was appropriate 0134lowastlowastlowast 0038 0061 0156lowastlowast minus0050 minus0020 0106lowast 0063 0194lowastlowastlowast
(0046) (0048) (0046) (0065) (0067) (0062) (0063) (0070) (0065)
Number of respondents 3184 1607 717 1825 964 404 1356 643 313
Notes lowastlowastlowastp lt 001 lowastlowastp lt 005 lowastp lt 01 All regressions control for a third order polynomial in the number of full-timeequivalent employees in January the day of the week the survey was completed awareness of programs at baseline yearsof education dummies gender age group dummies firm sector firm age country dummies and the date the survey wascompleted Compared to Table 3 this table additionally controls for total COVID-19 cases per million people by countrytotal COVID-19 deaths per million people by country and government stringency by country Missing values have beenimputed based on data after April 19 2020 when we began asking firm owners if they had received aid
15
Table F6 Access to aid and expectations outcomes and approval of government policies (balancedpanel of full results)
All 0-45 FTE 5+ FTE
April July Nov April July Nov April July Nov
Expectation index 0225 0290lowastlowastlowast 0176lowastlowast 0558lowastlowastlowast 0247lowastlowast 0032 minus0192 0349lowastlowastlowast 0243lowast
(0186) (0069) (0086) (0184) (0096) (0120) (0335) (0101) (0134)Recover in two years minus0022 0063lowastlowast 0027 0094 0029 0006 minus0178 0116lowastlowastlowast 0020
(0075) (0030) (0038) (0086) (0043) (0055) (0130) (0044) (0054)Recover ever 0036 0019 0045lowastlowast 0037 0030lowast 0019 0029 0007 0062lowastlowast
(0034) (0013) (0019) (0024) (0015) (0028) (0074) (0022) (0029)Expect future layoffs minus0055 minus0152lowastlowastlowast minus0040 minus0209 minus0183lowastlowastlowast minus0020 0040 minus0139lowastlowast minus0060
(0092) (0046) (0042) (0135) (0068) (0063) (0128) (0068) (0060)Prob of closure or bankruptcy minus0077lowast minus0089lowastlowastlowast 0024 minus0146lowastlowastlowast minus0062lowastlowast 0110 0020 minus0121lowastlowastlowast minus0012
(0043) (0020) (0049) (0049) (0030) (0076) (0075) (0026) (0093)
Outcome index 0200 0338lowastlowastlowast 0211lowastlowast 0134 0152lowast 0074 0238 0482lowastlowastlowast 0201lowast
(0161) (0063) (0089) (0231) (0089) (0137) (0237) (0089) (0122)Perc rev loss (Mar-Sep) minus7011lowast minus11112lowastlowastlowast minus4129lowast minus4993 minus1632 minus0857 minus8082 minus17768lowastlowastlowast minus4839
(4231) (2775) (2463) (5692) (4389) (3734) (7260) (3721) (3546)Past layoffs minus0016 minus0110lowastlowastlowast minus0029 minus0007 minus0084lowast minus0032 minus0022 minus0115lowastlowast 0047
(0085) (0035) (0040) (0113) (0047) (0061) (0123) (0049) (0053)Permanently closed 0000 minus0017lowastlowastlowast minus0050lowastlowastlowast 0000 minus0013lowastlowast minus0010 0000 minus0019lowast minus0088lowastlowastlowast
(0000) (0006) (0019) (0000) (0006) (0027) (0000) (0012) (0027)
Approval index 0615lowastlowastlowast 0273lowastlowastlowast 0375lowastlowastlowast 0744lowastlowastlowast 0052 0109 0484 0415lowastlowastlowast 0600lowastlowastlowast
(0223) (0072) (0093) (0289) (0091) (0133) (0352) (0109) (0135)Approve of SME policies 0235lowastlowastlowast 0233lowastlowastlowast 0199lowastlowastlowast 0269lowastlowast 0090 0112lowast 0191 0314lowastlowastlowast 0279lowastlowastlowast
(0089) (0051) (0045) (0117) (0072) (0066) (0129) (0071) (0067)Approve of policies for workers 0171lowastlowast 0148lowastlowastlowast 0127lowastlowastlowast 0173lowast 0001 0019 0179 0207lowastlowastlowast 0216lowastlowastlowast
(0079) (0054) (0049) (0102) (0073) (0069) (0125) (0075) (0072)Gov reaction was appropriate 0114 0041 0061 0168lowast minus0047 minus0034 0034 0072 0190lowastlowastlowast
(0080) (0048) (0046) (0100) (0066) (0062) (0130) (0071) (0066)
Number of respondents 798 1607 717 486 964 404 312 643 313
Notes lowastlowastlowastp lt 001 lowastlowastp lt 005 lowastp lt 01 Compared to Table 3 the baseline sample is restricted to respondents whocompleted either of the follow-up surveys and were in the control group All regressions control for a third order polynomialin the number of full-time equivalent employees in January the day of the week the survey was completed awareness ofprograms at baseline years of education dummies gender age group dummies firm sector firm age country dummies andthe date the survey was completed The omitted category for firm-size bins is firms with 5-150 FTE employees Missingvalues have been imputed based on data after April 19 2020 when we began asking firm owners if they had received aid
16
G Appendix Applications to specific programs
This section provides details on applications to specific programs Of the roughly 2800 respon-dents of the July follow-up survey 936 (32 percent) filled out information about applicationsand outcomes of specific programs20 The vast majority (85 percent) of firms that responded tothis section of the survey are formal Overall 75 percent of firms who report applying or signingup for a relief program do so only for one About 18 percent applied to two programs It is rare(lt8 percent) that firms apply to three or more programs Table G2 shows the programs thereceived the most applications by country Table G1 breaks down the number of applicationsby formality status
There are 205 firms with information about the time to hear back about the programs towhich they applied Figure G1 shows the average time to hear back from programs conditionalon applying If a respondent applied to more than one program their wait time was averagedOn average firms with more than five employees experienced longer wait times This differencewas largely driven by applications to loan programs
Table G1 Number of applications by formality status
N of programs Formal Informal Total
1 578 121 6992 154 12 1663 41 1 424 21 1 225 3 2 56 2 0 2
Total 799 137 936
Note Table shows number of applications by formality status where formality status is determined by making socialsecurity contributions
Table G2 Programs that received the most applications by country
Country Program N
Argentina Programa de Asistencia de Emergencia al Trabajo y la Produccion 16
Bolivia Programa Especial de Apoyo a la Micro Pequena y Mediana Empresa 10
Brazil Programa Emergencial de Acesso a Credito 77BNDES Credito Pequenas Empresa 62Programa Emergencial de Manutencao do Emprego e da Renda 33
Chile Ampliacion FOGAPE 167Suspension del contrato de trabajo por acto de autoridad 59Pacto de suspension del contrato de trabajo 53
Colombia Subsidio del gobierno para pagar nominas 109
Dominican Republic Parsquo Ti 21
Mexico Creditos solidarios a palabra 107
Peru Reactiva Peru 91Fae-MYPE 31
Note Table shows the programs the received the most applications in each country For additional details on theseprograms see Tables A2 and A3
20Respondents were shown this part of the survey if they reported submitting an application or trying to submitone
17
Figure G1 Number of days to hear back by firm size
Note The left plot shows number of days to hear back by firm size The center and right plots break out trendsby program type
H Appendix Testimonials
How has COVID-19 affected your business
ldquoOn one hand our sales were affected because people are more reluctant to spend and onthe other hand because itrsquos impossible to make shipments due to the mandatory quarantinerdquo(Argentina April 10 2020)
ldquoWe are a small business supplying goods for the hotel and restaurant industry in ChileDue to COVID-19 ALL of my clients have closed their doors until July 1 at least My suppliersin China have increased their prices exorbitantly and there is no transportation to ship themerchandise Also the United States is confiscating essential merchandise (masks etc) thatpass through its ports which makes it impossible to import them and adapt to what that themarket is buyingrdquo (Chile April 11 2020)
What could the government do to help businesses like yours
ldquoI think an ideal initiative would be to give out credit to SMEs with 0 percent interest toincentivize production Or make competitive funds availablerdquo (Bolivia April 3 2020)
ldquoIn my case I can access loans to obtain more capital however there are many prerequisitesthe time until disbursement is too long and the interest is too highrdquo (Bolivia April 5 2020)
Please explain in your own words how your was experience looking for or applyingfor assistance programs
ldquoThere are programs sponsored by SERCOTEC CORFO SENCE I applied to the one bySERCOTEC along with other 60000 other firms I was rejected and the justification was a lie(that I did not enter my tax information) In practice they gave out less than 3000 creditsand the other 57000 firms were turned down Itrsquos funny that they do so much advertisingencouraging us to participaterdquo (Chile July 7 2020)
ldquoA total frustration We are a small firm banks give Reactiva Peru loans to medium andlarge firms because our annual output seems too low to them Also other banks required usto have outstanding debt with them or an active account with them Unfortunately there is noone we can go to complain or appealrdquo (Peru July 1 2020)
18
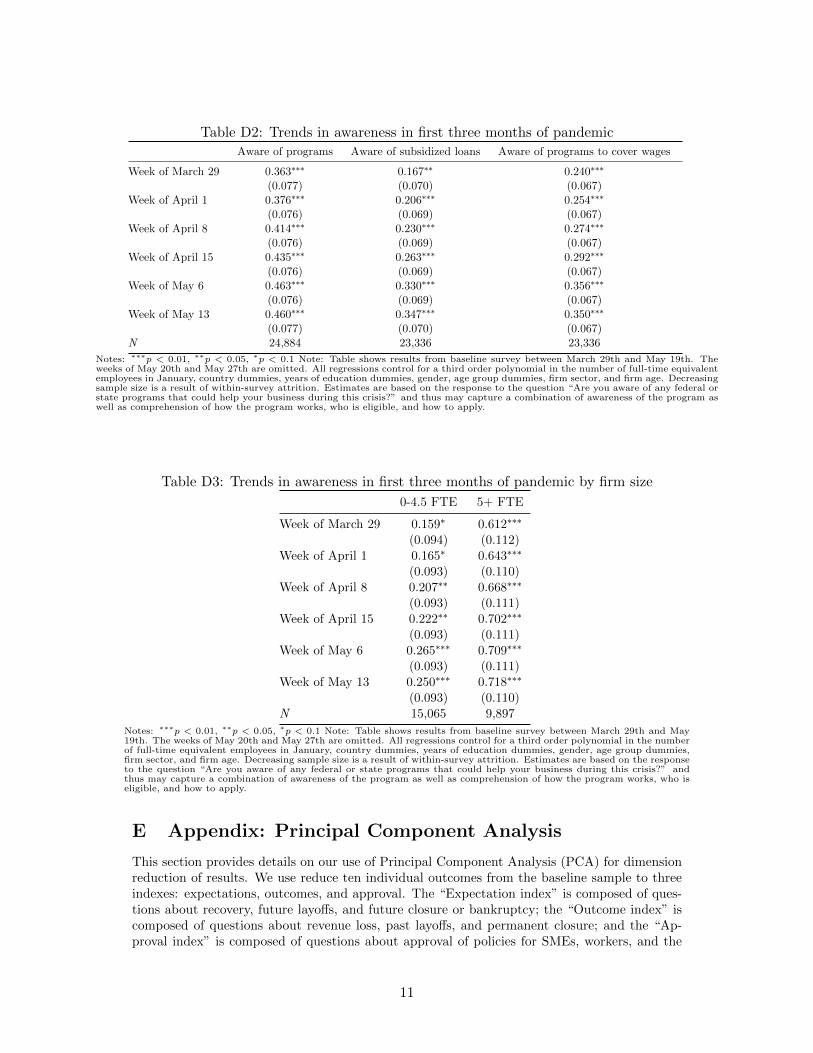