Appendix 3.18-A, RIMS II Modeling Details
17
Appendix 3.17-A APPENDIX 3.17-A: RIMS II MODELING DETAILS California High-Speed Rail Authority July 2020 San Francisco to San Jose Project Section Draft EIR/EIS
Transcript of Appendix 3.18-A, RIMS II Modeling Details

Appendix 3.17-A
APPENDIX 3.17-A: RIMS II MODELING DETAILS
California High-Speed Rail Authority July 2020
San Francisco to San Jose Project Section Draft EIR/EIS

Appendix 3.17-A
California High-Speed Rail Authority July 2020
San Francisco to San Jose Project Section Draft EIR/EIS Page | 3.17-A-1
APPENDIX 3.17-A: REGIONAL INPUT-OUTPUT MODELING SYSTEM II MODELING DETAILS Summary of Findings This appendix presents the results of the Regional Input-Output Modeling System (RIMS II) modeling analysis supporting the analysis presented in Section 3.17, Regional Growth. Overall, this study finds that development and operation of the California High-Speed Rail (HSR) System in the San Francisco to San Jose Project Section (Project Section, or project) would have a positive economic effect on the resource study area (RSA) composed of San Francisco, San Mateo, and Santa Clara Counties. The results reported herein are those obtained at the time the analysis was completed, and reflect the estimates of costs, projected construction schedule and other modeling inputs for the project available at that time, including those provided in Appendix 6-A, San Francisco to San Jose Project Section: PEPD Record Set Capital Cost Estimate Report. For purposes of this modeling analysis, this Project Section extends from 4th and King Street in San Francisco to West Alma Avenue in San Jose, and includes the San Jose Diridon Station Approach Subsection. This subsection has been evaluated in the Draft Environmental Impact Report/Environmental Impact Statements for both the San Francisco to San Jose Project Section and the San Jose to Merced Project Section. The inclusion of this subsection has been assumed during both the construction phase and the operations and maintenance phase, so that the anticipated construction schedule for the San Jose Diridon Station Approach Subsection is included in the modeling analyses for both the San Francisco to San Jose Project Section and the San Jose to Merced Project Section. The estimate of total economic effect, including direct and multiplier effects from the construction phase, is approximately $1.11 billion to $1.95 billion in the region, depending on the project alternative, measured in constant 2018 dollars. Alternative B (Viaduct to Scott Boulevard) would yield the highest regional economic impact, roughly 76 percent greater than Alternative A, which would have the lower cost and employment impact. The estimate for direct spending for construction labor and materials in the RSA ranges from $765 million to $1.35 billion, and the remaining spending represents “indirect” spending on labor and materials by companies in the supply chain for construction (e.g., wholesalers of concrete or lessors of construction equipment), as well as induced spending in industries required to serve the households of construction and indirect labor workers (e.g., retail, entertainment, healthcare). During the peak year of construction (2024), direct spending is estimated to support between 710 and 1,240 construction-related job-years,1 depending on the project alternative. By 2040, ongoing project operations would support an estimated $146 million per year in economic activity within the regional economy. This economic activity would represent direct spending by the California High-Speed Rail Authority (Authority) on labor and materials for operations and maintenance, as well as indirect spending by supply-chain industries and induced spending in household-serving industries. Once Phase I is operational, the project is projected to support an estimated 910 jobs annually in the RSA, including about 380 workers directly employed by the Authority or its vendors. Spending and employment associated with operations would not vary substantially among the three project alternatives because of similar guideway lengths and the same number of stations and maintenance facilities.
Analysis Framework and Approach The economic impacts calculated and reported in this appendix are directly linked to spending attributable to the project and are considered using the accepted economic metrics of economic output, employment, and employee compensation. Project-related expenditures on goods and services from within the regional economy would create a multiplier effect as local and regional businesses that supply inputs to production generate successive rounds of spending.
1 One job-year is equivalent to one job held by one person over one year’s duration.

Appendix 3.17-A
July 2020 California High-Speed Rail Authority
3.17-A-2 | Page San Francisco to San Jose Project Section Draft EIR/EIS
Employment supported by the project would also generate a multiplier effect through household spending in the regional economy.
Input-Output Analysis Overview Input-Output (I/O) analysis is based on the concept that industries in a geographic region are interdependent and thus the total contribution of any one establishment’s activity is larger than its individual (direct) output or employment. Consequently, an establishment’s economic activity has a multiplier effect that generates successive rounds of spending and output in other economic sectors within a particular region. For example, construction firms purchase goods from producers, who in turn purchase raw materials from suppliers. Thus, an increase or decrease in the demand for construction supplies would stimulate an increase or decrease in output and employment in interdependent secondary industries. Regional economic impact analysis and I/O models in particular provide a means to quantify economic effects stemming from a particular industry or economic activity. I/O models produce quantitative estimates of the magnitude of regional economic activity resulting from some initial activity. I/O models rely on economic multipliers that mathematically represent the relationship between the initial change in one sector of the economy and the effect of that change on employment, income, economic output, and value added in other regional industries. These economic data provide a quantitative estimate of the magnitude of shifts in jobs and revenues within a regional economy.
The analysis begins with an estimate of the initial economic input associated with project expenditures on capital investment and operations in the regional economy. These initial inputs are referred to as the direct effect. Next, the I/O model quantifies the impacts associated with the multiplier effects that result from that initial economic input. Multiplier effects include indirect or induced effects. Indirect effects represent economic impacts on suppliers while induced effects represent economic impacts on household income and spending. In this report, direct, indirect, and induced effects are defined as follows:
• Direct effect—The economic value of the initial input of spending into the economy made by the Authority.
• Indirect effect—The economic value of “upstream” industry-to-industry transactions that supply inputs to the production of goods and services consumed by the Authority.
• Induced effect—The economic value of labor income that recirculates in the economy as a result of the initial expenditures made by the Authority.
• Total impact—The sum of the direct, indirect, and induced effects. The total impact measures the overall impact of project activities within the regional economy.
This analysis measures economic significance using common economic metrics, including output, employment, and employee compensation:
• Employment—Equivalent to jobs, a headcount that includes part-time and full-time workers.
• Employee compensation—Payments to labor in the form of income (i.e., wages and salaries) and fringe benefits paid by the employer (e.g., health insurance), as well as proprietor income.
• Economic output—Economic activity, calculated as production value including intermediate inputs (i.e., the goods and services used in the production of final products). Output includes spending on employee compensation as well as the production value of each intermediate input, such as equipment, supplies, insurance, rents, utilities, communication services, printing, and other goods and services.
• Job-years—A combined measure of total jobs and the length of time of those jobs. One job-year is defined as equivalent to one job held by one person over one year’s duration. As an example, one job held by one worker for three years would constitute three job-years; three jobs held by three workers for one year’s duration would also constitute three job-years.

Appendix 3.17-A
California High-Speed Rail Authority July 2020
San Francisco to San Jose Project Section Draft EIR/EIS Page | 3.17-A-3
It should be noted that a portion of the impacts reported in this analysis may not be entirely net new. For example, it is plausible that the State of California would have spent a portion of its HSR budget on other transportation projects elsewhere in the state if the HSR project did not occur.
Regional Input-Output Modeling System II Multipliers To measure the economic effects of the project in the RSA, this I/O analysis relies on RIMS II multipliers acquired from the U.S. Bureau of Economic Analysis (U.S. Bureau of Economic Analysis 2013, 2018). The multipliers are the most current available at the time the analysis was conducted, that is, those based on 2007 national input-output data and 2016 regional data. The multipliers were acquired from the U.S. Bureau of Economic Analysis on October 12, 2018, and are specific to the regional economy composed of San Francisco, San Mateo, and Santa Clara Counties. The multipliers are produced as tables organized both by selected detailed industries, as defined under the North American Industry Classification System (NAICS), and by NAICS industry aggregations or sectors, as defined by the U.S. Bureau of Economic Analysis.
RIMS II multipliers in two industry aggregations are most directly relevant to the construction phase and the operations and maintenance phase of the project. For the construction phase, Industry Aggregation #7 Construction (NAICS Industry Sector 23) multipliers are the most generally applicable to local construction cost estimates for RSA, and are shown in Table 1.
Table 1 Regional Input-Output Modeling System II Multipliers Relevant to Project Construction in the Resource Study Area
Industry
Multiplier Final Demand Direct Effect
Output1 (dollars)
Earnings2 (dollars)
Employment3
(jobs) Value-Added4
(dollars) Earnings5 (dollars)
Employment6 (jobs)
7. Construction 1.4534 0.3509 6.3078 0.8041 1.4373 1.6305 Source: U.S. Bureau of Economic Analysis 2018 Multipliers are based on the 2007 Benchmark Input-Output Table for the Nation and 2016 regional data. 1 Represents the total dollar change in output that occurs in all industries for each additional dollar of output delivered to final demand by the industry corresponding to the entry. 2 Represents the total dollar change in earnings of households employed by all industries for each additional dollar of output delivered to final demand by the industry corresponding to the entry. 3 Represents the total change in number of jobs that occurs in all industries for each additional 1 million dollars of output delivered to final demand by the industry corresponding to the entry. Because the employment multipliers are based on 2016 data, the output delivered to final demand must be in 2016 dollars. 4 Represents the total dollar change in value added that occurs in all industries for each additional dollar of output delivered to final demand by the industry corresponding to the entry. 5 Represents the total dollar change in earnings of households employed by all industries for each additional dollar of earnings paid directly to households employed by the industry corresponding to the entry. 6 Represents the total change in number of jobs in all industries for each additional job in the industry corresponding to the entry.
For the operations and maintenance phase, Industry Aggregation 33 Rail Transportation (NAICS Industry Sector 482) multipliers are the most generally applicable to operations and maintenance (O&M) cost estimates for the RSA. These multipliers are shown in Table 2.
Dollar inputs for analysis models using RIMS II multipliers should be indexed to the same year as the multipliers applied. Analysts used Construction Cost Index developed for the Authority’s 2016 Business Plan Capital Cost Basis of Estimate Report (Authority 2016) to adjust the capital and construction cost estimates for this analysis, which were provided in 2018 dollars (Appendix 6-A), to the 2016 dollars pertinent to the RIMS II multipliers described previously. An inflation factor of 2.25 percent per annum is assumed to pertain between Fiscal Year 2016/2017 and Fiscal Year 2024/2025 for the Construction Cost Index, and has been applied as necessary to convert 2018 dollars to 2016 dollars for analysis and to 2018 dollars for uniform reporting.

Appendix 3.17-A
July 2020 California High-Speed Rail Authority
3.17-A-4 | Page San Francisco to San Jose Project Section Draft EIR/EIS
Table 2 Regional Input-Output Modeling System II Multipliers Relevant to Project Operations and Maintenance in the Resource Study Area
Industry
Multiplier Final Demand Direct Effect
Output1 (dollars)
Earnings2 (dollars)
Employment3
(jobs) Value-Added4
(dollars) Earnings5 (dollars)
Employment6 (jobs)
33. Rail Transportation 1.4469 0.2466 3.6400 0.7861 1.7427 2.3971 Source: U.S. Bureau of Economic Analysis 2018 Multipliers are based on the 2007 Benchmark Input-Output Table for the Nation and 2016 regional data. 1 Represents the total dollar change in output that occurs in all industries for each additional dollar of output delivered to final demand by the industry corresponding to the entry. 2 Represents the total dollar change in earnings of households employed by all industries for each additional dollar of output delivered to final demand by the industry corresponding to the entry. 3 Represents the total change in number of jobs that occurs in all industries for each additional 1 million dollars of output delivered to final demand by the industry corresponding to the entry. Because the employment multipliers are based on 2016 data, the output delivered to final demand must be in 2016 dollars. 4 Represents the total dollar change in value added that occurs in all industries for each additional dollar of output delivered to final demand by the industry corresponding to the entry. 5 Represents the total dollar change in earnings of households employed by all industries for each additional dollar of earnings paid directly to households employed by the industry corresponding to the entry. 6 Represents the total change in number of jobs in all industries for each additional job in the industry corresponding to the entry.
Construction Cost Estimates In addition to RIMS II multipliers, this analysis relies on detailed capital cost estimates. Capital cost estimates for RIMS II modeling were assembled from data provided in the capital cost estimates for the two project alternatives. These sources itemize costs using the Authority’s refinement of the Federal Railroad Administration’s (FRA) standard cost categories (SCC), which establish a consistent format for the reporting, estimating, and managing of capital costs.2
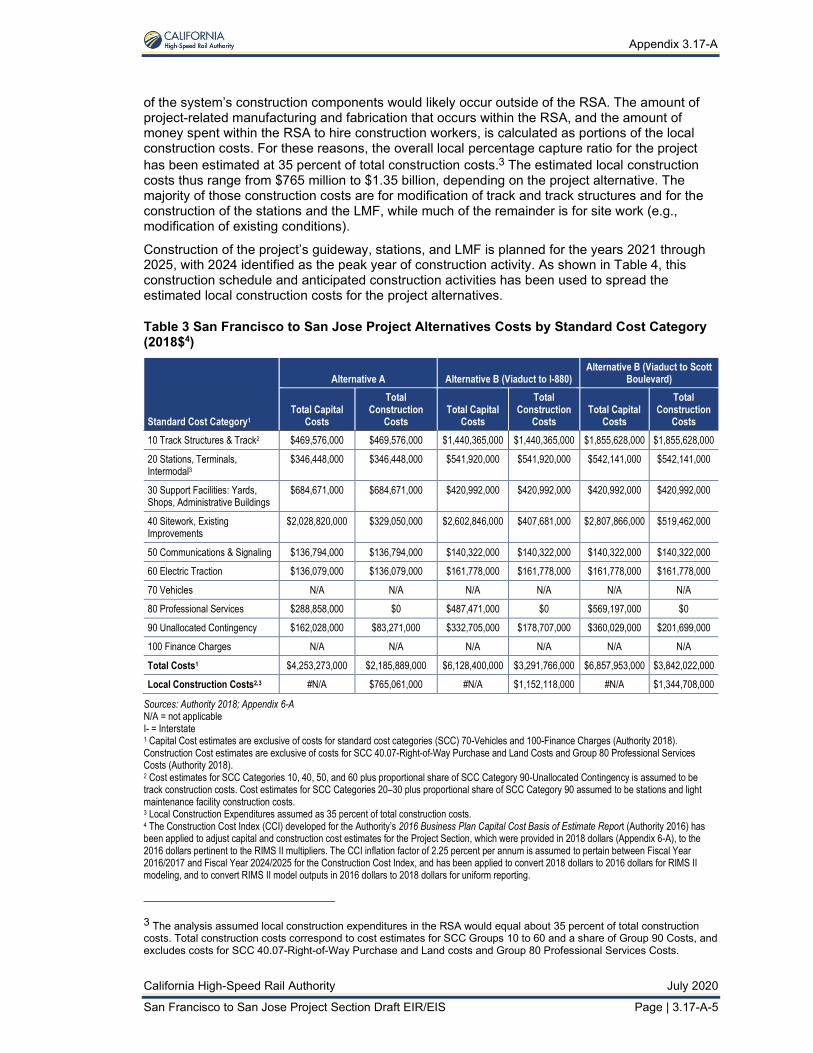
As shown in Table 3, for this analysis the project alternatives are estimated to have “total capital costs” ranging from approximately $4.25 billion to $6.86 billion (2018$), including the costs of right-of-way and land acquisitions, but excluding the cost of HSR trains (train sets, support and maintenance vehicles, and parts), and finance charges. These exclusions are not anticipated to have a significant effect on regional job creation or systemwide costs. The development budget analyzed for the regional economic impacts reflects the total construction costs. These include “hard” development costs, but exclude the costs of right-of-way (i.e., land acquisitions) and professional services as many or most of the design, administrative, consulting, monitoring, and accounting services may be conducted outside of the RSA.
The hard costs include all aspects of construction, including site work, track realignment, roadway modifications, light maintenance facility (LMF) and passing track development, and other construction requirements. These estimated “total construction costs” range from $2.19 billion to $3.84 billion (2018$), depending on the project alternative. The total capital cost estimates include unallocated contingency budgets that range from 4.0 percent of the sum of all other costs for Alternative A to 5.7 percent of all other costs for Alternative B (Viaduct to Interstate 880). The same ratios of unallocated contingency costs have been assumed in calculations of total construction costs and local construction costs, by project alternative.
Local construction costs are estimates of the development budget expenditures within the three-county RSA of San Francisco, San Mateo, and Santa Clara Counties. For a project of the scale and specialized requirements of the HSR, a substantial amount of manufacturing and fabrication
2 Appendix 6-A provides estimates capital costs for the project alternatives. These capital cost estimates are limited to SCC groups 10 to 60, and 80 to 90, which include most of the SCC cost categories directly related to the labor and materials involved in construction of the rail system and support facilities. Total construction costs for the Project Section correspond to cost estimates for SCC Groups 10 to 60 and a share of Group 90 Costs, and exclude 40.07-Right-of-Way Purchase and Land Costs and Group 80 Professional Services Costs.
Appendix 3.17-A
California High-Speed Rail Authority July 2020
San Francisco to San Jose Project Section Draft EIR/EIS Page | 3.17-A-5
of the system’s construction components would likely occur outside of the RSA. The amount of project-related manufacturing and fabrication that occurs within the RSA, and the amount of money spent within the RSA to hire construction workers, is calculated as portions of the local construction costs. For these reasons, the overall local percentage capture ratio for the project has been estimated at 35 percent of total construction costs.3 The estimated local construction costs thus range from $765 million to $1.35 billion, depending on the project alternative. The majority of those construction costs are for modification of track and track structures and for the construction of the stations and the LMF, while much of the remainder is for site work (e.g., modification of existing conditions).
Construction of the project’s guideway, stations, and LMF is planned for the years 2021 through 2025, with 2024 identified as the peak year of construction activity. As shown in Table 4, this construction schedule and anticipated construction activities has been used to spread the estimated local construction costs for the project alternatives.
Table 3 San Francisco to San Jose Project Alternatives Costs by Standard Cost Category (2018$4)
Standard Cost Category1
Alternative A Alternative B (Viaduct to I-880) Alternative B (Viaduct to Scott
Boulevard)
Total Capital Costs
Total Construction
Costs Total Capital
Costs
Total Construction
Costs Total Capital
Costs
Total Construction
Costs 10 Track Structures & Track2 $469,576,000 $469,576,000 $1,440,365,000 $1,440,365,000 $1,855,628,000 $1,855,628,000
20 Stations, Terminals, Intermodal3
$346,448,000 $346,448,000 $541,920,000 $541,920,000 $542,141,000 $542,141,000
30 Support Facilities: Yards, Shops, Administrative Buildings
$684,671,000 $684,671,000 $420,992,000 $420,992,000 $420,992,000 $420,992,000
40 Sitework, Existing Improvements
$2,028,820,000 $329,050,000 $2,602,846,000 $407,681,000 $2,807,866,000 $519,462,000
50 Communications & Signaling $136,794,000 $136,794,000 $140,322,000 $140,322,000 $140,322,000 $140,322,000
60 Electric Traction $136,079,000 $136,079,000 $161,778,000 $161,778,000 $161,778,000 $161,778,000
70 Vehicles N/A N/A N/A N/A N/A N/A
80 Professional Services $288,858,000 $0 $487,471,000 $0 $569,197,000 $0
90 Unallocated Contingency $162,028,000 $83,271,000 $332,705,000 $178,707,000 $360,029,000 $201,699,000
100 Finance Charges N/A N/A N/A N/A N/A N/A
Total Costs1 $4,253,273,000 $2,185,889,000 $6,128,400,000 $3,291,766,000 $6,857,953,000 $3,842,022,000 Local Construction Costs2,3 #N/A $765,061,000 #N/A $1,152,118,000 #N/A $1,344,708,000
Sources: Authority 2018; Appendix 6-A N/A = not applicable I- = Interstate 1 Capital Cost estimates are exclusive of costs for standard cost categories (SCC) 70-Vehicles and 100-Finance Charges (Authority 2018). Construction Cost estimates are exclusive of costs for SCC 40.07-Right-of-Way Purchase and Land Costs and Group 80 Professional Services Costs (Authority 2018). 2 Cost estimates for SCC Categories 10, 40, 50, and 60 plus proportional share of SCC Category 90-Unallocated Contingency is assumed to be track construction costs. Cost estimates for SCC Categories 20–30 plus proportional share of SCC Category 90 assumed to be stations and light maintenance facility construction costs. 3 Local Construction Expenditures assumed as 35 percent of total construction costs. 4 The Construction Cost Index (CCI) developed for the Authority’s 2016 Business Plan Capital Cost Basis of Estimate Report (Authority 2016) has been applied to adjust capital and construction cost estimates for the Project Section, which were provided in 2018 dollars (Appendix 6-A), to the 2016 dollars pertinent to the RIMS II multipliers. The CCI inflation factor of 2.25 percent per annum is assumed to pertain between Fiscal Year 2016/2017 and Fiscal Year 2024/2025 for the Construction Cost Index, and has been applied to convert 2018 dollars to 2016 dollars for RIMS II modeling, and to convert RIMS II model outputs in 2016 dollars to 2018 dollars for uniform reporting.
3 The analysis assumed local construction expenditures in the RSA would equal about 35 percent of total construction costs. Total construction costs correspond to cost estimates for SCC Groups 10 to 60 and a share of Group 90 Costs, and excludes costs for SCC 40.07-Right-of-Way Purchase and Land costs and Group 80 Professional Services Costs.

Appendix 3.17-A
July 2020 California High-Speed Rail Authority
3.17-A-6 | Page San Francisco to San Jose Project Section Draft EIR/EIS
Table 4 Project Alternatives Costs by Construction Year (2018$)
Alternative / Cost Alternative A Alternative B
(Viaduct to I-880)
Alternative B (Viaduct to Scott
Boulevard) Capital Costs 1 $4,253,273,000 $6,128,400,000 $6,857,953,000
Total construction costs 2 $2,185,889,000 $3,291,766,000 $3,842,022,000
Local construction costs 3 $765,061,000 $1,152,118,000 $1,344,708,000
Local construction costs during 2021 $69,832,000 $99,767,000 $115,406,000
Local construction costs during 2022 $172,370,000 $269,949,000 $312,264,000
Local construction costs during 2023 $179,914,000 $282,582,000 $330,016,000
Local construction costs during 2024 (peak year) $190,579,000 $284,116,000 $335,009,000
Local construction costs during 2025 $152,273,000 $215,560,000 $251,866,000 Sources: Authority 2017, 2018, 2019 I- = Interstate 1 Capital Cost estimates are exclusive of costs for standard cost categories (SCC) 70-Vehicles and 100-Finance Charges (Authority 2018). Construction Cost estimates are exclusive of costs for SCC 40.07-Right-of-Way Purchase and Land Costs and Group 80 Professional Services Costs (Authority 2018). 2 Cost estimates for SCC Categories 10, 40, 50, and 60 plus a proportional share of SCC Category 90-Unallocated Contingency is assumed to be track construction costs. Cost estimates for SCC Categories 20–30 plus a proportional share of SCC Category 90 assumed to be stations and light maintenance facility construction costs. 3 Local Construction Expenditures assumed as 35 percent of total construction costs.
Economic Impacts from Construction This analysis assumes that approximately 35 percent of the total construction expenditures for the project would be made in the regional economy; that is, in the three-county RSA. The direct employment for construction is projected at between about 710 and 1,240 jobs in the peak year 2024 under each project alternative, as shown in Table 5. The total employment for construction in the peak year is projected to be between about 1,150 and 2,020, depending on the alternative. Table 5 presents the estimated total one-time economic impact of construction of the project on the RSA.
Table 5 Total One-Time Economic Impact of Construction
Alternative/Sector Output (2018$)1 Employment (Job-Years)1
Employee Compensation (2018$)1
Alternative A
Direct impact $765,061,000 2,830 $186,781,000
Indirect/induced impact $346,879,000 1,780 $81,679,000
Total impact $1,111,940,000 4,620 $268,460,000
2024 peak year direct jobs N/A 710 N/A
2024 peak year direct, indirect and induced jobs N/A 1,150 N/A
Alternative B (Viaduct to I-880)
Direct impact $1,152,118,000 4,260 $281,276,000
Indirect/induced impact $522,370,000 2,690 $123,002,000
Total impact $1,674,488,000 6,950 $404,278,000

Appendix 3.17-A
California High-Speed Rail Authority July 2020
San Francisco to San Jose Project Section Draft EIR/EIS Page | 3.17-A-7
Alternative/Sector Output (2018$)1 Employment (Job-Years)1
Employee Compensation (2018$)1
2024 peak year direct jobs N/A 1,050 N/A
2024 peak year direct, indirect and induced jobs N/A 1,710 N/A
Alternative B (Viaduct to Scott Boulevard)
Direct impact $1,344,708,000 4,980 $328,295,000
Indirect/induced impact $609,690,000 3,140 $143,563,000
Total impact $1,954,398,000 8,110 $471,858,000
2024 peak year direct jobs N/A 1,240 N/A
2024 peak year direct, indirect and induced jobs N/A 2,020 N/A Sources: Authority 2017, 2019; U.S. Bureau of Economic Analysis 2018 I- = Interstate N/A = not applicable 1 All numbers have been rounded to the nearest 100 for output and employee compensation and to the nearest 10 for employment.
Consideration of Overlapping HSR Project Section Construction Schedules and Construction Worker Commute Sheds The project is just one of several HSR project sections expected to be constructed within a relatively short timeframe and within relative proximity to one another. The RSA for the project includes Santa Clara County, which is also one of the counties comprising the RSA for the San Jose to Merced Project Section. The San Jose to Merced Project Section construction period (2022–2028) is anticipated to overlap the construction period anticipated for this Project Section (2021–2025). Construction workers experienced on one of these project sections would provide a valuable labor resource for the other, and the estimated daily commute sheds for the different project sections would also overlap. Approximately 55,300 (or 73 percent) of the 76,150 employed residents who were primarily employed as construction workers in 2017 and living within the 90-minute commute shed for the San Jose to Merced Project Section were also residing within the commute shed for the San Francisco to San Jose Project Section (U.S. Census Bureau 2019a, 2019b; Economic and Planning Systems 2018a, 2018b, 2018c in Attachment 1 to this appendix).
Economic Impacts from Operations Direct, Indirect and Induced Economic Output, Employment and Employee Compensation The analysis of operations is based on data obtained from the Authority, including estimated systemwide operating and maintenance costs. In addition, the analysis relied on detailed program data to allocate costs to the project.4 Specifically, the analysis used personnel estimates and route miles as the primary metric through which operations costs are allocated from HSR system-wide totals to specific HSR project sections.
In 2040, the Authority anticipates that the total operating budget for the Phase I system will be approximately $874 million (2015$ millions). Total O&M staffing for the entire Phase I system in 2040 is projected by the Authority at 3,540 jobs. The number of staff associated with each project section will ultimately depend on final decisions regarding the locations of the maintenance
4 Route miles within San Francisco, San Mateo and Santa Clara Counties were estimated using the length of the midline of Alternatives A and B. The length of the alternatives' midline may differ from route miles for the individual alternatives and from the project mileage estimates in the Authority’s 2018 Business Plan Capital Cost Basis of Estimate Report (Authority 2018).

Appendix 3.17-A
July 2020 California High-Speed Rail Authority
3.17-A-8 | Page San Francisco to San Jose Project Section Draft EIR/EIS
facilities, the operation and control center, and the California High-Speed Rail Headquarters5. The preliminary estimate of the Project Section O&M staffing in 2040 used in this analysis is 380 jobs or about 11 percent of the Phase I estimate for total jobs systemwide, based on a pro-rata allocation of the systemwide O&M jobs by ratio of the project section’s centerline route miles to total route miles systemwide (Authority 2018).
The same ratio of the project section’s centerline route miles to total route miles systemwide is applied to allocate Phase 1 O&M cost estimates to the individual Phase 1 project sections.6 About $95 million (or about 11 percent) of the projected operating budget is estimated for the Project Section. The operations expenses include regional spending on employee compensation and goods and services. The O&M employment includes a range of jobs associated with train operations, maintenance, and administrative activities associated with the tracks and passing track, stations in San Francisco and Millbrae, and rail yards and maintenance facilities. Other operating budget costs would involve commercial activities, insurance, and contingency funds. No heavy maintenance facilities are proposed for the Project Section.
Analysts used the Construction Cost Index developed for the Authority’s 2016 Business Plan Capital Cost Basis of Estimate Report (Authority 2016) to adjust O&M expense estimates made in 2015 dollars to the 2016 dollars pertinent to the RIMS II multipliers. An inflation factor of 2.00 percent per annum is assumed to pertain between Fiscal Year 2015/2016 to Fiscal Year 2016/2017 in the Construction Cost Index, and has been applied as necessary to convert 2015 dollars to 2016 dollars for analysis. The Construction Cost Index inflation factor of 2.25 percent per year is assumed to pertain between Fiscal Year 2016/2017 and Fiscal Year 2024/2025 has been applied to convert to 2018 dollars for uniform reporting.
Approximately 380 O&M jobs are estimated for the RSA as direct impacts of the project, as part of Phase 1 operations, which is forecast to create approximately 3,540 permanent O&M jobs systemwide by 2040. The direct O&M jobs would include train operations and dispatching, infrastructure and equipment maintenance, station and train cleaning, ticketing and other commercial activities, and administration. Approximately 530 additional permanent jobs are estimated for the RSA, as indirect and induced impacts of the direct O&M employment and expenditures. The indirect and induced jobs would include additional employment supporting, servicing, or supplying train operation, administration and dispatching, infrastructure and equipment maintenance, station and train cleaning, ticketing and other commercial activities, and other occupations, such as security, operations of concessions, provision of goods and services to riders entering and leaving the HSR system.
The total direct, indirect and induced annual employment impact of operations and maintenance within the RSA would be approximately 910 jobs. Most of the anticipated occupations for these jobs would be in service sectors of the economy. The California Employment Development Department (CEDD) estimated 1,058,600 service jobs in the RSA in 2015; California Department of Transportation (Caltrans) projects 1,459,500 service jobs in the RSA by 2040 (Caltrans 2015). The addition of 910 O&M-related service jobs would represent increments of only about 0.09 percent and 0.06 percent of the existing (2015) and future (2040) estimates of No Project Alternative service-sector employment in the RSA. The CEDD and Caltrans projections of total employment for the RSA are 2,085,800 jobs (2015) and 2,573,215 jobs (2040), respectively. The addition of approximately 910 O&M-related jobs would represent increments of about 0.045 percent and 0.035 percent of the existing (2015) and future (2040) estimates of No Project
5 For purposes of this analysis, the San Jose Diridon Station Approach Subsection has been assumed during both theconstruction phase and the operations and maintenance phase, so that the capital, construction and operating costs for that subsection, and the additional 6.03 route miles for that project subsection, are included in the regional growth analyses for both the San Francisco to San Jose and the San Jose to Merced Project Sections. 6 Analysts used O&M Phase I 2040 Medium Cost Scenario estimates in conjunction with estimates of route miles byproject section (Authority 2018). The Construction Cost Index developed for the Authority’s 2016 Business Plan Capital Cost Basis of Estimate Report (Authority 2016) to adjust the operating cost estimates for this analysis, which were provided in 2015 dollars, to the 2016 dollars pertinent to the RIMS II multipliers and for RIMS II calculations.

Appendix 3.17-A
California High-Speed Rail Authority July 2020
San Francisco to San Jose Project Section Draft EIR/EIS Page | 3.17-A-9
Alternative total employment in the RSA. Table 6 shows the estimated total recurring economic impact of project operations.
Table 6 Total Recurring Economic Impact of Stabilized Project Operations
Sector Output (2018$)1 Employment (Job-
Years)2 Employee
Compensation (2018$) Direct impact $101,118,100 380 $27,072,700
Indirect/induced impact $45,189,700 530 $20,106,900
Total impact $146,307,800 910 $47,179,600 Source: U.S. Bureau of Economic Analysis 2018 1 Direct output is based on the Project Section’s estimated $84 million (2015$) share, based on proportional route miles, of the estimated annual systemwide operations and maintenance costs under a 2040 Medium Cost Scenario. The Project Section’s Phase 1 direct operations and maintenance jobs are estimated at about 340 of approximately 3,540 total jobs systemwide in 2040. 2 Calculated by application of RIMS II Direct Effect Employment Multipliers for Industry Aggregation 33 Rail Transportation
In aggregate, as shown in Table 7, direct, indirect and induced employment gains associated with operations and maintenance of the Project Section would represent a very small addition to the expected growth in the entire RSA—less than 0.1 percent more total employment by 2040 than projected under the No Project Alternative.
Table 7 Operations-Related Employment Growth
Region
Year 2015 Existing
Conditions
No Project Alternative 2015–2040
Growth
No Project Alternative
2040 Baseline Forecasts
Phase I O&M Direct, Indirect
& Induced Growth
Total O&M Growth
Inducement RSA 2,085,200 488,010 2,573,200 910 0.035%
Sources: CEDD 2016; CDOF 2016; Authority and FRA 2017 O&M = operations and maintenance HSR = high-speed rail RSA = resource study area 1 Regional O&M direct employment is projected at about 910 by 2040, based on the Project Section’s approximate share of systemwide route miles, including 6.03 route miles for the San Jose Diridon Station Approach Subsection, and the systemwide route miles and O&M staffing estimates in Appendix 6-B, High-Speed Rail Operating and Maintenance Cost for Use in EIR/EIS Project-Level Analysis.

Appendix 3.17-A
July 2020 California High-Speed Rail Authority
3.17-A-10 | Page San Francisco to San Jose Project Section Draft EIR/EIS
References California Department of Finance (CDOF). 2016. E-5 Population and Housing Estimates for
Cities, Counties, and the State, 2011–2016 with 2010 Census Benchmark. May 2016. www.dof.ca.gov/Forecasting/Demographics/Estimates/E-5/ (accessed November 29, 2016).
California Department of Transportation (Caltrans). 2015. California County-Level Economic Forecast 2015–2040. www.dot.ca.gov/hq/tpp/offices/eab/docs/Full%20Report%202015.pdf (accessed November 29, 2016), and individual county-level Excel tables for 2015–2040 Economic Forecast www.dot.ca.gov/hq/tpp/offices/eab/index_files/2015/ (accessed October 6, 2015).
California Employment Development Department (CEDD). 2016. California Industry Employment & Labor Force by Annual Average: March 2015 Benchmark. www.labormarketinfo.edd.ca.gov/data/employment-by-industry.html (accessed November 28, 2016).
California High-Speed Rail Authority (Authority). 2016. Capital Cost Basis of Estimate Report: 2016 Business Plan: Technical Supporting Document. Prepared by WSP and Parsons Brinckerhoff. April 2016. www.hsr.ca.gov/docs/about/business_plans/2016_Business_Plan_Basis_of_Estimate.pdf (accessed November 10, 2016).
———. 2017. Regional Growth Analysis: Calculating Construction Job Impacts. March 28, 2017.
———. 2018. 2018 Business Plan: Technical Supporting Document: Capital Cost Basis of Estimate Report. Prepared by WSP. June 1, 2018. www.hsr.ca.gov/docs/about/business_plans/2018_Business_Plan_Basis_of_Estimate.pdf (accessed October 7, 2018).
California High-Speed Rail Authority (Authority) and Federal Railroad Administration (FRA). 2017. “Appendix F: Updated Environmental Methodology Guidelines for Regional Growth Estimates for Long-Term Employment and Population Increases.” In California High-Speed Rail Project Environmental Impact Report/Environmental Impact Statement Environmental Methodology Guidelines. Version 5. Revision 5.09. Updated April 2017.
U.S. Bureau of Economic Analysis. 2013. RIMS II: An Essential Tool for Regional Developers and Planners. www.bea.gov/regional/pdf/rims/rimsii_user_guide.pdf (accessed February 15, 2017).
———. 2018. RIMS II Multipliers (2007/2016): Table 2.5 Total Multipliers for Output, Earnings, Employment, and Value Added by Industry Aggregation FJ Region [SF SM SC] (Type II). Region Definition: San Francisco, CA; San Mateo, CA; Santa Clara, CA.
U.S. Census Bureau. 2019a. Home Area Profile: 2017 All Workers, Primary Jobs, for FJ Isochrone_PM_PEAK_90. OnTheMap Application. Longitudinal-Employer Household Dynamics Program. http://onthemap.ces.census.gov/ (accessed August 29, 2019).
———. 2019b. Home Area Profile: 2017 All Workers, Primary Jobs, for JM Isochrone__PM_PEAK_90. OnTheMap Application. Longitudinal-Employer Household Dynamics Program. http://onthemap.ces.census.gov/ (accessed August 29, 2019).

Appendix 3.17-A
California High-Speed Rail Authority July 2020
San Francisco to San Jose Project Section Draft EIR/EIS Page | 3.17-A-11
Appendix 3.17-A, Attachment 1


Appendix 3.17-A
California High-Speed Rail Authority July 2020
San Francisco to San Jose Project Section Draft EIR/EIS Page | 3.17-A-13
Source: Economic and Planning Systems 2018b
Figure 1 Isochrone Commute Shed for the San Francisco to San Jose Project Section

Appendix 3.17-A
July 2020 California High-Speed Rail Authority
3.17-A-14 | Page San Francisco to San Jose Project Section Draft EIR/EIS
Source: Economic and Planning Systems 2018a
Figure 2 Isochrone Commute Shed for the San Jose to Merced Project Section

Appendix 3.17-A
California High-Speed Rail Authority July 2020
San Francisco to San Jose Project Section Draft EIR/EIS Page | 3.17-A-15
Source: Economic and Planning Systems 2018c
Figure 3 Isochrone Commute Shed for the San Francisco to San Jose and San Jose to Merced Project Sections