9 Head & Neck
34
9 Head & Neck Cancers
Transcript of 9 Head & Neck

9
Head
& NeckCancers

94
Report of National Cancer Registry Programme 2012-2016 Head & Neck Cancers
Head & Neck Cancers
Chapter 9 analyses the sites that are classiied under Head and Neck Cancers as per the International Classiication of Diseases (ICD-10).
The data of the PBCR has been analysed for cancers of the tongue (C01-C02), mouth (C03-C06), tonsil (C09), other oropharynx (C10), nasopharynx (C11), hypopharynx (C12-C13), pharynx unspeciied (C14) and larynx (C32) and all of these sites of cancer together as head & neck cancers.
In case of HBCRs, the ICD10s have been regrouped to accommodate complete data on head and neck cancers into six sub-groups (tongue (C02), mouth (C03-C04, C06), oropharynx (C01, C05, C09, C10, C14), nasopharynx (C11), hypopharynx (C12-C13) and larynx (C32)). For the following reasons;
1. Oropharynx has been regrouped for analysis of HBCR data as this data focusses more on the treatment patterns followed in hospitals.
2. Also, the regrouping follows embryological development pattern where cancers of anterior two thirds of tongue (2/3) are grouped as tongue(C02). Cancers of posterior one third (1/3) of tongue (C01) while anatomically being part of tongue, histologically resemble cancers of oropharynx and hence are grouped along with them.
Each chapter has igures on the Annual Percent Change (APC) in Age Adjusted Rates (AAR), Comparison of AAR among PBCRs under NCRP with Asian countries, comparison of AAR among PBCRs under NCRP with Non-Asian countries, tables on distribution of cases according to clinical extent of disease and cross tables of the clinical extent of disease and the type of treatment received.
In case, the number of cases or rates are very small for an anatomical site of cancer, analysis of such sites have not been included in igures and tables in this chapter.

95
Report of National Cancer Registry Programme 2012-2016 Head & Neck Cancers
Table 9.1 Number of cases (n) registered for Head & Neck Cancers and its Relative Proportion to All Sites of Cancer (%), Crude (CR), Age Adjusted (AAR) and Truncated (TR)
Incidence Rates per 100,000 population and its Rank in 28 PBCRs under NCRP
Males
Sl No Registry n % CR AAR TR RANK
NORTH
1 Delhi 7416 23.9 26.8 34.4 67.3 102 Patiala district 897 16.6 16.9 18.1 40.7 24
SOUTH
3 Hyderabad district 1389 27.0 22.8 25.3 55.8 154 Kollam district 1801 18.1 28.9 22.6 41.8 205 Thi’puram district 2397 17.8 30.2 23.9 43.4 176 Bangalore 2248 17.0 16.5 20.6 37.6 217 Chennai 3701 25.6 31.2 29.1 58.9 12
EAST
8 Kolkata 2060 20.2 22.2 18.1 34.9 25WEST
9 Ahmedabad urban 6129 42.0 37.5 39.2 89.1 7
10 Aurangabad 702 36.5 20.7 25.0 51.3 1611 Osmanabad & Beed 1050 28.9 11.3 11.6 24.3 3012 Barshi rural 149 20.5 11.1 10.6 20.2 3213 Mumbai 5952 22.7 21.9 23.5 45.9 1914 Pune 2312 23.9 16.1 19.0 37.1 22
CENTRAL
15 Wardha district 633 26.5 18.7 16.8 34.9 2716 Bhopal 1380 38.7 32.2 37.4 79.9 817 Nagpur 1959 32.9 29.3 28.4 59.1 14
NORTH EAST
18 Manipur state 650 17.6 8.2 11.1 19.7 31Imphal West district 179 15.7 13.4 15.2 24.6 29
19 Mizoram state 686 15.9 23.2 31.4 75.2 11Aizawl district 384 17.6 36.3 45.6 107.2 5
20 Sikkim state 247 21.1 14.7 18.2 32.0 2321 Tripura state 1920 29.3 19.6 23.8 45.9 1822 West Arunachal 183 15.0 8.5 15.4 33.1 28
Papumpare district 89 18.9 17.9 36.0 92.1 9
23 Meghalaya 1574 33.6 31.1 58.4 134.8 3East Khasi Hills district 1011 35.1 45.9 78.5 178.7 1
24 Nagaland 553 39.4 29.3 46.3 103.0 425 Pasighat 50 15.6 14.1 17.9 35.7 2626 Cachar district 1595 34.2 33.9 44.8 87.2 627 Dibrugarh district 785 31.0 22.5 29.1 50.2 1328 Kamrup urban 1857 29.8 56.9 62.4 112.0 2
Total number of cases (N) registered and reporting year of data for all sites is mentioned in Table 1.2

96
Report of National Cancer Registry Programme 2012-2016 Head & Neck Cancers
Females
Sl No Registry n % CR AAR TR RANK
NORTH
1 Delhi 1724 5.9 7.1 8.7 16.4 152 Patiala district 229 3.8 4.8 4.7 9.9 29
SOUTH
3 Hyderabad district 455 7.1 7.7 9.6 20.4 114 Kollam district 656 6.7 9.3 6.7 10.6 215 Thi’puram district 723 5.1 8.5 6.2 9.4 256 Bangalore 1032 6.5 8.2 9.9 17.9 9
7 Chennai 1226 7.3 10.3 9.7 19.1 10EAST
8 Kolkata 621 6.8 7.2 6.0 11.4 26WEST
9 Ahmedabad urban 1279 11.6 8.7 8.8 19.5 1410 Aurangabad 168 8.4 5.3 6.3 13.0 2411 Osmanabad & Beed 309 6.9 3.7 3.4 7.4 3112 Barshi rural 45 5.5 3.7 3.3 7.4 3213 Mumbai 1921 7.0 8.1 8.1 15.3 1814 Pune 790 7.3 6.1 6.9 13.0 20
CENTRAL
15 Wardha district 249 9.8 7.7 6.7 13.4 2216 Bhopal 369 10.3 9.3 11.2 23.6 617 Nagpur 627 10.4 9.7 9.4 19.7 12
NORTH EAST
18 Manipur state 282 6.3 3.6 4.5 8.8 30Imphal West district 80 5.3 5.8 5.9 12.7 27
19 Mizoram state 192 5.1 6.5 9.0 17.2 13Aizawl district 98 5.2 9.0 11.1 22.7 8
20 Sikkim state 96 8.5 6.4 8.2 13.7 1721 Tripura state 575 11.7 6.1 7.1 15.9 1922 West Arunachal 71 6.1 3.4 6.4 15.2 23
Papumpare district 47 8.9 9.4 21.7 50.7 123 Meghalaya 462 16.3 9.1 16.6 31.7 4
East Khasi Hills district 263 15.2 11.7 18.7 35.4 324 Nagaland 146 14.7 8.2 11.3 28.9 7
25 Pasighat 13 4.3 3.8 4.8 14.1 2826 Cachar district 515 13.1 11.3 14.8 33.1 527 Dibrugarh district 235 10.5 6.9 8.6 19.7 1628 Kamrup urban 505 10.5 15.9 19.2 32.0 2
Total number of cases (N) registered and reporting year of data for all sites is mentioned in Table 1.2
East Khasi Hills district (78.5 per 100,000) in males had the highest incidence rate of head and neck cancers followed by Kamrup urban (62.4 per 100,000).
Papumpare district (21.7 per 100,000) in females had the highest incidence rate of head and neck cancers followed by Kamrup urban (19.2 per 100,000).

97
Report of National Cancer Registry Programme 2012-2016 Head & Neck Cancers
Fig
. 9.1
Age
Spe
ciic
Inci
denc
e Ra
tes
per 1
00,0
00 in
28
PBC
Rs u
nder
NC
RP
He
ad
& N
ec
k C
an
ce
rs
Ma
les

98
Report of National Cancer Registry Programme 2012-2016 Head & Neck Cancers
Fe
ma
les
In m
ale
s, th
e ca
ncer
inci
den
ce ra
tes f
or h
ead
and
nec
k ca
ncer
incr
ease
d fr
om th
e a
ge o
f 30
to 7
5+ w
here
as i
n fe
ma
les i
t sta
rted
to
incr
ease
from
the
age
of 3
5.

99
Report of National Cancer Registry Programme 2012-2016 Head & Neck Cancers
Fig. 9.2 Annual Percent Change (APC) in Age Adjusted Incidence Rates (AAR) over the Time Period - Head & Neck Cancers
Among males signiicant increase in incidence rates for head & neck cancers was observed in Aurangabad, Delhi, Chennai and Bhopal PBCRs, and among females it was observed in Nagpur PBCR.
Among males, there was a signiicant decrease in incidence rates in Barshi rural and Mumbai. Among females, the signiicant decrease was observed in Bangalore, Mumbai and Kollam district PBCRs.

100
Report of National Cancer Registry Programme 2012-2016 Head & Neck Cancers
Table 9.2 Number (n) and Relative Proportion (%) of Cases Registered by Five Year Age Group - Head & Neck Cancers
Males
Age Group
Tongue (C02)
Mouth
(C03-C04,C06)
Oropharynx
(C01, C05, C09, C10, C14)
Nasopharynx (C11)
Hypopharynx (C12-C13)
Larynx (C32)
Total
n % n % n % n % n % n % n
00-04 2 <0.1 4 <0.1 2 <0.1 3 0.2 1 <0.1 1 <0.1 13 05-09 4 <0.1 4 <0.1 1 <0.1 19 1.4 1 <0.1 3 <0.1 32 10-14 1 <0.1 2 <0.1 2 <0.1 75 5.6 - - 2 <0.1 82 15-19 11 0.1 15 0.1 10 0.1 108 8.0 2 <0.1 2 <0.1 148 20-24 70 0.8 90 0.5 26 0.2 79 5.9 10 0.1 11 0.1 286 25-29 320 3.7 406 2.5 48 0.4 53 3.9 27 0.4 18 0.2 872 30-34 686 7.9 1071 6.5 138 1.3 58 4.3 60 0.9 49 0.6 2062 35-39 1042 11.9 1714 10.4 362 3.3 71 5.3 180 2.6 122 1.6 3491 40-44 1087 12.5 2078 12.7 667 6.1 131 9.7 340 4.9 332 4.3 4635 45-49 1163 13.3 2235 13.6 1145 10.5 133 9.9 613 8.9 624 8.1 5913 50-54 1107 12.7 2244 13.7 1644 15.1 167 12.4 959 13.9 1058 13.8 7179 55-59 989 11.3 1997 12.2 1839 16.9 135 10.0 1171 17.0 1361 17.7 7492 60-64 909 10.4 1870 11.4 1961 18.0 124 9.2 1223 17.7 1511 19.7 7598 65-69 646 7.4 1269 7.7 1424 13.1 82 6.1 990 14.3 1152 15.0 5563 70-74 364 4.2 754 4.6 918 8.4 65 4.8 724 10.5 789 10.3 3614 75+ 325 3.7 665 4.0 676 6.2 43 3.2 602 8.7 645 8.4 2956
Unknown - - 2 <0.1 3 <0.1 - - 1 <0.1 - - 6 Total 8726 100.0 16420 100.0 10866 100.0 1346 100.0 6904 100.0 7680 100.0 51942
Females
Age Group
Tongue (C02)
Mouth (C03-C04, C06)
Oropharynx
(C01, C05, C09, C10, C14)
Nasopharynx (C11)
Hypopharynx (C12-C13)
Larynx (C32)
Total
n % n % n % n % n % n % n
00-04 - - 2 <0.1 - - 3 0.5 - - - - 5 05-09 2 0.1 2 <0.1 - - 3 0.5 - - 1 0.1 8 10-14 - - 1 <0.1 1 0.1 16 2.8 - - 1 0.1 19 15-19 8 0.3 12 0.2 5 0.3 34 6.0 4 0.3 1 0.1 64 20-24 20 0.7 28 0.4 11 0.6 49 8.7 13 0.8 12 1.5 133 25-29 63 2.1 70 1.1 23 1.3 28 5.0 35 2.2 12 1.5 231 30-34 113 3.7 170 2.7 43 2.4 32 5.7 67 4.3 20 2.4 445 35-39 215 7.1 373 5.9 92 5.2 45 8.0 113 7.2 36 4.4 874 40-44 273 9.1 516 8.2 136 7.6 54 9.6 173 11.1 53 6.5 1205 45-49 428 14.2 799 12.7 213 12.0 68 12.1 231 14.8 76 9.3 1815 50-54 443 14.7 803 12.7 223 12.5 77 13.7 243 15.6 105 12.9 1894 55-59 390 12.9 816 13.0 248 13.9 50 8.9 207 13.3 127 15.5 1838 60-64 404 13.4 942 15.0 311 17.5 45 8.0 192 12.3 148 18.1 2042 65-69 314 10.4 734 11.6 204 11.4 28 5.0 137 8.8 106 13.0 1523 70-74 166 5.5 498 7.9 150 8.4 11 2.0 74 4.7 61 7.5 960 75+ 176 5.8 533 8.5 122 6.8 20 3.6 73 4.7 58 7.1 982
Unknown - - 2 <0.1 - - - - - - - - 2 Total 3015 100.0 6301 100.0 1782 100.0 563 100.0 1562 100.0 817 100.0 14040
Among the cancers of head and neck reported, the highest numbers were that of mouth cancer followed by oropharynx in males. Mouth contributed 1/3rd of the total head and neck cancers.
Among females, cancer of the mouth was the highest contributor followed by tongue.

101
Report of National Cancer Registry Programme 2012-2016 Head & Neck Cancers
Table 9.3 Number (n) and Relative Proportion (%) of Cases registered According to Types of Treatment for Head and Neck Cancers
Males
Treatment
Tongue
(C02)
Mouth
(C03-C04,C06)
Oropharynx
(C01, C05, C09, C10, C14)
Nasopharynx (C11)
Hypopharynx (C12-C13)
Larynx
(C32)
n % n % n % n % n % n %
Surgery 1999 22.9 3119 19.0 273 2.5 15 1.1 193 2.8 574 7.5 Radiotherapy 929 10.7 2194 13.4 4138 38.1 177 13.2 2547 37.0 3232 42.1 Systemic Therapy 1116 12.8 2301 14.0 988 9.1 162 12.1 423 6.1 464 6.0 Multi-modality* 4613 52.9 8641 52.7 5385 49.6 980 72.9 3712 53.9 3370 43.9 Palliative Care 59 0.7 138 0.8 63 0.6 10 0.7 18 0.3 35 0.5 Total 8716 100.0 16393 100.0 10847 100.0 1344 100.0 6893 100.0 7675 100.0
Females
Treatment
Tongue
(C02)
Mouth
(C03-C04, C06)
Oropharynx
(C01, C05, C09, C10, C14)
Nasopharynx (C11)
Hypopharynx (C12-C13)
Larynx
(C32)
n % n % n % n % n % n %
Surgery 831 27.6 1185 18.8 121 6.8 5 0.9 48 3.1 56 6.9 Radiotherapy 332 11.0 1115 17.7 654 36.8 79 14.1 571 36.6 372 45.6 Systemic Therapy 403 13.4 1008 16.0 167 9.4 82 14.6 100 6.4 67 8.2 Multi-modality* 1432 47.5 2918 46.4 829 46.6 394 70.1 836 53.6 317 38.9 Palliative Care 14 0.5 66 1.0 8 0.4 2 0.4 6 0.4 3 0.4 Total 3012 100.0 6292 100.0 1779 100.0 562 100.0 1561 100.0 815 100.0
*Multi-modality includes the combination of Surgery and/or Radiotherapy and/or Systemic Therapy
Multi-modality was the commonest type of treatment for all the cancers in both genders except for cancer larynx in females.
Table 9.4 Number (n) and Relative Proportion (%) by Educational Status - Head & Neck Cancers
Educational StatusMales Females
n % n %
Illiterate 9739 18.7 5367 38.2Literate 4538 8.7 1366 9.7Primary 8245 15.9 1948 13.9Secondary 14752 28.4 2087 14.9Higher Education 3538 6.8 527 3.8Unknown 11122 21.4 2743 19.5Not Applicable (for children below 5 Years) 8 <0.1 2 <0.1Total 51942 100.0 14040 100.0
Educational status indicated that higher proportion of females (38.2%) were illiterate compared to males (18.7%). 28.4% and 14.9% of males and females got secondary level of education, respectively.

102
Report of National Cancer Registry Programme 2012-2016 Head & Neck Cancers
Fig. 9.3 Relative Proportion (%) of Clinical Extent of Disease - Head & Neck Cancers
Males
Females
Among the cancers of head and neck reported, “locoregional” was the commonest presentation of clinical extent of disease for all the cancer sites. The highest proportion was for hypopharynx cancer (males 76.9% and females 72.2%).


104
Report of National Cancer Registry Programme 2012-2016 Head & Neck Cancers
Fig. 9.1.2 Comparison of Age Adjusted Incidence Rates (AAR) of Asian Countries with PBCRs under NCRP- Cancer Tongue
Males
Females
105
Report of National Cancer Registry Programme 2012-2016 Head & Neck Cancers
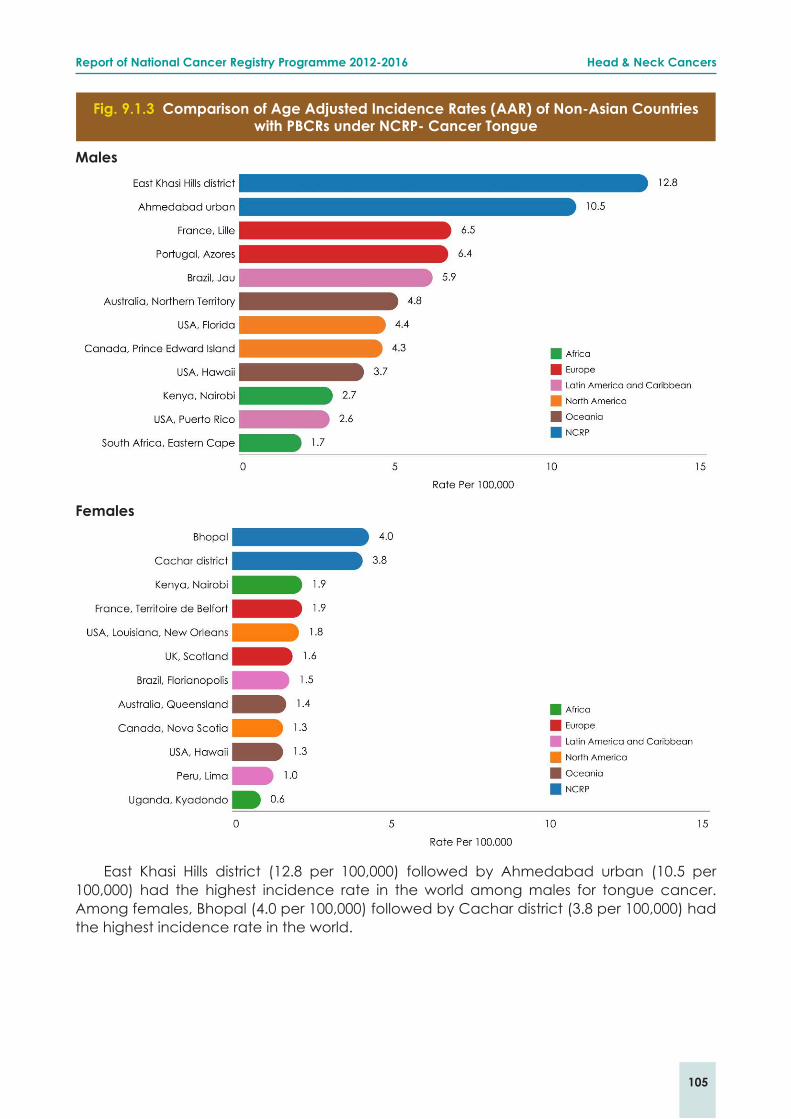
Fig. 9.1.3 Comparison of Age Adjusted Incidence Rates (AAR) of Non-Asian Countries with PBCRs under NCRP- Cancer Tongue
Males
Females
East Khasi Hills district (12.8 per 100,000) followed by Ahmedabad urban (10.5 per 100,000) had the highest incidence rate in the world among males for tongue cancer. Among females, Bhopal (4.0 per 100,000) followed by Cachar district (3.8 per 100,000) had the highest incidence rate in the world.

106
Report of National Cancer Registry Programme 2012-2016 Head & Neck Cancers
Table 9.1.1 Number (n) and Relative Proportion (%) according to Clinical Extent of Disease - Cancer Tongue
Clinical Extent of DiseaseMales Females Both Sexes
n % n % n %
Localised only 2910 33.5 1024 34.1 3934 33.7Locoregional 5088 58.6 1750 58.3 6838 58.5Distant Metastasis 325 3.7 120 4.0 445 3.8Unknown 366 4.2 106 3.5 472 4.0Total 8689 100.0 3000 100.0 11689 100.0
Locoregional was the commonest presentation for cancer tongue (males 58.6% and females 58.3%). Males and females showed similar clinical extent of disease for cancer tongue.
Table 9.1.2 Number (n) and Relative Proportion (%) of Types of Treatment according to Clinical Extent of Disease - Cancer Tongue
Males
Treatment
Clinical Extent of Disease
Localised only Locoregional Distant Metastasis Unknown
n % n % n % n %
Surgery 1165 40.1 718 14.1 13 4.0 95 26.0Radiotherapy 201 6.9 614 12.1 59 18.2 51 13.9Systemic Therapy 245 8.4 721 14.2 84 25.8 60 16.4Multi-modality* 1287 44.3 2985 58.8 166 51.1 157 42.9Palliative Care 10 0.3 42 0.8 3 0.9 3 0.8Total 2908 100.0 5080 100.0 325 100.0 366 100.0
Females
Treatment
Clinical Extent of Disease
Localised only Locoregional Distant Metastasis Unknown
n % n % n % n %
Surgery 497 48.6 286 16.4 8 6.7 39 36.8Radiotherapy 62 6.1 233 13.3 22 18.3 12 11.3Systemic Therapy 70 6.8 280 16.0 33 27.5 18 17.0Multi-modality* 388 37.9 942 53.9 57 47.5 37 34.9Palliative Care 6 0.6 7 0.4 - - - - Total 1023 100.0 1748 100.0 120 100.0 106 100.0
*Multi-modality includes the combination of Surgery and/or Radiotherapy and/or Systemic Therapy
On the basis of extent of disease, multi-modality was the treatment of choice for cancer tongue among both males and females for locoregional and distant metastatic spread. Surgery was the preferred among females where the clinical extent of cancer was localised.

107
Report of National Cancer Registry Programme 2012-2016 Head & Neck Cancers
9.2 Cancer Mouth (ICD-10: C03-C06)Fig. 9.2.1 Annual Percent Change (APC) in Age Adjusted Incidence Rates (AAR) over the
Time Period - Cancer Mouth
There was a signiicant increase in the incidence rates for mouth cancer in 9 PBCRs in males and in 2 PBCRs in females. There was a signiicant decrease in rates in Bangalore, Chennai and Kollam district among females.

108
Report of National Cancer Registry Programme 2012-2016 Head & Neck Cancers
Fig. 9.2.2 Comparison of Age Adjusted Incidence Rates (AAR) of Asian countries with PBCRs under NCRP- Cancer Mouth
Males
Females

109
Report of National Cancer Registry Programme 2012-2016 Head & Neck Cancers
Fig. 9.2.3 Comparison of Age Adjusted Incidence Rates (AAR) of Non-Asian countries with PBCRs under NCRP - Cancer Mouth
Males
Females
Ahmedabad urban (19.5 per 100,000) followed by Bhopal (15.9 per 100,000) had the highest incidence rate in the world among males for mouth cancer. Among females, East Khasi Hills district (9.5 per 100,000) had the highest incidence rate of mouth cancer in the world.

110
Report of National Cancer Registry Programme 2012-2016 Head & Neck Cancers
Table 9.2.1 Number (n) and Relative Proportion (%) according to Clinical Extent of Disease - Cancer Mouth
Clinical Extent of DiseaseMales Females Both Sexes
n % n % n %
Localised only 4169 25.5 1366 21.8 5535 24.5Locoregional 10750 65.8 4396 70.2 15146 67.0Distant Metastasis 734 4.5 309 4.9 1043 4.6Unknown 695 4.3 193 3.1 888 3.9Total 16348 100.0 6264 100.0 22612 100.0
Locoregional was the commonest presentation for cancer mouth (males 65.8% and females 70.2%). Males and females showed similar clinical extent of disease for cancer mouth.
Table 9.2.2 Number (n) and Relative Proportion (%) of Types of Treatment according to Clinical Extent of Disease - Cancer Mouth
Males
Treatment
Clinical Extent of Disease
Localised only Locoregional Distant Metastasis Unknown
n % n % n % n %
Surgery 1340 32.2 1485 13.8 68 9.3 218 31.6
Radiotherapy 424 10.2 1552 14.5 127 17.3 79 11.4
Systemic Therapy 411 9.9 1594 14.9 175 23.9 108 15.7
Multi-modality* 1965 47.2 5997 55.9 360 49.1 281 40.7
Palliative Care 26 0.6 104 1.0 3 0.4 4 0.6
Total 4166 100.0 10732 100.0 733 100.0 690 100.0
Females
Treatment
Clinical Extent of Disease
Localised only Locoregional Distant Metastasis Unknown
n % n % n % n %
Surgery 399 29.3 666 15.2 19 6.2 93 48.4Radiotherapy 199 14.6 818 18.6 74 24.0 23 12.0Systemic Therapy 142 10.4 759 17.3 75 24.4 21 10.9Multi-modality* 611 44.9 2104 47.9 137 44.5 49 25.5Palliative Care 10 0.7 47 1.1 3 1.0 6 3.1Total 1361 100.0 4394 100.0 308 100.0 192 100.0
*Multi-modality includes the combination of Surgery and/or Radiotherapy and/or Systemic Therapy
On the basis of extent of disease, multi-modality was the treatment of choice for cancer mouth among both males (locoregional: 55.9%, distant metastasis: 49.1% and localized: 47.2%) and females (locoregional: 47.9%, localized: 44.9% and distant metastasis: 44.5%). Surgery and radiotherapy were the second choice of treatment depending upon the clinical extent of disease.

111
Report of National Cancer Registry Programme 2012-2016 Head & Neck Cancers
9.3 Cancer Tonsil, Other Oropharynx and Phar-ynx Unspeciied (ICD: C09, C10, C14)
Fig. 9.3.1 Annual Percent Change (APC) in Age Adjusted Incidence Rates (AAR) over the Time Period - Cancer Tonsil
There was a signiicant decrease in the incidence rates for cancer tonsil in Kamrup urban, Nagpur and Mumbai in males.
Fig. 9.3.2 Comparison of Age Adjusted Incidence Rates (AAR) of Asian countries with PBCRs under NCRP- Cancer Tonsil
Males
Females

112
Report of National Cancer Registry Programme 2012-2016 Head & Neck Cancers
Fig. 9.3.3 Comparison of Age Adjusted Incidence Rates (AAR) of Non-Asian countries with PBCRs under NCRP - Cancer Tonsil
Males
Females
East Khasi Hills district (8.7 per 100,000) and Meghalaya (6.4 per 100,000) had the highest incidence rate of cancer tonsil among males in the world and Kamrup urban (1.7 per 100,000) had the highest incidence rate among females in Asia.

113
Report of National Cancer Registry Programme 2012-2016 Head & Neck Cancers
Fig. 9.3.4 Comparison of Age Adjusted Incidence Rates (AAR) of Asian countries with PBCRs under NCRP- Cancer Other Oropharynx
Males
Fig. 9.3.5 Comparison of Age Adjusted Incidence Rates (AAR) of Non-Asian countries with PBCRs under NCRP - Cancer Other Oropharynx
Males
114
Report of National Cancer Registry Programme 2012-2016 Head & Neck Cancers
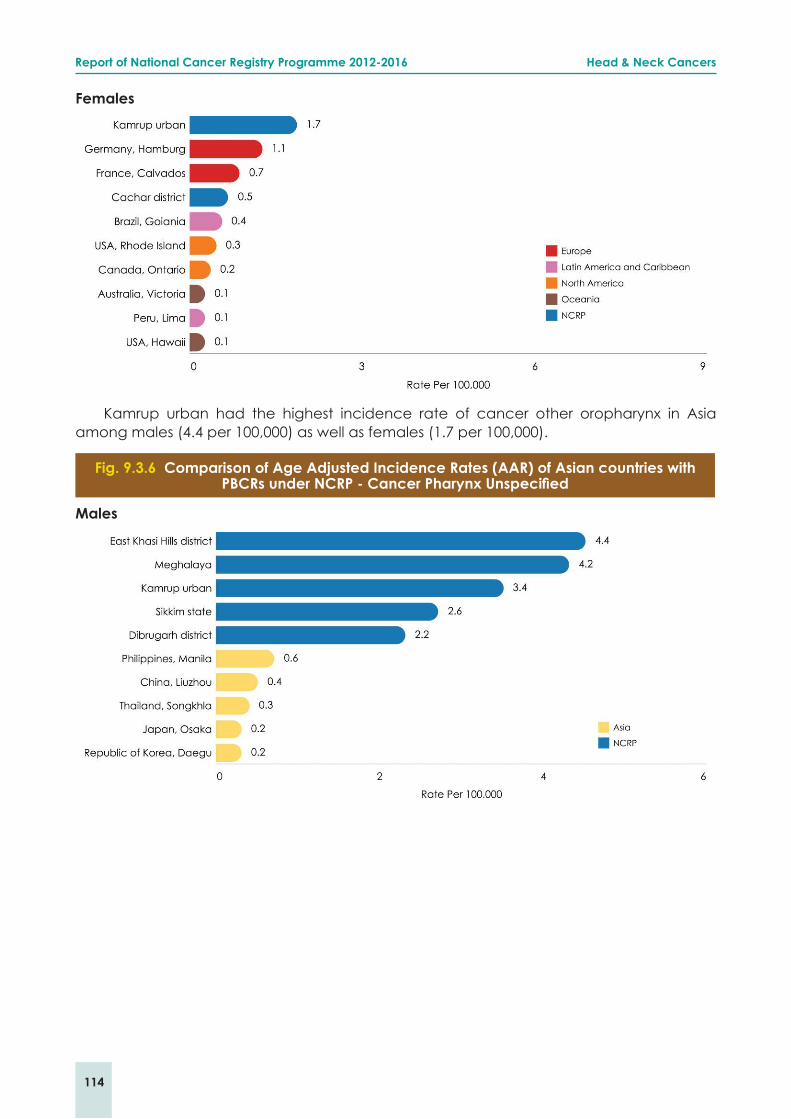
Females
Kamrup urban had the highest incidence rate of cancer other oropharynx in Asia among males (4.4 per 100,000) as well as females (1.7 per 100,000).
Fig. 9.3.6 Comparison of Age Adjusted Incidence Rates (AAR) of Asian countries with PBCRs under NCRP - Cancer Pharynx Unspeciied
Males
115
Report of National Cancer Registry Programme 2012-2016 Head & Neck Cancers
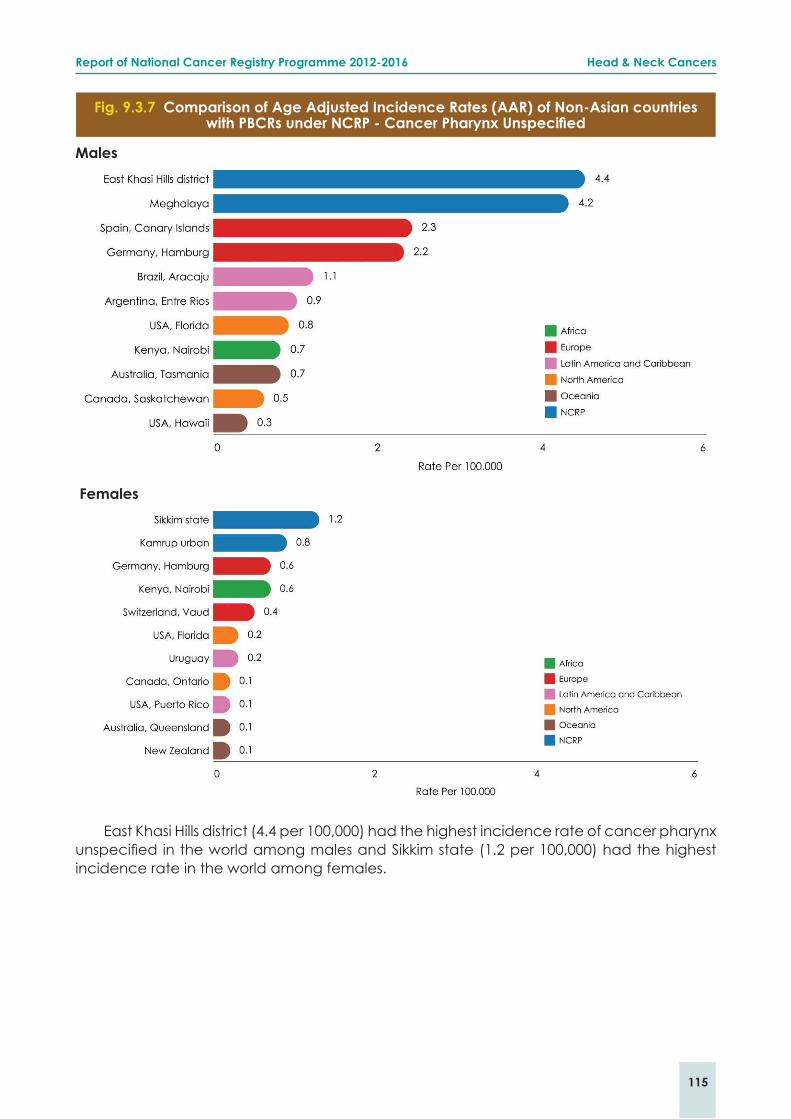
Fig. 9.3.7 Comparison of Age Adjusted Incidence Rates (AAR) of Non-Asian countries with PBCRs under NCRP - Cancer Pharynx Unspeciied
Males
Females
East Khasi Hills district (4.4 per 100,000) had the highest incidence rate of cancer pharynx unspeciied in the world among males and Sikkim state (1.2 per 100,000) had the highest incidence rate in the world among females.

116
Report of National Cancer Registry Programme 2012-2016 Head & Neck Cancers
Table 9.3.1 Number (n) and Relative Proportion (%) according to Clinical Extent of Disease - Cancer Oropharynx
Clinical Extent of DiseaseMales Females Both Sexes
n % n % n %
Localised only 2161 20.0 399 22.6 2560 20.3Locoregional 7757 71.7 1212 68.6 8969 71.2Distant metastasis 633 5.8 95 5.4 728 5.8Unknown 273 2.5 60 3.4 333 2.6Total 10824 100.0 1766 100.0 12590 100.0
Locoregional was the commonest presentation for cancer of oropharynx (males 71.7% and females 68.6%). The relative proportion of clinical extent of disease for cancer oropharynx was similar among males and females.
Table 9.3.2 Number (n) and Relative Proportion (%) of Types of Treatment according to Clinical Extent of Disease for Cancer Oropharynx
Males
Treatment
Clinical Extent of Disease
Localised only Locoregional Distant metastasis Unknown
n % n % n % n %
Surgery 141 6.5 112 1.4 3 0.5 12 4.5
Radiotherapy 731 33.9 3140 40.5 206 32.5 51 19.0
Systemic Therapy 242 11.2 561 7.2 114 18.0 62 23.0
Multi-modality 1037 48.1 3879 50.1 309 48.8 144 53.5
Palliative Care 7 0.3 55 0.7 1 0.2 - -
Total 2158 100.0 7747 100.0 633 100.0 269 100.0
Females
Treatment
Clinical Extent of Disease
Localised only Locoregional Distant metastasis Unknown
n % n % n % n %
Surgery 61 15.3 45 3.7 5 5.3 9 15.3Radiotherapy 122 30.7 494 40.8 23 24.2 11 18.6Systemic Therapy 26 6.5 114 9.4 14 14.7 10 16.9Multi-modality 188 47.2 551 45.5 53 55.8 29 49.2Palliative Care 1 0.3 7 0.6 - - - -Total 398 100.0 1211 100.0 95 100.0 59 100.0
*Multi-modality includes the combination of Surgery and/or Radiotherapy and/or Systemic Therapy
On the basis of extent disease, multi-modality was the treatment of choice for cancer oropharynx among both males (locoregional: 50.1%, localized: 48.1% and distant metastasis: 48.8%) and females (distant metastasis: 55.8%, localized: 47.2%, and locoregional: 45.5%). Radiotherapy was the second choice of treatment in both genders.

117
Report of National Cancer Registry Programme 2012-2016 Head & Neck Cancers
9.4 Cancer Nasopharynx (ICD-10: C11)Fig. 9.4.1 Comparison of Age Adjusted Incidence Rates (AAR) of Asian countries with
PBCRs under NCRP - Cancer Nasopharynx
Males
Females
In Asia, Zhongshan City (25.0 per 100,000) in China had the highest incidence of cancer nasopharynx among males and Zhuhai in China (9.0 per 100,000) had the highest AAR in females.

118
Report of National Cancer Registry Programme 2012-2016 Head & Neck Cancers
Fig. 9.4.2 Comparison of Age Adjusted Incidence Rates (AAR) of Non-Asian countries with PBCRs under NCRP - Cancer Nasopharynx
Males
Females
Nagaland had the highest AAR of cancer nasopharynx when compared with Non-Asian countries both in males (14.4 per 100,000) and females (6.5 per 100,000).

119
Report of National Cancer Registry Programme 2012-2016 Head & Neck Cancers
Table 9.4.1 Number (n) and Relative Proportion (%) according to Clinical Extent of Disease - Cancer Nasopharynx
Clinical Extent of DiseaseMales Females Both sexes
n % n % n %
Localised only 248 18.6 97 17.4 345 18.2Locoregional 911 68.3 388 69.7 1299 68.7Distant Metastasis 140 10.5 55 9.9 195 10.3Unknown 35 2.6 17 3.1 52 2.7Total 1334 100.0 557 100.0 1891 100.0
Locoregional was the commonest presentation for Cancer nasopharynx (males 68.3% and females 69.7%). The relative proportions of clinical extent of disease for cancer nasopharynx were similar among males and females.
Table 9.4.2 Number (n) and Relative Proportion (%) of Types of Treatment according to Clinical Extent of Disease - Cancer Nasopharynx
Males
Treatment
Clinical Extent of Disease
Localised only Locoregional Distant Metastasis Unknown
n % n % n % n %
Surgery 4 1.6 9 1.0 1 0.7 1 2.9Radiotherapy 33 13.4 108 11.9 30 21.4 5 14.3Systemic Therapy 48 19.4 77 8.5 27 19.3 7 20.0Multi-modality* 161 65.2 707 77.7 82 58.6 22 62.9Palliative Care 1 0.4 9 1.0 - - - - Total 247 100.0 910 100.0 140 100.0 35 100.0
Females
Treatment
Clinical Extent of Disease
Localised only Locoregional Distant Metastasis Unknown
n % n % n % n %
Surgery 2 2.1 1 0.3 1 1.8 1 5.9Radiotherapy 5 5.2 59 15.2 9 16.4 4 23.5Systemic Therapy 17 17.5 52 13.4 9 16.4 2 11.8Multi-modality* 73 75.3 273 70.5 36 65.5 10 58.8Palliative Care - - 2 0.5 - - - - Total 97 100.0 387 100.0 55 100.0 17 100.0
*Multi-modality includes the combination of Surgery and/or Radiotherapy and/or Systemic Therapy
On the basis of clinical extent of disease, multi-modality was the treatment of choice for cancer nasopharynx among both males (localized: 65.2%, locoregional: 77.7%, and distant metastasis: 58.6%) and females (localized: 75.3%, locoregional: 70.5% and distant metastasis: 65.5%). Systemic therapy was the second choice of treatment among both genders for localised extent of cancer.

120
Report of National Cancer Registry Programme 2012-2016 Head & Neck Cancers
9.5 Cancer Hypopharynx (ICD-10: C12-C13)Fig. 9.5.1 Annual Percent Change (APC) in Age Adjusted Incidence Rates (AAR) over the
Time Period - Cancer Hypopharynx
There was a signiicant decrease in the incidence rate of cancer hypopharynx in Delhi, Chennai, Bangalore, Bhopal, Mumbai and Nagpur in males.
Fig. 9.5.2 Comparison of Age Adjusted Incidence Rates (AAR) of Asian countries with PBCRs under NCRP - Cancer Hypopharynx
Males
Females

121
Report of National Cancer Registry Programme 2012-2016 Head & Neck Cancers
Fig. 9.5.3 Comparison of Age Adjusted Incidence Rates (AAR) of Non-Asian countries with PBCRs under NCRP - Cancer Hypopharynx
Males
Females
East Khasi Hills district (21.8 per 100,000) and Kamrup urban (3.7 per 100,000) had the highest incidence of cancer hypopharynx in the world among males and females, respectively.

122
Report of National Cancer Registry Programme 2012-2016 Head & Neck Cancers
Table 9.5.1 Number (n) and Relative Proportion (%) according to Clinical Extent of Disease - Cancer Hypopharynx
Clinical Extent of DiseaseMales Females Both sexes
n % n % n %
Localised only 1081 15.7 320 20.6 1401 16.6Locoregional 5295 76.9 1120 72.2 6415 76.0Distant Metastasis 325 4.7 68 4.4 393 4.7Unknown 184 2.7 43 2.8 227 2.7Total 6885 100.0 1551 100.0 8436 100.0
Locoregional was the commonest presentation for cancer hypopharynx (males 76.9%
and females 72.2%). The relative proportion of localised cancers of hypopharynx was 15.7%
in males and 20.6 % for females.
Table 9.5.2 Number (n) and Relative Proportion (%) of Types of Treatment according to Clinical Extent of Disease - Cancer Hypopharynx
Males
Treatment
Clinical Extent of Disease
Localised only Locoregional Distant Metastasis Unknown
n % n % n % n %
Surgery 48 4.4 110 2.1 9 2.8 24 13.3Radiotherapy 351 32.5 2042 38.6 109 33.7 41 22.7Systemic Therapy 69 6.4 269 5.1 52 16.1 31 17.1Multi-modality* 610 56.5 2855 54.0 153 47.4 83 45.9Palliative Care 2 0.2 14 0.3 - - 2 1.1Total 1080 100.0 5290 100.0 323 100.0 181 100.0
Females
Treatment
Clinical Extent of Disease
Localised only Locoregional Distant Metastasis Unknown
n % n % n % n %
Surgery 12 3.8 23 2.1 4 5.9 9 20.9Radiotherapy 105 32.8 434 38.8 22 32.4 8 18.6Systemic Therapy 25 7.8 57 5.1 10 14.7 5 11.6Multi-modality* 178 55.6 599 53.5 32 47.1 21 48.8Palliative Care - - 6 0.5 - - - - Total 320 100.0 1119 100.0 68 100.0 43 100.0
*Multi-modality includes the combination of Surgery and/or Radiotherapy and/or Systemic Therapy
On the basis of extent disease, multi-modality was the treatment of choice for cancer hypopharynx among both males (localized: 56.5%, locoregional: 54.0% and distant metastasis: 47.4%) and females (localized: 55.6%, locoregional: 53.5% and distant metastasis: 47.1%). Radiotherapy was the second choice of treatment in both genders.

123
Report of National Cancer Registry Programme 2012-2016 Head & Neck Cancers
9.6 Cancer Larynx (ICD-10: C32)Fig. 9.6.1 Annual Percent Change (APC) in Age Adjusted Incidence Rates (AAR) over the
Time Period - Cancer Larynx
There was a signiicant decrease in the incidence of cancer larynx in Mumbai, Pune, Nagpur and Dibrugarh district in males.

124
Report of National Cancer Registry Programme 2012-2016 Head & Neck Cancers
Fig. 9.6.2 Comparison of Age Adjusted Incidence Rates (AAR) of Asian countries with PBCRs under NCRP - Cancer Larynx
Males
Females
East Khasi Hills district had the highest incidence rate of cancer larynx in Asia in both males (13.5 per 100,000) and females (2.0 per 100,000).

125
Report of National Cancer Registry Programme 2012-2016 Head & Neck Cancers
Fig. 9.6.3 Comparison of Age Adjusted Incidence Rates (AAR) of Non-Asian countries with PBCRs under NCRP – Cancer Larynx
Males
Females
Azores in Portugal (17.3 per 100,000) and Kentucky in USA (2.0 per 100,000) had the highest incidence rate of cancer larynx among Non-Asian countries in males and females, respectively.

126
Report of National Cancer Registry Programme 2012-2016 Head & Neck Cancers
Table 9.6.1 Number (n) and Relative Proportion (%) according to Clinical Extent of Disease - Cancer Larynx
Clinical Extent of DiseaseMales Females Both Sexes
n % n % n %
Localised only 2517 32.9 252 31.0 2769 32.7Locoregional 4612 60.2 497 61.2 5109 60.3Distant Metastasis 313 4.1 33 4.1 346 4.1Unknown 217 2.8 30 3.7 247 2.9Total 7659 100.0 812 100.0 8471 100.0
Locoregional was the commonest presentation for cancer larynx (males 60.2% and females 61.2%). The relative proportions of clinical extent of disease for cancer larynx were similar in males and females.
Table 9.6.2 Number (n) and Relative Proportion (%) of Types of Treatment according to Clinical Extent of Disease - Cancer Larynx
Males
Treatment
Clinical Extent of Disease
Localised only Locoregional Distant Metastasis Unknown
n % n % n % n %
Surgery 242 9.6 259 5.6 13 4.2 57 26.3Radiotherapy 1287 51.1 1783 38.7 99 31.8 59 27.2Systemic Therapy 128 5.1 277 6.0 39 12.5 20 9.2Multi-modality* 846 33.6 2271 49.3 159 51.1 81 37.3Palliative Care 14 0.6 20 0.4 1 0.3 - - Total 2517 100.0 4610 100.0 311 100.0 217 100.0
Females
Treatment
Clinical Extent of Disease
Localised only Locoregional Distant Metastasis Unknown
n % n % n % n %
Surgery 23 9.2 26 5.2 1 3.0 6 20.0Radiotherapy 118 47.0 240 48.4 4 12.1 8 26.7Systemic Therapy 23 9.2 34 6.9 7 21.2 3 10.0Multi-modality* 85 33.9 196 39.5 20 60.6 13 43.3Palliative Care 2 0.8 - - 1 3.0 - - Total 251 100.0 496 100.0 33 100.0 30 100.0
*Multi-modality includes the combination of Surgery and/or Radiotherapy and/or Systemic Therapy
On the basis of extent of disease, radiotherapy was the treatment of choice for cancer larynx among both males (51.1%) and females (47.0%) in localised cancer. Multi-modality was the preferred treatment among both genders in distant metastasis cases (males: 51.1%
and females: 60.6%).