Synthesis of Palladium and Palladium-Copper Nanostructures ...

800 Palladium Drive
Transportation Impact
Assessment
Final Submission
May 14, 2019
Prepared for: Cominar Prepared by: Stantec Consulting Ltd.
800 Palladium Drive Transportation Impact Assessment
Certification
1. I have reviewed and have a sound understanding of the objectives, needs and requirements of the City of Ottawa’s Official Plan, Transportation Master Plan and the Transportation Impact Assessment (2017) Guidelines;
2. I have a sound knowledge of industry standard practice with respect to the preparation of transportation impact assessment reports, including multi modal level of service review;
3. I have substantial experience (more than 5 years) in undertaking and delivering transportation impact studies (analysis, reporting and geometric design) with strong background knowledge in transportation planning, engineering or traffic operations; and
4. I am either a licensed1 or registered1 professional in good standing, whose field of expertise is either transportation engineering or transportation planning.
Signature of individual certifier that s/he meets the above four criteria.
Robert Vastag, RPP Associate, Senior Transportation Planner Project Manager 400 - 1331 Clyde Avenue Ottawa ON K2C 3G4 Phone: (613) 724-4354 Cell: (613) 853-2837 Fax: (613) 722-2799 [email protected]
Lauren O’Grady P. Eng. Transportation Engineer 400 - 1331 Clyde Avenue Ottawa ON K2C 3G4 Phone: (613) 784-2264 Fax: (613) 722-2799 Lauren.O’[email protected]
1 License of registration body that oversees the profession is required to have a code of conduct and ethics guidelines that will ensure appropriate conduct and representation for transportation planning and/or transportation engineering works
2019-05-14
800 Palladium Drive Transportation Impact Assessment
Table of Contents
1.0 SCREENING ................................................................................................................................................... 1
1.1 SUMMARY OF DEVELOPMENT .................................................................................................................... 1
1.2 TRIP GENERATION TRIGGER ....................................................................................................................... 1
1.3 LOCATION TRIGGERS ................................................................................................................................... 2
1.4 SAFETY TRIGGERS ....................................................................................................................................... 2
1.5 SUMMARY ...................................................................................................................................................... 2
2.0 SCOPING ........................................................................................................................................................ 3
2.1 EXISTING AND PLANNED CONDITIONS ...................................................................................................... 3 2.1.1 Proposed Development .............................................................................................................. 3 2.1.2 Existing Conditions ..................................................................................................................... 6 2.1.3 Planned Conditions .................................................................................................................. 13
2.2 STUDY AREA AND TIME PERIODS ............................................................................................................. 18 2.2.1 Study Area ................................................................................................................................ 18 2.2.2 Time Periods ............................................................................................................................ 18 2.2.3 Horizon Years ........................................................................................................................... 18
2.3 EXEMPTIONS REVIEW ................................................................................................................................ 19
3.0 FORECASTING ............................................................................................................................................. 20
3.1 DEVELOPMENT GENERATED TRAVEL DEMAND ..................................................................................... 20 3.1.1 Trip Generation and Mode Shares ........................................................................................... 20 3.1.2 Pass-By and Internal Capture .................................................................................................. 21 3.1.3 Trip Distribution ........................................................................................................................ 23 3.1.4 Trip Assignment ....................................................................................................................... 24
3.2 BACKGROUND NETWORK TRAVEL DEMAND .......................................................................................... 26 3.2.1 Transportation Network Plans .................................................................................................. 26 3.2.2 Background Growth .................................................................................................................. 26 3.2.3 Other Developments ................................................................................................................ 26
3.3 DEMAND RATIONALIZATION ...................................................................................................................... 26
4.0 STRATEGY ................................................................................................................................................... 28
4.1 DEVELOPMENT DESIGN ............................................................................................................................. 28 4.1.1 Design for Sustainable Modes .................................................................................................. 28 4.1.2 Circulation and Access ............................................................................................................. 28 4.1.3 New Street Networks ................................................................................................................ 28
4.2 PARKING ....................................................................................................................................................... 29 4.2.1 Parking Supply ......................................................................................................................... 29 4.2.2 Spillover Parking ...................................................................................................................... 29
4.3 BOUNDARY STREET DESIGN ..................................................................................................................... 29 4.3.1 Design Concept ........................................................................................................................ 29
4.4 ACCESS INTERSECTIONS DESIGN ........................................................................................................... 32 4.4.1 Location and Design of Access ................................................................................................ 32 4.4.2 Intersection Control .................................................................................................................. 32 4.4.3 Intersection Design ................................................................................................................... 32
4.5 TRANSPORTATION DEMAND MANAGEMENT ........................................................................................... 32 4.5.1 Context for TDM ....................................................................................................................... 32 4.5.2 Need and Opportunity .............................................................................................................. 32 4.5.3 TDM Program ........................................................................................................................... 32
4.6 NEIGHBOURHOOD TRAFFIC MANAGEMENT ............................................................................................ 33

800 Palladium Drive Transportation Impact Assessment
4.7 TRANSIT ....................................................................................................................................................... 33 4.7.1 Route Capacity ......................................................................................................................... 33 4.7.2 Transit Priority .......................................................................................................................... 33
4.8 REVIEW OF NETWORK CONCEPT ............................................................................................................. 33
4.9 INTERSECTION DESIGN ............................................................................................................................. 33 4.9.1 Intersection Control .................................................................................................................. 33 4.9.2 Intersection Design ................................................................................................................... 34
5.0 CONCLUSION ............................................................................................................................................... 45
List of Tables
Table 1 - Proposed Land Uses / Land Use Codes ......................................................................................................... 4 Table 2 - Collision Summary for 800 Palladium Drive .................................................................................................. 12 Table 3 - Angle / Turning Impact Collisions .................................................................................................................. 13 Table 4 - City of Ottawa Transportation Master Plan Projects ..................................................................................... 13 Table 5 - Background Developments ........................................................................................................................... 16 Table 6 - Exemptions Review ...................................................................................................................................... 19 Table 7 - Land Uses and Trip Generation Rates .......................................................................................................... 20 Table 8 - Person Trips Generated by Land Use ........................................................................................................... 20 Table 9 - Trips Generated by Travel Mode .................................................................................................................. 21 Table 10 - Pass-By and Internal Capture Trips ............................................................................................................ 22 Table 11 - Traffic Distribution Assumptions .................................................................................................................. 23 Table 12 - MMLOS Conditions (Segments) ................................................................................................................. 31 Table 13 - 2019 Existing Intersection Operations......................................................................................................... 34 Table 14 - 2019 Existing Intersection MMLOS (Palladium / Cyclone Taylor) ............................................................... 36 Table 15 - 2019 Total Future Intersection Operations .................................................................................................. 37 Table 14 - 2019 Total Future Intersection MMLOS (Palladium / Cyclone Taylor) ........................................................ 40 Table 17 – 2024 Ultimate Intersection Operations ....................................................................................................... 41 Table 14 – 2024 Ultimate Intersection MMLOS (Palladium / Cyclone Taylor) .............................................................. 44

800 Palladium Drive Transportation Impact Assessment
List of Figures Figure 1 - Site Location .................................................................................................................................................. 4 Figure 2 - Site Plan ........................................................................................................................................................ 5 Figure 3 - Existing Lane Configuration and Traffic Control ............................................................................................. 7 Figure 4 - Cycling and Pedestrian Facilities ................................................................................................................... 8 Figure 5 - Study Area Transit Routes and Stops ............................................................................................................ 9 Figure 6 - 2019 Existing Traffic Volumes ..................................................................................................................... 11 Figure 7 - TMP Roadway and Transit Improvements ................................................................................................... 14 Figure 8 - Recommended LRT Alignment from Terry Fox Drive to Palladium Drive .................................................... 15 Figure 9 - Background Developments .......................................................................................................................... 17 Figure 10 - Pass-By Trips (PM Peak Hour) .................................................................................................................. 23 Figure 11 - Site Traffic Assignment .............................................................................................................................. 24 Figure 12 - Net Site Generated Traffic Volumes .......................................................................................................... 25 Figure 13 - Background Developments ........................................................................................................................ 27 Figure 14 - 2019 Total Future Traffic Volumes ............................................................................................................. 38 Figure 15 - 2024 Ultimate Traffic Volumes ................................................................................................................... 42
List of Appendices
COMMENT RESPONSE MEMO ............................................................................................ A.1
TRAFFIC DATA ...................................................................................................................... B.1
BACKGROUND TRAFFIC VOLUMES ................................................................................... C.1
TRANSPORTATION DEMAND MANAGEMENT CHECKLISTS ............................................ D.1
INTERSECTION PERFORMANCE WORKSHEETS ............................................................. E.1

800 Palladium Drive Transportation Impact Assessment Screening Report May 14, 2019
1
1.0 SCREENING
1.1 SUMMARY OF DEVELOPMENT
Municipal Address 800 Palladium Drive (Kanata)
Description of Location North-east corner of the Palladium Drive at Cyclone Taylor Boulevard intersection. The site is bound by Palladium Drive to the south, existing office buildings to the north and east, and Cyclone Taylor Boulevard to the west.
Land Use Classification Commercial, Office, Restaurant
Development Size (units) N/A
Development Size (m2) Commercial: 1,000 m2 GFA (11,000 ft2 GFA) Office: 7,400 m2 GFA (80,000 ft2 GFA) Restaurant: 465 m2 GFA (5,000 ft2 GFA)
Number of Accesses and Locations
2 full movements accesses off existing private road, one located 40m north of Palladium Drive and one located 20m east of Cyclone Taylor boulevard
Phase of Development 1 Phase
Buildout Year Assumed build-out and occupancy by 2019
If available, please attach a sketch of the development or site plan to this form.
1.2 TRIP GENERATION TRIGGER
Considering the Development’s Land Use type and Size (as filled out in the previous section), please refer to the Trip Generation Trigger checks below.
Land Use Type Minimum Development Size Triggered
Single-family homes 40 units
Townhomes or apartments 90 units
Office 3,500 m2 ✓
Industrial 5,000 m2
Fast-food restaurant or coffee shop 100 m2 ✓
Destination retail 1,000 m2 ✓
Gas station or convenience market 75 m2
* If the development has a land use type other than what is presented in the table above, estimates of person-trip generation may be made based on average trip generation characteristics represented in the current edition of the Institute of Transportation Engineers (ITE) Trip Generation Manual.
If the proposed development size is greater than the sizes identified above, the Trip Generation Trigger is satisfied.

800 Palladium Drive Transportation Impact Assessment Screening Report May 14, 2019
2
1.3 LOCATION TRIGGERS
Yes No
Does the development propose a new driveway to a boundary street that is designated as part of the City’s Transit Priority, Rapid Transit or Spine Bicycle Networks?
Is the development in a Design Priority Area (DPA) or Transit-oriented Development (TOD) zone? *
*DPA and TOD are identified in the City of Ottawa Official Plan (DPA in Section 2.5.1 and Schedules A and B; TOD in Annex 6). See Chapter 4 for a list of City of Ottawa Planning and Engineering documents that support the completion of TIA).
If any of the above questions were answered with ‘Yes,’ the Location Trigger is satisfied.
1.4 SAFETY TRIGGERS
Yes No
Are posted speed limits on a boundary street are 80 km/hr or greater?
Are there any horizontal/vertical curvatures on a boundary street limits sight lines at a proposed driveway? ✓
Is the proposed driveway within the area of influence of an adjacent traffic signal or roundabout (i.e. within 300 m of intersection in rural conditions, or within 150 m of intersection in urban/ suburban conditions)?
✓
Is the proposed driveway within auxiliary lanes of an intersection?
Does the proposed driveway make use of an existing median break that serves an existing site?
Is there a documented history of traffic operations or safety concerns on the boundary streets within 500 m of the development?
Does the development include a drive-thru facility?
If any of the above questions were answered with ‘Yes,’ the Safety Trigger is satisfied.
1.5 SUMMARY
Yes No
Does the development satisfy the Trip Generation Trigger? ✓
Does the development satisfy the Location Trigger?
Does the development satisfy the Safety Trigger? ✓ If none of the triggers are satisfied, the TIA Study is complete. If one or more of the triggers is satisfied, the TIA Study must continue into the next stage (Screening and Scoping).

800 Palladium Drive Transportation Impact Assessment Scoping
May 14, 2019
ol w:\active\163601264\planning\report\4. tia submission\rpt.800.palladium.final.tia.20190507.docx 3
2.0 SCOPING
2.1 EXISTING AND PLANNED CONDITIONS
2.1.1 Proposed Development
Cominar is preparing a development application for Site Plan Control of a proposed development in the Kanata
community of Ottawa, Ontario. The proposed development is located at the north-east corner of the Palladium Drive at
Cyclone Taylor Boulevard intersection. The site is bound by Palladium Drive to the south, existing office buildings to
the north and east, and Cyclone Taylor Boulevard to the west.
Figure 1 illustrates the location of the subject development. The subject site is currently zoned as Mixed-Use Centre
(MC) Zone; the purpose of the MC Zone, according to the City of Ottawa Official Plan, is to:
• “Ensure that the areas designated Mixed-Use Centres in the Official Plan, or a similar designation in a
Secondary Plan, accommodate a combination of transit-supportive uses such as offices, secondary and post
secondary schools, hotels, hospitals, large institutional buildings, community recreation and leisure centres,
day care centres, retail uses, entertainment uses, services such as restaurants and personal service
businesses, and high- and medium-density residential uses.
• Allow the permitted uses in a compact and pedestrian-oriented built form in mixed-use buildings or side by
side in separate buildings, and
• Impose development standards that ensure medium to high profile development while minimizing its impact
on surrounding residential areas.”
The existing property is currently a gravel parking lot. The two existing site accesses along the private road surrounding
the subject development are proposed to remain. One site access is located approximately 40m north of Palladium
Drive and the other site access is located approximately 20m east of Cyclone Taylor Boulevard. Neither site access
currently has any turning movement restrictions. A total of 319 vehicle parking spaces will be provided as part of the
proposed development.
The proposed development will be constructed in one phase. Build-out and occupancy of the proposed development
is anticipated to occur in 2019.
Table 1 outlines the proposed land uses assumed for the analysis which were obtained from the Institute of
Transportation (ITE) Trip Generation Manual 10th Edition.
Figure 2 illustrates the proposed site plan.

800 Palladium Drive Transportation Impact Assessment Scoping
May 14, 2019
ol w:\active\163601264\planning\report\4. tia submission\rpt.800.palladium.final.tia.20190507.docx 4
Figure 1 - Site Location
Table 1 - Proposed Land Uses / Land Use Codes
Land Use Size Land Use Code (LUC)
LUC 820 11,000 ft2 GFA Shopping Centre
LUC 710
80,000 ft2 GFA (20,000 ft2 per floor, four floors of office space)
General Office Building
LUC 932 5,000 ft2 GFA High-Turnover Restaurant

800 Palladium Drive Transportation Impact Assessment Scoping
May 14, 2019
ol w:\active\163601264\planning\report\4. tia submission\rpt.800.palladium.final.tia.20190507.docx 5
Figure 2 - Site Plan

800 Palladium Drive Transportation Impact Assessment Scoping
May 14, 2019
ol w:\active\163601264\planning\report\4. tia submission\rpt.800.palladium.final.tia.20190507.docx 6
2.1.2 Existing Conditions
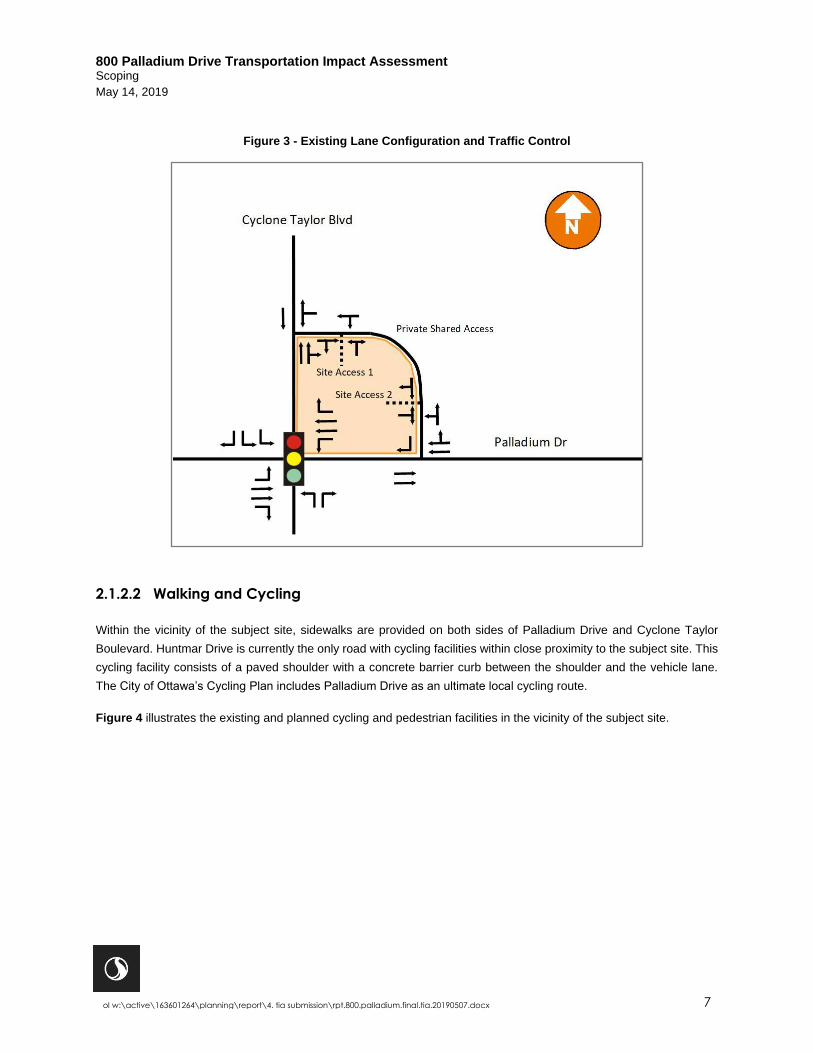
2.1.2.1 Roads and Traffic Control
The roadways under consideration in the study area are described as follows:
Palladium Drive Within the vicinity of the subject site, Palladium Drive is a municipal four-lane
divided urban arterial roadway. The posted speed limit along Palladium Drive
across the frontage of the subject site is 70 km/h. Sidewalks are provided along
both sides of Palladium Drive.
Cyclone Taylor Boulevard Cyclone Taylor Boulevard is a municipal urban local road with a default speed limit
of 50 km/h. The majority of the roadway has a four-lane cross-section, however,
at the subject Site Access 1, the cross-section is reduced to a three-lane cross-
section. Sidewalks are provided along both sides of Cyclone Taylor Boulevard.
This roadway predominately services the Canadian Tire Centre as well as the
existing office buildings at the corner of the Palladium Drive at Cyclone Taylor
Boulevard intersection. The intersection with Palladium Drive is currently
signalized and includes exclusive auxiliary turning lanes on the north, east, and
west legs.
Private Shared Access The private shared access road currently provides access to the existing office
buildings located on the northeast quadrant of the Palladium Drive at Cyclone
Taylor Boulevard intersection. This road is a private road and does not have a
posted speed limit, therefore, the default speed limit if assumed to be 50 km/hr.
There is currently a sidewalk along the western / northern edges of the road from
Palladium Drive to Cyclone Taylor Boulevard. The intersection of the Private
Shared Access and Palladium Drive is currently an uncontrolled right-in / right-out
intersection due to the centre median along Palladium Drive. The intersection of
the Private Shared Access and Cyclone Taylor Boulevard is currently an
uncontrolled intersection with no turning restrictions. Both Site Access 1 and Site
Access 2 intersections with the Private Shared Road are currently uncontrolled
intersections with a shared left / right lane out of the subject development and no
exclusive turning lanes into the subject development.
Along Cyclone Taylor Boulevard, approximately 90m north of Palladium Drive, there is an access to parking lot 6 for
the Canadian Tire Centre on the west side of Cyclone Taylor Boulevard. There is also an access to the existing office
development on the east side of Cyclone Taylor Boulevard approximately 200m north of Palladium Drive.
Figure 3 illustrates the existing lane configuration and traffic control.
800 Palladium Drive Transportation Impact Assessment Scoping
May 14, 2019
ol w:\active\163601264\planning\report\4. tia submission\rpt.800.palladium.final.tia.20190507.docx 7
Figure 3 - Existing Lane Configuration and Traffic Control
2.1.2.2 Walking and Cycling
Within the vicinity of the subject site, sidewalks are provided on both sides of Palladium Drive and Cyclone Taylor
Boulevard. Huntmar Drive is currently the only road with cycling facilities within close proximity to the subject site. This
cycling facility consists of a paved shoulder with a concrete barrier curb between the shoulder and the vehicle lane.
The City of Ottawa’s Cycling Plan includes Palladium Drive as an ultimate local cycling route.
Figure 4 illustrates the existing and planned cycling and pedestrian facilities in the vicinity of the subject site.

800 Palladium Drive Transportation Impact Assessment Scoping
May 14, 2019
ol w:\active\163601264\planning\report\4. tia submission\rpt.800.palladium.final.tia.20190507.docx 8
Figure 4 - Cycling and Pedestrian Facilities
(Source: geoOttawa, accessed January 7th, 2019)

800 Palladium Drive Transportation Impact Assessment Scoping
May 14, 2019
ol w:\active\163601264\planning\report\4. tia submission\rpt.800.palladium.final.tia.20190507.docx 9
2.1.2.3 Transit
Transit service is currently provided in the immediate vicinity of the proposed development via the following routes:
Route 62 is a local route that runs between the Goulbourn Recreation Centre and St. Laurent Station
Route 162 is a local route that runs between Stittsville and Terry Fox Station
Route 261 is a Connexion peak directional route that runs between Stittsville and Mackenzie King station
Route 263 is a Connexion peak directional route that runs between Fallowfield and Mackenzie King station
There are four transit stops that are dedicated to routes 62 and 162 that are provided within 400 meters of the subject
site; two along Palladium Drive and two along Cycling Taylor Boulevard.
Figure 5 illustrates nearby transit routes and bus stop shelter locations.
Figure 5 - Study Area Transit Routes and Stops
(Source: OC Transpo System Map, accessed December 21st, 2018)
2.1.2.4 Traffic Management Measures
No traffic management measures are currently provided near the subject site.
2.1.2.5 Traffic Volumes
2016 turning movement counts for the Palladium Drive at Cyclone Taylor Boulevard intersection were obtained from
the City of Ottawa. A 2% annual growth rate was applied to these traffic volumes to bring them to 2019 existing volumes.
The traffic volumes at the two Private Shared Access intersections were obtained by Stantec in January 2019.
Transit stops Proposed Development
800 Palladium Drive Transportation Impact Assessment Scoping
May 14, 2019
ol w:\active\163601264\planning\report\4. tia submission\rpt.800.palladium.final.tia.20190507.docx 10
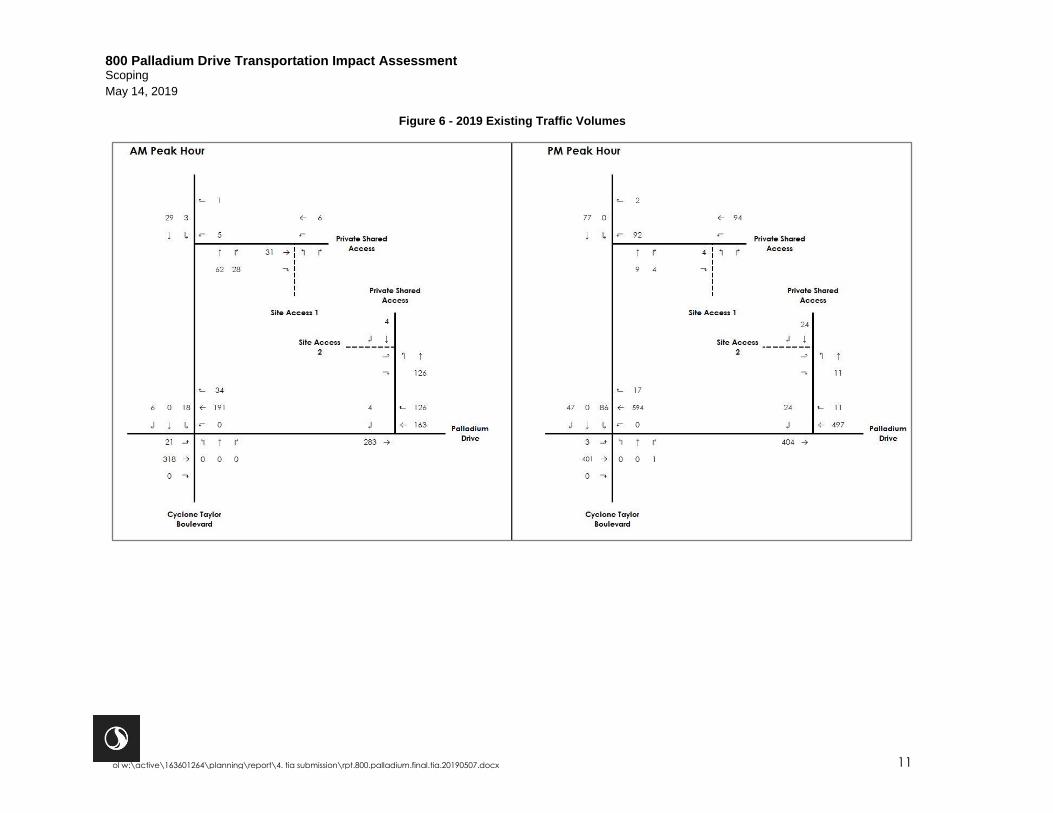
Figure 6 illustrates the 2019 traffic volumes at the study area intersections.
Appendix B contains the traffic data and is provided for reference.
800 Palladium Drive Transportation Impact Assessment Scoping
May 14, 2019
ol w:\active\163601264\planning\report\4. tia submission\rpt.800.palladium.final.tia.20190507.docx 11
Figure 6 - 2019 Existing Traffic Volumes

800 Palladium Drive Transportation Impact Assessment Scoping
May 14, 2019
ol w:\active\163601264\planning\report\4. tia submission\rpt.800.palladium.final.tia.20190507.docx 12
2.1.2.6 Collision History
Collision data was provided by the City of Ottawa for the period January 2013 to December 2017 in the vicinity of the
subject site. The data was reviewed to determine if any intersections or road segments exhibited an identifiable collision
pattern during the five (5) year period.
Table 2 summarizes the collision class and impact types for each road segment and intersection in the study area.
Table 2 - Collision Summary for 800 Palladium Drive
LOCATION CLASS
IMPACT TYPE
Sideswipe Angle / Turning
Rear End Single Vehicle
Other
Palladium Drive between Huntmar Drive and Frank Finnigan Way
Property Damage 2
Non-Fatal
Palladium Drive at Frank Finnigan Way
Property Damage 1
Non-Fatal 1
Cyclone Taylor Boulevard between Frank Finnigan Way and Palladium Drive
Property Damage 1 3 1
Non-Fatal 2
Palladium Drive between Frank Finnigan Way and Cyclone Taylor Boulevard
Property Damage 1
Non-Fatal
Palladium Drive at Cyclone Taylor Boulevard
Property Damage 2 3 2
Non-Fatal 1
Palladium Drive between Cyclone Taylor Boulevard and Silver Seven Road
Property Damage 1 1
Non-Fatal 1
Total
Property Damage
5 8 4 1
Non-Fatal 1 2 2
As outlined in Table 2 above, the intersection of Palladium Drive at Cyclone Taylor Boulevard experienced a total of 8
collisions (35%) and the roadway segment along Cyclone Taylor Boulevard between Frank Finnigan Way and
Palladium Drive experienced a total of 7 collisions (30%).
The “angle / turning” type impacts had the most occurrences (40%) of all five impact types. The angle / turning impacts
were further reviewed to determine if there are any other notable collision patterns.
Table 3 below includes the breakdown of the angle / turning impact collision types. The vast majority (89%) of the angle
/ turning type impact collisions occurred during clear environmental conditions. Of these collisions that occurred during
clear environmental conditions, 88% of them occurred on dry surface conditions.
No discernable pattern of collisions was identified within the vicinity of the subject site.

800 Palladium Drive Transportation Impact Assessment Scoping
May 14, 2019
ol w:\active\163601264\planning\report\4. tia submission\rpt.800.palladium.final.tia.20190507.docx 13
Table 3 - Angle / Turning Impact Collisions
SURFACE CONDITIONS ENVIRONMENT
Clear Rain Snow
Dry 7
Wet 1
Slush 1
2.1.3 Planned Conditions
2.1.3.1 Road Network Modifications
A number of roadway and transit improvements are scheduled to occur within the vicinity of the subject development,
as outlined in the City of Ottawa’s Transportation Master Plan and are summarized in Table 4 below.
Table 4 - City of Ottawa Transportation Master Plan Projects
Project Description TMP Phase
Hazeldean Road Transit signal priority and queue jump lanes between Stittsville Main Street and Eagleson Road.
Affordable Network (2031) and Network Concept
Stittsville Main Street Transit signal priority and queue jump lanes between Fernbank Road and Hazeldean Road.
Network Concept (post 2031)
Stittsville North-South Arterial
New two-lane road between Palladium Drive and Fernbank Road.
Between Fernbank Road and Iber Road (already constructed) Between Palladium and Iber Road - Phase 2 (2020 – 2025)
Transit signal priority and queue jump lanes at selected intersections.
Affordable Network (before 2031)
West Transitway Extension
Exclusive and at-grade BRT between Terry Fox and Eagleson Station.
Affordable Network (before 2031)
Exclusive BRT between Fernbank Road and Eagleson Station.
Network Concept (post 2031)
Huntmar Drive
Widen from two to four lanes between Campeau Drive extension and Cyclone Taylor Boulevard. Widen from two to four lanes between Palladium Drive and Maple Grove Road.
Phase 3 (2026 – 2031)
Stittsville Main Street Extension
New two-lane road between Palladium Drive and Maple Grove Road.
Phase 3 (2026 – 2031)

800 Palladium Drive Transportation Impact Assessment Scoping
May 14, 2019
ol w:\active\163601264\planning\report\4. tia submission\rpt.800.palladium.final.tia.20190507.docx 14
Palladium Drive Realignment
Realignment of roadway within the vicinity of Huntmar Road to new North-South Arterial.
Phase 2 (2020 – 2025)
Maple Grove Road Widen from two to four lanes between Terry Fox Drive and Huntmar Drive.
Network Concept (post-2031)
Figure 7 illustrates roadway and transit improvements as outlined in the TMP.
Figure 7 - TMP Roadway and Transit Improvements
Source: City of Ottawa’s Transportation Master Plan, November 2013.
Contrary to the above Figure 7, the section of the Stittsville Main Street Extension between the Stittsville North-South
Arterial and Palladium Drive was included in the City’s TMP in error. This section of roadway is not planned to be
included in the future roadway network.
Although the City’s TMP calls for Bus Rapid Transit between Eagleson Station and Fernbank Road, based on the
recently completed Kanata Light Rail Transit Planning and Environmental Assessment Study (August 30, 2018), the
West Transitway Extension will now include Light Rail Transit in place of Bus Rapid Transit. The alignment of the LRT,
as outlined in the completed EA, is located on the north side of Highway 417 and includes stations at March Road,

800 Palladium Drive Transportation Impact Assessment Scoping
May 14, 2019
ol w:\active\163601264\planning\report\4. tia submission\rpt.800.palladium.final.tia.20190507.docx 15
Kanata Town Centre, Terry Fox Drive, Didsbury Road, Campeau Drive, Palladium Drive, Maple Grove Road, and
Hazeldean Road. The LRT will cross Highway 417 at Huntmar Drive and will continue south until Hazeldean Road.
Figure 8 illustrates the proposed alignment for the Kanata Light Rail Transitway Extension within the vicinity of the
subject site.
Figure 8 - Recommended LRT Alignment from Terry Fox Drive to Palladium Drive
Source: Kanata Light Rail Transit Planning and Environmental Assessment Study, Aug. 30, 2018
800 Palladium Drive Transportation Impact Assessment Scoping
May 14, 2019
ol w:\active\163601264\planning\report\4. tia submission\rpt.800.palladium.final.tia.20190507.docx 16
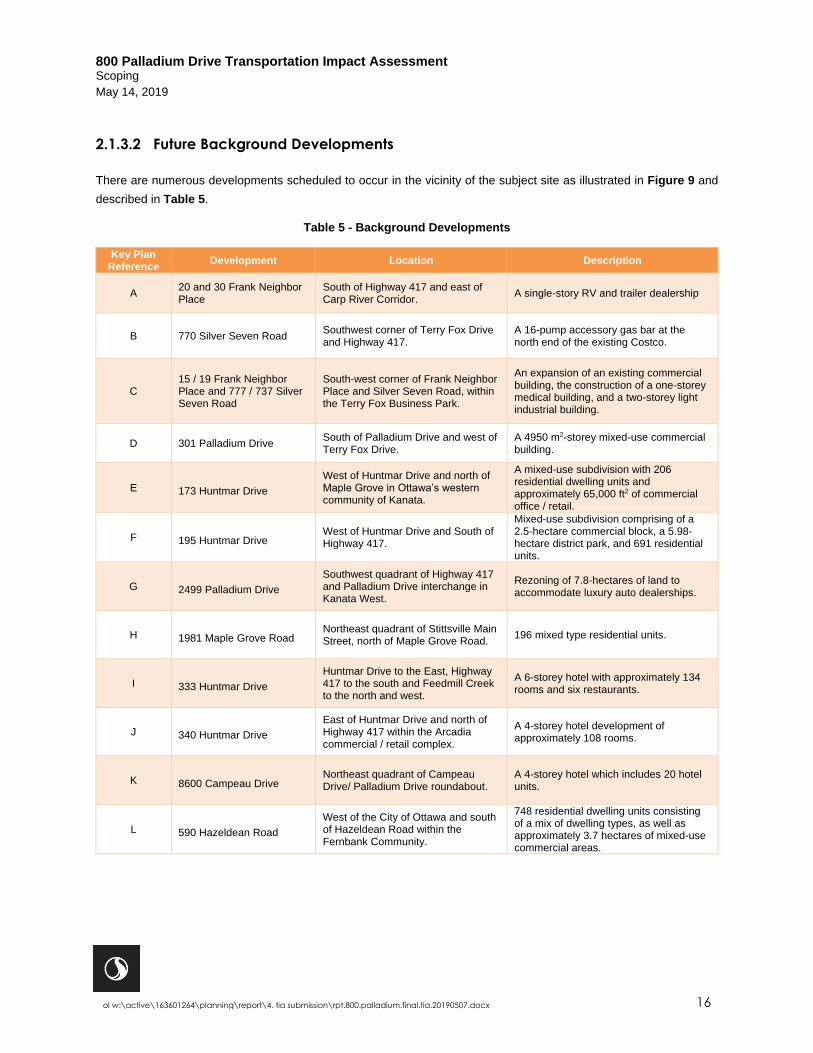
2.1.3.2 Future Background Developments
There are numerous developments scheduled to occur in the vicinity of the subject site as illustrated in Figure 9 and
described in Table 5.
Table 5 - Background Developments
Key Plan Reference
Development Location Description
A 20 and 30 Frank Neighbor Place
South of Highway 417 and east of Carp River Corridor.
A single-story RV and trailer dealership
B 770 Silver Seven Road Southwest corner of Terry Fox Drive and Highway 417.
A 16-pump accessory gas bar at the north end of the existing Costco.
C 15 / 19 Frank Neighbor Place and 777 / 737 Silver Seven Road
South-west corner of Frank Neighbor Place and Silver Seven Road, within the Terry Fox Business Park.
An expansion of an existing commercial building, the construction of a one-storey medical building, and a two-storey light industrial building.
D 301 Palladium Drive South of Palladium Drive and west of Terry Fox Drive.
A 4950 m2-storey mixed-use commercial building.
E 173 Huntmar Drive
West of Huntmar Drive and north of Maple Grove in Ottawa’s western community of Kanata.
A mixed-use subdivision with 206 residential dwelling units and approximately 65,000 ft2 of commercial office / retail.
F 195 Huntmar Drive West of Huntmar Drive and South of Highway 417.
Mixed-use subdivision comprising of a 2.5-hectare commercial block, a 5.98-hectare district park, and 691 residential units.
G 2499 Palladium Drive
Southwest quadrant of Highway 417 and Palladium Drive interchange in Kanata West.
Rezoning of 7.8-hectares of land to accommodate luxury auto dealerships.
H 1981 Maple Grove Road Northeast quadrant of Stittsville Main Street, north of Maple Grove Road.
196 mixed type residential units.
I 333 Huntmar Drive
Huntmar Drive to the East, Highway 417 to the south and Feedmill Creek to the north and west.
A 6-storey hotel with approximately 134 rooms and six restaurants.
J 340 Huntmar Drive
East of Huntmar Drive and north of Highway 417 within the Arcadia commercial / retail complex.
A 4-storey hotel development of approximately 108 rooms.
K 8600 Campeau Drive Northeast quadrant of Campeau Drive/ Palladium Drive roundabout.
A 4-storey hotel which includes 20 hotel units.
L 590 Hazeldean Road
West of the City of Ottawa and south of Hazeldean Road within the Fernbank Community.
748 residential dwelling units consisting of a mix of dwelling types, as well as approximately 3.7 hectares of mixed-use commercial areas.

800 Palladium Drive Transportation Impact Assessment Scoping
May 14, 2019
ol w:\active\163601264\planning\report\4. tia submission\rpt.800.palladium.final.tia.20190507.docx 17
Figure 9 - Background Developments

800 Palladium Drive Transportation Impact Assessment Scoping
May 14, 2019
ol w:\active\163601264\planning\report\4. tia submission\rpt.800.palladium.final.tia.20190507.docx 18
2.2 STUDY AREA AND TIME PERIODS
2.2.1 Study Area
The proposed study area is limited to the following intersections:
1. Palladium Drive at Cyclone Taylor Boulevard;
2. Cyclone Taylor Boulevard at Private Access Road; and
3. Palladium Drive at Private Access Road.
2.2.2 Time Periods
The proposed scope of the transportation assessment includes the following analysis time periods:
• Weekday AM peak hour of roadway; and
• Weekday PM peak hour of roadway.
2.2.3 Horizon Years
The scope of the transportation assessment proposes the following horizon years:
• 2019 existing conditions;
• 2019 total future conditions (site build-out); and
• 2024 total future conditions (5 years beyond build-out).

800 Palladium Drive Transportation Impact Assessment Scoping
May 14, 2019
ol w:\active\163601264\planning\report\4. tia submission\rpt.800.palladium.final.tia.20190507.docx 19
2.3 EXEMPTIONS REVIEW
Table 6 summarizes the Exemptions Review table from the City of Ottawa’s 2017 Transportation Impact Assessment
Guidelines.
Table 6 - Exemptions Review
Module Element Exemption Considerations Exempted?
Design Review Component
4.1 Development Design
4.1.2 Circulation and Access Only required for site plans No
4.1.3 New Street Networks Only required for plans of subdivision Yes
4.2 Parking
4.2.1 Parking Supply Only required for site plans No
4.2.2 Spillover Parking Only required for site plans where parking supply is 15% below unconstrained demand
Yes
Network Impact Component
4.5 Transportation Demand Management
All Elements Not required for site plans expected to have fewer than 60 employees and/or students on location at any given time
No
4.6 Neighbourhood Traffic Management
4.6.1 Adjacent Neighbourhoods
Only required when the development relies on local or collector streets for access and total volumes exceed ATM capacity thresholds
Yes
4.8 Network Concept
Only required when proposed development generates more than 200 person-trips during the peak hour in excess of the equivalent volume permitted by established zoning
Yes
4.9 Intersection Design All Elements Not required if site generation trigger is not met.
No

800 Palladium Drive Transportation Impact Assessment Forecasting
May 14, 2019
ol w:\active\163601264\planning\report\4. tia submission\rpt.800.palladium.final.tia.20190507.docx 20
3.0 FORECASTING
3.1 DEVELOPMENT GENERATED TRAVEL DEMAND
3.1.1 Trip Generation and Mode Shares
The Institute of Transportation (ITE) Trip Generation Manual (10th edition) was used to forecast auto trip generation for
the proposed development. Land use codes 710 – General Office, 820 – Shopping Centre, and 932 – High-Turnover
Restaurant were thought to be the most representative of the proposed land uses.
Table 7 outlines the assumed land uses and the trip generation rates for each land use.
As per the City of Ottawa’s 2017 TIA Guidelines, the auto trip generation rates of the proposed land uses were
converted to person trips using a conversion factor of 1.28.
Table 8 outlines development-generated person trips for each land use.
Table 7 - Land Uses and Trip Generation Rates
LUC Land Use Size (1000’s
GFA)
Weekday AM Peak Hour Weekday PM Peak Hour
In Out Total In Out Total
710 General Office 80 1.51 0.23 1.73 0.27 1.54 1.82
820 Shopping Centre 11 0.58 0.36 0.94 1.83 1.98 3.81
932 High-Turnover Restaurant
5 5.47 4.47 9.94 6.06 3.71 9.77
Table 8 - Person Trips Generated by Land Use
LUC Land Use Trip Conversion Weekday AM Peak Hour Weekday PM Peak Hour
In Out Total In Out Total
710 General Office
Auto Trips 121 18 139 22 124 145
Conversion Factor 1.28 1.28 1.28 1.28 1.28 1.28
Person Trips 155 24 178 28 159 186
820 Shopping Centre
Auto Trips 6 4 10 20 22 42
Conversion Factor 1.28 1.28 1.28 1.28 1.28 1.28
Person Trips 8 5 13 26 28 54
932 High-Turnover Restaurant
Auto Trips 27 22 49 30 19 49
Conversion Factor 1.28 1.28 1.28 1.28 1.28 1.28
Person Trips 35 28 63 38 24 62
Total Auto Trips 154 44 199 72 165 236
Person Trips 198 57 255 92 211 303
To reflect local travel characteristics, the person trips were assigned to the four primary modal shares (i.e. auto,
passenger, transit, and active moves) according to the TRANS Committee’s 2011 Origin-Destination (O-D) Survey for
the Kanata / Stittsville District. Due to the nature of the proposed land uses and the limited availability of transit, the
transit modal share was decreased from approximately 15% (as per the OD survey) to 10%, which increased the auto
modal share from 65% (as per the OD survey) to 70%. As per direction from the City of Ottawa, the auto mode share
for the general office space was further reduced to account for the trips ‘within the district’. The resulting auto mode

800 Palladium Drive Transportation Impact Assessment Forecasting
May 14, 2019
ol w:\active\163601264\planning\report\4. tia submission\rpt.800.palladium.final.tia.20190507.docx 21
share for the general office space was therefore decreased to 60% and the walk / bike mode share was increased to
15%.
Table 9 outlines the anticipated trip generation potential of the proposed development by travel mode based on
assumed mode share targets.
Table 9 - Trips Generated by Travel Mode
LUC Land Use Trip Conversion Weekday AM Peak Hour Weekday PM Peak Hour
In Out Total In Out Total
710 General Office
Auto 60% 93 14 107 17 95 112
Passenger 15% 23 4 27 4 24 28
Transit 10% 16 2 18 3 16 19
Walk / Bike 15% 23 4 27 4 24 28
820 Shopping Centre
Auto 70% 6 4 10 18 20 38
Passenger 15% 1 1 2 4 4 8
Transit 10% 1 1 2 3 3 6
Walk / Bike 5% 0 0 0 1 1 2
932 High-Turnover Restaurant
Auto 70% 25 20 45 27 17 44
Passenger 15% 5 4 9 6 4 10
Transit 10% 4 3 7 4 2 6
Walk / Bike 5% 2 1 3 2 1 3
Total
Auto Trips 124 38 162 62 132 194
Passenger 29 9 38 14 32 46
Transit 21 6 27 10 21 31
Walk / Bike 29 9 38 14 32 46
3.1.2 Pass-By and Internal Capture
A portion of the auto trips generated by the proposed restaurant and commercial spaces will be ‘pass-by’ in nature.
Pass-by trips are considered intermediate stops between an origin and a destination. They are site trips that are drawn
from existing traffic volumes on the road network that are “passing-by” the site. While the total number of trips generated
by a given development remains the same, the turning movements at study area intersections and site accesses require
adjustments to reflect pass-by traffic. The rate of pass-by traffic is based on the specific land use and the various pass-
by rates were obtained from the ITE Trip Generation Manual. A pass-by rate of 43% was used for the restaurant land
use and a pass-by rate of 34% was used for the commercial land use. Due to the nature of the proposed land uses,
these pass-by rates were applied to the PM peak hour only.
When predicting trips that are associated with different land use types the interaction between those land use types
must be accounted for by applying the principals of internal capture adjustments. Internal capture trips are trips which
are shared between two or more uses on the same site. A portion of the generated trips for each individual land use is
therefore drawn from the adjacent land uses. Internal capture adjustments were made to account for vehicles that visit
more than one land use within the subject commercial development. Since these trips are contained within the subject
site, accounting for each trip separately on the roadway network would result in “double-counting”. For this reason, land
uses that may have associated internal capture trips between one another ultimately had their net new trips adjusted
consistent with typical industry standards. In the subject development, the land uses that are subject to internal capture
reductions are the commercial and restaurant land uses. Due to the nature of the proposed land uses, the internal
capture rates were applied to the PM peak hour only.

800 Palladium Drive Transportation Impact Assessment Forecasting
May 14, 2019
ol w:\active\163601264\planning\report\4. tia submission\rpt.800.palladium.final.tia.20190507.docx 22
Table 10 outlines the pass-by, internal capture, and net new trips anticipated for the proposed development.
Figure 10 illustrates the pass-by trips the proposed development is anticipated to generate in the PM peak hour.
Table 10 - Pass-By and Internal Capture Trips
LUC Land Use Trip Conversion Weekday AM Peak Hour Weekday PM Peak Hour
In Out Total In Out Total
710 General Office
Auto Trips 93 14 107 17 95 112
Internal Capture 0% 0 0 0 0 0 0
Net Auto Trips 93 14 107 17 95 112
Pass-By 0% 0 0 0 0 0 0
Net New Auto Trips 93 14 107 17 95 112
820 Shopping Centre
Auto Trips 6 4 10 18 20 38
Internal Capture 10% 0 0 0 2 2 4
Net Auto Trips 6 4 10 16 18 34
Pass-By 34% 0 0 0 6 6 12
Net New Auto Trips 6 4 10 10 12 22
932 High Turn-Over Restaurant
Auto Trips 25 20 45 27 17 44
Internal Capture 10% 0 0 0 2 2 4
Net Auto Trips 25 20 45 25 15 40
Pass-By 43% 0 0 0 9 9 18
New Auto Trips 25 20 45 16 6 22
Total
Auto Trips 124 38 162 62 132 194
Internal Capture 0 0 0 4 4 8
Net Auto Trips 124 38 162 58 128 186
Pass-By 0 0 0 15 15 30
Net New Auto Trips 124 38 162 43 113 156

800 Palladium Drive Transportation Impact Assessment Forecasting
May 14, 2019
ol w:\active\163601264\planning\report\4. tia submission\rpt.800.palladium.final.tia.20190507.docx 23
Figure 10 - Pass-By Trips (PM Peak Hour)
3.1.3 Trip Distribution
The distribution of traffic to / from the study area was determined through examination of the TRANS Committee’s 2011
Origin-Destination (O-D) Survey for the Kanata / Stittsville District. The percentage of traffic at both Private Shared
Access intersections from the 2019 existing traffic volumes was used to determine the distribution of site traffic through
both study area intersections.
Table 11 provides a summary of the estimated distribution for the traffic generated by the proposed development.
Table 11 - Traffic Distribution Assumptions
Cardinal Direction
Via (to / from)
Cyclone Taylor Boulevard Palladium Drive Palladium Drive
(North) (East) (West)
North 2% 2%
East 40% 32% 8%
South 3% 3%
West 0%
Internal (Kanata / Stittsville)
55% 44% 11%
Total 100% 2% 76% 22%
800 Palladium Drive Transportation Impact Assessment Forecasting
May 14, 2019
ol w:\active\163601264\planning\report\4. tia submission\rpt.800.palladium.final.tia.20190507.docx 24
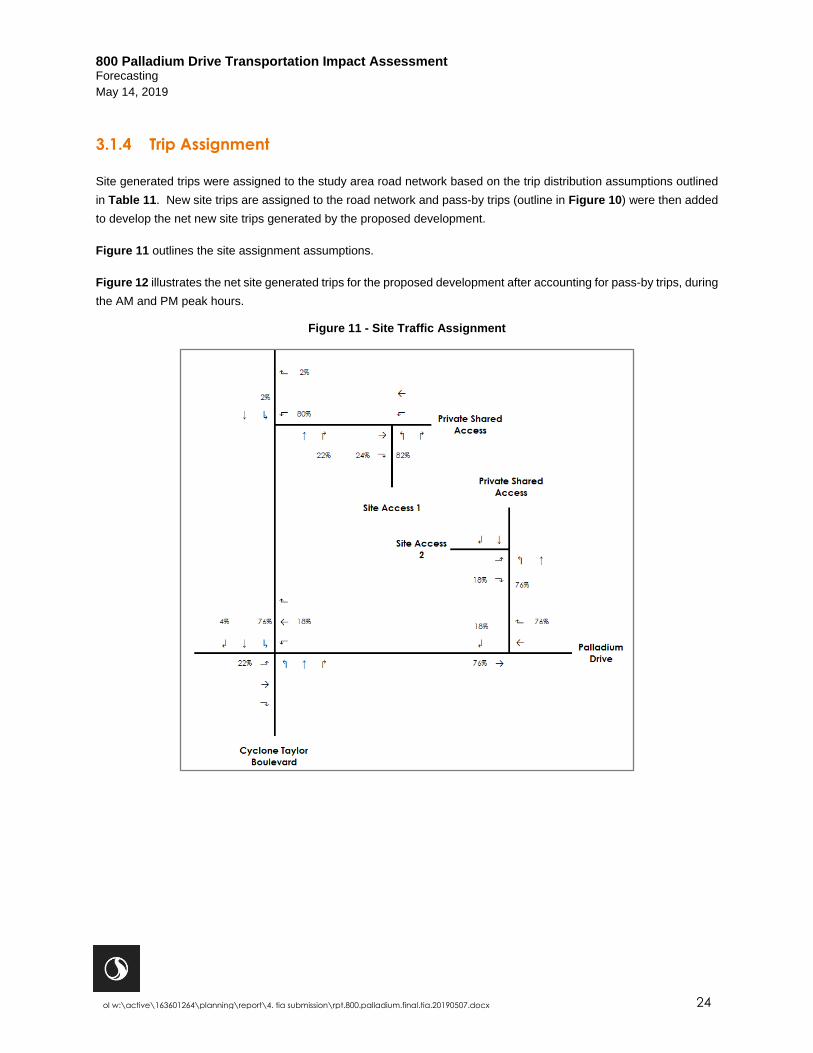
3.1.4 Trip Assignment
Site generated trips were assigned to the study area road network based on the trip distribution assumptions outlined
in Table 11. New site trips are assigned to the road network and pass-by trips (outline in Figure 10) were then added
to develop the net new site trips generated by the proposed development.
Figure 11 outlines the site assignment assumptions.
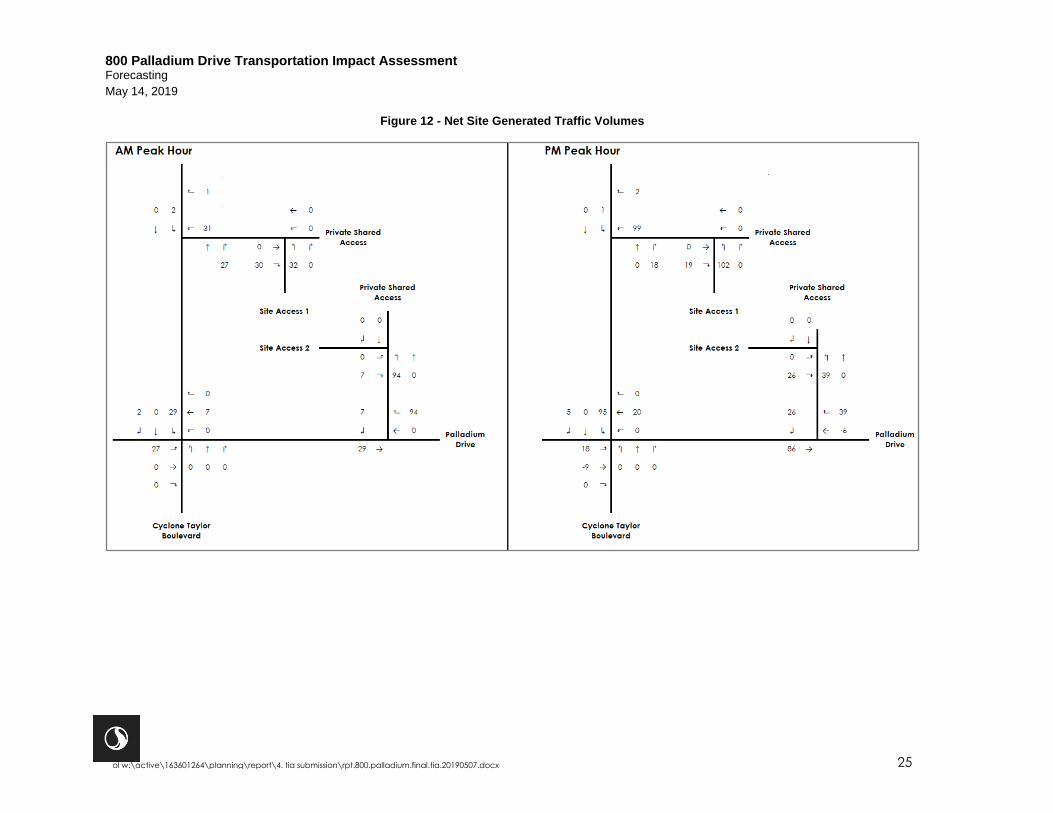
Figure 12 illustrates the net site generated trips for the proposed development after accounting for pass-by trips, during
the AM and PM peak hours.
Figure 11 - Site Traffic Assignment
800 Palladium Drive Transportation Impact Assessment Forecasting
May 14, 2019
ol w:\active\163601264\planning\report\4. tia submission\rpt.800.palladium.final.tia.20190507.docx 25
Figure 12 - Net Site Generated Traffic Volumes

800 Palladium Drive Transportation Impact Assessment Forecasting
May 14, 2019
ol w:\active\163601264\planning\report\4. tia submission\rpt.800.palladium.final.tia.20190507.docx 26
3.2 BACKGROUND NETWORK TRAVEL DEMAND
3.2.1 Transportation Network Plans
As outlined in Table 4 in section 2.1.3.1, a number of road network projects are expected to occur within the vicinity
of the proposed development. Through recent discussions with City of Ottawa staff, it is understood that the timelines
for the roadway projects outlined in the City of Ottawa’s 2013 Transportation Master Plan have been pushed back one
Phase (i.e. Phase 2 (2020 – 2025) projects are now Phase 3 (2026 -2031) projects, etc.). For this reason, it was
assumed that there will not be any improvements to the roadway network in the vicinity of the subject site prior to the
2024 ultimate (+5 year) horizon.
3.2.2 Background Growth
The existing traffic counts were grown at a rate of 2% annually, non-compounding, to represent 2024 background traffic
volumes.
3.2.3 Other Developments
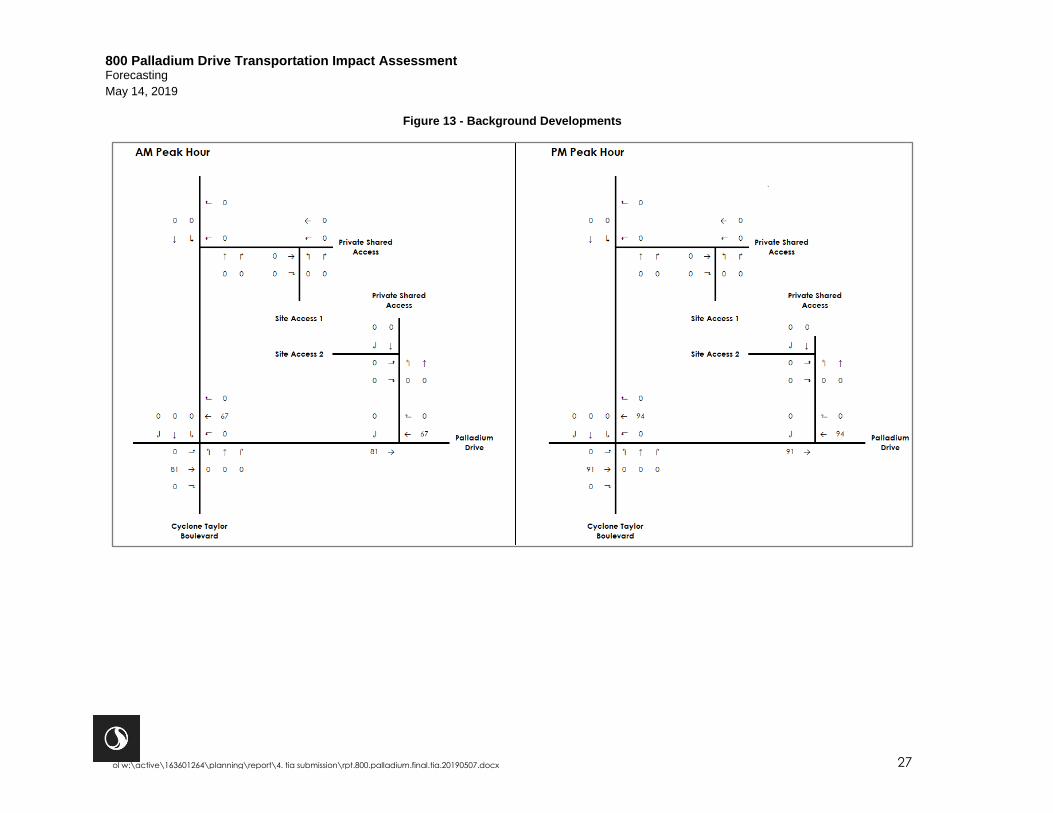
As outlined in Section 2.1.3.2, a number of background developments are planned surrounding the subject site. The
two background developments that will impact the traffic volumes at the study area intersections are the developments
located at 173 Huntmar Drive and 195 Huntmar Drive. The traffic generated by the 173 Huntmar Drive development
was obtained from the 173 Huntmar Drive Mixed-Use Development Community Transportation Study (Parsons 2014).
The build-out year of this development is not outlined in the CTS; therefore, to remain conservative, it was assumed
that it will be built by the 2024 ultimate horizon. The traffic generated by the 195 Huntmar Drive development was
obtained from the Shenkman / Cavanagh Kanata West Community Transportation Study (Parsons 2016). The build-
out year of this development is also not outlined in the CTS; therefore, to remain conservative, it was also assumed
that it will be built by the 2024 ultimate horizon.
Figure 13 below illustrates the traffic generated by the two background developments at the study area intersections.
Appendix C contains the excerpts from the two aforementioned Community Transportation Studies in which the
background traffic data was obtained.
3.3 DEMAND RATIONALIZATION
The proposed development is not anticipated to encounter any capacity restrictions that cannot be resolved through
roadway improvements and therefore no demand rationalization is required.
800 Palladium Drive Transportation Impact Assessment Forecasting
May 14, 2019
ol w:\active\163601264\planning\report\4. tia submission\rpt.800.palladium.final.tia.20190507.docx 27
Figure 13 - Background Developments

800 Palladium Drive Transportation Impact Assessment Strategy
May 14, 2019
ol w:\active\163601264\planning\report\4. tia submission\rpt.800.palladium.final.tia.20190507.docx 28
4.0 STRATEGY
4.1 DEVELOPMENT DESIGN
4.1.1 Design for Sustainable Modes
Bicycle facilities: A total of 36 bicycle parking spaces are provided for the proposed development. These bicycle
parking spaces are provided at the main entrances to the building, on the western and eastern sides.
Pedestrian facilities: Pedestrian connections are included on the site plan which will connect the proposed building
to the existing sidewalks along Palladium Drive and Cyclone Taylor Boulevard.
Parking areas: A total of 267 vehicle parking spaces are provided. This consists of 245 regular vehicle parking spaces,
8 accessible parking spaces, and 14 electric car charging spaces.
The accessible parking spaces are provided adjacent to the entrances to the building. The majority of the electric car
charging spaces (10) are provided on the north side of the building and the remaining 4 electric car charging spaces
are provided on the east side of the building.
Transit facilities: Transit stops for OC Transpo routes 62 and 162 are currently located at the intersection of Palladium
Drive and Cyclone Taylor Boulevard. There are sidewalks along both sides of Palladium Drive and Cyclone Taylor
Boulevard as well as pedestrian crosswalks at the intersection of Palladium Drive at Cyclone Taylor Boulevard for
pedestrians to access these transit stops.
4.1.2 Circulation and Access
Two site accesses are proposed along the Private Shared Access. Site Access 1 is located 20m east of Cyclone Taylor
Boulevard and Site Access 2 is located 40m north of Palladium Drive. Both site accesses will be full movements
accesses with no turning restrictions and they will be stop controlled along the Site Access approach.
Within the vicinity of the subject site, pedestrian access is facilitated through the existing sidewalks along Palladium
Drive, Cyclone Taylor Boulevard, and the Private Shared Access. Sidewalk connections are proposed between
Palladium Drive, Cyclone Taylor Boulevard, and the proposed building to facilitate pedestrian access to and from the
building.
4.1.3 New Street Networks
Not applicable; exempted during screening and scoping.
800 Palladium Drive Transportation Impact Assessment Strategy
May 14, 2019
ol w:\active\163601264\planning\report\4. tia submission\rpt.800.palladium.final.tia.20190507.docx 29
4.2 PARKING
4.2.1 Parking Supply
Auto Parking - As per City of Ottawa Zoning By-law 2008-250 (Sections 101 and 102), the minimum parking space
requirement is 2.3 spaces per 100m2 of office space (gross floor area), 3.4 spaces per 100m2 of retail space (gross
floor area), and 10 spaces per 100m2 of restaurant space (gross floor area).
Based on the proposed land uses, a minimum of 171 vehicle spaces are required for the office component, 35 vehicle
spaces are required for the retail component, and 47 vehicle spaces are required for the restaurant component, for a
total of 253 vehicle parking spaces for the proposed development.
The proposed site plan indicates there will be a total of 267 parking spaces provided, which meets the minimum
requirements.
Bicycle Parking – As per City of Ottawa Zoning By-law 2008-250 (Section 111), the minimum bicycle parking rate of
1 bicycle parking space per 250m2 of office (gross floor area), 1 bicycle parking space per 250m2 of retail (gross floor
area), and 1 bicycle parking space per 250m2 of restaurant (gross floor area).
Based on the proposed land uses, a minimum of 30 bicycle spaces are required for the office component, 4 bicycle
spaces are required for the retail component, and 2 bicycle spaces are required for the restaurant component, for a
total of 36 bicycle spaces for the proposed development.
The proposed site plan indicates there will be 36 bicycle spaces provided, which meets the minimum requirements.
4.2.2 Spillover Parking
Not applicable; exempted during screening and scoping.
4.3 BOUNDARY STREET DESIGN
4.3.1 Design Concept
As outlined in the City of Ottawa’s Official Plan Schedule B, both Palladium Drive and Cyclone Taylor Boulevard are
within the ‘Mixed Use Centre’ designation. With this designation, the MMLOS targets are prescribed in the City of
Ottawa’s Multi-Modal Level of Service (MMLOS) Guidelines.
Based on the aforementioned, the Pedestrian Level of Service (PLOS) target is C for both Palladium Drive and Cyclone
Taylor Boulevard. The Ultimate Cycling Network from the City of Ottawa’s Transportation Master Plan (2013)
designates Palladium Drive as a local cycling route, therefore the Bicycle Level of Service (BLOS) target for this facility
is B. As Cyclone Taylor Boulevard does not have a cycling designation, the BLOS target for this facility is D. Transit
service travelling along both Palladium Drive and Cyclone Taylor Boulevard currently operate within mixed traffic, and
as such, the Transit Level of Service (TLOS) target is D. Palladium Drive is designated as full truck route and therefore
has a Truck Level of Service (TkLOS) target of D. Cyclone Taylor Boulevard is not a designated truck route, therefore,
the TkLOS does not apply for this facility.

800 Palladium Drive Transportation Impact Assessment Strategy
May 14, 2019
ol w:\active\163601264\planning\report\4. tia submission\rpt.800.palladium.final.tia.20190507.docx 30
Table 12 presents the MMLOS conditions for both roadway segments.
Due to the high operating speed along Palladium Drive and the lack of boulevard across the frontage of the subject
site, the Pedestrian Level of Service (PLOS) target of C is not currently being met. Reducing the posted speed limit to
60 km/hr along Palladium Drive would allow this segment to meet the PLOS target of C. Alternatively, implementing a
0.5 – 2.0m boulevard along Palladium Drive across the frontage of the subject site (i.e. between the road and sidewalk)
would also allow the PLOS target to be met. Cyclone Taylor Boulevard currently meets the PLOS target of C.
Due to the posted speed limit and the lack of dedicated cycling facilities along Palladium Drive, this roadway segment
currently does not meet the Bicycle Level of Service (BLOS) target of B Implementing a physically separated bicycle
facility would allow the BLOS target to be met, however, this this would have financial and property impacts. Another
potential solution to meet the BLOS target would be to implement dedicated on-street bicycle lanes while reducing the
posted speed limit to 60 km/hr. If bicycle lanes are not feasible, reducing the speed limit to 40 km/hr while maintaining
the mixed-use lanes would also allow the BLOS target to be met, however, reducing the speed limit by this amount
would be unrealistic as this roadway is classified as an arterial.
As Cyclone Taylor Boulevard does not have a posted speed limit, the default speed limit is 50 km/hr. Based on this
speed limit, the BLOS target of D is currently being met along Cyclone Taylor Boulevard.
In terms of Transit Level of Service (TLOS), both Palladium Drive and Cyclone Taylor Boulevard meet the TLOS target
of D.
Palladium Drive currently has >3.7m curb lane widths, and therefore, this roadway segment meets the TkLOS target
of D.

800 Palladium Drive Transportation Impact Assessment Strategy
May 14, 2019
ol w:\active\163601264\planning\report\4. tia submission\rpt.800.palladium.final.tia.20190507.docx 31
Table 12 - MMLOS Conditions (Segments)
Segment Palladium Drive Cyclone Taylor Boulevard
Target Existing Build-out Existing Build-out
Pede
str
ian
Sidewalk width (m) 2 ** 2 **
C
Boulevard width (m) 01 ** 01 **
AADT > 3000? No ** No **
On-Street parking No ** No **
Operating speed (kph) 80 ** 60 **
Level of Service D ** C **
Bic
ycle
Type of facility Mixed Traffic ** Mixed Traffic **
B / D
Number of travel lanes (both directions)
4 ** 3 **
Raised Median? Yes ** No **
Bike lane width (m) N/A ** N/A **
Operating speed (kph) 70 ** 50 **
Bike lane blockage freq. Rare ** Rare **
Level of Service F ** D **
Tra
nsit Type of facility Mixed ** Mixed **
D Parking/driveway friction Limited ** Limited **
Level of Service D ** D **
Tru
ck Curb lane width (m) > 3.7m **
Not Applicable D / N/A
Number of travel lanes (both directions)
> 2 **
Level of Service A **
Notes: 1. Across the frontages of the subject site, there are no boulevards along both road segments ** Indicates there are no changes between horizons or scenarios The target of B / D indicates that the target is B for Palladium Drive and D for Cyclone Taylor Boulevard

800 Palladium Drive Transportation Impact Assessment Strategy
May 14, 2019
ol w:\active\163601264\planning\report\4. tia submission\rpt.800.palladium.final.tia.20190507.docx 32
4.4 ACCESS INTERSECTIONS DESIGN
4.4.1 Location and Design of Access
Site Access 1 is located 20m east of Cyclone Taylor Boulevard and Site Access 2 is located 40m north of Palladium
Drive. Both site accesses will be full movements accesses with no turning restrictions and they will be stop-controlled
along the Site Access approaches.
4.4.2 Intersection Control
The site accesses are low-volume driveways located on a Private Shared Access and therefore stop control on the
minor site access approach is appropriate for both site accesses.
4.4.3 Intersection Design
Section 4.9.2 contains the detailed intersection and MMLOS analyses under all horizons.
4.5 TRANSPORTATION DEMAND MANAGEMENT
4.5.1 Context for TDM
The proposed development is currently owned by Cominar Real Estate Investing Trust. Ford General Motors will
eventually move into the office space, however, the tenants for the retail and restaurant components are not yet known.
As outlined in Section 3.1.1, the Traffic Assessment Zone (TAZ) in which the subject development resides calls for an
auto mode share of 65%. Based on the availability of transit service and the lack of bicycle facilities, the auto mode
share for the restaurant and retail land uses was increased to 70%. At the direction of the City of Ottawa, the auto mode
share for the office land use was decreased to 60% to account for the lower auto mode share for trips ‘within the district’
(i.e., within the TAZ).
As the proposed development is not anticipated to generate a substantial amount of vehicle traffic as compared to the
traffic that is already on the boundary road network, these auto modal shares are not anticipated to be an issue.
4.5.2 Need and Opportunity
In order to support the transit and active modal share targets outlined in Table 9, cycling and transit modes will need
to be supported. This includes the provision of bicycle parking as well as ensuring convenient pedestrian connections
are provided to sidewalk facilities leading to bus stop locations. These aforementioned facilities have been included on
the site plan to support active modes.
4.5.3 TDM Program
The City of Ottawa TDM Checklists were used to determine what TDM measures could be implemented based on the
available information.
The TDM checklists are contained in Appendix D.

800 Palladium Drive Transportation Impact Assessment Strategy
May 14, 2019
ol w:\active\163601264\planning\report\4. tia submission\rpt.800.palladium.final.tia.20190507.docx 33
4.6 NEIGHBOURHOOD TRAFFIC MANAGEMENT
Not applicable; exempted during screening and scoping.
4.7 TRANSIT
4.7.1 Route Capacity
An assumed transit modal share of 10% was adopted for all three land uses contained within the proposed
development. The forecasted transit trips for the proposed development is 27 and 31 total transit trips during the AM
and PM peak hours, respectively.
There are two OC Transpo transit routes within a 400m walking distance of the proposed site; routes 62 and 162. Route
162 operates during the afternoon and night between Stittsville and Terry Fox Station, and therefore will not likely be
the primary route for transit users destined to the proposed site. OC Transpo route 62 is a regular route that operates
at 30-minute headways during the weekday morning and afternoon peak periods and will likely be the primary route for
transit users destined to the proposed site.
Standard and articulated buses have seated capacities of 40 and 70 people; respectively. With the 30-minute headways
for route 62, the combined hourly transit capacity is estimated at 80 - 140 people per hour during the weekday AM and
PM peak periods. The proposed development is therefore anticipated to occupy between 20% and 40% of transit
capacity.
4.7.2 Transit Priority
The proposed development will utilize the existing transit stops abutting the subject site and is therefore not expected
to significantly impact the transit travel times of the existing routes or trigger the need for transit priority measures.
4.8 REVIEW OF NETWORK CONCEPT
Not applicable; exempted during screening and scoping.
4.9 INTERSECTION DESIGN
4.9.1 Intersection Control
The existing intersection control will be maintained as the default control for all three existing study area intersections.
Any intersection improvements triggered through the intersection level of service analysis will be highlighted and
adopted accordingly. The signal timing plan for the Palladium Drive at Cyclone Taylor Boulevard was obtained from
the City of Ottawa. It was noted that the total splits included in the signal timing plan truncate the decimal places, and
therefore, in the Synchro analysis, the total splits were adjusted to equate to the minimum splits for the eastbound,
westbound, and northbound directions. This methodology was vetted by the City of Ottawa at the time that the analysis
was being undertaken (i.e. March 2019).

800 Palladium Drive Transportation Impact Assessment Strategy
May 14, 2019
ol w:\active\163601264\planning\report\4. tia submission\rpt.800.palladium.final.tia.20190507.docx 34
4.9.2 Intersection Design
An assessment of the study area intersections was undertaken to determine the operational characteristics of the study
area intersections under the horizons identified in the Screening and Scoping report. Intersection operational analysis
was facilitated by Synchro 10.0™ software package and the MMLOS analysis was completed for the signalized
intersection for all modes and compared against the City of Ottawa’s MMLOS targets.
4.9.2.1 2019 Existing Conditions
Figure 6 illustrates 2019 Existing AM and PM peak hour traffic volumes at the study area intersections.
Table 13 summarizes the results of the Synchro analysis under 2019 existing conditions. All study area intersections
currently operate acceptably and therefore no improvements are required to supplement existing conditions.
Appendix E contains detailed intersection performance worksheets.
Table 13 - 2019 Existing Intersection Operations
Intersection Intersection
Control Approach / Movement LOS V/C Delay (s)
Queue 95th (m)
Palladium Drive at Cyclone Taylor
Boulevard
Traffic Signals
EB
Left A (A) 0.03 (0.01) 2.1 (5.9) 2.3 (1.4)
Through A (A) 0.14 (0.23) 2.3 (7.0) 9.2 (23.7)
Right A (A) 0.00 (0.00) 0.0 (0.0) 0.0 (0.0)
WB
Left A (A) 0.00 (0.00) 0.0 (0.0) 0.0 (0.0)
Through A (A) 0.08 (0.35) 2.2 (7.8) 5.8 (35.9)
Right A (A) 0.03 (0.01) 2.1 (5.9) 0.0 (0.0)
NB Left A (A) 0.00 (0.00) 0.0 (0.0) 0.0 (0.0)
Through / Right A (A) 0.00 (0.00) 0.0 (28.9) 0.0 (0.0)
SB Left A (A) 0.13 (0.28) 26.7 (25.4) 3.3 (10.0)
Through / Right A (A) 0.00 (0.03) 26.2 (24.4) 0.0 (0.0)
Overall Intersection A (A) 0.16 (0.32) 3.3 (9.5) -
Cyclone Taylor Boulevard at Private
Shared Access Minor Stop
WB Left / Right A (A) 0.01 (0.12) 9.3 (9.9) 0.2 (2.9)
NB Through / Right A (A) 0.03 (0.00) 0.0 (0.0) 0.0 (0.0)
SB Left / Through A (A) 0.00 (0.00) 0.6 (0.0) 0.0 (0.0)
Overall Intersection A (A) - 0.6 (0.0) -
Palladium Drive at Private Shared Access
(right-in / right-out) Minor Stop
WB Through / Right A (A) 0.07 (0.22) 0.0 (0.0) 0.0 (0.0)
SB Right A (B) 0.00 (0.04) 9.2 (10.2) 0.1 (0.8)
Overall Intersection A (A) - 0.1 (0.3) - Notes:
1. Table format: AM (PM) 2. v/c – represents the anticipated volume divided by the predicted capacity

800 Palladium Drive Transportation Impact Assessment Strategy
May 14, 2019
ol w:\active\163601264\planning\report\4. tia submission\rpt.800.palladium.final.tia.20190507.docx 35
MMLOS – Palladium Drive at Cyclone Taylor Boulevard Intersection (2019 Existing):
Based on the Land-Use Designations for Palladium Drive and Cyclone Taylor Boulevard, the Pedestrian Level of
Service (PLOS) target for this intersection is C. The Ultimate Cycling Network from the City of Ottawa Transportation
Master Plan (2013) designates Palladium Drive as a future local cycling route, therefore the Bicycle Level of Service
(BLOS) target is B. Transit service travelling on Palladium Drive and Cyclone Taylor Boulevard currently operate within
mixed traffic, and as such, the Transit Level of Service (TLOS) target is D. Palladium Drive is designated as full truck
route and therefore has a Truck Level of Service (TkLOS) target of D. As Palladium Drive is an arterial road, it is subject
to a Vehicle Level of Service (VLOS) target of D.
Table 14 outlines the MMLOS conditions for the signalized intersection of Palladium Drive at Cyclone Taylor Boulevard
under 2019 existing conditions.
The Pedestrian Level of Service (PLOS) at the intersection of Palladium Drive at Cyclone Taylor Boulevard is currently
operating with a PLOS of F, which is below the desired target of C. Based on the MMLOS guidelines, intersection PLOS
is largely influenced by the number of lanes pedestrians cross. Due to the nature of arterial roads, reducing the number
of lanes along Palladium Drive is not a feasible option. Incorporating pedestrian refuge areas by means of wide medians
(i.e. > 2.4m) is also not a feasible option due to spatial constraints.
The Bicycle Level of Service (BLOS) at the intersection is currently operating with a BLOS of F, which is below the
desired target of B. Based on the MMLOS guidelines, intersection BLOS is influenced by the availability of dedicated
cycling amenities, number of lanes cyclists must cross to negotiate a turn at intersections, and roadway operating
speeds. Due to the nature of arterial roadways, the number of vehicle travel lanes is often more than one in each
direction which increases the number of lanes cyclists must cross to navigate turning movements at the intersection.
In addition, the posted speed limit is typically 60 km/h or greater along arterial roadways. These two factors limit the
potential improvements to BLOS at signalized arterial intersections. The combination of dedicated bicycle lanes along
with the reduction in speed limit to 40 km/hr would allow the BLOS target of B to be met. Another possibility would be
to implement a separated bicycle facility along Palladium Drive, which would also allow the BLOS target to be met.
The transit level of service at the intersection is currently operating with a TLOS of E, which does not meet the targeted
value of D. Based on the MMLOS guidelines, intersection TLOS is governed by the delay at the intersection. The signal
timing plan that was obtained from the City of Ottawa indicates that this intersection operates with a split phase, with
the northbound and southbound vehicles operating on separate phases. It also indicates that there is only one signal
timing plan, which means that this intersection is always operating with a split phase. It is assumed that during major
events at the adjacent Canadian Tire Centre, the intersection of Palladium Drive at Cyclone Taylor Boulevard needs to
operate as a split phase to allow traffic to exit the parking lot on the south leg of this intersection. Removing the split
phase, at least during the AM and PM peak, would reduce the amount of delay experienced at the intersection, thus
allowing the TLOS to meet the target of D.
The Truck Level of Service (TkLOS) at the intersection is currently operating with a TkLOS of B, which meets the target
of D.
The Vehicular Level of Service (VLOS) at this intersection is currently operating with a VLOS of C, which meets the
target of D.

800 Palladium Drive Transportation Impact Assessment Strategy
May 14, 2019
ol w:\active\163601264\planning\report\4. tia submission\rpt.800.palladium.final.tia.20190507.docx 36
Table 14 - 2019 Existing Intersection MMLOS (Palladium / Cyclone Taylor)
Segment 2019 Existing
Target East Leg West Leg North Leg South Leg
PLO
S
Lanes crossed 6 6 5 4
C
Median >=2.4m (yes/no) No No No No
Island refuge (yes/no) No No No No
Left turn phasing Permissive Permissive Protected Protected
Right turn conflict Protected / Permissive
Protected / Permissive
Protected / Permissive
Protected / Permissive
RTOR (yes/no) Yes Yes Yes Yes
Leading ped interval (yes/no) No No No No
Right turn corner radius (m) > 10m to 15m > 10m to 15m > 10m to 15m > 10m to 15m
Crosswalk treatment Standard Standard Standard Standard
Cycle length (s) 90 90 90 90
Effective walk time (s) 7 7 7 7
PETSI Points 20 20 37 53
PETSI Points LOS F F E D
Average Pedestrian Delay (s) 38.3 38.2 38.2 38.2
Ped Delay LOS D D D D
Level of Service F F E D
Level of Service F
BLO
S
Type of bike lane Mixed Traffic Mixed Traffic Mixed Traffic Mixed Traffic
B
Left-turn - lanes crossed 1 1 1 0
Left-turn - vehicle operating speed (km/hr)
> 60 > 60 50 < 50
Right-turn - number of turn lanes 1 1 1 0
Right-turn - turn lane length (m) > 50 25 – 50 > 50 N/A
Right-turn - turning speed (km/hr) > 25 > 25 > 25 > 25
Right-turn - location of bike lane N/A N/A N/A N/A
Level of Service F F F B
Level of Service F
TLO
S
Intersection Average Delay (s) ≤ 40 D
Level of Service E
TkLO
S
Effective corner radius (m) 10 to 15 10 to 15 10 to 15 10 to 15
D Number of receiving lanes 2 2 2 2
Level of Service B B B B
Level of Service B
VLO
S Maximum Volume-to-capacity (v/c) 0.78 0.61 0.18 0.00
D Level of Service C B A A
Level of Service C

800 Palladium Drive Transportation Impact Assessment Strategy
May 14, 2019
ol w:\active\163601264\planning\report\4. tia submission\rpt.800.palladium.final.tia.20190507.docx 37
4.9.2.2 2019 Total Future Conditions
Figure 14 illustrates 2019 Total Future AM and PM peak hour traffic volumes at the study area intersections.
Table 15 summarizes the results of the Synchro analysis for the 2019 total future horizon. All study area intersections
are anticipated to operate satisfactorily under 2019 total future conditions.
Appendix E contains detailed intersection performance worksheets.
Table 15 - 2019 Total Future Intersection Operations
Intersection Intersection
Control Approach / Movement LOS V/C Delay (s)
Queue 95th (m)
Palladium Drive at Cyclone Taylor
Boulevard
Traffic Signals
EB
Left A (A) 0.07 (0.07) 2.8 (7.8) 4.4 (5.2)
Through A (A) 0.15 (0.25) 2.9 (8.5) 9.4 (25.1)
Right A (A) 0.00 (0.00) 0.0 (0.0) 0.0 (0.0)
WB
Left A (A) 0.00 (0.00) 0.0 (0.0) 0.0 (0.0)
Through A (A) 0.09 (0.40) 2.8 (9.6) 6.2 (40.4)
Right A (A) 0.02 (0.01) 2.6 (7.2) 0.0 (0.0)
NB Left A (A) 0.00 (0.00) 0.0 (0.0) 0.0 (0.0)
Through / Right A (A) 0.00 (0.00) 0.0 (28.4) 0.0 (0.0)
SB Left A (A) 0.20 (0.40) 24.9 (23.3) 5.3 (17.9)
Through / Right A (A) 0.01 (0.04) 24.2 (21.5) 0.0 (0.0)
Overall Intersection A (A) 0.18 (0.38) 4.7 (11.7) -
Cyclone Taylor Boulevard at Private
Shared Access Minor Stop
WB Left / Right A (B) 0.05 (0.26) 9.6 (10.8) 1.1 (7.2)
NB Through / Right A (A) 0.05 (0.02) 0.0 (0.0) 0.0 (0.0)
SB Left / Through A (A) 0.00 (0.00) 1.4 (0.1) 0.1 (0.0)
Overall Intersection A (A) - 2.1 (7.0) -
Palladium Drive at Private Shared Access
(right-in / right-out) Minor Stop
WB Through / Right A (A) 0.18 (0.21) 0.0 (0.0) 0.0 (0.0)
SB Right A (B) 0.02 (0.08) 9.6 (10.6) 0.3 (1.8)
Overall Intersection A (A) - 0.1 (0.5) - Notes:
1. Table format: AM (PM)
2. v/c – represents the anticipated volume divided by the predicted capacity
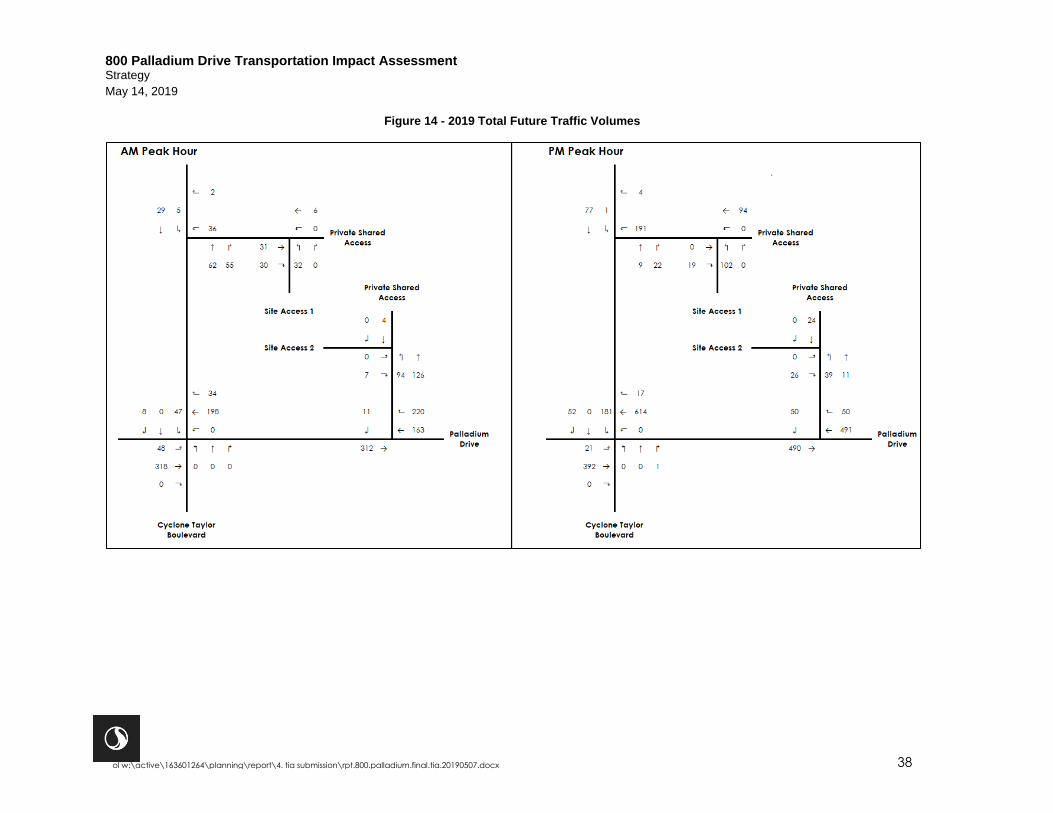
800 Palladium Drive Transportation Impact Assessment Strategy
May 14, 2019
ol w:\active\163601264\planning\report\4. tia submission\rpt.800.palladium.final.tia.20190507.docx 38
Figure 14 - 2019 Total Future Traffic Volumes

800 Palladium Drive Transportation Impact Assessment Strategy
May 14, 2019
ol w:\active\163601264\planning\report\4. tia submission\rpt.800.palladium.final.tia.20190507.docx 39
MMLOS – Palladium Drive at Cyclone Taylor Boulevard Intersection (2019 Total Future):
Table 16 outlines the MMLOS conditions for the signalized intersection of Palladium Drive at Cyclone Taylor Boulevard
under 2019 total future conditions.
The Pedestrian Level of Service (PLOS) at the intersection of Palladium Drive at Cyclone Taylor Boulevard is projected
to continue to operate with a PLOS of F, which is below the desired target of C. Based on the MMLOS guidelines,
intersection PLOS is largely influenced by the number of lanes pedestrians cross. Due to the nature of arterial roads,
reducing the number of lanes along Palladium Drive is not a feasible option. Incorporating pedestrian refuge areas by
means of wide medians is also not a feasible option due to spatial constraints.
The Bicycle Level of Service (BLOS) at the intersection is projected to continue to operate with a BLOS of F, which is
below the desired target of B. Based on the MMLOS guidelines, intersection BLOS is influenced by the availability of
dedicated cycling amenities, number of lanes cyclists must cross to negotiate a turn at intersections, and roadway
operating speeds. Due to the nature of arterial roadways, the number of vehicle travel lanes is often more than one
which increases the number of lanes cyclists must cross to navigate turning movements at the intersection. In addition,
the posted speed limit is typically 60 km/h or greater along arterial roadways. These two factors limit the potential BLOS
at signalized arterial intersections. The combination of dedicated bicycle lanes along with the reduction in speed limit
to 40 km/hr would allow the BLOS target of B to be met. Another possibility would be to implement a separated bicycle
facility along Palladium Drive, which would also allow the BLOS target to be met.
The transit level of service at the intersection is projected to continue to operate with a TLOS of E, which does not meet
the targeted value of D. Based on the MMLOS guidelines, intersection TLOS is governed by the delay at the
intersection. The signal timing plan that was obtained from the City of Ottawa indicates that this intersection operates
with a split phase, with the northbound and southbound vehicles operating on separate phases. It also indicates that
there is only one signal timing plan, which means that this intersection is always operating with a split phase. It is
assumed that during major events at the adjacent Canadian Tire Centre, the intersection of Palladium Drive at Cyclone
Taylor Boulevard needs to operate as a split phase to allow traffic to exit the parking lot on the south leg of this
intersection. Removing the split phase, at least during the AM and PM peak, would reduce the amount of delay
experienced at the intersection, thus allowing the TLOS to meet the target of D.
The Truck Level of Service (TkLOS) at the intersection is projected to continue to operate with a TkLOS of B, which
meets the target of D.
The Vehicular Level of Service (VLOS) at this intersection is projected to continue to operate with a VLOS of C, which
meets the target of D.
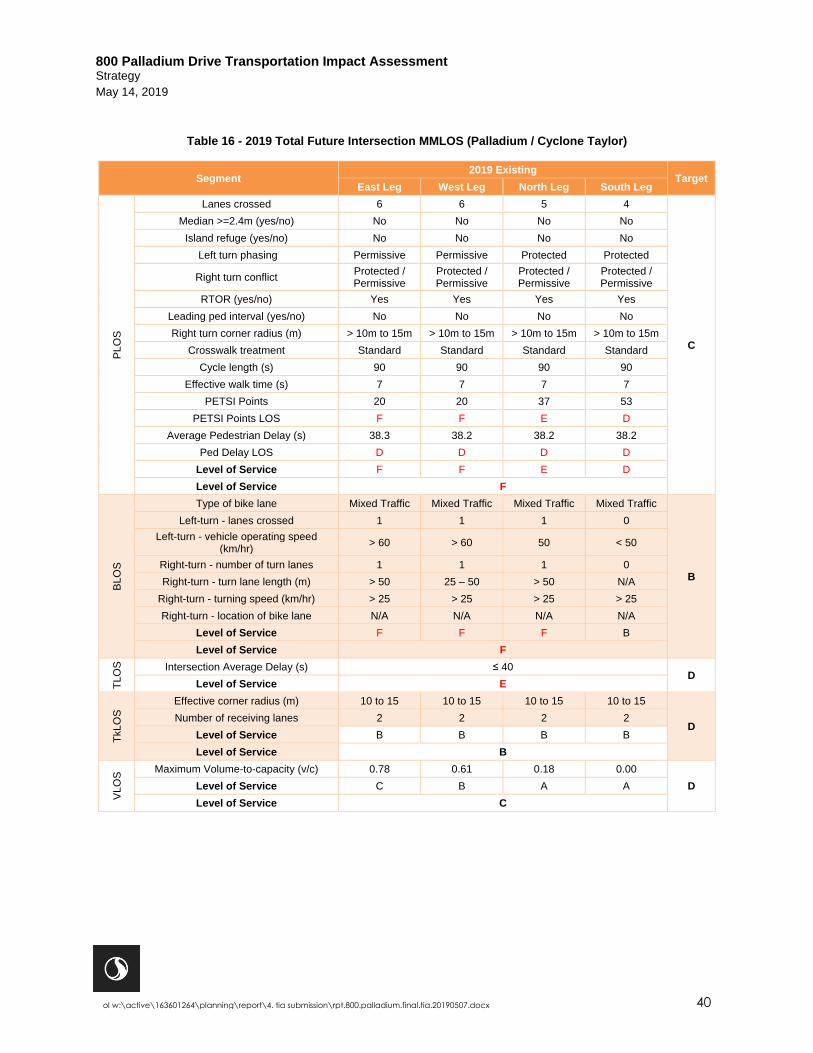
800 Palladium Drive Transportation Impact Assessment Strategy
May 14, 2019
ol w:\active\163601264\planning\report\4. tia submission\rpt.800.palladium.final.tia.20190507.docx 40
Table 16 - 2019 Total Future Intersection MMLOS (Palladium / Cyclone Taylor)
Segment 2019 Existing
Target East Leg West Leg North Leg South Leg
PLO
S
Lanes crossed 6 6 5 4
C
Median >=2.4m (yes/no) No No No No
Island refuge (yes/no) No No No No
Left turn phasing Permissive Permissive Protected Protected
Right turn conflict Protected / Permissive
Protected / Permissive
Protected / Permissive
Protected / Permissive
RTOR (yes/no) Yes Yes Yes Yes
Leading ped interval (yes/no) No No No No
Right turn corner radius (m) > 10m to 15m > 10m to 15m > 10m to 15m > 10m to 15m
Crosswalk treatment Standard Standard Standard Standard
Cycle length (s) 90 90 90 90
Effective walk time (s) 7 7 7 7
PETSI Points 20 20 37 53
PETSI Points LOS F F E D
Average Pedestrian Delay (s) 38.3 38.2 38.2 38.2
Ped Delay LOS D D D D
Level of Service F F E D
Level of Service F
BLO
S
Type of bike lane Mixed Traffic Mixed Traffic Mixed Traffic Mixed Traffic
B
Left-turn - lanes crossed 1 1 1 0
Left-turn - vehicle operating speed (km/hr)
> 60 > 60 50 < 50
Right-turn - number of turn lanes 1 1 1 0
Right-turn - turn lane length (m) > 50 25 – 50 > 50 N/A
Right-turn - turning speed (km/hr) > 25 > 25 > 25 > 25
Right-turn - location of bike lane N/A N/A N/A N/A
Level of Service F F F B
Level of Service F
TLO
S
Intersection Average Delay (s) ≤ 40 D
Level of Service E
TkLO
S
Effective corner radius (m) 10 to 15 10 to 15 10 to 15 10 to 15
D Number of receiving lanes 2 2 2 2
Level of Service B B B B
Level of Service B
VLO
S Maximum Volume-to-capacity (v/c) 0.78 0.61 0.18 0.00
D Level of Service C B A A
Level of Service C

800 Palladium Drive Transportation Impact Assessment Strategy
May 14, 2019
ol w:\active\163601264\planning\report\4. tia submission\rpt.800.palladium.final.tia.20190507.docx 41
4.9.2.3 2024 Ultimate Conditions
Figure 15 illustrates 2024 Ultimate AM and PM peak hour traffic volumes at the study area intersections.
Table 17 summarizes the results of the Synchro analysis for the 2024 ultimate horizon. All study area intersections are
anticipated to operate satisfactorily under 2024 ultimate conditions.
Appendix E contains detailed intersection performance worksheets.
Table 17 – 2024 Ultimate Intersection Operations
Intersection Intersection
Control Approach / Movement LOS V/C Delay (s)
Queue 95th (m)
Palladium Drive at Cyclone Taylor
Boulevard
Traffic Signals
EB
Left A (A) 0.07 (0.07) 2.8 (7.9) 4.9 (5.6)
Through A (A) 0.19 (0.32) 3.1 (9.0) 14.0 (36.3)
Right A (A) 0.00 (0.00) 0.0 (0.0) 0.0 (0.0)
WB
Left A (A) 0.00 (0.00) 0.0 (0.0) 0.0 (0.0)
Through A (A) 0.12 (0.46) 2.8 (10.2) 9.2 (57.1)
Right A (A) 0.03 (0.01) 2.6 (7.2) 0.3 (0.0)
NB Left A (A) 0.00 (0.00) 0.0 (0.0) 0.0 (0.0)
Through / Right A (A) 0.00 (0.00) 0.0 (28.3) 0.0 (0.0)
SB Left A (A) 0.19 (0.39) 25.0 (23.2) 5.8 (19.7)
Through / Right A (A) 0.01 (0.04) 24.3 (21.6) 0.0 (0.0)
Overall Intersection A (A) 0.22 (0.43) 4.4 (11.7) -
Cyclone Taylor Boulevard at Private
Shared Access Minor Stop
WB Left / Right A (B) 0.05 (0.25) 9.7 (10.8) 1.1 (7.1)
NB Through / Right A (A) 0.05 (0.02) 0.0 (0.0) 0.0 (0.0)
SB Left / Through A (A) 0.00 (0.00) 1.0 (0.1) 0.1 (0.0)
Overall Intersection A (A) - 2.0 (6.8) -
Palladium Drive at Private Shared Access
(right-in / right-out) Minor Stop
WB Through / Right A (A) 0.19 (0.26) 0.0 (0.0) 0.0 (0.0)
SB Right B (B) 0.02 (0.08) 9.9 (11.2) 0.3 (1.9)
Overall Intersection A (A) - 0.1 (0.4) - Notes:
1. Table format: AM (PM) 2. v/c – represents the anticipated volume divided by the predicted capacity
3. # - 95th percentile volume exceeds capacity, queue may be longer
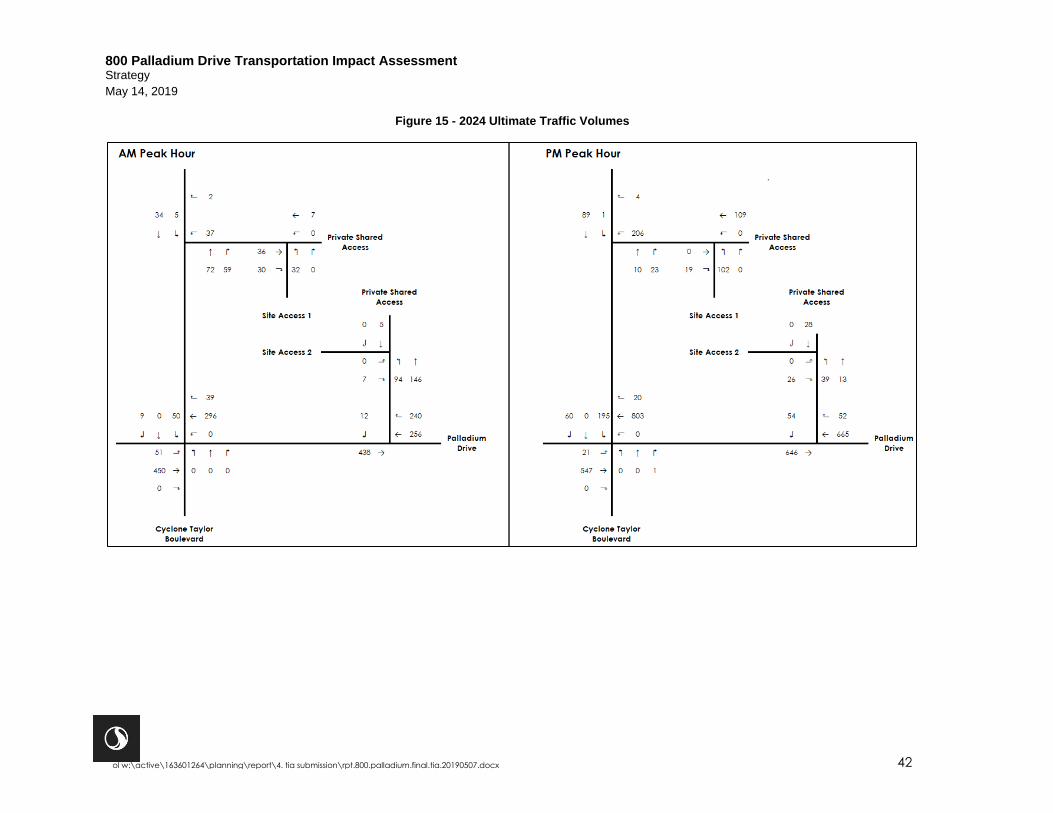
800 Palladium Drive Transportation Impact Assessment Strategy
May 14, 2019
ol w:\active\163601264\planning\report\4. tia submission\rpt.800.palladium.final.tia.20190507.docx 42
Figure 15 - 2024 Ultimate Traffic Volumes
800 Palladium Drive Transportation Impact Assessment Strategy
May 14, 2019
ol w:\active\163601264\planning\report\4. tia submission\rpt.800.palladium.final.tia.20190507.docx 43
MMLOS – Palladium Drive at Cyclone Taylor Boulevard Intersection (2024 Ultimate):
Table 18 outlines the MMLOS conditions for the signalized intersection of Palladium Drive at Cyclone Taylor Boulevard
under 2019 total future conditions.
The Pedestrian Level of Service (PLOS) at the intersection of Palladium Drive at Cyclone Taylor Boulevard is projected
to continue to operate with a PLOS of F, which is below the desired target of C. Based on the MMLOS guidelines,
intersection PLOS is largely influenced by the number of lanes pedestrians cross. Due to the nature of arterial roads,
reducing the number of lanes along Palladium Drive is not a feasible option. Incorporating pedestrian refuge areas by
means of wide medians is also not a feasible option due to spatial constraints.
The Bicycle Level of Service (BLOS) at the intersection is projected to continue to operate with a BLOS of F, which is
below the desired target of B. Based on the MMLOS guidelines, intersection BLOS is influenced by the availability of
dedicated cycling amenities, number of lanes cyclists must cross to negotiate a turn at intersections, and roadway
operating speeds. Due to the nature of arterial roadways, the number of vehicle travel lanes is often more than one
which increases the number of lanes cyclists must cross to navigate turning movements at the intersection. In addition,
the posted speed limit is typically 60 km/h or greater along arterial roadways. These two factors limit the potential BLOS
at signalized arterial intersections. The combination of dedicated bicycle lanes along with the reduction in speed limit
to 40 km/hr would allow the BLOS target of B to be met. Another possibility would be to implement a separated bicycle
facility along Palladium Drive, which would also allow the BLOS target to be met.
The transit level of service at the intersection is projected to continue to operate with a TLOS of E, which does not meet
the targeted value of D. Based on the MMLOS guidelines, intersection TLOS is governed by the delay at the
intersection. The signal timing plan that was obtained from the City of Ottawa indicates that this intersection operates
with a split phase, with the northbound and southbound vehicles operating on separate phases. It also indicates that
there is only one signal timing plan, which means that this intersection is always operating with a split phase. It is
assumed that during major events at the adjacent Canadian Tire Centre, the intersection of Palladium Drive at Cyclone
Taylor Boulevard needs to operate as a split phase to allow traffic to exit the parking lot on the south leg of this
intersection. Removing the split phase, at least during the AM and PM peak, would reduce the amount of delay
experienced at the intersection, thus allowing the TLOS to meet the target of D.
The Truck Level of Service (TkLOS) at the intersection is projected to continue to operate with a TkLOS of B, which
meets the target of D.
The Vehicular Level of Service (VLOS) at this intersection is projected to continue to operate with a VLOS of C, which
meets the target of D.

800 Palladium Drive Transportation Impact Assessment Strategy
May 14, 2019
ol w:\active\163601264\planning\report\4. tia submission\rpt.800.palladium.final.tia.20190507.docx 44
Table 18 – 2024 Ultimate Intersection MMLOS (Palladium / Cyclone Taylor)
Segment 2019 Existing
Target East Leg West Leg North Leg South Leg
PLO
S
Lanes crossed 6 6 5 4
C
Median >=2.4m (yes/no) No No No No
Island refuge (yes/no) No No No No
Left turn phasing Permissive Permissive Protected Protected
Right turn conflict Protected / Permissive
Protected / Permissive
Protected / Permissive
Protected / Permissive
RTOR (yes/no) Yes Yes Yes Yes
Leading ped interval (yes/no) No No No No
Right turn corner radius (m) > 10m to 15m > 10m to 15m > 10m to 15m > 10m to 15m
Crosswalk treatment Standard Standard Standard Standard
Cycle length (s) 90 90 90 90
Effective walk time (s) 7 7 7 7
PETSI Points 20 20 37 53
PETSI Points LOS F F E D
Average Pedestrian Delay (s) 38.3 38.2 38.2 38.2
Ped Delay LOS D D D D
Level of Service F F E D
Level of Service F
BLO
S
Type of bike lane Mixed Traffic Mixed Traffic Mixed Traffic Mixed Traffic
B
Left-turn - lanes crossed 1 1 1 0
Left-turn - vehicle operating speed (km/hr)
> 60 > 60 50 < 50
Right-turn - number of turn lanes 1 1 1 0
Right-turn - turn lane length (m) > 50 25 – 50 > 50 N/A
Right-turn - turning speed (km/hr) > 25 > 25 > 25 > 25
Right-turn - location of bike lane N/A N/A N/A N/A
Level of Service F F F B
Level of Service F
TLO
S
Intersection Average Delay (s) ≤ 40 D
Level of Service E
TkLO
S
Effective corner radius (m) 10 to 15 10 to 15 10 to 15 10 to 15
D Number of receiving lanes 2 2 2 2
Level of Service B B B B
Level of Service B
VLO
S Maximum Volume-to-capacity (v/c) 0.78 0.61 0.18 0.00
D Level of Service C B A A
Level of Service C
800 Palladium Drive Transportation Impact Assessment Conclusion
May 14, 2019
ol w:\active\163601264\planning\report\4. tia submission\rpt.800.palladium.final.tia.20190507.docx 45
5.0 CONCLUSION
This Transportation Impact Assessment (TIA) was prepared in support of a Site Plan application for a proposed
development located at 800 Palladium Drive. The proposed site is located at the northeast corner of the Palladium
Drive at Cyclone Taylor Boulevard intersection in the Kanata community of Ottawa, Ontario. The site features two full
movement site accesses, both along a Private Shared Access road.
Development generated site trips are not anticipated to adversely impact traffic operations at all three study area
intersections. All study area intersections are projected to operate acceptably under all horizons.
The Multi-Modal Level of Service (MMLOS) assessment for roadway segments found that the following improvements
would allow the MMLOS targets to be met along Palladium Drive:
• Reducing the speed limit of Palladium Drive to 60 km/hr would allow the PLOS target to be met;
• Implementing a 0.5 – 2.0m boulevard along Palladium Drive across the frontage of the subject site would also
allow the PLOS target to be met;
• Implementing a physically separated bicycle facility along Palladium Drive would allow the BLOS target to be
met, however, this would have significant financial and spatial constraints;
• Implementing dedicated on-street bicycle lanes along Palladium Drive and reducing the speed limit to 60 km/hr
would allow the BLOS target to be met, however, this would have spatial constraints; and
• Reducing the speed limit along Palladium Drive to 40 km/hr while maintaining the existing mixed-use bicycle
lanes would allow the BLOS target to be met, however, this reduction in speed limit is not feasible as it is an
arterial roadway.
The MMLOS assessment for the signalized intersection of Palladium Drive at Cyclone Taylor found that the following
improvements would allow the MMLOS targets to be met:
• Reducing the number of lanes along Palladium Drive would improve both the PLOS and BLOS, however, this
is not a feasible solution as it would adversely affect the operations of motor vehicles as well as transit
operations;
• Incorporating pedestrian refuge areas by means of wide medians (i.e. > 2.4m) would improve the PLOS,
however, due to spatial constraints, this is not a feasible solution;
• Reducing the speed along Palladium Drive to 40 km/hr along with the implementation of dedicated bicycle
lanes would allow the BLOS target to be met, however, this reduction in speed limit is not a feasible option as
it is an arterial roadway;
• Implementing a physically separated bicycle facility along Palladium Drive would allow the BLOS target to be
met at the intersection; and
800 Palladium Drive Transportation Impact Assessment Conclusion
May 14, 2019
ol w:\active\163601264\planning\report\4. tia submission\rpt.800.palladium.final.tia.20190507.docx 46
• Removing the split phase from the signal timing plan, at least during the morning and afternoon peaks, would
improve the transit level of service as it would decrease the overall delay experienced at the intersection.
Based on the transportation evaluation presented in this study, the proposed development located at 800 Palladium
Drive can be supported and should be permitted to proceed from a transportation perspective.

APPENDICES
800 PALLADIUM DRIVE TRANSPORTATION IMPACT ASSESSMENT
Appendix A Comment Response Memo
May 14, 2019
A.1
COMMENT RESPONSE MEMO
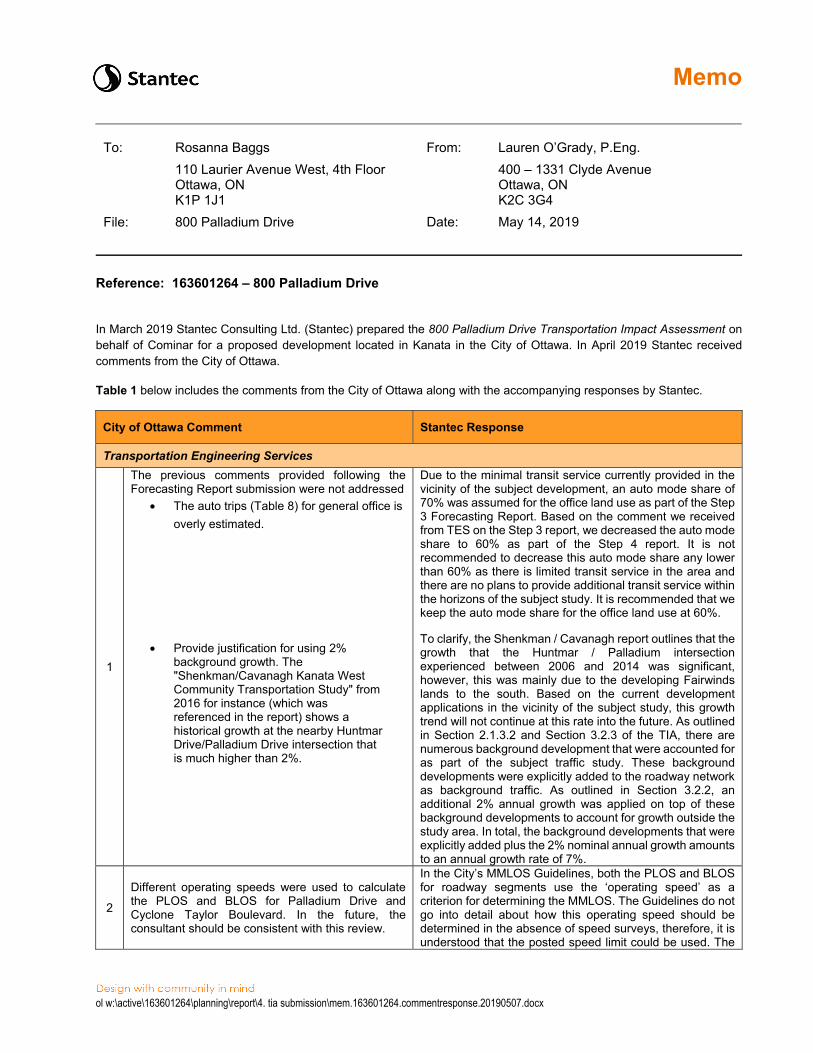
Memo
ol w:\active\163601264\planning\report\4. tia submission\mem.163601264.commentresponse.20190507.docx
To: Rosanna Baggs From: Lauren O’Grady, P.Eng. 110 Laurier Avenue West, 4th Floor
Ottawa, ON K1P 1J1
400 – 1331 Clyde Avenue Ottawa, ON K2C 3G4
File: 800 Palladium Drive Date: May 14, 2019
Reference: 163601264 – 800 Palladium Drive
In March 2019 Stantec Consulting Ltd. (Stantec) prepared the 800 Palladium Drive Transportation Impact Assessment on behalf of Cominar for a proposed development located in Kanata in the City of Ottawa. In April 2019 Stantec received comments from the City of Ottawa.
Table 1 below includes the comments from the City of Ottawa along with the accompanying responses by Stantec.
City of Ottawa Comment Stantec Response
Transportation Engineering Services
1
The previous comments provided following the Forecasting Report submission were not addressed
• The auto trips (Table 8) for general office is overly estimated.
• Provide justification for using 2% background growth. The "Shenkman/Cavanagh Kanata West Community Transportation Study" from 2016 for instance (which was referenced in the report) shows a historical growth at the nearby Huntmar Drive/Palladium Drive intersection that is much higher than 2%.
Due to the minimal transit service currently provided in the vicinity of the subject development, an auto mode share of 70% was assumed for the office land use as part of the Step 3 Forecasting Report. Based on the comment we received from TES on the Step 3 report, we decreased the auto mode share to 60% as part of the Step 4 report. It is not recommended to decrease this auto mode share any lower than 60% as there is limited transit service in the area and there are no plans to provide additional transit service within the horizons of the subject study. It is recommended that we keep the auto mode share for the office land use at 60%. To clarify, the Shenkman / Cavanagh report outlines that the growth that the Huntmar / Palladium intersection experienced between 2006 and 2014 was significant, however, this was mainly due to the developing Fairwinds lands to the south. Based on the current development applications in the vicinity of the subject study, this growth trend will not continue at this rate into the future. As outlined in Section 2.1.3.2 and Section 3.2.3 of the TIA, there are numerous background development that were accounted for as part of the subject traffic study. These background developments were explicitly added to the roadway network as background traffic. As outlined in Section 3.2.2, an additional 2% annual growth was applied on top of these background developments to account for growth outside the study area. In total, the background developments that were explicitly added plus the 2% nominal annual growth amounts to an annual growth rate of 7%.
2
Different operating speeds were used to calculate the PLOS and BLOS for Palladium Drive and Cyclone Taylor Boulevard. In the future, the consultant should be consistent with this review.
In the City’s MMLOS Guidelines, both the PLOS and BLOS for roadway segments use the ‘operating speed’ as a criterion for determining the MMLOS. The Guidelines do not go into detail about how this operating speed should be determined in the absence of speed surveys, therefore, it is understood that the posted speed limit could be used. The
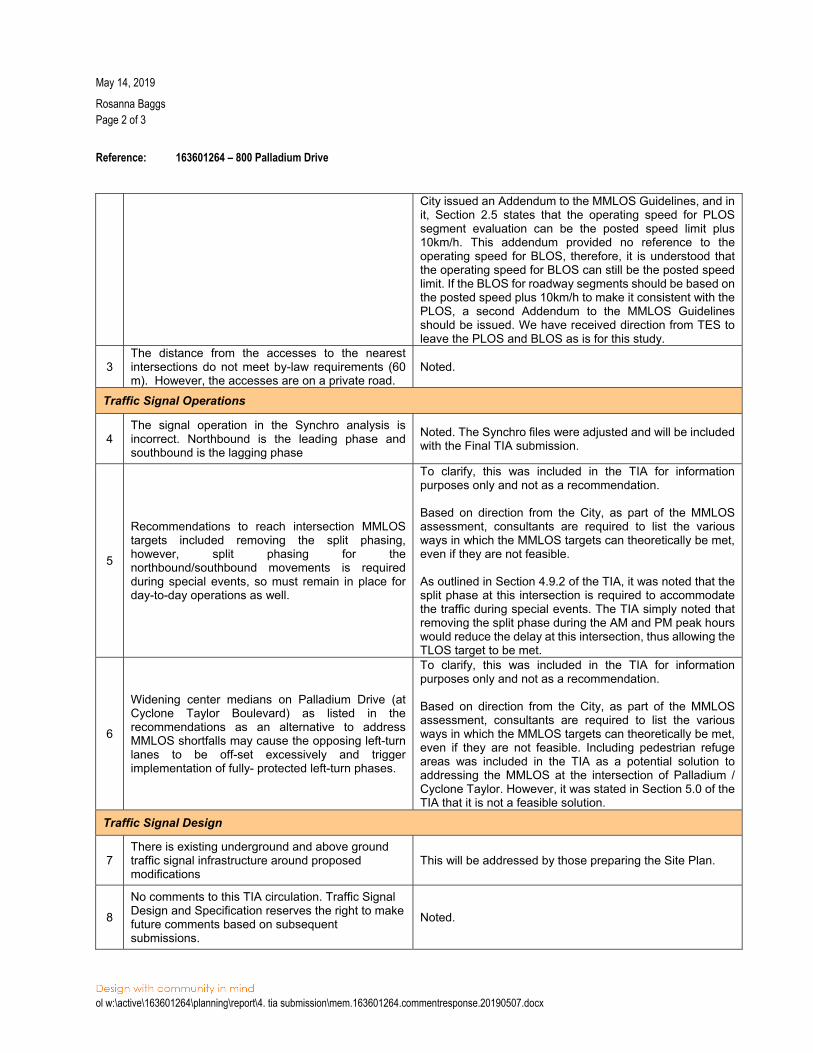
May 14, 2019
Rosanna Baggs Page 2 of 3
Reference: 163601264 – 800 Palladium Drive
ol w:\active\163601264\planning\report\4. tia submission\mem.163601264.commentresponse.20190507.docx
City issued an Addendum to the MMLOS Guidelines, and in it, Section 2.5 states that the operating speed for PLOS segment evaluation can be the posted speed limit plus 10km/h. This addendum provided no reference to the operating speed for BLOS, therefore, it is understood that the operating speed for BLOS can still be the posted speed limit. If the BLOS for roadway segments should be based on the posted speed plus 10km/h to make it consistent with the PLOS, a second Addendum to the MMLOS Guidelines should be issued. We have received direction from TES to leave the PLOS and BLOS as is for this study.
3 The distance from the accesses to the nearest intersections do not meet by-law requirements (60 m). However, the accesses are on a private road.
Noted.
Traffic Signal Operations
4 The signal operation in the Synchro analysis is incorrect. Northbound is the leading phase and southbound is the lagging phase
Noted. The Synchro files were adjusted and will be included with the Final TIA submission.
5
Recommendations to reach intersection MMLOS targets included removing the split phasing, however, split phasing for the northbound/southbound movements is required during special events, so must remain in place for day-to-day operations as well.
To clarify, this was included in the TIA for information purposes only and not as a recommendation. Based on direction from the City, as part of the MMLOS assessment, consultants are required to list the various ways in which the MMLOS targets can theoretically be met, even if they are not feasible. As outlined in Section 4.9.2 of the TIA, it was noted that the split phase at this intersection is required to accommodate the traffic during special events. The TIA simply noted that removing the split phase during the AM and PM peak hours would reduce the delay at this intersection, thus allowing the TLOS target to be met.
6
Widening center medians on Palladium Drive (at Cyclone Taylor Boulevard) as listed in the recommendations as an alternative to address MMLOS shortfalls may cause the opposing left-turn lanes to be off-set excessively and trigger implementation of fully- protected left-turn phases.
To clarify, this was included in the TIA for information purposes only and not as a recommendation. Based on direction from the City, as part of the MMLOS assessment, consultants are required to list the various ways in which the MMLOS targets can theoretically be met, even if they are not feasible. Including pedestrian refuge areas was included in the TIA as a potential solution to addressing the MMLOS at the intersection of Palladium / Cyclone Taylor. However, it was stated in Section 5.0 of the TIA that it is not a feasible solution.
Traffic Signal Design
7 There is existing underground and above ground traffic signal infrastructure around proposed modifications
This will be addressed by those preparing the Site Plan.
8
No comments to this TIA circulation. Traffic Signal Design and Specification reserves the right to make future comments based on subsequent submissions.
Noted.
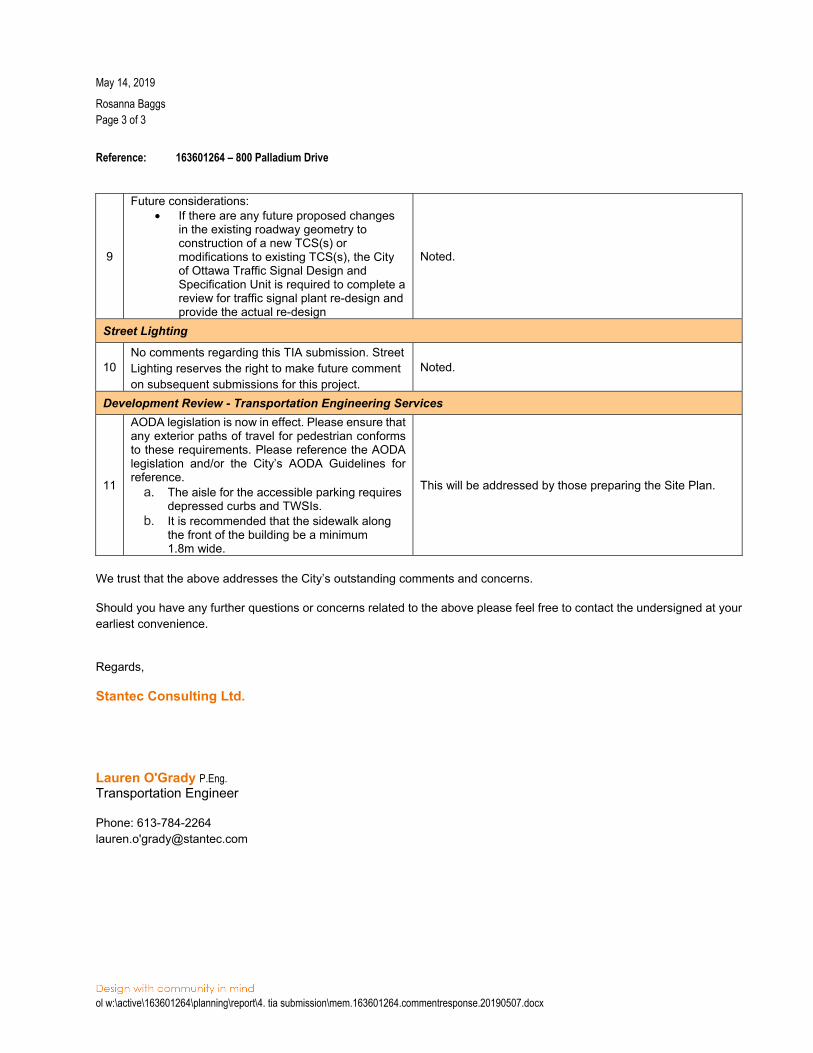
May 14, 2019
Rosanna Baggs Page 3 of 3
Reference: 163601264 – 800 Palladium Drive
ol w:\active\163601264\planning\report\4. tia submission\mem.163601264.commentresponse.20190507.docx
9
Future considerations: • If there are any future proposed changes
in the existing roadway geometry to construction of a new TCS(s) or modifications to existing TCS(s), the City of Ottawa Traffic Signal Design and Specification Unit is required to complete a review for traffic signal plant re-design and provide the actual re-design
Noted.
Street Lighting
10 No comments regarding this TIA submission. Street Lighting reserves the right to make future comment on subsequent submissions for this project.
Noted.
Development Review - Transportation Engineering Services
11
AODA legislation is now in effect. Please ensure that any exterior paths of travel for pedestrian conforms to these requirements. Please reference the AODA legislation and/or the City’s AODA Guidelines for reference.
a. The aisle for the accessible parking requires depressed curbs and TWSIs.
b. It is recommended that the sidewalk along the front of the building be a minimum 1.8m wide.
This will be addressed by those preparing the Site Plan.
We trust that the above addresses the City’s outstanding comments and concerns.
Should you have any further questions or concerns related to the above please feel free to contact the undersigned at your earliest convenience.
Regards,
Stantec Consulting Ltd.
Lauren O'Grady P.Eng. Transportation Engineer Phone: 613-784-2264 lauren.o'[email protected]

800 PALLADIUM DRIVE TRANSPORTATION IMPACT ASSESSMENT
Appendix B Traffic Data
May 14, 2019
B.1
TRAFFIC DATA

Turning Movement Count - Peak Hour Diagram
Transportation Services - Traffic Services
Start Time:
Survey Date:
CYCLONE TAYLOR BLVD @ PALLADIUM DR
07:00
Wednesday, August 17, 2016 WO No: 36188
Device: Miovision
169
186
17
0
0
Total
506
20
0
19 537
19
0
300
0
1
52
40
23
0
0
00
0
0
0
1
0
6
0
17
4
321
Cars
EW
S
N
Cars
0
180
329
298 23
32
216
0
75
Peak Hour
48
17
0
163
08:45
Comments
07:45
06
0 1
320
281
0
0
PALLADIUM DR
CYCLONE TAYLOR BLVD
0
06
0
13
0
0
0 0
0
0
0
0
0
AM Period
0
04
00
4
0
HeavyVehicles
HeavyVehicles
Page 1 of 42019-Feb-07

Turning Movement Count - Peak Hour Diagram
Transportation Services - Traffic Services
Start Time:
Survey Date:
CYCLONE TAYLOR BLVD @ PALLADIUM DR
07:00
Wednesday, August 17, 2016 WO No: 36188
Device: Miovision
594
604
10
0
1
Total
985
3
0
3 1050
5
0
378
0
0
19
20
125
0
0
10
0
0
0
2
0
44
0
81
2
467
Cars
EW
S
N
Cars
0
560
214
460 7
16
583
0
144
Peak Hour
17
10
0
550
17:30
Comments
16:30
01
0 3
381
373
0
0
PALLADIUM DR
CYCLONE TAYLOR BLVD
0
044
0
79
1
0
0 1
0
0
0
0
0
PM Period
0
07
00
7
0
HeavyVehicles
HeavyVehicles
Page 4 of 42019-Feb-07

Intersection Cyclone Taylor Blvd at Private Access RoadDate: 30-Jan-19
AM Counts NBT NBR SBT SBL WBL WBR Total7:30 - 7:45 13 3 3 0 0 1 207:45 - 8:00 17 4 6 2 1 1 318:00 - 8:15 16 10 6 1 2 0 358:15 - 8:30 12 5 7 0 1 0 258:30 - 8:45 17 9 10 0 1 0 37
PM Counts NBT NBR SBT SBL WBL WBR Total4:30 - 4:45 3 3 25 0 33 1 654:45 - 5:00 4 1 15 0 22 0 425:00 - 5:15 2 0 20 0 15 0 375:15 - 5:30 0 0 17 0 22 1 40
Intersection Palladium Drive and Private Access RoadDate: 31-Jan-19
AM Counts SBR EBT WBT WBR Total7:45 - 8:00 1 70 31 29 1318:00 - 8:15 1 77 44 24 1468:15 - 8:30 2 68 43 25 1388:30 - 8:45 0 68 45 48 161
Total 4 283 163 126 576
PM Peak Hour SBR EBT WBT WBR Total4:30 - 4:45 2 86 138 2 2284:45 - 5:00 3 83 105 5 1965:00 - 5:15 10 122 119 4 2555:15 - 5:30 9 113 135 0 257
Total 24 404 497 11 936

800 PALLADIUM DRIVE TRANSPORTATION IMPACT ASSESSMENT
Appendix C Background Traffic Volumes
May 14, 2019
C.1
BACKGROUND TRAFFIC VOLUMES

195 Huntmar Drive
Shenkman / Cavanagh Kanata West Transportation Study, Parsons July 2016

173 Huntmar Drive
173 Huntmar Drive Mixed-Use Development Community Transportation Study, Parsons June 2014

800 PALLADIUM DRIVE TRANSPORTATION IMPACT ASSESSMENT
Appendix D Transportation Demand Management Checklists
May 14, 2019
D.1
TRANSPORTATION DEMAND MANAGEMENT
CHECKLISTS
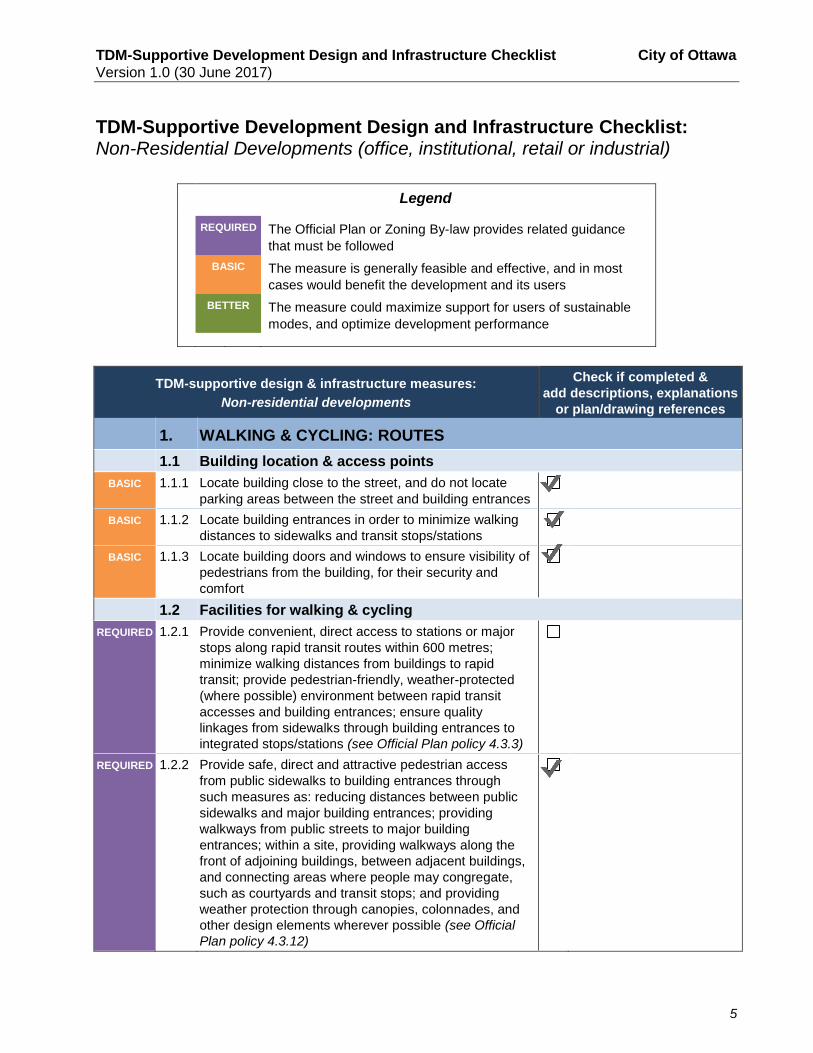
TDM-Supportive Development Design and Infrastructure Checklist City of Ottawa
Version 1.0 (30 June 2017)
5
TDM-Supportive Development Design and Infrastructure Checklist: Non-Residential Developments (office, institutional, retail or industrial)
Legend
REQUIRED The Official Plan or Zoning By-law provides related guidance
that must be followed
BASIC The measure is generally feasible and effective, and in most
cases would benefit the development and its users
BETTER The measure could maximize support for users of sustainable
modes, and optimize development performance
TDM-supportive design & infrastructure measures:
Non-residential developments
Check if completed &
add descriptions, explanations
or plan/drawing references
1. WALKING & CYCLING: ROUTES
1.1 Building location & access points
BASIC 1.1.1 Locate building close to the street, and do not locate
parking areas between the street and building entrances
BASIC 1.1.2 Locate building entrances in order to minimize walking
distances to sidewalks and transit stops/stations
BASIC 1.1.3 Locate building doors and windows to ensure visibility of
pedestrians from the building, for their security and
comfort
1.2 Facilities for walking & cycling
REQUIRED 1.2.1 Provide convenient, direct access to stations or major
stops along rapid transit routes within 600 metres;
minimize walking distances from buildings to rapid
transit; provide pedestrian-friendly, weather-protected
(where possible) environment between rapid transit
accesses and building entrances; ensure quality
linkages from sidewalks through building entrances to
integrated stops/stations (see Official Plan policy 4.3.3)
REQUIRED 1.2.2 Provide safe, direct and attractive pedestrian access
from public sidewalks to building entrances through
such measures as: reducing distances between public
sidewalks and major building entrances; providing
walkways from public streets to major building
entrances; within a site, providing walkways along the
front of adjoining buildings, between adjacent buildings,
and connecting areas where people may congregate,
such as courtyards and transit stops; and providing
weather protection through canopies, colonnades, and
other design elements wherever possible (see Official
Plan policy 4.3.12)

TDM-Supportive Development Design and Infrastructure Checklist City of Ottawa
Version 1.0 (30 June 2017)
6
TDM-supportive design & infrastructure measures:
Non-residential developments
Check if completed &
add descriptions, explanations
or plan/drawing references
REQUIRED 1.2.3 Provide sidewalks of smooth, well-drained walking
surfaces of contrasting materials or treatments to
differentiate pedestrian areas from vehicle areas, and
provide marked pedestrian crosswalks at intersection
sidewalks (see Official Plan policy 4.3.10)
REQUIRED 1.2.4 Make sidewalks and open space areas easily
accessible through features such as gradual grade
transition, depressed curbs at street corners and
convenient access to extra-wide parking spaces and
ramps (see Official Plan policy 4.3.10)
REQUIRED 1.2.5 Include adequately spaced inter-block/street cycling and
pedestrian connections to facilitate travel by active
transportation. Provide links to the existing or planned
network of public sidewalks, multi-use pathways and on-
road cycle routes. Where public sidewalks and multi-use
pathways intersect with roads, consider providing traffic
control devices to give priority to cyclists and
pedestrians (see Official Plan policy 4.3.11)
BASIC 1.2.6 Provide safe, direct and attractive walking routes from
building entrances to nearby transit stops
BASIC 1.2.7 Ensure that walking routes to transit stops are secure,
visible, lighted, shaded and wind-protected wherever
possible
BASIC 1.2.8 Design roads used for access or circulation by cyclists
using a target operating speed of no more than 30 km/h,
or provide a separated cycling facility
1.3 Amenities for walking & cycling
BASIC 1.3.1 Provide lighting, landscaping and benches along
walking and cycling routes between building entrances
and streets, sidewalks and trails
BASIC 1.3.2 Provide wayfinding signage for site access (where
required, e.g. when multiple buildings or entrances
exist) and egress (where warranted, such as when
directions to reach transit stops/stations, trails or other
common destinations are not obvious)

TDM-Supportive Development Design and Infrastructure Checklist City of Ottawa
Version 1.0 (30 June 2017)
7
TDM-supportive design & infrastructure measures:
Non-residential developments
Check if completed &
add descriptions, explanations
or plan/drawing references
2. WALKING & CYCLING: END-OF-TRIP FACILITIES
2.1 Bicycle parking
REQUIRED 2.1.1 Provide bicycle parking in highly visible and lighted
areas, sheltered from the weather wherever possible
(see Official Plan policy 4.3.6)
REQUIRED 2.1.2 Provide the number of bicycle parking spaces specified
for various land uses in different parts of Ottawa;
provide convenient access to main entrances or well-
used areas (see Zoning By-law Section 111)
REQUIRED 2.1.3 Ensure that bicycle parking spaces and access aisles
meet minimum dimensions; that no more than 50% of
spaces are vertical spaces; and that parking racks are
securely anchored (see Zoning By-law Section 111)
BASIC 2.1.4 Provide bicycle parking spaces equivalent to the
expected number of commuter cyclists (assuming the
cycling mode share target is met), plus the expected
peak number of customer/visitor cyclists
BETTER 2.1.5 Provide bicycle parking spaces equivalent to the
expected number of commuter and customer/visitor
cyclists, plus an additional buffer (e.g. 25 percent extra)
to encourage other cyclists and ensure adequate
capacity in peak cycling season
2.2 Secure bicycle parking
REQUIRED 2.2.1 Where more than 50 bicycle parking spaces are
provided for a single office building, locate at least 25%
of spaces within a building/structure, a secure area
(e.g. supervised parking lot or enclosure) or bicycle
lockers (see Zoning By-law Section 111)
BETTER 2.2.2 Provide secure bicycle parking spaces equivalent to the
expected number of commuter cyclists (assuming the
cycling mode share target is met)
2.3 Shower & change facilities
BASIC 2.3.1 Provide shower and change facilities for the use of
active commuters
BETTER 2.3.2 In addition to shower and change facilities, provide
dedicated lockers, grooming stations, drying racks and
laundry facilities for the use of active commuters
2.4 Bicycle repair station
BETTER 2.4.1 Provide a permanent bike repair station, with commonly
used tools and an air pump, adjacent to the main
bicycle parking area (or secure bicycle parking area, if
provided)

TDM-Supportive Development Design and Infrastructure Checklist City of Ottawa
Version 1.0 (30 June 2017)
8
TDM-supportive design & infrastructure measures:
Non-residential developments
Check if completed &
add descriptions, explanations
or plan/drawing references
3. TRANSIT
3.1 Customer amenities
BASIC 3.1.1 Provide shelters, lighting and benches at any on-site
transit stops
BASIC 3.1.2 Where the site abuts an off-site transit stop and
insufficient space exists for a transit shelter in the public
right-of-way, protect land for a shelter and/or install a
shelter
BETTER 3.1.3 Provide a secure and comfortable interior waiting area
by integrating any on-site transit stops into the building
4. RIDESHARING
4.1 Pick-up & drop-off facilities
BASIC 4.1.1 Provide a designated area for carpool drivers (plus taxis
and ride-hailing services) to drop off or pick up
passengers without using fire lanes or other no-stopping
zones
4.2 Carpool parking
BASIC 4.2.1 Provide signed parking spaces for carpools in a priority
location close to a major building entrance, sufficient in
number to accommodate the mode share target for
carpools
BETTER 4.2.2 At large developments, provide spaces for carpools in a
separate, access-controlled parking area to simplify
enforcement
5. CARSHARING & BIKESHARING
5.1 Carshare parking spaces
BETTER 5.1.1 Provide carshare parking spaces in permitted non-
residential zones, occupying either required or provided
parking spaces (see Zoning By-law Section 94)
5.2 Bikeshare station location
BETTER 5.2.1 Provide a designated bikeshare station area near a
major building entrance, preferably lighted and
sheltered with a direct walkway connection

TDM-Supportive Development Design and Infrastructure Checklist City of Ottawa
Version 1.0 (30 June 2017)
9
TDM-supportive design & infrastructure measures:
Non-residential developments
Check if completed &
add descriptions, explanations
or plan/drawing references
6. PARKING
6.1 Number of parking spaces
REQUIRED 6.1.1 Do not provide more parking than permitted by zoning,
nor less than required by zoning, unless a variance is
being applied for
BASIC 6.1.2 Provide parking for long-term and short-term users that
is consistent with mode share targets, considering the
potential for visitors to use off-site public parking
BASIC 6.1.3 Where a site features more than one use, provide
shared parking and reduce the cumulative number of
parking spaces accordingly (see Zoning By-law
Section 104)
BETTER 6.1.4 Reduce the minimum number of parking spaces
required by zoning by one space for each 13 square
metres of gross floor area provided as shower rooms,
change rooms, locker rooms and other facilities for
cyclists in conjunction with bicycle parking (see Zoning
By-law Section 111)
6.2 Separate long-term & short-term parking areas
BETTER 6.2.1 Separate short-term and long-term parking areas using
signage or physical barriers, to permit access controls
and simplify enforcement (i.e. to discourage employees
from parking in visitor spaces, and vice versa)
7. OTHER
7.1 On-site amenities to minimize off-site trips
BETTER 7.1.1 Provide on-site amenities to minimize mid-day or
mid-commute errands

TDM Measures Checklist City of Ottawa
Version 1.0 (30 June 2017)
8
TDM Measures Checklist: Non-Residential Developments (office, institutional, retail or industrial)
Legend
BASIC The measure is generally feasible and effective, and in most
cases would benefit the development and its users
BETTER The measure could maximize support for users of sustainable
modes, and optimize development performance
The measure is one of the most dependably effective tools to
encourage the use of sustainable modes
TDM measures: Non-residential developments Check if proposed &
add descriptions
1. TDM PROGRAM MANAGEMENT
1.1 Program coordinator
BASIC 1.1.1 Designate an internal coordinator, or contract with an external coordinator
1.2 Travel surveys
BETTER 1.2.1 Conduct periodic surveys to identify travel-related behaviours, attitudes, challenges and solutions, and to track progress
2. WALKING AND CYCLING
2.1 Information on walking/cycling routes & destinations
BASIC 2.1.1 Display local area maps with walking/cycling access routes and key destinations at major entrances
2.2 Bicycle skills training
Commuter travel
BETTER 2.2.1 Offer on-site cycling courses for commuters, or subsidize off-site courses
2.3 Valet bike parking
Visitor travel
BETTER 2.3.1 Offer secure valet bike parking during public events when demand exceeds fixed supply (e.g. for festivals, concerts, games)

TDM Measures Checklist City of Ottawa
Version 1.0 (30 June 2017)
9
TDM measures: Non-residential developments Check if proposed &
add descriptions
3. TRANSIT
3.1 Transit information
BASIC 3.1.1 Display relevant transit schedules and route maps at entrances
BASIC 3.1.2 Provide online links to OC Transpo and STO information
BETTER 3.1.3 Provide real-time arrival information display at entrances
3.2 Transit fare incentives
Commuter travel
BETTER 3.2.1 Offer preloaded PRESTO cards to encourage commuters to use transit
BETTER 3.2.2 Subsidize or reimburse monthly transit pass purchases by employees
Visitor travel
BETTER 3.2.3 Arrange inclusion of same-day transit fare in price of tickets (e.g. for festivals, concerts, games)
3.3 Enhanced public transit service
Commuter travel
BETTER 3.3.1 Contract with OC Transpo to provide enhanced transit services (e.g. for shift changes, weekends)
Visitor travel
BETTER 3.3.2 Contract with OC Transpo to provide enhanced transit services (e.g. for festivals, concerts, games)
3.4 Private transit service
Commuter travel
BETTER 3.4.1 Provide shuttle service when OC Transpo cannot offer sufficient quality or capacity to serve demand (e.g. for shift changes, weekends)
Visitor travel
BETTER 3.4.2 Provide shuttle service when OC Transpo cannot offer sufficient quality or capacity to serve demand (e.g. for festivals, concerts, games)

TDM Measures Checklist City of Ottawa
Version 1.0 (30 June 2017)
10
TDM measures: Non-residential developments Check if proposed &
add descriptions
4. RIDESHARING
4.1 Ridematching service
Commuter travel
BASIC 4.1.1 Provide a dedicated ridematching portal at OttawaRideMatch.com
4.2 Carpool parking price incentives
Commuter travel
BETTER 4.2.1 Provide discounts on parking costs for registered carpools
4.3 Vanpool service
Commuter travel
BETTER 4.3.1 Provide a vanpooling service for long-distance commuters
5. CARSHARING & BIKESHARING
5.1 Bikeshare stations & memberships
BETTER 5.1.1 Contract with provider to install on-site bikeshare station for use by commuters and visitors
Commuter travel
BETTER 5.1.2 Provide employees with bikeshare memberships for local business travel
5.2 Carshare vehicles & memberships
Commuter travel
BETTER 5.2.1 Contract with provider to install on-site carshare vehicles and promote their use by tenants
BETTER 5.2.2 Provide employees with carshare memberships for local business travel
6. PARKING
6.1 Priced parking
Commuter travel
BASIC 6.1.1 Charge for long-term parking (daily, weekly, monthly)
BASIC 6.1.2 Unbundle parking cost from lease rates at multi-tenant sites
Visitor travel
BETTER 6.1.3 Charge for short-term parking (hourly)

TDM Measures Checklist City of Ottawa
Version 1.0 (30 June 2017)
11
TDM measures: Non-residential developments Check if proposed &
add descriptions
7. TDM MARKETING & COMMUNICATIONS
7.1 Multimodal travel information
Commuter travel
BASIC 7.1.1 Provide a multimodal travel option information package to new/relocating employees and students
Visitor travel
BETTER 7.1.2 Include multimodal travel option information in invitations or advertising that attract visitors or customers (e.g. for festivals, concerts, games)
7.2 Personalized trip planning
Commuter travel
BETTER 7.2.1 Offer personalized trip planning to new/relocating employees
7.3 Promotions
Commuter travel
BETTER 7.3.1 Deliver promotions and incentives to maintain awareness, build understanding, and encourage trial of sustainable modes
8. OTHER INCENTIVES & AMENITIES
8.1 Emergency ride home
Commuter travel
BETTER 8.1.1 Provide emergency ride home service to non-driving commuters
8.2 Alternative work arrangements
Commuter travel
BASIC 8.2.1 Encourage flexible work hours
BETTER 8.2.2 Encourage compressed workweeks
BETTER 8.2.3 Encourage telework
8.3 Local business travel options
Commuter travel
BASIC 8.3.1 Provide local business travel options that minimize the need for employees to bring a personal car to work
8.4 Commuter incentives
Commuter travel
BETTER 8.4.1 Offer employees a taxable, mode-neutral commuting allowance
8.5 On-site amenities
Commuter travel
BETTER 8.5.1 Provide on-site amenities/services to minimize mid-day or mid-commute errands

800 PALLADIUM DRIVE TRANSPORTATION IMPACT ASSESSMENT
Appendix E Intersection Performance Worksheets
May 14, 2019
E.1
INTERSECTION PERFORMANCE WORKSHEETS

800 PALLADIUM DRIVE TRANSPORTATION IMPACT ASSESSMENT
Appendix E Intersection Performance Worksheets
May 14, 2019
E.1
2019 Existing Conditions
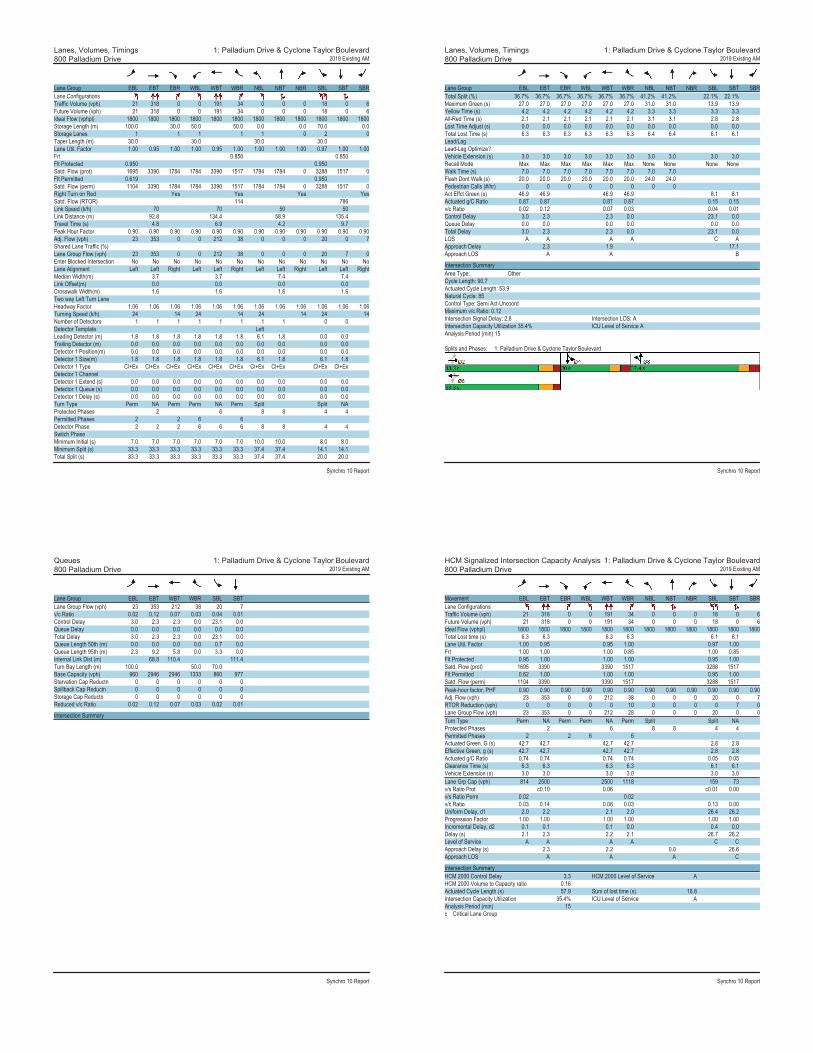
2019 Existing AM
Synchro 10 Report
Lane Group EBL EBT EBR WBL WBT WBR NBL NBT NBR SBL SBT SBRLane ConfigurationsTraffic Volume (vph) 21 318 0 0 191 34 0 0 0 18 0 6Future Volume (vph) 21 318 0 0 191 34 0 0 0 18 0 6Ideal Flow (vphpl) 1800 1800 1800 1800 1800 1800 1800 1800 1800 1800 1800 1800Storage Length (m) 100.0 30.0 50.0 50.0 0.0 0.0 70.0 0.0Storage Lanes 1 1 1 1 1 0 2 0Taper Length (m) 30.0 30.0 30.0 30.0Lane Util. Factor 1.00 0.95 1.00 1.00 0.95 1.00 1.00 1.00 1.00 0.97 1.00 1.00Frt 0.850 0.850Flt Protected 0.950 0.950Satd. Flow (prot) 1695 3390 1784 1784 3390 1517 1784 1784 0 3288 1517 0Flt Permitted 0.619 0.950Satd. Flow (perm) 1104 3390 1784 1784 3390 1517 1784 1784 0 3288 1517 0Right Turn on Red Yes Yes Yes YesSatd. Flow (RTOR) 114 786Link Speed (k/h) 70 70 50 50Link Distance (m) 92.8 134.4 58.9 135.4Travel Time (s) 4.8 6.9 4.2 9.7Peak Hour Factor 0.90 0.90 0.90 0.90 0.90 0.90 0.90 0.90 0.90 0.90 0.90 0.90Adj. Flow (vph) 23 353 0 0 212 38 0 0 0 20 0 7Shared Lane Traffic (%)Lane Group Flow (vph) 23 353 0 0 212 38 0 0 0 20 7 0Enter Blocked Intersection No No No No No No No No No No No NoLane Alignment Left Left Right Left Left Right Left Left Right Left Left RightMedian Width(m) 3.7 3.7 7.4 7.4Link Offset(m) 0.0 0.0 0.0 0.0Crosswalk Width(m) 1.6 1.6 1.6 1.6Two way Left Turn LaneHeadway Factor 1.06 1.06 1.06 1.06 1.06 1.06 1.06 1.06 1.06 1.06 1.06 1.06Turning Speed (k/h) 24 14 24 14 24 14 24 14Number of Detectors 1 1 1 1 1 1 1 1 0 0Detector Template LeftLeading Detector (m) 1.8 1.8 1.8 1.8 1.8 1.8 6.1 1.8 0.0 0.0Trailing Detector (m) 0.0 0.0 0.0 0.0 0.0 0.0 0.0 0.0 0.0 0.0Detector 1 Position(m) 0.0 0.0 0.0 0.0 0.0 0.0 0.0 0.0 0.0 0.0Detector 1 Size(m) 1.8 1.8 1.8 1.8 1.8 1.8 6.1 1.8 6.1 1.8Detector 1 Type Cl+Ex Cl+Ex Cl+Ex Cl+Ex Cl+Ex Cl+Ex Cl+Ex Cl+Ex Cl+Ex Cl+ExDetector 1 ChannelDetector 1 Extend (s) 0.0 0.0 0.0 0.0 0.0 0.0 0.0 0.0 0.0 0.0Detector 1 Queue (s) 0.0 0.0 0.0 0.0 0.0 0.0 0.0 0.0 0.0 0.0Detector 1 Delay (s) 0.0 0.0 0.0 0.0 0.0 0.0 0.0 0.0 0.0 0.0Turn Type Perm NA Perm Perm NA Perm Split Split NAProtected Phases 2 6 8 8 4 4Permitted Phases 2 2 6 6Detector Phase 2 2 2 6 6 6 8 8 4 4Switch PhaseMinimum Initial (s) 7.0 7.0 7.0 7.0 7.0 7.0 10.0 10.0 8.0 8.0Minimum Split (s) 33.3 33.3 33.3 33.3 33.3 33.3 37.4 37.4 14.1 14.1Total Split (s) 33.3 33.3 33.3 33.3 33.3 33.3 37.4 37.4 20.0 20.0
2019 Existing AM
Synchro 10 Report
Lane Group EBL EBT EBR WBL WBT WBR NBL NBT NBR SBL SBT SBRTotal Split (%) 36.7% 36.7% 36.7% 36.7% 36.7% 36.7% 41.2% 41.2% 22.1% 22.1%Maximum Green (s) 27.0 27.0 27.0 27.0 27.0 27.0 31.0 31.0 13.9 13.9Yellow Time (s) 4.2 4.2 4.2 4.2 4.2 4.2 3.3 3.3 3.3 3.3All-Red Time (s) 2.1 2.1 2.1 2.1 2.1 2.1 3.1 3.1 2.8 2.8Lost Time Adjust (s) 0.0 0.0 0.0 0.0 0.0 0.0 0.0 0.0 0.0 0.0Total Lost Time (s) 6.3 6.3 6.3 6.3 6.3 6.3 6.4 6.4 6.1 6.1Lead/LagLead-Lag Optimize?Vehicle Extension (s) 3.0 3.0 3.0 3.0 3.0 3.0 3.0 3.0 3.0 3.0Recall Mode Max Max Max Max Max Max None None None NoneWalk Time (s) 7.0 7.0 7.0 7.0 7.0 7.0 7.0 7.0Flash Dont Walk (s) 20.0 20.0 20.0 20.0 20.0 20.0 24.0 24.0Pedestrian Calls (#/hr) 0 0 0 0 0 0 0 0Act Effct Green (s) 46.9 46.9 46.9 46.9 8.1 8.1Actuated g/C Ratio 0.87 0.87 0.87 0.87 0.15 0.15v/c Ratio 0.02 0.12 0.07 0.03 0.04 0.01Control Delay 3.0 2.3 2.3 0.0 23.1 0.0Queue Delay 0.0 0.0 0.0 0.0 0.0 0.0Total Delay 3.0 2.3 2.3 0.0 23.1 0.0LOS A A A A C AApproach Delay 2.3 1.9 17.1Approach LOS A A B
Intersection SummaryArea Type: OtherCycle Length: 90.7Actuated Cycle Length: 53.9Natural Cycle: 85Control Type: Semi Act-UncoordMaximum v/c Ratio: 0.12Intersection Signal Delay: 2.8 Intersection LOS: AIntersection Capacity Utilization 35.4% ICU Level of Service AAnalysis Period (min) 15
Splits and Phases: 1: Palladium Drive & Cyclone Taylor Boulevard
2019 Existing AM
Synchro 10 Report
Lane Group EBL EBT WBT WBR SBL SBTLane Group Flow (vph) 23 353 212 38 20 7v/c Ratio 0.02 0.12 0.07 0.03 0.04 0.01Control Delay 3.0 2.3 2.3 0.0 23.1 0.0Queue Delay 0.0 0.0 0.0 0.0 0.0 0.0Total Delay 3.0 2.3 2.3 0.0 23.1 0.0Queue Length 50th (m) 0.0 0.0 0.0 0.0 0.7 0.0Queue Length 95th (m) 2.3 9.2 5.8 0.0 3.3 0.0Internal Link Dist (m) 68.8 110.4 111.4Turn Bay Length (m) 100.0 50.0 70.0Base Capacity (vph) 960 2946 2946 1333 860 977Starvation Cap Reductn 0 0 0 0 0 0Spillback Cap Reductn 0 0 0 0 0 0Storage Cap Reductn 0 0 0 0 0 0Reduced v/c Ratio 0.02 0.12 0.07 0.03 0.02 0.01
Intersection Summary
2019 Existing AM
Synchro 10 Report
Movement EBL EBT EBR WBL WBT WBR NBL NBT NBR SBL SBT SBRLane ConfigurationsTraffic Volume (vph) 21 318 0 0 191 34 0 0 0 18 0 6Future Volume (vph) 21 318 0 0 191 34 0 0 0 18 0 6Ideal Flow (vphpl) 1800 1800 1800 1800 1800 1800 1800 1800 1800 1800 1800 1800Total Lost time (s) 6.3 6.3 6.3 6.3 6.1 6.1Lane Util. Factor 1.00 0.95 0.95 1.00 0.97 1.00Frt 1.00 1.00 1.00 0.85 1.00 0.85Flt Protected 0.95 1.00 1.00 1.00 0.95 1.00Satd. Flow (prot) 1695 3390 3390 1517 3288 1517Flt Permitted 0.62 1.00 1.00 1.00 0.95 1.00Satd. Flow (perm) 1104 3390 3390 1517 3288 1517Peak-hour factor, PHF 0.90 0.90 0.90 0.90 0.90 0.90 0.90 0.90 0.90 0.90 0.90 0.90Adj. Flow (vph) 23 353 0 0 212 38 0 0 0 20 0 7RTOR Reduction (vph) 0 0 0 0 0 10 0 0 0 0 7 0Lane Group Flow (vph) 23 353 0 0 212 28 0 0 0 20 0 0Turn Type Perm NA Perm Perm NA Perm Split Split NAProtected Phases 2 6 8 8 4 4Permitted Phases 2 2 6 6Actuated Green, G (s) 42.7 42.7 42.7 42.7 2.8 2.8Effective Green, g (s) 42.7 42.7 42.7 42.7 2.8 2.8Actuated g/C Ratio 0.74 0.74 0.74 0.74 0.05 0.05Clearance Time (s) 6.3 6.3 6.3 6.3 6.1 6.1Vehicle Extension (s) 3.0 3.0 3.0 3.0 3.0 3.0Lane Grp Cap (vph) 814 2500 2500 1118 159 73v/s Ratio Prot c0.10 0.06 c0.01 0.00v/s Ratio Perm 0.02 0.02v/c Ratio 0.03 0.14 0.08 0.03 0.13 0.00Uniform Delay, d1 2.0 2.2 2.1 2.0 26.4 26.2Progression Factor 1.00 1.00 1.00 1.00 1.00 1.00Incremental Delay, d2 0.1 0.1 0.1 0.0 0.4 0.0Delay (s) 2.1 2.3 2.2 2.1 26.7 26.2Level of Service A A A A C CApproach Delay (s) 2.3 2.2 0.0 26.6Approach LOS A A A C
Intersection SummaryHCM 2000 Control Delay 3.3 HCM 2000 Level of Service AHCM 2000 Volume to Capacity ratio 0.16Actuated Cycle Length (s) 57.9 Sum of lost time (s) 18.8Intersection Capacity Utilization 35.4% ICU Level of Service AAnalysis Period (min) 15c Critical Lane Group

2019 Existing AM
Synchro 10 Report
Movement WBL WBR NBT NBR SBL SBTLane ConfigurationsTraffic Volume (veh/h) 5 1 62 28 3 29Future Volume (Veh/h) 5 1 62 28 3 29Sign Control Stop Free FreeGrade 0% 0% 0%Peak Hour Factor 0.90 0.90 0.90 0.90 0.90 0.90Hourly flow rate (vph) 6 1 69 31 3 32PedestriansLane Width (m)Walking Speed (m/s)Percent BlockageRight turn flare (veh)Median type Raised RaisedMedian storage veh) 1 1Upstream signal (m) 135pX, platoon unblockedvC, conflicting volume 122 50 100vC1, stage 1 conf vol 84vC2, stage 2 conf vol 38vCu, unblocked vol 122 50 100tC, single (s) 6.8 6.9 4.1tC, 2 stage (s) 5.8tF (s) 3.5 3.3 2.2p0 queue free % 99 100 100cM capacity (veh/h) 824 1008 1490
Direction, Lane # WB 1 NB 1 NB 2 SB 1Volume Total 7 46 54 35Volume Left 6 0 0 3Volume Right 1 0 31 0cSH 846 1700 1700 1490Volume to Capacity 0.01 0.03 0.03 0.00Queue Length 95th (m) 0.2 0.0 0.0 0.0Control Delay (s) 9.3 0.0 0.0 0.6Lane LOS A AApproach Delay (s) 9.3 0.0 0.6Approach LOS A
Intersection SummaryAverage Delay 0.6Intersection Capacity Utilization 14.2% ICU Level of Service AAnalysis Period (min) 15
2019 Existing AM
Synchro 10 Report
Movement EBL EBT WBT WBR SBL SBRLane ConfigurationsTraffic Volume (veh/h) 0 283 163 126 0 4Future Volume (Veh/h) 0 283 163 126 0 4Sign Control Free Free StopGrade 0% 0% 0%Peak Hour Factor 0.90 0.90 0.90 0.90 0.90 0.90Hourly flow rate (vph) 0 314 181 140 0 4PedestriansLane Width (m)Walking Speed (m/s)Percent BlockageRight turn flare (veh)Median type None NoneMedian storage veh)Upstream signal (m) 134pX, platoon unblockedvC, conflicting volume 321 408 160vC1, stage 1 conf volvC2, stage 2 conf volvCu, unblocked vol 321 408 160tC, single (s) 4.1 6.8 6.9tC, 2 stage (s)tF (s) 2.2 3.5 3.3p0 queue free % 100 100 100cM capacity (veh/h) 1236 571 856
Direction, Lane # EB 1 EB 2 WB 1 WB 2 SB 1Volume Total 157 157 121 200 4Volume Left 0 0 0 0 0Volume Right 0 0 0 140 4cSH 1700 1700 1700 1700 856Volume to Capacity 0.09 0.09 0.07 0.12 0.00Queue Length 95th (m) 0.0 0.0 0.0 0.0 0.1Control Delay (s) 0.0 0.0 0.0 0.0 9.2Lane LOS AApproach Delay (s) 0.0 0.0 9.2Approach LOS A
Intersection SummaryAverage Delay 0.1Intersection Capacity Utilization 19.0% ICU Level of Service AAnalysis Period (min) 15
2019 Existing PM
Synchro 10 Report
Lane Group EBL EBT EBR WBL WBT WBR NBL NBT NBR SBL SBT SBRLane ConfigurationsTraffic Volume (vph) 3 401 0 0 594 17 0 0 1 86 0 47Future Volume (vph) 3 401 0 0 594 17 0 0 1 86 0 47Ideal Flow (vphpl) 1800 1800 1800 1800 1800 1800 1800 1800 1800 1800 1800 1800Storage Length (m) 100.0 30.0 50.0 50.0 0.0 0.0 70.0 0.0Storage Lanes 1 1 1 1 1 0 2 0Taper Length (m) 30.0 30.0 30.0 30.0Lane Util. Factor 1.00 0.95 1.00 1.00 0.95 1.00 1.00 1.00 1.00 0.97 1.00 1.00Frt 0.850 0.850 0.850Flt Protected 0.950 0.950Satd. Flow (prot) 1695 3390 1784 1784 3390 1517 1784 1517 0 3288 1517 0Flt Permitted 0.399 0.950Satd. Flow (perm) 712 3390 1784 1784 3390 1517 1784 1517 0 3288 1517 0Right Turn on Red Yes Yes Yes YesSatd. Flow (RTOR) 114 266 609Link Speed (k/h) 70 70 50 50Link Distance (m) 92.8 134.4 58.9 135.4Travel Time (s) 4.8 6.9 4.2 9.7Peak Hour Factor 0.90 0.90 0.90 0.90 0.90 0.90 0.90 0.90 0.90 0.90 0.90 0.90Adj. Flow (vph) 3 446 0 0 660 19 0 0 1 96 0 52Shared Lane Traffic (%)Lane Group Flow (vph) 3 446 0 0 660 19 0 1 0 96 52 0Enter Blocked Intersection No No No No No No No No No No No NoLane Alignment Left Left Right Left Left Right Left Left Right Left Left RightMedian Width(m) 3.7 3.7 7.4 7.4Link Offset(m) 0.0 0.0 0.0 0.0Crosswalk Width(m) 1.6 1.6 1.6 1.6Two way Left Turn LaneHeadway Factor 1.06 1.06 1.06 1.06 1.06 1.06 1.06 1.06 1.06 1.06 1.06 1.06Turning Speed (k/h) 24 14 24 14 24 14 24 14Number of Detectors 1 1 1 1 1 1 1 1 0 0Detector Template LeftLeading Detector (m) 1.8 1.8 1.8 1.8 1.8 1.8 6.1 1.8 0.0 0.0Trailing Detector (m) 0.0 0.0 0.0 0.0 0.0 0.0 0.0 0.0 0.0 0.0Detector 1 Position(m) 0.0 0.0 0.0 0.0 0.0 0.0 0.0 0.0 0.0 0.0Detector 1 Size(m) 1.8 1.8 1.8 1.8 1.8 1.8 6.1 1.8 6.1 1.8Detector 1 Type Cl+Ex Cl+Ex Cl+Ex Cl+Ex Cl+Ex Cl+Ex Cl+Ex Cl+Ex Cl+Ex Cl+ExDetector 1 ChannelDetector 1 Extend (s) 0.0 0.0 0.0 0.0 0.0 0.0 0.0 0.0 0.0 0.0Detector 1 Queue (s) 0.0 0.0 0.0 0.0 0.0 0.0 0.0 0.0 0.0 0.0Detector 1 Delay (s) 0.0 0.0 0.0 0.0 0.0 0.0 0.0 0.0 0.0 0.0Turn Type Perm NA Perm Perm NA Perm Split NA Split NAProtected Phases 2 6 8 8 4 4Permitted Phases 2 2 6 6Detector Phase 2 2 2 6 6 6 8 8 4 4Switch PhaseMinimum Initial (s) 7.0 7.0 7.0 7.0 7.0 7.0 10.0 10.0 8.0 8.0Minimum Split (s) 33.3 33.3 33.3 33.3 33.3 33.3 37.4 37.4 14.1 14.1Total Split (s) 33.3 33.3 33.3 33.3 33.3 33.3 37.4 37.4 20.0 20.0
2019 Existing PM
Synchro 10 Report
Lane Group EBL EBT EBR WBL WBT WBR NBL NBT NBR SBL SBT SBRTotal Split (%) 36.7% 36.7% 36.7% 36.7% 36.7% 36.7% 41.2% 41.2% 22.1% 22.1%Maximum Green (s) 27.0 27.0 27.0 27.0 27.0 27.0 31.0 31.0 13.9 13.9Yellow Time (s) 4.2 4.2 4.2 4.2 4.2 4.2 3.3 3.3 3.3 3.3All-Red Time (s) 2.1 2.1 2.1 2.1 2.1 2.1 3.1 3.1 2.8 2.8Lost Time Adjust (s) 0.0 0.0 0.0 0.0 0.0 0.0 0.0 0.0 0.0 0.0Total Lost Time (s) 6.3 6.3 6.3 6.3 6.3 6.3 6.4 6.4 6.1 6.1Lead/LagLead-Lag Optimize?Vehicle Extension (s) 3.0 3.0 3.0 3.0 3.0 3.0 3.0 3.0 3.0 3.0Recall Mode Max Max Max Max Max Max None None None NoneWalk Time (s) 7.0 7.0 7.0 7.0 7.0 7.0 7.0 7.0Flash Dont Walk (s) 20.0 20.0 20.0 20.0 20.0 20.0 24.0 24.0Pedestrian Calls (#/hr) 0 0 0 0 0 0 0 0Act Effct Green (s) 35.5 35.5 35.5 35.5 10.2 8.2 8.2Actuated g/C Ratio 0.65 0.65 0.65 0.65 0.19 0.15 0.15v/c Ratio 0.01 0.20 0.30 0.02 0.00 0.19 0.07Control Delay 8.3 7.0 7.5 0.1 0.0 22.4 0.2Queue Delay 0.0 0.0 0.0 0.0 0.0 0.0 0.0Total Delay 8.3 7.0 7.5 0.1 0.0 22.4 0.2LOS A A A A A C AApproach Delay 7.0 7.3 14.6Approach LOS A A B
Intersection SummaryArea Type: OtherCycle Length: 90.7Actuated Cycle Length: 54.5Natural Cycle: 85Control Type: Semi Act-UncoordMaximum v/c Ratio: 0.30Intersection Signal Delay: 8.0 Intersection LOS: AIntersection Capacity Utilization 36.9% ICU Level of Service AAnalysis Period (min) 15
Splits and Phases: 1: Palladium Drive & Cyclone Taylor Boulevard

2019 Existing PM
Synchro 10 Report
Lane Group EBL EBT WBT WBR NBT SBL SBTLane Group Flow (vph) 3 446 660 19 1 96 52v/c Ratio 0.01 0.20 0.30 0.02 0.00 0.19 0.07Control Delay 8.3 7.0 7.5 0.1 0.0 22.4 0.2Queue Delay 0.0 0.0 0.0 0.0 0.0 0.0 0.0Total Delay 8.3 7.0 7.5 0.1 0.0 22.4 0.2Queue Length 50th (m) 0.1 7.5 12.1 0.0 0.0 3.6 0.0Queue Length 95th (m) 1.4 25.2 38.2 0.0 0.0 10.2 0.0Internal Link Dist (m) 68.8 110.4 34.9 111.4Turn Bay Length (m) 100.0 50.0 70.0Base Capacity (vph) 463 2207 2207 1027 989 852 844Starvation Cap Reductn 0 0 0 0 0 0 0Spillback Cap Reductn 0 0 0 0 0 0 0Storage Cap Reductn 0 0 0 0 0 0 0Reduced v/c Ratio 0.01 0.20 0.30 0.02 0.00 0.11 0.06
Intersection Summary
2019 Existing PM
Synchro 10 Report
Movement EBL EBT EBR WBL WBT WBR NBL NBT NBR SBL SBT SBRLane ConfigurationsTraffic Volume (vph) 3 401 0 0 594 17 0 0 1 86 0 47Future Volume (vph) 3 401 0 0 594 17 0 0 1 86 0 47Ideal Flow (vphpl) 1800 1800 1800 1800 1800 1800 1800 1800 1800 1800 1800 1800Total Lost time (s) 6.3 6.3 6.3 6.3 6.4 6.1 6.1Lane Util. Factor 1.00 0.95 0.95 1.00 1.00 0.97 1.00Frt 1.00 1.00 1.00 0.85 0.85 1.00 0.85Flt Protected 0.95 1.00 1.00 1.00 1.00 0.95 1.00Satd. Flow (prot) 1695 3390 3390 1517 1517 3288 1517Flt Permitted 0.40 1.00 1.00 1.00 1.00 0.95 1.00Satd. Flow (perm) 713 3390 3390 1517 1517 3288 1517Peak-hour factor, PHF 0.90 0.90 0.90 0.90 0.90 0.90 0.90 0.90 0.90 0.90 0.90 0.90Adj. Flow (vph) 3 446 0 0 660 19 0 0 1 96 0 52RTOR Reduction (vph) 0 0 0 0 0 8 0 1 0 0 47 0Lane Group Flow (vph) 3 446 0 0 660 11 0 0 0 96 5 0Turn Type Perm NA Perm Perm NA Perm Split NA Split NAProtected Phases 2 6 8 8 4 4Permitted Phases 2 2 6 6Actuated Green, G (s) 34.1 34.1 34.1 34.1 1.7 6.4 6.4Effective Green, g (s) 34.1 34.1 34.1 34.1 1.7 6.4 6.4Actuated g/C Ratio 0.56 0.56 0.56 0.56 0.03 0.10 0.10Clearance Time (s) 6.3 6.3 6.3 6.3 6.4 6.1 6.1Vehicle Extension (s) 3.0 3.0 3.0 3.0 3.0 3.0 3.0Lane Grp Cap (vph) 398 1895 1895 848 42 344 159v/s Ratio Prot 0.13 c0.19 c0.00 c0.03 0.00v/s Ratio Perm 0.00 0.01v/c Ratio 0.01 0.24 0.35 0.01 0.00 0.28 0.03Uniform Delay, d1 6.0 6.8 7.4 6.0 28.8 25.2 24.5Progression Factor 1.00 1.00 1.00 1.00 1.00 1.00 1.00Incremental Delay, d2 0.0 0.3 0.5 0.0 0.0 0.4 0.1Delay (s) 6.0 7.1 7.9 6.0 28.8 25.6 24.6Level of Service A A A A C C CApproach Delay (s) 7.1 7.8 28.8 25.3Approach LOS A A C C
Intersection SummaryHCM 2000 Control Delay 9.6 HCM 2000 Level of Service AHCM 2000 Volume to Capacity ratio 0.32Actuated Cycle Length (s) 61.0 Sum of lost time (s) 18.8Intersection Capacity Utilization 36.9% ICU Level of Service AAnalysis Period (min) 15c Critical Lane Group
2019 Existing PM
Synchro 10 Report
Movement WBL WBR NBT NBR SBL SBTLane ConfigurationsTraffic Volume (veh/h) 92 2 9 4 0 77Future Volume (Veh/h) 92 2 9 4 0 77Sign Control Stop Free FreeGrade 0% 0% 0%Peak Hour Factor 0.90 0.90 0.90 0.90 0.90 0.90Hourly flow rate (vph) 102 2 10 4 0 86PedestriansLane Width (m)Walking Speed (m/s)Percent BlockageRight turn flare (veh)Median type Raised RaisedMedian storage veh) 1 1Upstream signal (m) 135pX, platoon unblockedvC, conflicting volume 98 7 14vC1, stage 1 conf vol 12vC2, stage 2 conf vol 86vCu, unblocked vol 98 7 14tC, single (s) 6.8 6.9 4.1tC, 2 stage (s) 5.8tF (s) 3.5 3.3 2.2p0 queue free % 88 100 100cM capacity (veh/h) 838 1073 1603
Direction, Lane # WB 1 NB 1 NB 2 SB 1Volume Total 104 7 7 86Volume Left 102 0 0 0Volume Right 2 0 4 0cSH 842 1700 1700 1603Volume to Capacity 0.12 0.00 0.00 0.00Queue Length 95th (m) 2.9 0.0 0.0 0.0Control Delay (s) 9.9 0.0 0.0 0.0Lane LOS AApproach Delay (s) 9.9 0.0 0.0Approach LOS A
Intersection SummaryAverage Delay 5.0Intersection Capacity Utilization 16.5% ICU Level of Service AAnalysis Period (min) 15
2019 Existing PM
Synchro 10 Report
Movement EBL EBT WBT WBR SBL SBRLane ConfigurationsTraffic Volume (veh/h) 0 404 497 11 0 24Future Volume (Veh/h) 0 404 497 11 0 24Sign Control Free Free StopGrade 0% 0% 0%Peak Hour Factor 0.90 0.90 0.90 0.90 0.90 0.90Hourly flow rate (vph) 0 449 552 12 0 27PedestriansLane Width (m)Walking Speed (m/s)Percent BlockageRight turn flare (veh)Median type None NoneMedian storage veh)Upstream signal (m) 134pX, platoon unblocked 0.99vC, conflicting volume 564 782 282vC1, stage 1 conf volvC2, stage 2 conf volvCu, unblocked vol 564 771 282tC, single (s) 4.1 6.8 6.9tC, 2 stage (s)tF (s) 2.2 3.5 3.3p0 queue free % 100 100 96cM capacity (veh/h) 1004 335 715
Direction, Lane # EB 1 EB 2 WB 1 WB 2 SB 1Volume Total 224 224 368 196 27Volume Left 0 0 0 0 0Volume Right 0 0 0 12 27cSH 1700 1700 1700 1700 715Volume to Capacity 0.13 0.13 0.22 0.12 0.04Queue Length 95th (m) 0.0 0.0 0.0 0.0 0.8Control Delay (s) 0.0 0.0 0.0 0.0 10.2Lane LOS BApproach Delay (s) 0.0 0.0 10.2Approach LOS B
Intersection SummaryAverage Delay 0.3Intersection Capacity Utilization 24.9% ICU Level of Service AAnalysis Period (min) 15
800 PALLADIUM DRIVE TRANSPORTATION IMPACT ASSESSMENT
Appendix E Intersection Performance Worksheets
May 14, 2019
E.2
2019 Total Future Conditions

2019 Total AM
Synchro 10 Report
Lane Group EBL EBT EBR WBL WBT WBR NBL NBT NBR SBL SBT SBRLane ConfigurationsTraffic Volume (vph) 48 318 0 0 198 34 0 0 0 47 0 8Future Volume (vph) 48 318 0 0 198 34 0 0 0 47 0 8Ideal Flow (vphpl) 1800 1800 1800 1800 1800 1800 1800 1800 1800 1800 1800 1800Storage Length (m) 100.0 30.0 50.0 50.0 0.0 0.0 70.0 0.0Storage Lanes 1 1 1 1 1 0 2 0Taper Length (m) 30.0 30.0 30.0 30.0Lane Util. Factor 1.00 0.95 1.00 1.00 0.95 1.00 1.00 1.00 1.00 0.97 1.00 1.00Frt 0.850 0.850Flt Protected 0.950 0.950Satd. Flow (prot) 1695 3390 1784 1784 3390 1517 1784 1784 0 3288 1517 0Flt Permitted 0.617 0.950Satd. Flow (perm) 1101 3390 1784 1784 3390 1517 1784 1784 0 3288 1517 0Right Turn on Red Yes Yes Yes YesSatd. Flow (RTOR) 114 783Link Speed (k/h) 70 70 50 50Link Distance (m) 92.8 134.4 58.9 135.4Travel Time (s) 4.8 6.9 4.2 9.7Peak Hour Factor 0.92 0.92 0.92 0.92 0.92 0.92 0.92 0.92 0.92 0.92 0.92 0.92Adj. Flow (vph) 52 346 0 0 215 37 0 0 0 51 0 9Shared Lane Traffic (%)Lane Group Flow (vph) 52 346 0 0 215 37 0 0 0 51 9 0Enter Blocked Intersection No No No No No No No No No No No NoLane Alignment Left Left Right Left Left Right Left Left Right Left Left RightMedian Width(m) 3.7 3.7 7.4 7.4Link Offset(m) 0.0 0.0 0.0 0.0Crosswalk Width(m) 1.6 1.6 1.6 1.6Two way Left Turn LaneHeadway Factor 1.06 1.06 1.06 1.06 1.06 1.06 1.06 1.06 1.06 1.06 1.06 1.06Turning Speed (k/h) 24 14 24 14 24 14 24 14Number of Detectors 1 1 1 1 1 1 1 1 0 0Detector Template LeftLeading Detector (m) 1.8 1.8 1.8 1.8 1.8 1.8 6.1 1.8 0.0 0.0Trailing Detector (m) 0.0 0.0 0.0 0.0 0.0 0.0 0.0 0.0 0.0 0.0Detector 1 Position(m) 0.0 0.0 0.0 0.0 0.0 0.0 0.0 0.0 0.0 0.0Detector 1 Size(m) 1.8 1.8 1.8 1.8 1.8 1.8 6.1 1.8 6.1 1.8Detector 1 Type Cl+Ex Cl+Ex Cl+Ex Cl+Ex Cl+Ex Cl+Ex Cl+Ex Cl+Ex Cl+Ex Cl+ExDetector 1 ChannelDetector 1 Extend (s) 0.0 0.0 0.0 0.0 0.0 0.0 0.0 0.0 0.0 0.0Detector 1 Queue (s) 0.0 0.0 0.0 0.0 0.0 0.0 0.0 0.0 0.0 0.0Detector 1 Delay (s) 0.0 0.0 0.0 0.0 0.0 0.0 0.0 0.0 0.0 0.0Turn Type Perm NA Perm Perm NA Perm Split Split NAProtected Phases 2 6 8 8 4 4Permitted Phases 2 2 6 6Detector Phase 2 2 2 6 6 6 8 8 4 4Switch PhaseMinimum Initial (s) 7.0 7.0 7.0 7.0 7.0 7.0 10.0 10.0 8.0 8.0Minimum Split (s) 33.3 33.3 33.3 33.3 33.3 33.3 37.4 37.4 14.1 14.1Total Split (s) 33.3 33.3 33.3 33.3 33.3 33.3 37.4 37.4 20.0 20.0
2019 Total AM
Synchro 10 Report
Lane Group EBL EBT EBR WBL WBT WBR NBL NBT NBR SBL SBT SBRTotal Split (%) 36.7% 36.7% 36.7% 36.7% 36.7% 36.7% 41.2% 41.2% 22.1% 22.1%Maximum Green (s) 27.0 27.0 27.0 27.0 27.0 27.0 31.0 31.0 13.9 13.9Yellow Time (s) 4.2 4.2 4.2 4.2 4.2 4.2 3.3 3.3 3.3 3.3All-Red Time (s) 2.1 2.1 2.1 2.1 2.1 2.1 3.1 3.1 2.8 2.8Lost Time Adjust (s) 0.0 0.0 0.0 0.0 0.0 0.0 0.0 0.0 0.0 0.0Total Lost Time (s) 6.3 6.3 6.3 6.3 6.3 6.3 6.4 6.4 6.1 6.1Lead/LagLead-Lag Optimize?Vehicle Extension (s) 3.0 3.0 3.0 3.0 3.0 3.0 3.0 3.0 3.0 3.0Recall Mode Max Max Max Max Max Max None None None NoneWalk Time (s) 7.0 7.0 7.0 7.0 7.0 7.0 7.0 7.0Flash Dont Walk (s) 20.0 20.0 20.0 20.0 20.0 20.0 24.0 24.0Pedestrian Calls (#/hr) 0 0 0 0 0 0 0 0Act Effct Green (s) 42.8 42.8 42.8 42.8 8.1 8.1Actuated g/C Ratio 0.79 0.79 0.79 0.79 0.15 0.15v/c Ratio 0.06 0.13 0.08 0.03 0.10 0.01Control Delay 3.9 3.3 3.3 0.1 21.6 0.0Queue Delay 0.0 0.0 0.0 0.0 0.0 0.0Total Delay 3.9 3.3 3.3 0.1 21.6 0.0LOS A A A A C AApproach Delay 3.4 2.8 18.3Approach LOS A A B
Intersection SummaryArea Type: OtherCycle Length: 90.7Actuated Cycle Length: 54.3Natural Cycle: 85Control Type: Semi Act-UncoordMaximum v/c Ratio: 0.13Intersection Signal Delay: 4.5 Intersection LOS: AIntersection Capacity Utilization 37.4% ICU Level of Service AAnalysis Period (min) 15
Splits and Phases: 1: Palladium Drive & Cyclone Taylor Boulevard
2019 Total AM
Synchro 10 Report
Lane Group EBL EBT WBT WBR SBL SBTLane Group Flow (vph) 52 346 215 37 51 9v/c Ratio 0.06 0.13 0.08 0.03 0.10 0.01Control Delay 3.9 3.3 3.3 0.1 21.6 0.0Queue Delay 0.0 0.0 0.0 0.0 0.0 0.0Total Delay 3.9 3.3 3.3 0.1 21.6 0.0Queue Length 50th (m) 1.5 5.6 3.3 0.0 2.5 0.0Queue Length 95th (m) 4.4 9.4 6.2 0.0 5.3 0.0Internal Link Dist (m) 68.8 110.4 111.4Turn Bay Length (m) 100.0 50.0 70.0Base Capacity (vph) 868 2673 2673 1220 852 973Starvation Cap Reductn 0 0 0 0 0 0Spillback Cap Reductn 0 0 0 0 0 0Storage Cap Reductn 0 0 0 0 0 0Reduced v/c Ratio 0.06 0.13 0.08 0.03 0.06 0.01
Intersection Summary
2019 Total AM
Synchro 10 Report
Movement EBL EBT EBR WBL WBT WBR NBL NBT NBR SBL SBT SBRLane ConfigurationsTraffic Volume (vph) 48 318 0 0 198 34 0 0 0 47 0 8Future Volume (vph) 48 318 0 0 198 34 0 0 0 47 0 8Ideal Flow (vphpl) 1800 1800 1800 1800 1800 1800 1800 1800 1800 1800 1800 1800Total Lost time (s) 6.3 6.3 6.3 6.3 6.1 6.1Lane Util. Factor 1.00 0.95 0.95 1.00 0.97 1.00Frt 1.00 1.00 1.00 0.85 1.00 0.85Flt Protected 0.95 1.00 1.00 1.00 0.95 1.00Satd. Flow (prot) 1695 3390 3390 1517 3288 1517Flt Permitted 0.62 1.00 1.00 1.00 0.95 1.00Satd. Flow (perm) 1101 3390 3390 1517 3288 1517Peak-hour factor, PHF 0.92 0.92 0.92 0.92 0.92 0.92 0.92 0.92 0.92 0.92 0.92 0.92Adj. Flow (vph) 52 346 0 0 215 37 0 0 0 51 0 9RTOR Reduction (vph) 0 0 0 0 0 11 0 0 0 0 8 0Lane Group Flow (vph) 52 346 0 0 215 26 0 0 0 51 1 0Turn Type Perm NA Perm Perm NA Perm Split Split NAProtected Phases 2 6 8 8 4 4Permitted Phases 2 2 6 6Actuated Green, G (s) 40.0 40.0 40.0 40.0 4.5 4.5Effective Green, g (s) 40.0 40.0 40.0 40.0 4.5 4.5Actuated g/C Ratio 0.70 0.70 0.70 0.70 0.08 0.08Clearance Time (s) 6.3 6.3 6.3 6.3 6.1 6.1Vehicle Extension (s) 3.0 3.0 3.0 3.0 3.0 3.0Lane Grp Cap (vph) 773 2383 2383 1066 260 119v/s Ratio Prot c0.10 0.06 c0.02 0.00v/s Ratio Perm 0.05 0.02v/c Ratio 0.07 0.15 0.09 0.02 0.20 0.01Uniform Delay, d1 2.6 2.8 2.7 2.6 24.5 24.1Progression Factor 1.00 1.00 1.00 1.00 1.00 1.00Incremental Delay, d2 0.2 0.1 0.1 0.0 0.4 0.0Delay (s) 2.8 2.9 2.8 2.6 24.9 24.2Level of Service A A A A C CApproach Delay (s) 2.9 2.7 0.0 24.8Approach LOS A A A C
Intersection SummaryHCM 2000 Control Delay 4.7 HCM 2000 Level of Service AHCM 2000 Volume to Capacity ratio 0.18Actuated Cycle Length (s) 56.9 Sum of lost time (s) 18.8Intersection Capacity Utilization 37.4% ICU Level of Service AAnalysis Period (min) 15c Critical Lane Group
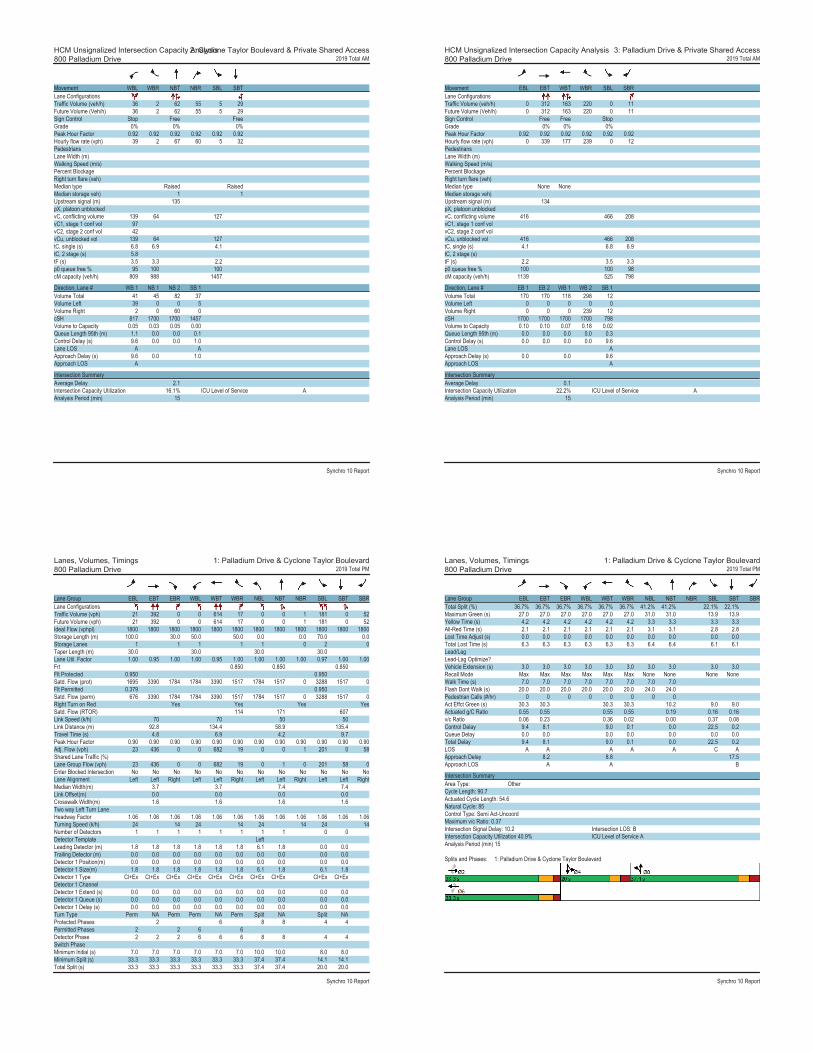
2019 Total AM
Synchro 10 Report
Movement WBL WBR NBT NBR SBL SBTLane ConfigurationsTraffic Volume (veh/h) 36 2 62 55 5 29Future Volume (Veh/h) 36 2 62 55 5 29Sign Control Stop Free FreeGrade 0% 0% 0%Peak Hour Factor 0.92 0.92 0.92 0.92 0.92 0.92Hourly flow rate (vph) 39 2 67 60 5 32PedestriansLane Width (m)Walking Speed (m/s)Percent BlockageRight turn flare (veh)Median type Raised RaisedMedian storage veh) 1 1Upstream signal (m) 135pX, platoon unblockedvC, conflicting volume 139 64 127vC1, stage 1 conf vol 97vC2, stage 2 conf vol 42vCu, unblocked vol 139 64 127tC, single (s) 6.8 6.9 4.1tC, 2 stage (s) 5.8tF (s) 3.5 3.3 2.2p0 queue free % 95 100 100cM capacity (veh/h) 809 988 1457
Direction, Lane # WB 1 NB 1 NB 2 SB 1Volume Total 41 45 82 37Volume Left 39 0 0 5Volume Right 2 0 60 0cSH 817 1700 1700 1457Volume to Capacity 0.05 0.03 0.05 0.00Queue Length 95th (m) 1.1 0.0 0.0 0.1Control Delay (s) 9.6 0.0 0.0 1.0Lane LOS A AApproach Delay (s) 9.6 0.0 1.0Approach LOS A
Intersection SummaryAverage Delay 2.1Intersection Capacity Utilization 16.1% ICU Level of Service AAnalysis Period (min) 15
2019 Total AM
Synchro 10 Report
Movement EBL EBT WBT WBR SBL SBRLane ConfigurationsTraffic Volume (veh/h) 0 312 163 220 0 11Future Volume (Veh/h) 0 312 163 220 0 11Sign Control Free Free StopGrade 0% 0% 0%Peak Hour Factor 0.92 0.92 0.92 0.92 0.92 0.92Hourly flow rate (vph) 0 339 177 239 0 12PedestriansLane Width (m)Walking Speed (m/s)Percent BlockageRight turn flare (veh)Median type None NoneMedian storage veh)Upstream signal (m) 134pX, platoon unblockedvC, conflicting volume 416 466 208vC1, stage 1 conf volvC2, stage 2 conf volvCu, unblocked vol 416 466 208tC, single (s) 4.1 6.8 6.9tC, 2 stage (s)tF (s) 2.2 3.5 3.3p0 queue free % 100 100 98cM capacity (veh/h) 1139 525 798
Direction, Lane # EB 1 EB 2 WB 1 WB 2 SB 1Volume Total 170 170 118 298 12Volume Left 0 0 0 0 0Volume Right 0 0 0 239 12cSH 1700 1700 1700 1700 798Volume to Capacity 0.10 0.10 0.07 0.18 0.02Queue Length 95th (m) 0.0 0.0 0.0 0.0 0.3Control Delay (s) 0.0 0.0 0.0 0.0 9.6Lane LOS AApproach Delay (s) 0.0 0.0 9.6Approach LOS A
Intersection SummaryAverage Delay 0.1Intersection Capacity Utilization 22.2% ICU Level of Service AAnalysis Period (min) 15
2019 Total PM
Synchro 10 Report
Lane Group EBL EBT EBR WBL WBT WBR NBL NBT NBR SBL SBT SBRLane ConfigurationsTraffic Volume (vph) 21 392 0 0 614 17 0 0 1 181 0 52Future Volume (vph) 21 392 0 0 614 17 0 0 1 181 0 52Ideal Flow (vphpl) 1800 1800 1800 1800 1800 1800 1800 1800 1800 1800 1800 1800Storage Length (m) 100.0 30.0 50.0 50.0 0.0 0.0 70.0 0.0Storage Lanes 1 1 1 1 1 0 2 0Taper Length (m) 30.0 30.0 30.0 30.0Lane Util. Factor 1.00 0.95 1.00 1.00 0.95 1.00 1.00 1.00 1.00 0.97 1.00 1.00Frt 0.850 0.850 0.850Flt Protected 0.950 0.950Satd. Flow (prot) 1695 3390 1784 1784 3390 1517 1784 1517 0 3288 1517 0Flt Permitted 0.379 0.950Satd. Flow (perm) 676 3390 1784 1784 3390 1517 1784 1517 0 3288 1517 0Right Turn on Red Yes Yes Yes YesSatd. Flow (RTOR) 114 171 607Link Speed (k/h) 70 70 50 50Link Distance (m) 92.8 134.4 58.9 135.4Travel Time (s) 4.8 6.9 4.2 9.7Peak Hour Factor 0.90 0.90 0.90 0.90 0.90 0.90 0.90 0.90 0.90 0.90 0.90 0.90Adj. Flow (vph) 23 436 0 0 682 19 0 0 1 201 0 58Shared Lane Traffic (%)Lane Group Flow (vph) 23 436 0 0 682 19 0 1 0 201 58 0Enter Blocked Intersection No No No No No No No No No No No NoLane Alignment Left Left Right Left Left Right Left Left Right Left Left RightMedian Width(m) 3.7 3.7 7.4 7.4Link Offset(m) 0.0 0.0 0.0 0.0Crosswalk Width(m) 1.6 1.6 1.6 1.6Two way Left Turn LaneHeadway Factor 1.06 1.06 1.06 1.06 1.06 1.06 1.06 1.06 1.06 1.06 1.06 1.06Turning Speed (k/h) 24 14 24 14 24 14 24 14Number of Detectors 1 1 1 1 1 1 1 1 0 0Detector Template LeftLeading Detector (m) 1.8 1.8 1.8 1.8 1.8 1.8 6.1 1.8 0.0 0.0Trailing Detector (m) 0.0 0.0 0.0 0.0 0.0 0.0 0.0 0.0 0.0 0.0Detector 1 Position(m) 0.0 0.0 0.0 0.0 0.0 0.0 0.0 0.0 0.0 0.0Detector 1 Size(m) 1.8 1.8 1.8 1.8 1.8 1.8 6.1 1.8 6.1 1.8Detector 1 Type Cl+Ex Cl+Ex Cl+Ex Cl+Ex Cl+Ex Cl+Ex Cl+Ex Cl+Ex Cl+Ex Cl+ExDetector 1 ChannelDetector 1 Extend (s) 0.0 0.0 0.0 0.0 0.0 0.0 0.0 0.0 0.0 0.0Detector 1 Queue (s) 0.0 0.0 0.0 0.0 0.0 0.0 0.0 0.0 0.0 0.0Detector 1 Delay (s) 0.0 0.0 0.0 0.0 0.0 0.0 0.0 0.0 0.0 0.0Turn Type Perm NA Perm Perm NA Perm Split NA Split NAProtected Phases 2 6 8 8 4 4Permitted Phases 2 2 6 6Detector Phase 2 2 2 6 6 6 8 8 4 4Switch PhaseMinimum Initial (s) 7.0 7.0 7.0 7.0 7.0 7.0 10.0 10.0 8.0 8.0Minimum Split (s) 33.3 33.3 33.3 33.3 33.3 33.3 37.4 37.4 14.1 14.1Total Split (s) 33.3 33.3 33.3 33.3 33.3 33.3 37.4 37.4 20.0 20.0
2019 Total PM
Synchro 10 Report
Lane Group EBL EBT EBR WBL WBT WBR NBL NBT NBR SBL SBT SBRTotal Split (%) 36.7% 36.7% 36.7% 36.7% 36.7% 36.7% 41.2% 41.2% 22.1% 22.1%Maximum Green (s) 27.0 27.0 27.0 27.0 27.0 27.0 31.0 31.0 13.9 13.9Yellow Time (s) 4.2 4.2 4.2 4.2 4.2 4.2 3.3 3.3 3.3 3.3All-Red Time (s) 2.1 2.1 2.1 2.1 2.1 2.1 3.1 3.1 2.8 2.8Lost Time Adjust (s) 0.0 0.0 0.0 0.0 0.0 0.0 0.0 0.0 0.0 0.0Total Lost Time (s) 6.3 6.3 6.3 6.3 6.3 6.3 6.4 6.4 6.1 6.1Lead/LagLead-Lag Optimize?Vehicle Extension (s) 3.0 3.0 3.0 3.0 3.0 3.0 3.0 3.0 3.0 3.0Recall Mode Max Max Max Max Max Max None None None NoneWalk Time (s) 7.0 7.0 7.0 7.0 7.0 7.0 7.0 7.0Flash Dont Walk (s) 20.0 20.0 20.0 20.0 20.0 20.0 24.0 24.0Pedestrian Calls (#/hr) 0 0 0 0 0 0 0 0Act Effct Green (s) 30.3 30.3 30.3 30.3 10.2 9.0 9.0Actuated g/C Ratio 0.55 0.55 0.55 0.55 0.19 0.16 0.16v/c Ratio 0.06 0.23 0.36 0.02 0.00 0.37 0.08Control Delay 9.4 8.1 9.0 0.1 0.0 22.5 0.2Queue Delay 0.0 0.0 0.0 0.0 0.0 0.0 0.0Total Delay 9.4 8.1 9.0 0.1 0.0 22.5 0.2LOS A A A A A C AApproach Delay 8.2 8.8 17.5Approach LOS A A B
Intersection SummaryArea Type: OtherCycle Length: 90.7Actuated Cycle Length: 54.6Natural Cycle: 85Control Type: Semi Act-UncoordMaximum v/c Ratio: 0.37Intersection Signal Delay: 10.2 Intersection LOS: BIntersection Capacity Utilization 40.9% ICU Level of Service AAnalysis Period (min) 15
Splits and Phases: 1: Palladium Drive & Cyclone Taylor Boulevard
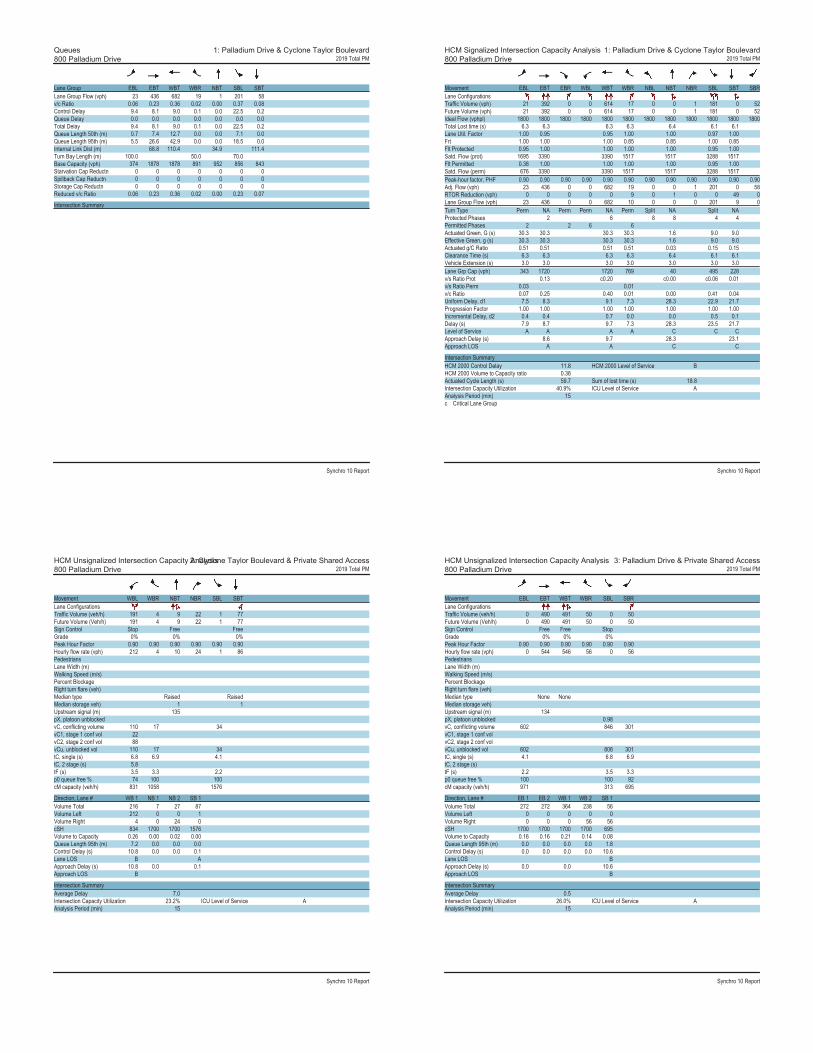
2019 Total PM
Synchro 10 Report
Lane Group EBL EBT WBT WBR NBT SBL SBTLane Group Flow (vph) 23 436 682 19 1 201 58v/c Ratio 0.06 0.23 0.36 0.02 0.00 0.37 0.08Control Delay 9.4 8.1 9.0 0.1 0.0 22.5 0.2Queue Delay 0.0 0.0 0.0 0.0 0.0 0.0 0.0Total Delay 9.4 8.1 9.0 0.1 0.0 22.5 0.2Queue Length 50th (m) 0.7 7.4 12.7 0.0 0.0 7.1 0.0Queue Length 95th (m) 5.5 26.6 42.9 0.0 0.0 18.5 0.0Internal Link Dist (m) 68.8 110.4 34.9 111.4Turn Bay Length (m) 100.0 50.0 70.0Base Capacity (vph) 374 1878 1878 891 952 856 843Starvation Cap Reductn 0 0 0 0 0 0 0Spillback Cap Reductn 0 0 0 0 0 0 0Storage Cap Reductn 0 0 0 0 0 0 0Reduced v/c Ratio 0.06 0.23 0.36 0.02 0.00 0.23 0.07
Intersection Summary
2019 Total PM
Synchro 10 Report
Movement EBL EBT EBR WBL WBT WBR NBL NBT NBR SBL SBT SBRLane ConfigurationsTraffic Volume (vph) 21 392 0 0 614 17 0 0 1 181 0 52Future Volume (vph) 21 392 0 0 614 17 0 0 1 181 0 52Ideal Flow (vphpl) 1800 1800 1800 1800 1800 1800 1800 1800 1800 1800 1800 1800Total Lost time (s) 6.3 6.3 6.3 6.3 6.4 6.1 6.1Lane Util. Factor 1.00 0.95 0.95 1.00 1.00 0.97 1.00Frt 1.00 1.00 1.00 0.85 0.85 1.00 0.85Flt Protected 0.95 1.00 1.00 1.00 1.00 0.95 1.00Satd. Flow (prot) 1695 3390 3390 1517 1517 3288 1517Flt Permitted 0.38 1.00 1.00 1.00 1.00 0.95 1.00Satd. Flow (perm) 676 3390 3390 1517 1517 3288 1517Peak-hour factor, PHF 0.90 0.90 0.90 0.90 0.90 0.90 0.90 0.90 0.90 0.90 0.90 0.90Adj. Flow (vph) 23 436 0 0 682 19 0 0 1 201 0 58RTOR Reduction (vph) 0 0 0 0 0 9 0 1 0 0 49 0Lane Group Flow (vph) 23 436 0 0 682 10 0 0 0 201 9 0Turn Type Perm NA Perm Perm NA Perm Split NA Split NAProtected Phases 2 6 8 8 4 4Permitted Phases 2 2 6 6Actuated Green, G (s) 30.3 30.3 30.3 30.3 1.6 9.0 9.0Effective Green, g (s) 30.3 30.3 30.3 30.3 1.6 9.0 9.0Actuated g/C Ratio 0.51 0.51 0.51 0.51 0.03 0.15 0.15Clearance Time (s) 6.3 6.3 6.3 6.3 6.4 6.1 6.1Vehicle Extension (s) 3.0 3.0 3.0 3.0 3.0 3.0 3.0Lane Grp Cap (vph) 343 1720 1720 769 40 495 228v/s Ratio Prot 0.13 c0.20 c0.00 c0.06 0.01v/s Ratio Perm 0.03 0.01v/c Ratio 0.07 0.25 0.40 0.01 0.00 0.41 0.04Uniform Delay, d1 7.5 8.3 9.1 7.3 28.3 22.9 21.7Progression Factor 1.00 1.00 1.00 1.00 1.00 1.00 1.00Incremental Delay, d2 0.4 0.4 0.7 0.0 0.0 0.5 0.1Delay (s) 7.9 8.7 9.7 7.3 28.3 23.5 21.7Level of Service A A A A C C CApproach Delay (s) 8.6 9.7 28.3 23.1Approach LOS A A C C
Intersection SummaryHCM 2000 Control Delay 11.8 HCM 2000 Level of Service BHCM 2000 Volume to Capacity ratio 0.38Actuated Cycle Length (s) 59.7 Sum of lost time (s) 18.8Intersection Capacity Utilization 40.9% ICU Level of Service AAnalysis Period (min) 15c Critical Lane Group
2019 Total PM
Synchro 10 Report
Movement WBL WBR NBT NBR SBL SBTLane ConfigurationsTraffic Volume (veh/h) 191 4 9 22 1 77Future Volume (Veh/h) 191 4 9 22 1 77Sign Control Stop Free FreeGrade 0% 0% 0%Peak Hour Factor 0.90 0.90 0.90 0.90 0.90 0.90Hourly flow rate (vph) 212 4 10 24 1 86PedestriansLane Width (m)Walking Speed (m/s)Percent BlockageRight turn flare (veh)Median type Raised RaisedMedian storage veh) 1 1Upstream signal (m) 135pX, platoon unblockedvC, conflicting volume 110 17 34vC1, stage 1 conf vol 22vC2, stage 2 conf vol 88vCu, unblocked vol 110 17 34tC, single (s) 6.8 6.9 4.1tC, 2 stage (s) 5.8tF (s) 3.5 3.3 2.2p0 queue free % 74 100 100cM capacity (veh/h) 831 1058 1576
Direction, Lane # WB 1 NB 1 NB 2 SB 1Volume Total 216 7 27 87Volume Left 212 0 0 1Volume Right 4 0 24 0cSH 834 1700 1700 1576Volume to Capacity 0.26 0.00 0.02 0.00Queue Length 95th (m) 7.2 0.0 0.0 0.0Control Delay (s) 10.8 0.0 0.0 0.1Lane LOS B AApproach Delay (s) 10.8 0.0 0.1Approach LOS B
Intersection SummaryAverage Delay 7.0Intersection Capacity Utilization 23.2% ICU Level of Service AAnalysis Period (min) 15
2019 Total PM
Synchro 10 Report
Movement EBL EBT WBT WBR SBL SBRLane ConfigurationsTraffic Volume (veh/h) 0 490 491 50 0 50Future Volume (Veh/h) 0 490 491 50 0 50Sign Control Free Free StopGrade 0% 0% 0%Peak Hour Factor 0.90 0.90 0.90 0.90 0.90 0.90Hourly flow rate (vph) 0 544 546 56 0 56PedestriansLane Width (m)Walking Speed (m/s)Percent BlockageRight turn flare (veh)Median type None NoneMedian storage veh)Upstream signal (m) 134pX, platoon unblocked 0.98vC, conflicting volume 602 846 301vC1, stage 1 conf volvC2, stage 2 conf volvCu, unblocked vol 602 808 301tC, single (s) 4.1 6.8 6.9tC, 2 stage (s)tF (s) 2.2 3.5 3.3p0 queue free % 100 100 92cM capacity (veh/h) 971 313 695
Direction, Lane # EB 1 EB 2 WB 1 WB 2 SB 1Volume Total 272 272 364 238 56Volume Left 0 0 0 0 0Volume Right 0 0 0 56 56cSH 1700 1700 1700 1700 695Volume to Capacity 0.16 0.16 0.21 0.14 0.08Queue Length 95th (m) 0.0 0.0 0.0 0.0 1.8Control Delay (s) 0.0 0.0 0.0 0.0 10.6Lane LOS BApproach Delay (s) 0.0 0.0 10.6Approach LOS B
Intersection SummaryAverage Delay 0.5Intersection Capacity Utilization 26.0% ICU Level of Service AAnalysis Period (min) 15

800 PALLADIUM DRIVE TRANSPORTATION IMPACT ASSESSMENT
Appendix E Intersection Performance Worksheets
May 14, 2019
E.3
2024 Ultimate Conditions

2024 Ultimate AM
Synchro 10 Report
Lane Group EBL EBT EBR WBL WBT WBR NBL NBT NBR SBL SBT SBRLane ConfigurationsTraffic Volume (vph) 51 450 0 0 296 39 0 0 0 50 0 9Future Volume (vph) 51 450 0 0 296 39 0 0 0 50 0 9Ideal Flow (vphpl) 1800 1800 1800 1800 1800 1800 1800 1800 1800 1800 1800 1800Storage Length (m) 100.0 30.0 50.0 50.0 0.0 0.0 70.0 0.0Storage Lanes 1 1 1 1 1 0 2 0Taper Length (m) 30.0 30.0 30.0 30.0Lane Util. Factor 1.00 0.95 1.00 1.00 0.95 1.00 1.00 1.00 1.00 0.97 1.00 1.00Frt 0.850 0.850Flt Protected 0.950 0.950Satd. Flow (prot) 1695 3390 1784 1784 3390 1517 1784 1784 0 3288 1517 0Flt Permitted 0.571 0.950Satd. Flow (perm) 1019 3390 1784 1784 3390 1517 1784 1784 0 3288 1517 0Right Turn on Red Yes Yes Yes YesSatd. Flow (RTOR) 114 723Link Speed (k/h) 70 70 50 50Link Distance (m) 92.8 134.4 58.9 135.4Travel Time (s) 4.8 6.9 4.2 9.7Peak Hour Factor 1.00 1.00 1.00 1.00 1.00 1.00 1.00 1.00 1.00 1.00 1.00 1.00Adj. Flow (vph) 51 450 0 0 296 39 0 0 0 50 0 9Shared Lane Traffic (%)Lane Group Flow (vph) 51 450 0 0 296 39 0 0 0 50 9 0Enter Blocked Intersection No No No No No No No No No No No NoLane Alignment Left Left Right Left Left Right Left Left Right Left Left RightMedian Width(m) 3.7 3.7 7.4 7.4Link Offset(m) 0.0 0.0 0.0 0.0Crosswalk Width(m) 1.6 1.6 1.6 1.6Two way Left Turn LaneHeadway Factor 1.06 1.06 1.06 1.06 1.06 1.06 1.06 1.06 1.06 1.06 1.06 1.06Turning Speed (k/h) 24 14 24 14 24 14 24 14Number of Detectors 1 1 1 1 1 1 1 1 0 0Detector Template LeftLeading Detector (m) 1.8 1.8 1.8 1.8 1.8 1.8 6.1 1.8 0.0 0.0Trailing Detector (m) 0.0 0.0 0.0 0.0 0.0 0.0 0.0 0.0 0.0 0.0Detector 1 Position(m) 0.0 0.0 0.0 0.0 0.0 0.0 0.0 0.0 0.0 0.0Detector 1 Size(m) 1.8 1.8 1.8 1.8 1.8 1.8 6.1 1.8 6.1 1.8Detector 1 Type Cl+Ex Cl+Ex Cl+Ex Cl+Ex Cl+Ex Cl+Ex Cl+Ex Cl+Ex Cl+Ex Cl+ExDetector 1 ChannelDetector 1 Extend (s) 0.0 0.0 0.0 0.0 0.0 0.0 0.0 0.0 0.0 0.0Detector 1 Queue (s) 0.0 0.0 0.0 0.0 0.0 0.0 0.0 0.0 0.0 0.0Detector 1 Delay (s) 0.0 0.0 0.0 0.0 0.0 0.0 0.0 0.0 0.0 0.0Turn Type Perm NA Perm Perm NA Perm Split Split NAProtected Phases 2 6 8 8 4 4Permitted Phases 2 2 6 6Detector Phase 2 2 2 6 6 6 8 8 4 4Switch PhaseMinimum Initial (s) 7.0 7.0 7.0 7.0 7.0 7.0 10.0 10.0 8.0 8.0Minimum Split (s) 33.3 33.3 33.3 33.3 33.3 33.3 37.4 37.4 14.1 14.1Total Split (s) 33.3 33.3 33.3 33.3 33.3 33.3 37.4 37.4 20.0 20.0
2024 Ultimate AM
Synchro 10 Report
Lane Group EBL EBT EBR WBL WBT WBR NBL NBT NBR SBL SBT SBRTotal Split (%) 36.7% 36.7% 36.7% 36.7% 36.7% 36.7% 41.2% 41.2% 22.1% 22.1%Maximum Green (s) 27.0 27.0 27.0 27.0 27.0 27.0 31.0 31.0 13.9 13.9Yellow Time (s) 4.2 4.2 4.2 4.2 4.2 4.2 3.3 3.3 3.3 3.3All-Red Time (s) 2.1 2.1 2.1 2.1 2.1 2.1 3.1 3.1 2.8 2.8Lost Time Adjust (s) 0.0 0.0 0.0 0.0 0.0 0.0 0.0 0.0 0.0 0.0Total Lost Time (s) 6.3 6.3 6.3 6.3 6.3 6.3 6.4 6.4 6.1 6.1Lead/LagLead-Lag Optimize?Vehicle Extension (s) 3.0 3.0 3.0 3.0 3.0 3.0 3.0 3.0 3.0 3.0Recall Mode Max Max Max Max Max Max None None None NoneWalk Time (s) 7.0 7.0 7.0 7.0 7.0 7.0 7.0 7.0Flash Dont Walk (s) 20.0 20.0 20.0 20.0 20.0 20.0 24.0 24.0Pedestrian Calls (#/hr) 0 0 0 0 0 0 0 0Act Effct Green (s) 43.0 43.0 43.0 43.0 8.1 8.1Actuated g/C Ratio 0.79 0.79 0.79 0.79 0.15 0.15v/c Ratio 0.06 0.17 0.11 0.03 0.10 0.01Control Delay 3.9 3.4 3.3 0.1 21.7 0.0Queue Delay 0.0 0.0 0.0 0.0 0.0 0.0Total Delay 3.9 3.4 3.3 0.1 21.7 0.0LOS A A A A C AApproach Delay 3.4 2.9 18.4Approach LOS A A B
Intersection SummaryArea Type: OtherCycle Length: 90.7Actuated Cycle Length: 54.5Natural Cycle: 85Control Type: Semi Act-UncoordMaximum v/c Ratio: 0.17Intersection Signal Delay: 4.2 Intersection LOS: AIntersection Capacity Utilization 41.2% ICU Level of Service AAnalysis Period (min) 60
Splits and Phases: 1: Palladium Drive & Cyclone Taylor Boulevard
2024 Ultimate AM
Synchro 10 Report
Lane Group EBL EBT WBT WBR SBL SBTLane Group Flow (vph) 51 450 296 39 50 9v/c Ratio 0.06 0.17 0.11 0.03 0.10 0.01Control Delay 3.9 3.4 3.3 0.1 21.7 0.0Queue Delay 0.0 0.0 0.0 0.0 0.0 0.0Total Delay 3.9 3.4 3.3 0.1 21.7 0.0Queue Length 50th (m) 1.5 7.6 4.7 0.0 2.4 0.0Queue Length 95th (m) 4.9 14.0 9.2 0.3 5.8 0.0Internal Link Dist (m) 68.8 110.4 111.4Turn Bay Length (m) 100.0 50.0 70.0Base Capacity (vph) 804 2676 2676 1222 849 928Starvation Cap Reductn 0 0 0 0 0 0Spillback Cap Reductn 0 0 0 0 0 0Storage Cap Reductn 0 0 0 0 0 0Reduced v/c Ratio 0.06 0.17 0.11 0.03 0.06 0.01
Intersection Summary
2024 Ultimate AM
Synchro 10 Report
Movement EBL EBT EBR WBL WBT WBR NBL NBT NBR SBL SBT SBRLane ConfigurationsTraffic Volume (vph) 51 450 0 0 296 39 0 0 0 50 0 9Future Volume (vph) 51 450 0 0 296 39 0 0 0 50 0 9Ideal Flow (vphpl) 1800 1800 1800 1800 1800 1800 1800 1800 1800 1800 1800 1800Total Lost time (s) 6.3 6.3 6.3 6.3 6.1 6.1Lane Util. Factor 1.00 0.95 0.95 1.00 0.97 1.00Frt 1.00 1.00 1.00 0.85 1.00 0.85Flt Protected 0.95 1.00 1.00 1.00 0.95 1.00Satd. Flow (prot) 1695 3390 3390 1517 3288 1517Flt Permitted 0.57 1.00 1.00 1.00 0.95 1.00Satd. Flow (perm) 1019 3390 3390 1517 3288 1517Peak-hour factor, PHF 1.00 1.00 1.00 1.00 1.00 1.00 1.00 1.00 1.00 1.00 1.00 1.00Adj. Flow (vph) 51 450 0 0 296 39 0 0 0 50 0 9RTOR Reduction (vph) 0 0 0 0 0 12 0 0 0 0 8 0Lane Group Flow (vph) 51 450 0 0 296 27 0 0 0 50 1 0Turn Type Perm NA Perm Perm NA Perm Split Split NAProtected Phases 2 6 8 8 4 4Permitted Phases 2 2 6 6Actuated Green, G (s) 40.2 40.2 40.2 40.2 4.5 4.5Effective Green, g (s) 40.2 40.2 40.2 40.2 4.5 4.5Actuated g/C Ratio 0.70 0.70 0.70 0.70 0.08 0.08Clearance Time (s) 6.3 6.3 6.3 6.3 6.1 6.1Vehicle Extension (s) 3.0 3.0 3.0 3.0 3.0 3.0Lane Grp Cap (vph) 717 2386 2386 1068 259 119v/s Ratio Prot c0.13 0.09 c0.02 0.00v/s Ratio Perm 0.05 0.02v/c Ratio 0.07 0.19 0.12 0.03 0.19 0.01Uniform Delay, d1 2.6 2.9 2.7 2.5 24.6 24.2Progression Factor 1.00 1.00 1.00 1.00 1.00 1.00Incremental Delay, d2 0.2 0.2 0.1 0.0 0.4 0.0Delay (s) 2.8 3.1 2.8 2.6 25.0 24.3Level of Service A A A A C CApproach Delay (s) 3.0 2.8 0.0 24.9Approach LOS A A A C
Intersection SummaryHCM 2000 Control Delay 4.4 HCM 2000 Level of Service AHCM 2000 Volume to Capacity ratio 0.22Actuated Cycle Length (s) 57.1 Sum of lost time (s) 18.8Intersection Capacity Utilization 41.2% ICU Level of Service AAnalysis Period (min) 60c Critical Lane Group

2024 Ultimate AM
Synchro 10 Report
Movement WBL WBR NBT NBR SBL SBTLane ConfigurationsTraffic Volume (veh/h) 37 2 72 59 5 34Future Volume (Veh/h) 37 2 72 59 5 34Sign Control Stop Free FreeGrade 0% 0% 0%Peak Hour Factor 1.00 1.00 1.00 1.00 1.00 1.00Hourly flow rate (vph) 37 2 72 59 5 34PedestriansLane Width (m)Walking Speed (m/s)Percent BlockageRight turn flare (veh)Median type Raised RaisedMedian storage veh) 1 1Upstream signal (m) 135pX, platoon unblockedvC, conflicting volume 146 66 131vC1, stage 1 conf vol 102vC2, stage 2 conf vol 44vCu, unblocked vol 146 66 131tC, single (s) 6.8 6.9 4.1tC, 2 stage (s) 5.8tF (s) 3.5 3.3 2.2p0 queue free % 95 100 100cM capacity (veh/h) 804 985 1452
Direction, Lane # WB 1 NB 1 NB 2 SB 1Volume Total 39 48 83 39Volume Left 37 0 0 5Volume Right 2 0 59 0cSH 812 1700 1700 1452Volume to Capacity 0.05 0.03 0.05 0.00Queue Length 95th (m) 1.1 0.0 0.0 0.1Control Delay (s) 9.7 0.0 0.0 1.0Lane LOS A AApproach Delay (s) 9.7 0.0 1.0Approach LOS A
Intersection SummaryAverage Delay 2.0Intersection Capacity Utilization 16.3% ICU Level of Service AAnalysis Period (min) 60
2024 Ultimate AM
Synchro 10 Report
Movement EBL EBT WBT WBR SBL SBRLane ConfigurationsTraffic Volume (veh/h) 0 438 256 240 0 12Future Volume (Veh/h) 0 438 256 240 0 12Sign Control Free Free StopGrade 0% 0% 0%Peak Hour Factor 1.00 1.00 1.00 1.00 1.00 1.00Hourly flow rate (vph) 0 438 256 240 0 12PedestriansLane Width (m)Walking Speed (m/s)Percent BlockageRight turn flare (veh)Median type None NoneMedian storage veh)Upstream signal (m) 134pX, platoon unblockedvC, conflicting volume 496 595 248vC1, stage 1 conf volvC2, stage 2 conf volvCu, unblocked vol 496 595 248tC, single (s) 4.1 6.8 6.9tC, 2 stage (s)tF (s) 2.2 3.5 3.3p0 queue free % 100 100 98cM capacity (veh/h) 1064 436 752
Direction, Lane # EB 1 EB 2 WB 1 WB 2 SB 1Volume Total 219 219 171 325 12Volume Left 0 0 0 0 0Volume Right 0 0 0 240 12cSH 1700 1700 1700 1700 752Volume to Capacity 0.13 0.13 0.10 0.19 0.02Queue Length 95th (m) 0.0 0.0 0.0 0.0 0.3Control Delay (s) 0.0 0.0 0.0 0.0 9.9Lane LOS AApproach Delay (s) 0.0 0.0 9.9Approach LOS A
Intersection SummaryAverage Delay 0.1Intersection Capacity Utilization 25.6% ICU Level of Service AAnalysis Period (min) 60
2024 Ultimate PM
Synchro 10 Report
Lane Group EBL EBT EBR WBL WBT WBR NBL NBT NBR SBL SBT SBRLane ConfigurationsTraffic Volume (vph) 21 547 0 0 803 20 0 0 1 195 0 60Future Volume (vph) 21 547 0 0 803 20 0 0 1 195 0 60Ideal Flow (vphpl) 1800 1800 1800 1800 1800 1800 1800 1800 1800 1800 1800 1800Storage Length (m) 100.0 30.0 50.0 50.0 0.0 0.0 70.0 0.0Storage Lanes 1 1 1 1 1 0 2 0Taper Length (m) 30.0 30.0 30.0 30.0Lane Util. Factor 1.00 0.95 1.00 1.00 0.95 1.00 1.00 1.00 1.00 0.97 1.00 1.00Frt 0.850 0.850 0.850Flt Protected 0.950 0.950Satd. Flow (prot) 1695 3390 1784 1784 3390 1517 1784 1517 0 3288 1517 0Flt Permitted 0.317 0.950Satd. Flow (perm) 566 3390 1784 1784 3390 1517 1784 1517 0 3288 1517 0Right Turn on Red Yes Yes Yes YesSatd. Flow (RTOR) 114 133 596Link Speed (k/h) 70 70 50 50Link Distance (m) 92.8 134.4 58.9 135.4Travel Time (s) 4.8 6.9 4.2 9.7Peak Hour Factor 1.00 1.00 1.00 1.00 1.00 1.00 1.00 1.00 1.00 1.00 1.00 1.00Adj. Flow (vph) 21 547 0 0 803 20 0 0 1 195 0 60Shared Lane Traffic (%)Lane Group Flow (vph) 21 547 0 0 803 20 0 1 0 195 60 0Enter Blocked Intersection No No No No No No No No No No No NoLane Alignment Left Left Right Left Left Right Left Left Right Left Left RightMedian Width(m) 3.7 3.7 7.4 7.4Link Offset(m) 0.0 0.0 0.0 0.0Crosswalk Width(m) 1.6 1.6 1.6 1.6Two way Left Turn LaneHeadway Factor 1.06 1.06 1.06 1.06 1.06 1.06 1.06 1.06 1.06 1.06 1.06 1.06Turning Speed (k/h) 24 14 24 14 24 14 24 14Number of Detectors 1 1 1 1 1 1 1 1 0 0Detector Template LeftLeading Detector (m) 1.8 1.8 1.8 1.8 1.8 1.8 6.1 1.8 0.0 0.0Trailing Detector (m) 0.0 0.0 0.0 0.0 0.0 0.0 0.0 0.0 0.0 0.0Detector 1 Position(m) 0.0 0.0 0.0 0.0 0.0 0.0 0.0 0.0 0.0 0.0Detector 1 Size(m) 1.8 1.8 1.8 1.8 1.8 1.8 6.1 1.8 6.1 1.8Detector 1 Type Cl+Ex Cl+Ex Cl+Ex Cl+Ex Cl+Ex Cl+Ex Cl+Ex Cl+Ex Cl+Ex Cl+ExDetector 1 ChannelDetector 1 Extend (s) 0.0 0.0 0.0 0.0 0.0 0.0 0.0 0.0 0.0 0.0Detector 1 Queue (s) 0.0 0.0 0.0 0.0 0.0 0.0 0.0 0.0 0.0 0.0Detector 1 Delay (s) 0.0 0.0 0.0 0.0 0.0 0.0 0.0 0.0 0.0 0.0Turn Type Perm NA Perm Perm NA Perm Split NA Split NAProtected Phases 2 6 8 8 4 4Permitted Phases 2 2 6 6Detector Phase 2 2 2 6 6 6 8 8 4 4Switch PhaseMinimum Initial (s) 7.0 7.0 7.0 7.0 7.0 7.0 10.0 10.0 8.0 8.0Minimum Split (s) 33.3 33.3 33.3 33.3 33.3 33.3 37.4 37.4 14.1 14.1Total Split (s) 33.3 33.3 33.3 33.3 33.3 33.3 37.4 37.4 20.0 20.0
2024 Ultimate PM
Synchro 10 Report
Lane Group EBL EBT EBR WBL WBT WBR NBL NBT NBR SBL SBT SBRTotal Split (%) 36.7% 36.7% 36.7% 36.7% 36.7% 36.7% 41.2% 41.2% 22.1% 22.1%Maximum Green (s) 27.0 27.0 27.0 27.0 27.0 27.0 31.0 31.0 13.9 13.9Yellow Time (s) 4.2 4.2 4.2 4.2 4.2 4.2 3.3 3.3 3.3 3.3All-Red Time (s) 2.1 2.1 2.1 2.1 2.1 2.1 3.1 3.1 2.8 2.8Lost Time Adjust (s) 0.0 0.0 0.0 0.0 0.0 0.0 0.0 0.0 0.0 0.0Total Lost Time (s) 6.3 6.3 6.3 6.3 6.3 6.3 6.4 6.4 6.1 6.1Lead/LagLead-Lag Optimize?Vehicle Extension (s) 3.0 3.0 3.0 3.0 3.0 3.0 3.0 3.0 3.0 3.0Recall Mode Max Max Max Max Max Max None None None NoneWalk Time (s) 7.0 7.0 7.0 7.0 7.0 7.0 7.0 7.0Flash Dont Walk (s) 20.0 20.0 20.0 20.0 20.0 20.0 24.0 24.0Pedestrian Calls (#/hr) 0 0 0 0 0 0 0 0Act Effct Green (s) 30.3 30.3 30.3 30.3 10.2 8.9 8.9Actuated g/C Ratio 0.55 0.55 0.55 0.55 0.19 0.16 0.16v/c Ratio 0.07 0.29 0.43 0.02 0.00 0.36 0.08Control Delay 9.7 8.4 9.5 0.1 0.0 22.5 0.2Queue Delay 0.0 0.0 0.0 0.0 0.0 0.0 0.0Total Delay 9.7 8.4 9.5 0.1 0.0 22.5 0.2LOS A A A A A C AApproach Delay 8.5 9.3 17.2Approach LOS A A B
Intersection SummaryArea Type: OtherCycle Length: 90.7Actuated Cycle Length: 54.6Natural Cycle: 85Control Type: Semi Act-UncoordMaximum v/c Ratio: 0.43Intersection Signal Delay: 10.2 Intersection LOS: BIntersection Capacity Utilization 46.3% ICU Level of Service AAnalysis Period (min) 60
Splits and Phases: 1: Palladium Drive & Cyclone Taylor Boulevard
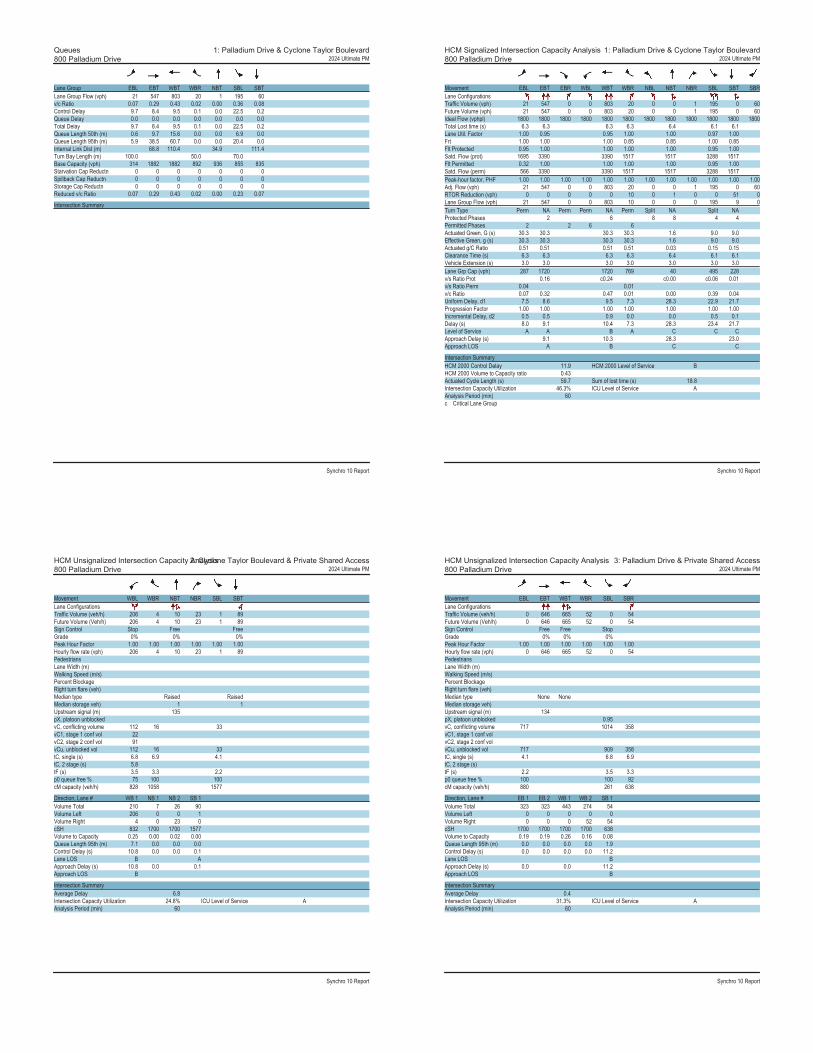
2024 Ultimate PM
Synchro 10 Report
Lane Group EBL EBT WBT WBR NBT SBL SBTLane Group Flow (vph) 21 547 803 20 1 195 60v/c Ratio 0.07 0.29 0.43 0.02 0.00 0.36 0.08Control Delay 9.7 8.4 9.5 0.1 0.0 22.5 0.2Queue Delay 0.0 0.0 0.0 0.0 0.0 0.0 0.0Total Delay 9.7 8.4 9.5 0.1 0.0 22.5 0.2Queue Length 50th (m) 0.6 9.7 15.6 0.0 0.0 6.9 0.0Queue Length 95th (m) 5.9 38.5 60.7 0.0 0.0 20.4 0.0Internal Link Dist (m) 68.8 110.4 34.9 111.4Turn Bay Length (m) 100.0 50.0 70.0Base Capacity (vph) 314 1882 1882 892 936 855 835Starvation Cap Reductn 0 0 0 0 0 0 0Spillback Cap Reductn 0 0 0 0 0 0 0Storage Cap Reductn 0 0 0 0 0 0 0Reduced v/c Ratio 0.07 0.29 0.43 0.02 0.00 0.23 0.07
Intersection Summary
2024 Ultimate PM
Synchro 10 Report
Movement EBL EBT EBR WBL WBT WBR NBL NBT NBR SBL SBT SBRLane ConfigurationsTraffic Volume (vph) 21 547 0 0 803 20 0 0 1 195 0 60Future Volume (vph) 21 547 0 0 803 20 0 0 1 195 0 60Ideal Flow (vphpl) 1800 1800 1800 1800 1800 1800 1800 1800 1800 1800 1800 1800Total Lost time (s) 6.3 6.3 6.3 6.3 6.4 6.1 6.1Lane Util. Factor 1.00 0.95 0.95 1.00 1.00 0.97 1.00Frt 1.00 1.00 1.00 0.85 0.85 1.00 0.85Flt Protected 0.95 1.00 1.00 1.00 1.00 0.95 1.00Satd. Flow (prot) 1695 3390 3390 1517 1517 3288 1517Flt Permitted 0.32 1.00 1.00 1.00 1.00 0.95 1.00Satd. Flow (perm) 566 3390 3390 1517 1517 3288 1517Peak-hour factor, PHF 1.00 1.00 1.00 1.00 1.00 1.00 1.00 1.00 1.00 1.00 1.00 1.00Adj. Flow (vph) 21 547 0 0 803 20 0 0 1 195 0 60RTOR Reduction (vph) 0 0 0 0 0 10 0 1 0 0 51 0Lane Group Flow (vph) 21 547 0 0 803 10 0 0 0 195 9 0Turn Type Perm NA Perm Perm NA Perm Split NA Split NAProtected Phases 2 6 8 8 4 4Permitted Phases 2 2 6 6Actuated Green, G (s) 30.3 30.3 30.3 30.3 1.6 9.0 9.0Effective Green, g (s) 30.3 30.3 30.3 30.3 1.6 9.0 9.0Actuated g/C Ratio 0.51 0.51 0.51 0.51 0.03 0.15 0.15Clearance Time (s) 6.3 6.3 6.3 6.3 6.4 6.1 6.1Vehicle Extension (s) 3.0 3.0 3.0 3.0 3.0 3.0 3.0Lane Grp Cap (vph) 287 1720 1720 769 40 495 228v/s Ratio Prot 0.16 c0.24 c0.00 c0.06 0.01v/s Ratio Perm 0.04 0.01v/c Ratio 0.07 0.32 0.47 0.01 0.00 0.39 0.04Uniform Delay, d1 7.5 8.6 9.5 7.3 28.3 22.9 21.7Progression Factor 1.00 1.00 1.00 1.00 1.00 1.00 1.00Incremental Delay, d2 0.5 0.5 0.9 0.0 0.0 0.5 0.1Delay (s) 8.0 9.1 10.4 7.3 28.3 23.4 21.7Level of Service A A B A C C CApproach Delay (s) 9.1 10.3 28.3 23.0Approach LOS A B C C
Intersection SummaryHCM 2000 Control Delay 11.9 HCM 2000 Level of Service BHCM 2000 Volume to Capacity ratio 0.43Actuated Cycle Length (s) 59.7 Sum of lost time (s) 18.8Intersection Capacity Utilization 46.3% ICU Level of Service AAnalysis Period (min) 60c Critical Lane Group
2024 Ultimate PM
Synchro 10 Report
Movement WBL WBR NBT NBR SBL SBTLane ConfigurationsTraffic Volume (veh/h) 206 4 10 23 1 89Future Volume (Veh/h) 206 4 10 23 1 89Sign Control Stop Free FreeGrade 0% 0% 0%Peak Hour Factor 1.00 1.00 1.00 1.00 1.00 1.00Hourly flow rate (vph) 206 4 10 23 1 89PedestriansLane Width (m)Walking Speed (m/s)Percent BlockageRight turn flare (veh)Median type Raised RaisedMedian storage veh) 1 1Upstream signal (m) 135pX, platoon unblockedvC, conflicting volume 112 16 33vC1, stage 1 conf vol 22vC2, stage 2 conf vol 91vCu, unblocked vol 112 16 33tC, single (s) 6.8 6.9 4.1tC, 2 stage (s) 5.8tF (s) 3.5 3.3 2.2p0 queue free % 75 100 100cM capacity (veh/h) 828 1058 1577
Direction, Lane # WB 1 NB 1 NB 2 SB 1Volume Total 210 7 26 90Volume Left 206 0 0 1Volume Right 4 0 23 0cSH 832 1700 1700 1577Volume to Capacity 0.25 0.00 0.02 0.00Queue Length 95th (m) 7.1 0.0 0.0 0.0Control Delay (s) 10.8 0.0 0.0 0.1Lane LOS B AApproach Delay (s) 10.8 0.0 0.1Approach LOS B
Intersection SummaryAverage Delay 6.8Intersection Capacity Utilization 24.8% ICU Level of Service AAnalysis Period (min) 60
2024 Ultimate PM
Synchro 10 Report
Movement EBL EBT WBT WBR SBL SBRLane ConfigurationsTraffic Volume (veh/h) 0 646 665 52 0 54Future Volume (Veh/h) 0 646 665 52 0 54Sign Control Free Free StopGrade 0% 0% 0%Peak Hour Factor 1.00 1.00 1.00 1.00 1.00 1.00Hourly flow rate (vph) 0 646 665 52 0 54PedestriansLane Width (m)Walking Speed (m/s)Percent BlockageRight turn flare (veh)Median type None NoneMedian storage veh)Upstream signal (m) 134pX, platoon unblocked 0.95vC, conflicting volume 717 1014 358vC1, stage 1 conf volvC2, stage 2 conf volvCu, unblocked vol 717 909 358tC, single (s) 4.1 6.8 6.9tC, 2 stage (s)tF (s) 2.2 3.5 3.3p0 queue free % 100 100 92cM capacity (veh/h) 880 261 638
Direction, Lane # EB 1 EB 2 WB 1 WB 2 SB 1Volume Total 323 323 443 274 54Volume Left 0 0 0 0 0Volume Right 0 0 0 52 54cSH 1700 1700 1700 1700 638Volume to Capacity 0.19 0.19 0.26 0.16 0.08Queue Length 95th (m) 0.0 0.0 0.0 0.0 1.9Control Delay (s) 0.0 0.0 0.0 0.0 11.2Lane LOS BApproach Delay (s) 0.0 0.0 11.2Approach LOS B
Intersection SummaryAverage Delay 0.4Intersection Capacity Utilization 31.3% ICU Level of Service AAnalysis Period (min) 60