6iiBti - NTNUcurtis/courses/PhD-PVT/PVT-HOT-Vienna-May-2016x… · 6iiBti 9 Society of Petroleum...
16
‘ , Q SPE 30576 6iiBti 9 Society of Petroleum Engineers Practical Considerations in the Analysis of Gas-Condensate Well Tests Rajagopal Raghavan, SPE, Phillips Petroleum Co., Wei-Chun Chu, SPE, Marathon Oil Co., and Jack R. Jones, SPE, Amoco Production Co. Copyright 1995, Society of Petroleum Engine8rs, Inc. This paper was prepared for presentation at the SPE Annual Technical Conference& Exhlbtion held m Dallas, U. S. A., 22-25 October, 1995. This paper was sekcled Ior presentation by an SPE Prqram Committee following rewew of information contained m an abstract sulwmfted by the autlmr(s), Contents of the paper, as ~,* ~ -NW by the S0ck4Y of Petroleum Engineers and are subjact to corredion by the author(s). The materwil, as presented, does not necessarily reflect any pwilion of the Smiefy of Petroleum Engineers, k otficers or members, Papers presented at SPE meetings are subject to publication review by Editorial Committees of the Society of Petroleum E!!g!m. .-....---.,.- .“,F, .. !-..,,-. P—en. 1.-. Iw.n” 8= r.=.l.i.+~ k -. -u...+ ..4 . ..+ —,- ~..- ?--VI ~---- ,88. .---+ ---------- “ .W a,, ~,,.,,-.,”, ,,”, ,,W - ,1, ar, - “,”., ,,,..,, -, v!,. rrlay ,,”, be C@@ WK ~b5ti~Ci %buid wfiitlin WW+)HUOW ~ekiiwikigmenr 01mere --. -.. .L -.. and by whom the paper is presented. Wrtie Librarian, SPE, P. O. Box S33S3S, Richardson, TX 750S3-3S3S, U. S.A.,fax 01-214-952-9435. ABSTRACT Several pressure buildup tests are analyzed with a view to evaluate the potential of the ideas given in the literature. A broad range of tests is examined to demonstrate the characteristics of responses in wells producing below the dew point. Methods to obtain quantitative information that is consistent for different tests are outlined. INTRODUCTION Because of the extraordinary success of the diffusivity equation in enabling us to analyze pressure A the ,.-...7-..:------- -l---:.--a 4f_. L- I~&?&~re~~l{~ ~nu L1lG WI v G1llGILGS UGl 1VW 1 ICI CII”U~l, the analysis of pressure responses subject to the influences of multiphase flow is, at best, provided only a perfunctory treatment in the literature. Single-phase flow is the paradigm in this area of reservoir engineering. The reluctance in shifting from this paradigm may be partially attributed to the perception that relative-permeability measurements are not reliable enough for us to analyze the rapid changes in pressure that occur over a very short period of time. The other principal reason is that a simple method needs to be devised to relate relative permeability to pressure, although studies have suggested procedures to address this issue. 1‘2 This paper provides information for those interested in using multiphase-flow concepts for analyzing pressure-buildup tests in wells producing gas-condensate- reservoirs. This class of tests was chosen for a number of reasons besides the fact that our rincipal interest is 2! to apply the ideas in the literature’ to field tests. We believe that only in this way can the true merit of theoretical ideas be evaluated, and more importantly, can advances be made. Furthermore, the gas- condensate system provides us with an opportunity to combine both single-phase and two-phase flow concepts. Although the emphasis is on the analysis of field tests, ‘wehave conducted a num’ber of simulations using a compositional model to evaluate plausible reasons for explanations we provide. Thus, our evaluations of these field tests have been verified by considering synthetic pressure-responses. In the following, we examine 5 tests to demonstrate important features of buildup responses in gas-condensate reservoirs. Four of these tests are in “depletion” systems and the fifth one discusses buildup tests in a pressure-maintenance project. 459
Transcript of 6iiBti - NTNUcurtis/courses/PhD-PVT/PVT-HOT-Vienna-May-2016x… · 6iiBti 9 Society of Petroleum...
‘ ,
QSPE 30576
6iiBti9
Society of Petroleum Engineers
Practical Considerations in the Analysis of Gas-Condensate Well TestsRajagopal Raghavan, SPE, Phillips Petroleum Co., Wei-Chun Chu, SPE, Marathon Oil Co.,and Jack R. Jones, SPE, Amoco Production Co.
Copyright 1995, Society of Petroleum Engine8rs, Inc.
This paper was prepared for presentation at the SPE Annual Technical Conference& Exhlbtion held m Dallas, U. S. A., 22-25 October, 1995.
This paper was sekcled Ior presentation by an SPE Prqram Committee following rewew of information contained m an abstract sulwmfted by the autlmr(s), Contents of the paper, as
~,* ~ -NW by the S0ck4Y of Petroleum Engineers and are subjact to corredion by the author(s). The materwil, as presented, does not necessarily reflect any pwilionof the Smiefy of Petroleum Engineers, k otficers or members, Papers presented at SPE meetings are subject to publication review by Editorial Committees of the Society of Petroleum
E!!g!m. . -....---.,.- .“,F, .. !-..,,-.P—en. 1.-. Iw.n” 8= r.=.l.i.+~ k -. -u...+ ..4 . ..+ —,- ~..- ?--VI ~---- ,88. .---+ ----------“ .W a,, ~,,.,,-.,”, ,,”, ,,W - ,1, ar, - “,”., ,,,..,, -, v!,. rrlay ,,”, be C@@ WK ~b5ti~Ci %buid wfiitlin WW+)HUOW ~ekiiwikigmenr 01mere--. -.. .L -..
and by whom the paper is presented. Wrtie Librarian, SPE, P. O. Box S33S3S, Richardson, TX 750S3-3S3S, U. S.A.,fax 01-214-952-9435.
ABSTRACT
Several pressure buildup tests are analyzed with aview to evaluate the potential of the ideas given in theliterature. A broad range of tests is examined todemonstrate the characteristics of responses in wellsproducing below the dew point. Methods to obtainquantitative information that is consistent for differenttests are outlined.
INTRODUCTION
Because of the extraordinary success of thediffusivity equation in enabling us to analyze pressure
Athe ,.-...7-..:------- -l---:. --a 4f_. L-I~&?&~re~~l{~~nu L1lG WI v G1llGILGS UGl 1VW 1 ICI CII”U~l,
the analysis of pressure responses subject to theinfluences of multiphase flow is, at best, provided onlya perfunctory treatment in the literature. Single-phaseflow is the paradigm in this area of reservoirengineering. The reluctance in shifting from thisparadigm may be partially attributed to the perceptionthat relative-permeability measurements are not reliableenough for us to analyze the rapid changes in pressurethat occur over a very short period of time. The otherprincipal reason is that a simple method needs to bedevised to relate relative permeability to pressure,although studies have suggested procedures to addressthis issue. 1‘2
This paper provides information for those interestedin using multiphase-flow concepts for analyzingpressure-buildup tests in wells producing gas-condensate-reservoirs. This class of tests was chosen for a numberof reasons besides the fact that our rincipal interest is
2!to apply the ideas in the literature’ to field tests. Webelieve that only in this way can the true merit oftheoretical ideas be evaluated, and more importantly,can advances be made. Furthermore, the gas-condensate system provides us with an opportunity tocombine both single-phase and two-phase flowconcepts.
Although the emphasis is on the analysis of fieldtests, ‘wehave conducted a num’ber of simulations usinga compositional model to evaluate plausible reasons forexplanations we provide. Thus, our evaluations of thesefield tests have been verified by considering syntheticpressure-responses. In the following, we examine 5tests to demonstrate important features of buildupresponses in gas-condensate reservoirs. Four of thesetests are in “depletion” systems and the fifth onediscusses buildup tests in a pressure-maintenanceproject.
459
BACKGROUND
The depletion tests we consider presume that theresults of a constant-composition-expansion (CCE) teston a representative sample are available. An equation ofstate, tuned to this sample, provides information onmolar density and viscosity. In addition, we assume thatthe appropriate relative-permeability measurements areavailable. Using this information, we proceed to analyzebuiidup tests using the concepts suggested by Joties, %70,and Raghavan. 3 Their basic ideas are summarized in the
Tka k..ll~,.~ te~t~ for th,e mr~ccllt-p.next section. 1UC UU1lUU~ p,w..v. w
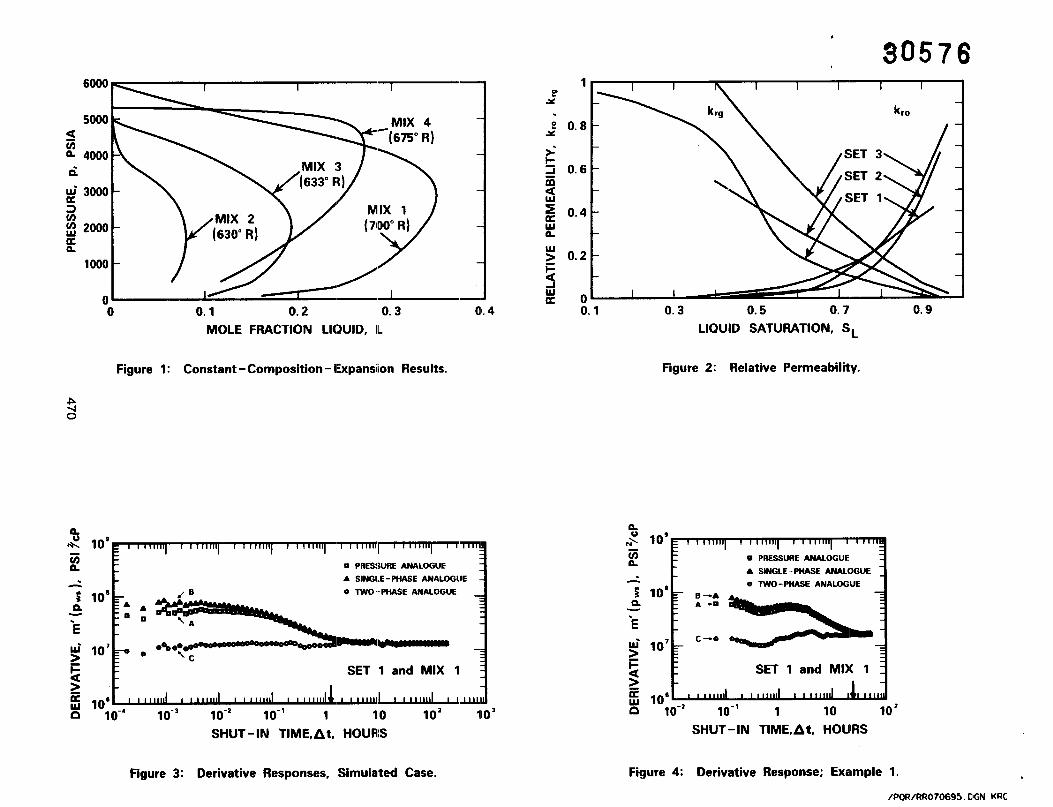
maintenance system are evaluated using the single-phaseanalogue because information on the in-situ composition(pressure-maintenance project) is unavailable to us.These tests are analyzed by the composite-reservoirformulation.4-6 Figs. 1 and 2 present the pertinent CCEand relative-permeability information used in Examples1-4. As shown in Fig. 1, we consider a wide range ofmixtures with the maximum liquid dropout in the rangeof 0.07 to 0.35. Mixtures 1, 2, and 3 are for depletionexperiments, and Mix 4 applies to the test for the well inthe pressure-maintenance project. The relative-
permeabiihy curves for Uil ad gas [~ aiid k,g) shOWfi—___
in Fig. 2 were obtained from core tests and are also usedin reservoir-simulation studies. The water saturation forSets 1,2, and 3 is, respectively, 0.115,0.400, and 0.400.Water is assumed to be immobile. Note that relative-permeability to oil is negligibly small until the liquidsaturation becomes quite large. Again, a broad range ofrelative-permeability curves is considered in this work.Table 1 presents additional reservoir properties that areneeded to analyze the buildup tests. Our primary focusin all of the following is to obtain a consistentinterpretation of muitipie buiidup tests after the weiiborepressure has fallen below the dew-point pressure.
TTT17filllTTTfl A T flnNTCTn12D A TTnMC1 rmumz I lUI-L UUINOIUEKA I IUIT u
As noted in the Introduction, we use single-phaseand two-phase analogues to analyze pressuremeasurements. Our focus will be the interpretation of
.
SPE 30576
buildup measurements. The single-phase analogue givenby
Pws
JP
m(p) = J dp,
Pwi.,Pg
(1)
is essentially identical to the analogue commonly usedfor dry-gas systems. Here, p is the molar density, p isthe viscosity, pti, ~is the pressure at the time of shut in,
p ~~ k the shut-iri pressure, atid the stibsciipt g refers t~. ---- .—-
the gas phase. This analogue takes advantage of thefih.-.~,~. fif +he fifitden..te cvctem name]v that.“ti~tiqitie~11~~~L&l UI LIIUWUL!UWI~--*W UJ U-”---, --------, ‘----,
under normal circumstances, the condensate is irmgobileover substantial portions of the reservoir. Thus, if thevariation in the relative permeability for the gas phase isnegligibly small over the region where liquid isimmobile, then this analogue should be useful wheneverthis region of the reservoir begins to influence the wellresponse. (In all of the following, we assume that wateris immobile.)
The two-phase analogue used here is given by
%, { ~
q
k)m(p) =
J
p02 + p~; dp. (2)
Pti,s1-q g
Here, ~ is the relative permeability to phase m, and thesubscript o refers to the oil phase. The key problem inusing Eq. 2 is that we need to express km and kg as a
function of pressure. In this work, we use therecommendation of Jones and Raghavanl to relate kmwith pressure:
km_ . p~pOL
krg popgv”(3)
Here L ~n~ V are the mole fractions of liquid and.-- .-,vapor, respectively, that are in equilibrium. As
recommended by Jones and Raghavan, we use the valuesof L and V obtained via the constant-composition-expansion (CCE) experiment. In terms of physicalconsiderations, this method of computing the two-phaseanalogue is best suited for those conditions wherein a
460

.
SPE 30576 R. RAGHAVAN, W. C. CHU, AND J. R JONES 3
two-phase bank with a reasonably small transition zonedevelops around the wellbore. This observation impliesthat the two-phase analogue works best when thepressure differences pi-p&W (or ~ - p&W)and p&W-pti
are large (here, p&W is the dew-point pressure). Itshould be borne in mind that, above the dew-pointpressure, the change in the value of the two analogues(w~ty.p~~ssure) is identical,
Skin factors may also be estimated by each of theabove analogues. The appropriate expression is:
rS=l ~51 m(p, .Atj
‘nAt 1-log—“i-’ + 3.2275 ,
m(4)
r;L J
...L---- — :. ●L .1--A -C +L. .a-;lfi~ .t..:,-rht l;naWIKIG 111 1s llle Muy U1 L1lG 3G11111US au al~llt llllV.
Under normal circumstances, the estimate of the skinfactor via the single-phase andoguereflects the effects
of the mechanical skin-factor and that of two-phase-flow. Consequently, this analogue provides an upperbound for the mechanical skin-factor. The two-phaseanalogue, on the other hand, will provide, asdemonstrated by Jones et al.,3 a lower bound for themechanical skin-factor. This happens because Eq. 3predicts values of ~ that are much too high and values
of~g that are much too iow and that the high values of~ usuaiiy do not compensate for die iow vaiues of Icrg.Usually, the estimate of the skin factor by this method iswithin two units of the mechanical skin-factor.2
The magnitude of the skin factor that carI beattributed to two-phase flow may be obtained by therelation
1.151p&w&_s2p ‘y
/[
%%,Pg )1po!k?+pg!kdp. (5)
-v. Pg
If the results of a CCE experiment are used, then Eq. 5will provide an upper bound for S2P.
The tests to be discussed below represent a severetest of the ideas proposed above for a number ofreasons. Most important is the fact that we examine
multirate tests that consist of flowing and shut-inperiods; that is, the wellbore pressure traverses thephase envelope a number of times. Under suchcircumstances, the phase-behavior effects around thewellbore can become rather complex. Also, the
increasing rate-sequence used in some of the testsexamined here complicates the use of Eq. 3, because thisrate schedule delays (in some cases precludes) thedevelopment of a bank of the kind under which Eq. 3works best; thus, care is needed in interpreting estimatesof the skin factor by the two-phase analogue. Computersimulations suggest that for tests with an increasing rate
sequence, the two-phase anaiogue wiii yield skin factorsthat decrease with rate. The single-phase analogue, onthe other hand, always yields increasing values of skinfactor.
In the following, for convenience, we expressnc-ldnnre.ccilre.c~....u.. ~.-..-. -. h. te~rns of conventional units
(psia2/cp), Ofien: we will compare derivative responses
not only in terms of the two analogues given above, butalso in terms of pressure. For ease of comparison,derivatives in terms of pressure are multiplied by2 pi/&Zi. Also, we shall use time transformationswhenever needed. For the depletion tests examinedhere, numerical experiments indicated that timetransformations are not important (see aiso Ref. 3j.
Figure 3 is a log-log plot of a simulated pressure-buildup response in terms of its derivative (expressed interms of Homer7 time) using three analogues. The wellhad been produced at a constant rate for 100 days at atotal rate of 10 MMSCF/d. This is the only syntheticresponse that is used in this paper and is intended toprovide a starting point for this discussion. As noted byRaghavan,l the pressure-buildup curve is a reflection ofthe pressure distribution at the instant the well is shut in.Curve A, the derivative curve in terms of pressure(Cf. dp/dint) reflects the variation in fluid properties andin the saturation (relative permeability) with distancefrom the well. Curve B is a replot of the sameinformation in terms of the single-phase analogue andmay be said to be an attempt to incorporate the variationin fluid properties with distance. The large value of the
461

4
PRACTICAL CONSIDERATIONS IN THE ANALYSIS OFGAS-CONDENSATE WELL-TESTS SPE 30576
pressure-derivative curve for small values of At (smalldistances from the wellbore) reflects the low-permeability region where liquid is present. The verticaldisplacement between Curve A and Curve B for10< At< 140 is proportional to PW@g(PW&g(PWS)].
In the single-phase reference frame, It is possible toanalyze Curve B in terms of the composite-reservoirformulation.4-6 This point will be demonstrated in
Example No. 5. Curve C is the pressure response interms of the two-phase analogue, that incorporates boththe effects of fluid properties and relative permeabilitywith distance. The values of km and k,, were related topressure by using Eq. 3 and the relat;ve permeabilitycurves are shown in Fig. 2. For this particularsimulation, the line is essentially flat because Eq. 3reproduces the saturation profiie at the instant of shut inalmost exactly. Thus, in this particular case, the sernilogstraight line exists even for pm< p&W. The arrow on thetime axis denotes the time at which pw = p&Wand thisnomenclature is used in all of the following. We haveverified this observation by comparing the profile thatresults by using Eq. 3 with the profile prevailing atAt= O. Curves B and C appear to merge beyond At = 3hours, because k,O= O and k,~ = 0.95 when pwbecomes greater than pdeW, and, under thesecircumstances, the integrands of Eqs. 1 and 2 areidentical. (Curve A appears to merge with the other twocurves because variations in fluid properties becomenegligibly small.) If the derivative curve were similar tothat of Curve C, then it is possible to compute kh fromany time range, and the skin factor so computed wouldreflect the mechanical skin-factor, provided that m(pW~)can be estimated correctly. As already mentioned, theskin factor estimated by the two-phase analogue, ingeneral, will be a lower bound for the mechanical skin-factor: For the specific case considered here, the skinfactor obtained by using the two-phase analogue is equalto -0.73 (true value = O). The single-phase analogue,on the other hand, would reflect the total (mechanicalplus two-phase-flow) skin-factor if the response curve
beyond PWS= p&W were used in the analysis. Theestimate of skin factor for this analogue in this particularcase is 18.62. An upper bound for the estimate of the
skin factor caused by two-phase-flow may be obtainedby taking the difference between the two estimates andshould equal that predicted by Eq. 5.
The added value of incorporating relative-
permeability effects should be abundantly clear fromFig. 3. For example, in the case under consideration, ifthe test were to be terminated at 5 hours either by designor by untoward circumstances, then the advantages ofusing the two-phase analogue become abundantly clear.Rather than discarding measurements under the category“unanalyzable” or to arrive at tentative conclusions
concerning estimates of permeability and skin factor, weare now in a position to make forthright statementsconcerning the variables we desire to estimate. Thisdiscussion compietes the major points we wish to makeconcerning pressure tests wherein the wellbore pressurefalls below the dew point. This preamble will permit usto understand the field tests to be discussed in thefollowing pages, particularly when measurements cannotbe interpreted unambiguously.
We emphasize that the profile of the two-phaseanalogue shown in Fig. 3 appears to be typical of manyof the field examples that we have examined. In somecases, however, it is possible that predictions of gassaturation by Eq. 3 will be low. When this happens, thederivative response for the two-phase analogue will bedifferent and this issue will be discussed in ExampleNo. 3.
RESULTS
We begin with the depletion-system cases, where wepresent a detailed explanation of the behaviors to beexpected. Example 1 is similar to that of the simulatedexample. We then proceed to the consideration of twomulti-point tests. The second of these represents a casewherein an attempt had been made to stimulate the welland the attempt had not met initial expectations.Example 4 examines a post-fracture buildup test andresults are compared with pre-fracture results. The finalexample, Example 5, explores the use of the composite-
462

. .
~pE ~0576 —----- . . . . ..-.
R. KAGHAVAN, W. ~. LHU, A~-~ .i. ~ j~N~~~- -- .
5
reservoir4-6 formulation to analyze tests in gas-condensate systems, Pressure measurements during theflowing periods were not analyzable; hence, they are notdiscussed.
Field Example No. 1. The results of this builduptest in terms of the three analogues are shown in Fig. 4.Set 1 and Mix 1 properties are used in the analysis. Thewell was produced at a rate of 24.74 MMSCF/day priorto shut in, and the flowing pressure at shut in was 3,488psia. This value is well below the dew-point pressure of5,965 psia. The characteristics of all three curves aresimilar to those in Fig. 3. Wellbore-storage effectsappear to be insignificant after about 1/2 hour. Incomrmtin~ the two-nhase ana!ome. Ea. 3 was used to––––=-.-––-=---- . r_.—L- ~—-,—x. –relate relative-permeability values to pressure. Note thatthe two-phase analogue is essentially flat for timesgreater than 1 hour. The other two analogues clearlydemonstrate that the effective-permeability-thicknessproduct increases with distance. Above the dew-pointpressure, the single- and two-phase analogues merge(note krg -0.95 for S ~ = S ~i ). The single-phase andtwo-phase anaiogues yieid kh = 735.5 md.ft; s = 5.27(single-phase), and s = -5.0 (two-phase). From theseestimates and our earlier observations, we conclude thatth.a -eh.n;m.l .IA” fo,.ta. ;. ;“ tha ..nma <n+-l <97L1lV lll&&llCUllVCU 3N11-l CLULU1 1S 111 t.llV lcUl~G ‘J. U LU T.J..& / .
From our experience in analyzing synthetic buildup tests,we expect the mechanical skin-factor to be around -3.
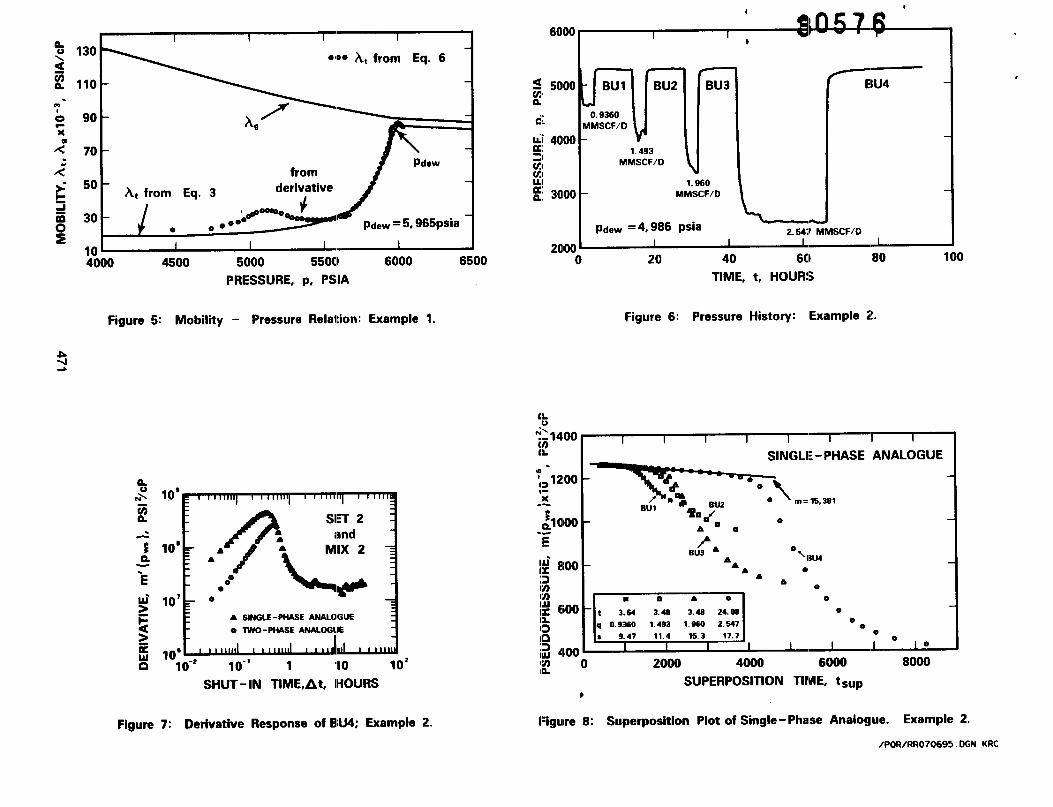
We noted earlier that our ability to use the two-phase analogue depended on its ability to reproduce thesaturation profile at At = O. Also, we have noted thatvalues of the integrand of Eq. 2 will be low, becauseEq. 3 may predict larger values for SO. Fig. 5 is a plot ofthe variation in mobility with pressure. The bottom linereflects the variation in total mobility, At (obtained fromEq. 3)with pressure, and the top line is the variation insingle-phase mobility of gas, kg, with pressure. Thecircles represent mobility values calculated by themethod given in Ref. 1. These values are obtained byusing the following expression:
at= “khdpW,/dint ‘sup
(6)
and are representative of the in-situ mobility-profile.Here, we have used a kh value of 735.5 md-ft. Thereason for obtaining a line that is essentially flat for thetwo-phase analogue becomes abundantly clear. We seethat the agreement between the circles and the line isexcellent. Because Eq. 3 appears to predict the in-situmobility-profile rather well, the derivative of the two-phase analogue is essentially flat once wellbore-storageeffects become negligibly small. We have used thiscomparison in more than one case to ensure that theproper straight line is chosen on the derivative plot forpm < p&W. Incidently, this example is an excellentverification of Raghavan’s thesis - the saturation profileat At = O governs the buildup response. (It isu.nfortu.nate that it is not possib!e to obtain a reasonable
estimate of at in the immediate vicinity of the wellborefor it would have been possible to get a better estimateof the mechanical skin-factor.)
The profiles shown in Fig. 5 represent the bestagreements we have been able to obtain between valuespredicted by Eqs. 3 and 6. In many cases, the profilepredicted by Eq. 3 wiii faii ‘3ei0w that predicted by Eq. 6(because Eq. 3 predicts low values of Sg), and thisphenomenon can cause some distortions (this behavior;. a“rIfia*kmtaAh., ●ha “-+.1.- -f +ha 1-* 1-* .nolal +hntm GAabGl uawu uy LUG uauu- U1 LUG Iu~-iu~ awuG) uiaL
must be handled with some care. This point is furtherdiscussed in Example No. 4.
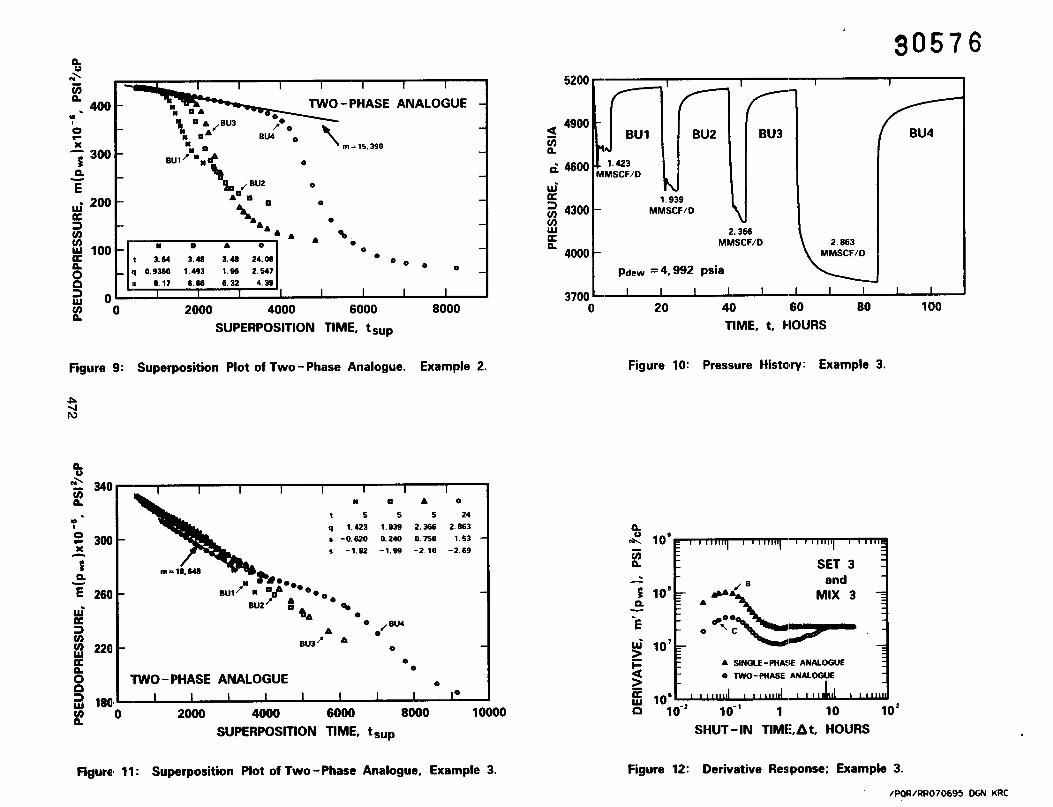
Field Example No. 2. This example consists of asequence of four drawdown and four buildup tests asshown in Fig. 6. The initial pressure was 5,378 psia andthe dew-point pressure at the initial composition is 4,986psia; that is, the wellbore pressure fell below the dew-point pressure prior to each buildup period. The testsequence, an increasing rate-sequence, consisted of(total) production rates of 0.9360, 1.493, 1.960, and2.547 MMSCF/d. Figure 7 presents the derivativeresponse for the 4th buildup period in terms of thesingle- and two-phase analogues. Mix 2 and Set 2curves were used in the analysis. Early-time responsesare governed by wellbore-storage effects and theconventional, semilog straight-line becomes evident afterAt > 5 hours. As expected, responses for both
463

PRACTICAL CONSIDERATIONS IN THE ANALYSIS OF6 GAS-CONDENSATE WELL-TESTS SPE 30576
analogues merge when pW~becomes greater than p&W.At eadier times, tine two-phase anaiogue falls belo-w the
------ .L.- :-+.-.-.-.-A AfG” ‘1 ;C@k-@iS~ ~d~~~~ b&dUX W lllLG& CUIU U. Lq. 210
smaller than that of Eq. 1. Buildup responses for all 4buildup periods for each analogue are shown in Figures8 and 9, respectively. For each analogue, the buildupresponses merge when shut-in times are long enough.The permeability-thickness product, kh, for this test is67.12 md-ft. This estimate of kh is also in agreementwith an earlier test. Either analogue yields the sameresult. Because all curves in Figures 8 and 9 merge (andalso extrapolate to essentially the initial-reservoirpressure), we may conclude that depletion has “kennegligibly small.
Estimates of the skin factors for each of theanalogues are noted on the appropriate figure. For thesingle-phase analogue, as expected, the total skin factorincreases because of the increasing rate-schedule. Thisincrease may not be attributed to non-Darcy flow. Useof the two-phase analogue results in a decreasing skinfactor with an increase in rate because this rate scheduleprecludes the formation of a stabilized bank of fluid.
As mentioned earlier, Eq. 3 works best when thedifferences between pi - p&Wand p&W- pw are large.Numerical simulations confirm our observation that forthe increasing rate-sequences shown here, the two-phaseanaiogue wtil yieici sicin-fmtor eslimium ~imiiai- to that---------
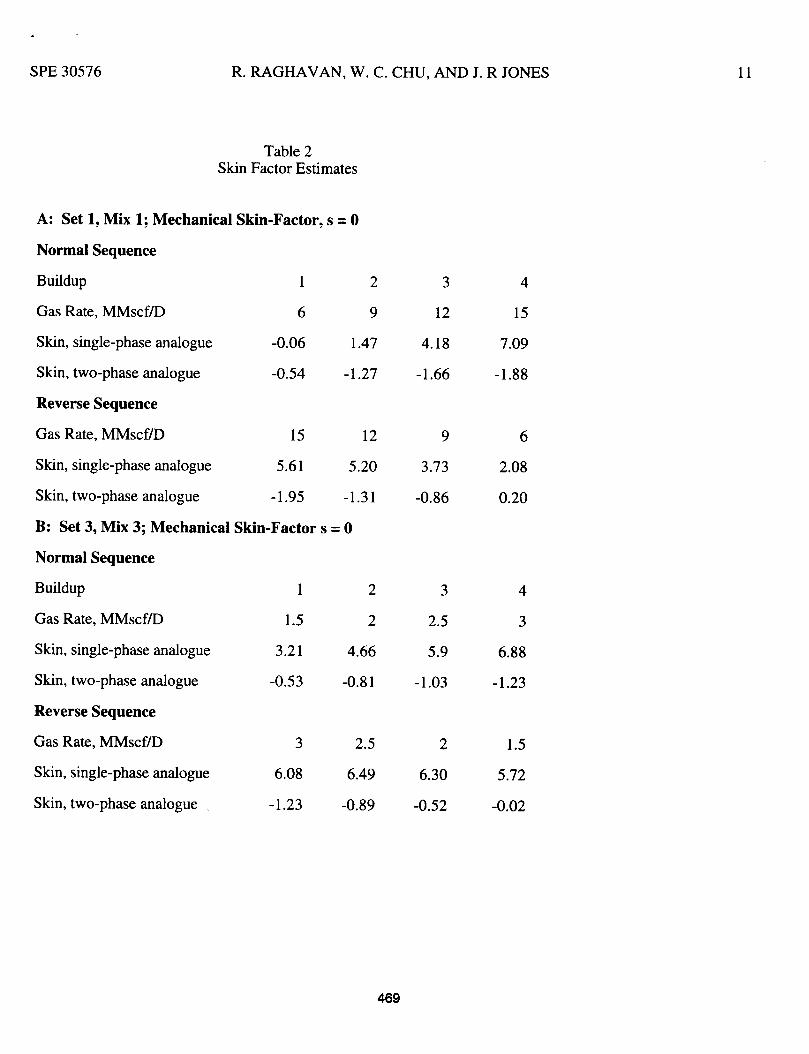
shown in Fig. 9. We have also examined syntheticbuildup responses for decreasing sequences of rates andfound that the estimates of skin factor obtained via thisanalogue would be a better representation of themechanical skin-factor. This happens because thedecreasing rate-sequence permits the development of abank wherein both gas and oil are mobile (and thetransition zone between this bank and the single-phasezone is small). The above observation is illustrated inTable 2, where we consider the results of two synthetictests. As in Example 2 (also Example 3), each caseconsists of 4 flowing periods with each flowing periodfollowed by a buildup period. Case A uses properties ofExample 1, a high-permeability reservoir. For the
normal sequence tests, we see that skin-factor estimates~-- -“.- .Ah .~t= (cinole-nhace ana]omle) and &C~eUSeL~tC~LX.4JC WIL1l lULW \.M!.&w y.....”- ------ ~--.
\\7~~~ ~~t~ (~w~-~~~~~ ~n~jQ~Ue). These results are
consistent with the results of the tests in Example 2. Forthe reverse-sequence tests, however, the analysis of thebuildup tests indicates that skin-factor estimatesdecrease with rate (single-phase analogue) and increasewith rate (two-phase analogue). Similar results areobtained in Case B; the properties used in this simulationare the same as those of Example 3.
Returning to Example 2, based on many simulations,, . . .l..-:_- .L-. ●L. G..otL.,.l A,.mtactwe are lea [0 die comwmm UIdL Llle III 31Uuhuup LQOL
will provide the best estimate of the mechanical skin-factor. Thus, we conclude that the mechanical skin-factor is in the range 8.17 es <9.47.
Field Example No. 3. Again, we consider amultiple-rate test that consists of 4 drawdown and 4buildup periods. The pressure at the start of the test is5,243 psia and the dewpoint pressure is 4,992 psia. Asshown in Fig. 10, in this case also, the test sequence isan increasing rate-sequence with production rates of1.423, 1.939,2.366, and 2.863 MMhCFld. Figure i i is
__-m
the ‘Horner plot’ for all 4 buildup periods. From theslopes of the straight lines, we obtain kh to be 56.18md-fi. The estimates of the skin factor from the single-and twe-phase analogues are noted in Fig. 11. Again,
1“ s.fitfi. ~.+:ti.t~. (I;ne ‘1) nhtnind @ t& cinuk-SKiii-la~wl wLmlatwO ~IAUW ~, “U.U...W= . . - -...= .-
phase analogue increase with rate, and the estimates(line 4) obtained by the two-phase analogue decreasewith rate. The reasons for these results have beenexplained previously. From the table in Fig. 11, and ourprevious discussion, we conclude that the mechanicalskin-factor is approximately -0.6. Thus far, our analysishas been straightforward.
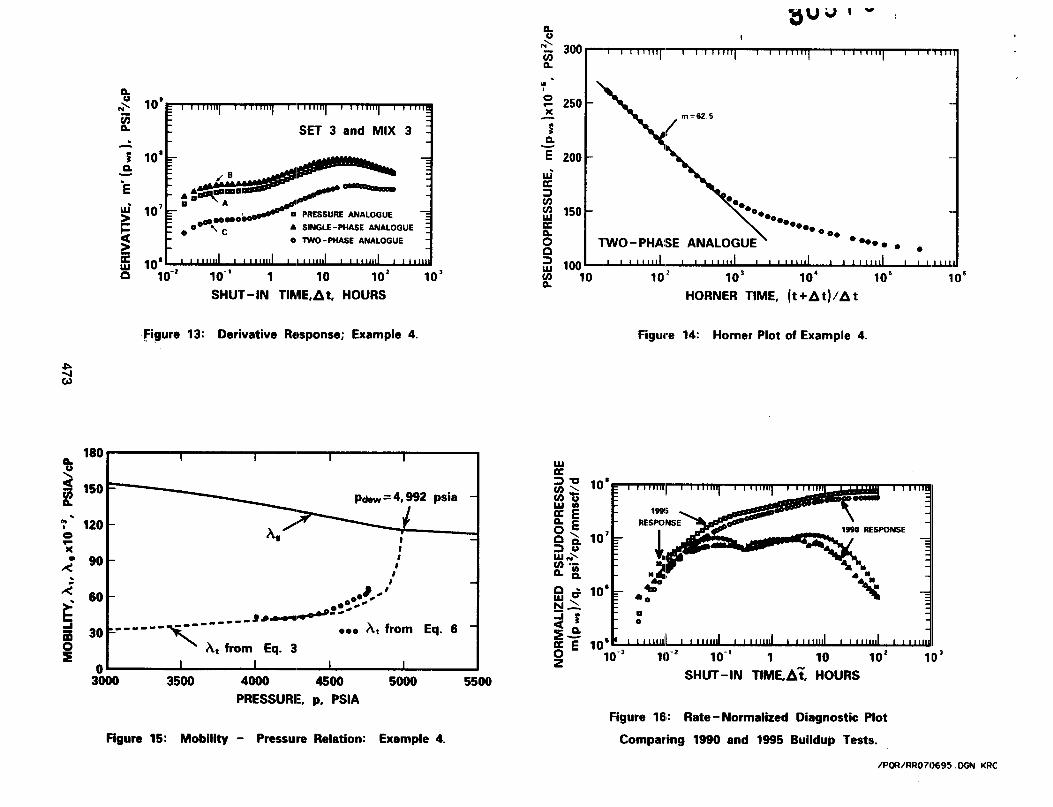
We now point out an important characteristic of thetwo-phase analogue. Fig. 12 is a plot of the derivativeresponses for Buildup No. 4. Early-time responses arecontrolled by the wellbore-storage phenomenon. If weexamine the two-phase analogue, we see that this curve,rather than stabilizing immediately after the hump,
464

SPE30576 R.RAGHAVAN,W. C.CHU,ANDJ.R JONES 7
shows anupward trend beginning at around 1 hour. Theupward trend is a reflection of the fact that Eq. 3underpredicts the value at with pressure. One may notconstrue the upward trend to represent reservoirbehavior, for example, a sealing fault. In this context,we should note that no such trend is seen on the trace ofthe single-phase analogue. If we compute ~[ from Eq. 6in the pressure range 4000 e p < 5000, we find thatEq. 3 predicts values of at that are lower than thatpredicted by Eq. 6.
Field Example No. 4. We examine a buildup testfollowing a fracture treatment. One of the objectives inpresenting this exampie is to demonstrate the advantagesof using the two-phase analogue. Curve A in Fig. 13 isthe derivative response in terms of pressure. Curves B& C are the derivative responses in terms of the single-and two-phase analogues, respectively. Mix 3 and Set3 information is used in the analysis. At the time thetest was terminated, the shut-in pressure was less than
pde~ (4,992 psia). Thus, we do not expect the Single-
phase analogue to provide information regardingformation permeability and skin factor. The two-phaseanalogue, however, appears to flatten out after 90 hours(Cf. Fig. 3). A Horner plot of this response is shown inFig. 14. Calculations using the slope of the straight lineshown in Fig. i4 yieici kh = 38. i8 mci-ft and s = -4.56.This estimate of kh is in agreement with that of the pre-fracture buildup test (kh = 38.5 md-ft). We alsocomputed kt from the pressure-derivative curve in thetime range At > 100 hours (Eq. 6) and obtainedexcellent agreement with the ~[ values used to calculatethe two-phase analogue in this pressure range (Fig. 15shows the agreement in this pressure range).
For reasons already noted, the mechanical skin-factor would be greater than -4.56. This result suggeststhat the frac-job was indeed successfid, although it is notpossible to get a definite estimate of the mechanicalskin-factor. (Estimates of skin factor from the pre-fracture test were s = 20.21 and s = 3.26 from thesingle- and two-phase analogues, respectively.)
Field Example No. 5. The well considered here isa downdip producer in a rich-gas-condensate reservoir(> 200 BBL/MMscfD initial yield; see Mix 4 of Fig. 1).The productive horizon has an average permeability inthe 1-5 md range. The reservoir was on full-pressuremaintenance until recently. In 1994, a blowdown pilotin the area of this well was initiated. Becausebreakthrough of the injected gas was observed early inthe life of the pressure-maintenance project and arealand vertical sweep have remained open questions, it isvery difficult to determine the effective composition ofthe in-situ fluids and the effective dewpoint pressuresassociated with this well at the time of these tests.Nevertheless some usefui conclusions can be reached.
Figure 16 is a log-log diagnostic plot of twopressure-buildup tests from this well. Both responsesare plotted in terms of the rate-normalized change insingle-phase-analogue and the log-time derivative of thisfunction versus single-phase-gas pseudotime. Gasproperties used in the calculation of pseudopressure andpseudotime8 are determined from recombined samplesobtained immediately prior to each test. The circles andtriangles represent these functions for a buildup testperformed in late 1990 prior to the blowdown pilot.The squares and asterisks represent similar informationfor a buiidup test pdorrned in early 1995 after thebeginning of the blowdown pilot.
Because the composite-reservoir model assumes asharp interface, in using this model for the problemunder consideration, one must devise a methodology tohandle the saturation gradient in the reservoir.Obviously, many approaches may be taken. Thus, in thefollowing, we first outline the basis used to discern theappropriateness of the model. Second, we outline thephilosophy to obtain a value for the “radius of the zoneof reduced permeabilityy“ and then demonstrate how ourconcept is applied.
This plot has four main features indicating darnagecaused by condensate accumulation. First, the
8PRACTICAL CONSIDERATIONS IN THE ANALYSIS OF
GAS-CONDENSATE WELL-TESTS SPE 30576
permeability followed by a transition zone which appearsto be trending toward defining an outer region of greaterpermeability. Second, the near-well permeability-levelindicated by the intermediate-time derivative shapesremains approximately constant between the 1990 and1995 tests. Third, the time at which the derivativebegins to decrease away from the near-well valueincreases between the 1990 and 1995 test indicating anincreased radius for the near-well region of lowerpermeability. Finally, the level of the rate-normalizedchange in pseudopressure increases between the twotests implying an increase in skin factor after thebeginning of the blowdown pilot. Indeed, sernilogstraight lines fitted through the ends of these tests yieldconsistent values of reservoir permeability ( k = 1.177md) and skin factors of 37.8 and 52.6, respectively.
To quantify these qualitative observations, both ofthese tests have been history matched using composite-
4-6 Figures 17 and 18 show the matchessystem models.of the 1990 and 1995 buildup tests, respectively. Notethat in these two figures rate normalization has not beenused. These matches have been made by fixing theouter-zone permeability at 1.177 md and adjusting theinner-zone permeability and radius to obtain a match.TL _ L---- .-_ l.._ r-- .L _ -- 2:..- -4? .I_- :——-– —–—- -----1 IIC UCSL VWL.K Lur LIE rdulus ul me mrwr zone wasdetermined by ensuring that the model predictedderivative entered the transition period at the same timeas the derivative of the measured responses. Deviationsbetween predicted and measured derivatives after thistime were not considered and are due mainly to thedtierence between the composite-system model and theactual mobility distribution in the reservoir. The matchof the 1990 test includes phase-redistribution effectswhich allow the model responses to follow closely thederivative response up to the beginning of thetransitional period. The 1995 response does not warrantthe use of this extra complication.
As the match results on these two figures show, therIII~litnti~~~Pnnnl IIcinnc r.aar.hd nhnwp nr~ nnnfimndquw..u.,vu -“,, ULL4CY,”’,. AWak,auu u“” v w buu WVafi.aaaalwu
quantitatively. The radius of the inner zone increasesfrom 45 ft in 1990 to 57.5 ft in 1995 while the
permeability of the inner zone has only changed slightlyif at all. The zone has grown in size after the beginningof the blowdown period probably because of localdepletion.
CONCLUDING REMARKS
We began this work primarily because there is adearth of information pertaining to the analysis ofpressure-buildup tests under multiphase-flow conditions.We believed it would be worthwhile to documentdifferent behaviors that may be expected and outlineprocedures to understand these behaviors. The
objectives have been met by evaluating the shapes ofpressure-buildup traces for a wide variety of conditionsand showing that it is possible to arrive at a consistentinterpretation of buildup responses under multiphase-flow conditions. This is the first, serious study thatattempts to combine relative-permeability measurementswith pressure measurements. The advantages anddisadvantages of using various analogues are exploredthoroughly. The conclusions we detail and the plausibleexplanations we provide for various tests have beenverified by considering synthetic responses to mimic thepertinent test under consideration. Because of the ratherL--c_l -.. _l —-—-—-1 —=A..—- -r Al-:- -... 4-. ---- --.:11 —-Amodu anu gtmcrd ndums 01 mm smuy, we wm nuldocument specific conclusions except to note thefollowing: (i) it is possible to relate relative-permeabilityvalues to pressure and use the resulting analogue toevaluate pressure-buildup tests in a quantitative manner,and (ii) the saturation profile at shut in governs theshape of the pressure buildup trace and the success ofthe two-phase analogue is dependent on our ability toestimate this profile. This paper outlines a practicalmethod to compute the profile.
NOMENCLATURE
*–Acl *- —- —---–: L:l:. –. . ..?-
LULdl cumpressmmcy, psl 1formation thickness, ftwrm-~h;l;t~? rnA~LULUUULLILJ , LILU
relative permeabilitymoles of liquid
466
~PE30576
ni =
m(p) =
P=pd~~ =pw,f,~ =
Pws =% =r=
rW =s =
S’2P =s =
t =
:=At =T=v=z=
nA:
P =
$=
Subscripts
g =
i=m=o =
s=w=
R. RAGHAVAN, W. C. CHU, AND J. R JONES 9
.l -—_ -47.L_ -_ —: 1-- -.--:-L. l;-_SIU~ Ul UK SWlllU~ SLI”tU~I1l-llIIC, ti~~ kd
slopepseudopressure, psia21cppressure, psiadew-point pressure, psiawellbore pressure at shut-in, psia
shut-in pressure, psiatotal molar rate, lb mol/Dradius, ftwellbore radius, ftestimate skin factor from Horner analysistwo-phase skin factorsaturationtime, hours or dayspseudotime, hours, daysshut-in time, hours or daystemperature, 0Rmoles of vapordeviation factordiffusivity, ft2/hrmobility, psia/cpfluid viscosity, cpmolar density, lbm mol/ft3porosity
gasinitialoil or gasoil phaseskinwater
Superscripts
= derivative
ACKNOWLEDGEMENTS
We thank the managements of Phillips Petroleum,Marathon Oil and Amoco Production for permission topresent this paper. We also thank Ms. K. Patton fortyping this paper. We thank Messrs. R. D. Barree,J. L. Jechura, and G. L. Lane for assisting us in
-l_. _:-:-- 1-,..:- :-c-.—,..:-- ---,1-,L 6- ,.,.-..1-+- +L.:nUUldlIllI1/j LMSIU lIllUIIlltLLIUIl llt2GUGU lU UJlll~lGLG LILl>
study and Messrs. J. R. Gilman and J. R. Jargon forassistance with numerical experiments to obtainsynthetic buildup-tests.
1.
2,
3.
4.
5.
6.
7.
8.
REFERENCES
Raghavan, R.: “Well Test Analysis: WellsProducing by Solution Gas Drive,” SPEJ (Aug.1976) 196-208; Trans. AIME, 261.
Jones, J.R. and Raghavan, R.: “Interpretation ofFlowing Well Responses in Gas-Condensate Wells,:SPEFE (Sept. 1988) 578-94.
Jones, J.R., Vo, D. T., and Raghavan, R.:“Interpretation of Pressure Buildup Responses inGas-condensate Wel!s,” SPEFE (March 1989) 93-
104.
Jaeger, J. C.: “Heat Conduction in CompositeCircular Cylinders,” Philosophical Magazine 32 No.
7 (1941) 324-335.
Albert, P., Jaisson, J., and Marion, H.: “Etute de L‘Ecoulement Radial Circulaire Dans Un MilieuFerrn6 Het6rog~ne,” Revue de L’Institut Francais duP&trole 14 (April-May 1959) 560-588.
Loucks, T. L. and Guerrero, E. T.: “Pressure Dropin a Composite Reservoir,” SPEJ (Sept. 1961) 170-76.
Horner, D. R.: “Pressure Build-up in Wells,” Proc.,Third World Pet. Cong., The Hague (1951) II, 503-21.
Agarwal, R. G.: “Real Gas Pseudo-Time - A NewFunction for Pressure Buildup Analysis of GasWells,” Paper SPE 8279, presented at the AnnualFall Technical Conference and Exhibition,Las Vegas, Nevada (1979).
467

10
Example
Condensate Yield,bbl/MMs
Thiclmecc h ft- . ..=. U. W””. . . . . .
Porosity, @
Initial Pressure, pi>psia
Dew-pointpressure, p~eW,psia
Temperature, “F
PRACTICAL CONSIDERATIONS IN THE ANALYSIS OFGAS-CONDENSATE WELL-TESTS SPE 30576
Table 1Formation Properties
1* 2 3 4 5
180 115 185 165 200
~Q~ 2A ~? Al f5p9
0.123 0.082 0.104 0.104 0.110
6,700 5,378 5,243 5,686 5,700
5,965 4,986 4,992 4,992 5,310
240 170 173 173 215
* Simulated Example uses properties of Example 1.
.
SPE30576 R. RAGHAVAN, W, C. CHU, AND J. R JONES 11
Table 2Skin Factor Estimates
A: Setl, Mixl; Mechanical Skin-Factor9s=0
Normal Sequence
Buildup 1 2
Gas Rate, MMscf/D 6 9
Skin, single-phase analogue -0.06 1.47
Skin, two-phase analogue -0.54 -1.27
Reverse Sequence
Gas Rate, M“Mscf/D 15 12
Skin, single-phase analogue 5.61 5.20
Skin, two-phase analogue -1.95 -1.31
B: Set 3, Mix 3; Mechanical Skin-Factors= O
Normal Sequence
Buildup 1 2
Gas Rate, MMscf/D 1.5 2
Skin, single-phase analogue 3.21 4.66
Skin, two-phase analogue -0.53 -0.81
Reverse Sequence
Gas Rate, MMscf/D 3 2.5
Skin, single-phase analogue 6.08 6.49
Skin, two-phase analogue . -1.23 -0.89
3
12
4.18
-1.66
9
3.73
-0.86
3
2.5
5.9
-1.03
2
6.30
-0.52
4
15
7.09
-1.88
6
2.08
0.20
4
3
6.88
-1.23
1.5
5.72
-0.02
469
.
305766000
5000az~ 40006
3000-
2000 -
1000 -
0 I ~<—~..‘o 0.1 0.2 0.3 a).4
MOLE FRACTION LI(3UID, IL
Figure 1: Constant - Composition - Expansion Results.
n< 109 1 I 111111 1 1111111I t 111111I {~~~”qzn E PRES!WRE ANALOGUE
. A SINGLE - PHASE ANALOGLJE
j 10’0 TWO - PHASE ANALOGUE _.
~ : %:+
‘E
$’ 107 * ,~o o%~ b ~~ _-
i=a
SET 1 and MIX 1
>zw 10’ 1 4118111 t I 111111 1 1111111 1 11LLullL~~#a ,.-. ,.-3 ,.-2 ,.-1
1 10 102 1103SHUT- IN TIME,At, HOURS
k,,y 1
LIQUID SATURATION, SL
Figure 2: Relative Permeability.
n
“!‘0’F’-12E=n
>Ew 106 , UllllLklt I 111111 1 1111111
n 10-2 10-’ 1 10 102
SHUT- IN TIME, At, HOUIRS
Figure 3: Derivative Responses, simulated Case. Figure 4: Derivative Response; Examp)le 1. .
/PoR/RR070S95 MN I(RC
*
130
110
90
70
50
30
ii)oo 4500 5000 5500
PRESSURE, p, PSIA
Figure 5: Mobility - Pressure RelalLiOn:
6000 6500
Example 1.
a> LA I,,,,, d d
e) TWO- PHASE ANALOGUE
~ ,.s
a 10-’ 10-’ 1 10 102SHUT- IN TIME,At, IHOURS
Figure 7: Derivative Response of W4; Example 2.
a
GI&,
OL
50,(30
Pv
BUII BU2 BU3
0.9360MMSCF/[)
401001.493
MMSCFKI
t
1.9s03000 MMSCF/D
pdew =48986 psia
ENJ4
2.54/ MMISCF/D.~——~-20,mL~
0 20 40 6CI 80 100
TIME, t, HOUR!5
Figure 6: Pressure History: Example ~!.
...tL
t
SINGLE - P’HASE ANALOGLJE.
:= 12!001P* ‘-s..15,3)1.- Bul
% yJI a)oo e.- ‘OO 1
L.BU3 A
aA*Y
800IBU4
AA o
A
600 El&l,
0
0 0
0
2.547 0e
17.7
MM)~—-~ 0 I 0 1
0 2000 6000 8000
SUPERPOSITION TIME, t supb
lFigulre 8: Superposition Plot of Single- Phalse Analqlue. Example 2.
/POR/RR070S95 OGN KRC
30157n
‘Ui&_sii, ‘:””:”,01g -0 2000 4000 6000 8000
SUPERPOSITION TIME, t sup
Figuwe 9: Superposition Plot of Two-Phase) Analogue. Example 2.
-~~~L u ❑ A o
t 5 5 5 24
‘k
q 1.423 1.93e 2.266 2.363
s -0.620 0.240 0.750 1.53
L s-1.62-1.9e -,2.10 -2.69
4A-%
o
A 0 / ‘u’
eu3 p A o0
0
IWO - PHASE ANALOGUE o
2000 4000 6000 8000 10000
SUPERPOSITION TIME, tsup
Figure! 11: Superposition Plot of Two- Phiase Analogue,, Example 3.
‘-LI’L’ ‘~ 4900
Gn
IIJ
J< 4600 1.423
MMSCF/D
g’
\
/
BU3
u
~ 4300
[
1.939MMSCFIO
~
a2. 36s
MMSCF/Dn 4000 \ MMSCF/D
. 2. 3s3
I Pdew =4,992 Psia
/--BU41
37000L~~—20 40 60 80 100
TIME, t, HOURS
Figure 10: Pressure Histolry: Example 3.
A
- LJ
and2 10’
n A
‘E L
y’ 107
o:;<;
i= A SINGLE - PHASE ANA3.OGUE
a>
0 3W0 - PHASE ANMOGUE
Ew 106n 10-2 10-’ 1 10 102
SHUT-IN TIME, At, HOURS
Figure 12: Derivative Response; Example 3.
/POR/RR070695 DGN KRC
&
~: 10’zn SET 3 and MIX 3.
z ‘0” : .:@%#%s@@~‘E
g’ 10’ ~m, ~e:m.d ‘RESSURE‘NAL.G.EF o Kc A SINGLE - PHASE ANALOGUE
a~
O TWO-PNA,,ANA,OG,IE
R 10°1 1111111 1 t 11111111 #I11111I 11411111 1IIU
n ,.-210-’ 1 10 102 103
SHUT-IN TIME,At, HOURS
Figure 13: Derivative Rwsponse; Example 4.
:
4. 60 -Ooofe.;
EOoao
z . ..-” -”--~ ~~+--30 L
------\
000 A, from Eq. 6
$sn
At from Eq. 3I 1 1 I
3“m 3500 4000 4500 5000 5500
PRESSURE, p, PSIA
Figure 15: Mobility - Presswa Relation: Example 4.
\
\
%00
000000000
000ANALOGUE ●00.. ●
●lWO - PHASE
102 103 104
HORNER TIME, (t +At)/A t
Figure 114: Horner Plot of Example 4.
10’
10”
c~:’
F
1W5 \RE!WWNSE /@
10’1$
1960 RESPONSE
44
d,yn”
II
10’ .$= k
mo
105 L10-3 10-2 10-’ 1 10 102 103
ISHUT-IN TIME,A?, HOURS
Figure 161: lRate - Normalized Diagnostic Plot
Comparing 1990 and 1965 Buildup Tests.
1106
/PU?/RR070695 OGN KRC

4
#80576
I
; 106 1 1 111111 I 1 111111 1 I 111111 1 1 111111I 1 111111 1 1 II
I 10-3 10-’ 10-’ 1 10 102,.3
gSHUT - IN TIME,A~, HOURS
Figure 17: Composite - System Match of 1990 Test.
.P-Js
&~ 106L ~~ ‘ “’’;:,’ ““~o,w 10”3 10-’ 10-’ 1 10g
SHUT - IN TllME,A~, HIOURS
Figure 18: Composite - Sysl[em Match of 1995 Test.
/POR/RR070695 C@ KRC