6.4.7 Advice June 2013 ECOREGION North Sea STOCK Haddock ... Reports/Advice/2013/2013/had-34.pdf ·...
13
ICES Advice 2013 Book 6 1 6.4.7 Advice June 2013 ECOREGION North Sea STOCK Haddock in Subarea IV (North Sea) and Division IIIa West (Skagerrak) Advice for 2014 ICES advises on the basis of the EU–Norway management plan that the TAC (Human Consumption landings) should be no more than 40 639 tonnes in 2014. If rates of discards and industrial bycatch do not change from the average of the last 3 years (2010–2012), this implies catches of no more than 45 318 tonnes. Stock status F (Fishing Mortality) 2010 2011 2012 MSY (F MSY ) Appropriate Precautionary approach (F pa ,F lim ) Harvested sustainably Management plan (F MP ) Below target SSB (Spawning-Stock Biomass) 2011 2012 2013 MSY (B trigger ) Above trigger Precautionary approach (B pa ,B lim ) Full reproductive capacity Management plan (SSB MP ) Above trigger Figure 6.4.7.1 Haddock in Subarea IV (North Sea) and Division IIIa West (Skagerrak). Summary of stock assessment (weights in thousand tonnes), Estimates are shaded. Top right: SSB and F over the time-series used in the assessment. Fishing mortality has been below F pa and around the F MSY proxy and SSB has been above MSY B trigger since 2001. Recruitment is characterized by occasional large year classes, the last of which was the strong 1999 year class. Apart from the 2005 and 2009 year classes which are about average, recent recruitment has been poor. Management plans A management plan was agreed by EU and Norway in 2008 (see Annex 6.4.7). ICES has evaluated the plan and concludes that it can be accepted as precautionary. 0 100 200 300 400 1963 1973 1983 1993 2003 Recruitment in billions Recruitment (age 0) 0 200 400 600 800 1000 1963 1968 1973 1978 1983 1988 1993 1998 2003 2008 2013 SSB in 1000 t Spawning Stock Biomass Blim Bpa MSYBtrigger 0 100 200 300 400 500 600 700 800 900 1000 0.0 0.5 1.0 SSB in 1000 t Fishing Mortality (ages 2-4) 2012 0.0 0.2 0.4 0.6 0.8 1.0 1.2 1.4 1963 1968 1973 1978 1983 1988 1993 1998 2003 2008 F(ages 2-4) Fishing Mortality Flim Fpa FMSY
Transcript of 6.4.7 Advice June 2013 ECOREGION North Sea STOCK Haddock ... Reports/Advice/2013/2013/had-34.pdf ·...
ICES Advice 2013 Book 6 1
6.4.7 Advice June 2013 ECOREGION North Sea STOCK Haddock in Subarea IV (North Sea) and Division IIIa West (Skagerrak)
Advice for 2014 ICES advises on the basis of the EU–Norway management plan that the TAC (Human Consumption landings) should be no more than 40 639 tonnes in 2014. If rates of discards and industrial bycatch do not change from the average of the last 3 years (2010–2012), this implies catches of no more than 45 318 tonnes. Stock status
F (Fishing Mortality) 2010 2011 2012
MSY (FMSY) Appropriate Precautionary approach (Fpa,Flim) Harvested sustainably
Management plan (FMP) Below target
SSB (Spawning-Stock Biomass) 2011 2012 2013
MSY (Btrigger) Above trigger Precautionary approach (Bpa,Blim) Full reproductive capacity
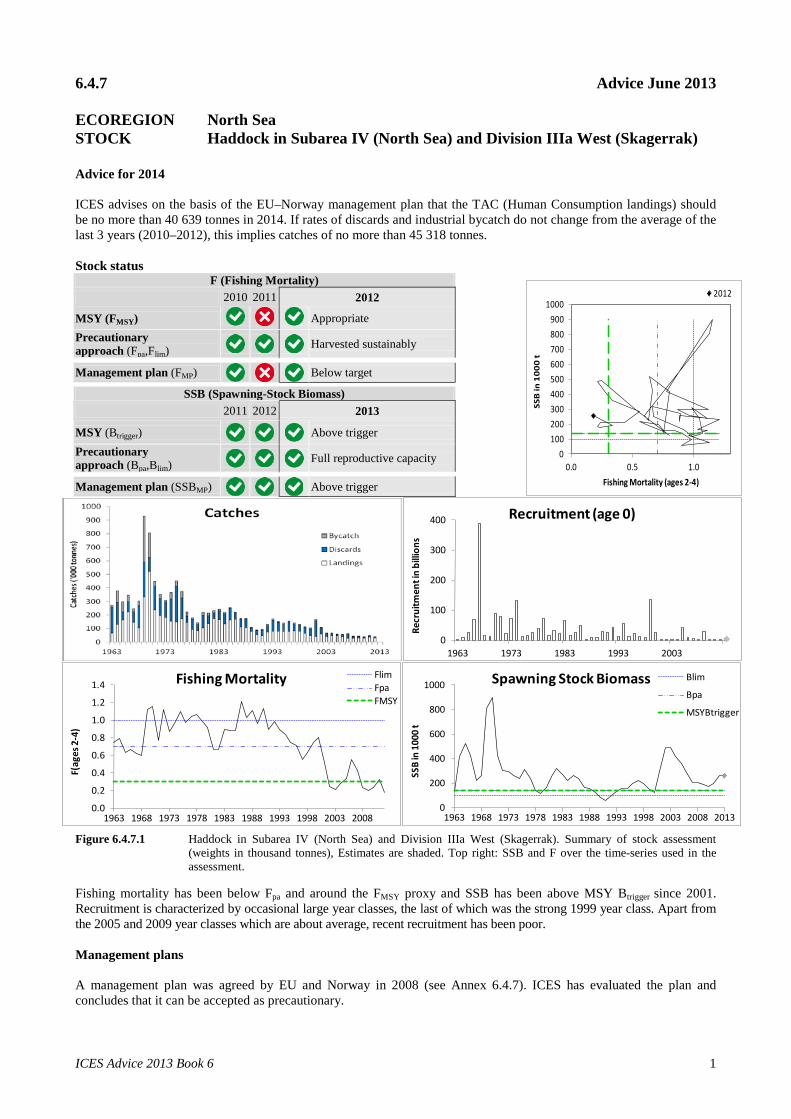
Management plan (SSBMP) Above trigger Figure 6.4.7.1 Haddock in Subarea IV (North Sea) and Division IIIa West (Skagerrak). Summary of stock assessment
(weights in thousand tonnes), Estimates are shaded. Top right: SSB and F over the time-series used in the assessment.
Fishing mortality has been below Fpa and around the FMSY proxy and SSB has been above MSY Btrigger since 2001. Recruitment is characterized by occasional large year classes, the last of which was the strong 1999 year class. Apart from the 2005 and 2009 year classes which are about average, recent recruitment has been poor. Management plans A management plan was agreed by EU and Norway in 2008 (see Annex 6.4.7). ICES has evaluated the plan and concludes that it can be accepted as precautionary.
0
100
200
300
400
1963 1973 1983 1993 2003
Recr
uitm
ent i
n bi
llion
s
Recruitment (age 0)
0
200
400
600
800
1000
1963 1968 1973 1978 1983 1988 1993 1998 2003 2008 2013
SSB
in 1
000
t
Spawning Stock Biomass Blim
Bpa
MSYBtrigger
0100200300400500600700800900
1000
0.0 0.5 1.0
SSB
in 1
000
t
Fishing Mortality (ages 2-4)
2012
0.0
0.2
0.4
0.6
0.8
1.0
1.2
1.4
1963 1968 1973 1978 1983 1988 1993 1998 2003 2008
F(ag
es 2
-4)
Fishing Mortality FlimFpaFMSY
2 ICES Advice 2013, Book 6
Biology The North Sea haddock stock exhibits sporadic high recruitment, leading to dominant year classes in the fishery. These large year classes often grow more slowly than less abundant year classes, possibly due to density-dependent effects. Recruitment appears poorly determined by either spawning-stock biomass or egg production. Haddock primarily prey on benthic and epibenthic invertebrates, sandeels, and herring eggs. Haddock are an important prey species, mainly for saithe and other large gadoids. Environmental influence on the stock Haddock growth may be linked to water temperature. Warmer waters may lead to faster growth in early life stages, but also a lower maximum size (possibly due to faster maturation). There are indications that parental stock size has little effect on subsequent haddock recruitment success, which is principally determined by the environment. The fisheries Haddock are primarily caught by demersal trawlers (single, twin, and pair), and (to a lesser extent) by seiners. Haddock is a specific target for some fleets, but is also caught as part of a mixed fishery catching cod, whiting, and Nephrops. The minimum permitted mesh size for targeted fisheries was increased to 120 mm in 2002. Estimates of haddock bycatch in the industrial fishery are low. Catch by fleet
Total catch (2012) was 37.4 kt, where 88% were landings (of which 80% demersal trawl and seine >100 mm, 6% trawl 70–99 mm, and 14% others), 12% discards, and <0.5% industrial bycatch.
Effects of the fisheries on the ecosystem Trawling impacts the benthos, as summarized in the North Sea ecosystem overview. Trawl gear are also relatively non-selective in terms of species caught, and trawl fisheries have a bycatch of non-commercial species that are important components of the North Sea ecosystem. Reduced benthic biomass is found in areas of bottom trawl activity compared to unfished areas. Since 2001, effort reductions in this fishery have likely led to decreased bycatches. Quality considerations The overall reporting (in particular through the fully documented fisheries (FDF) programme) of catch data provided to ICES is likely to have improved in 2012 and 2013. The assessment shows strong consistency across the years.
0
100
200
300
400
500
600
1998 2003 2008 2013
SSB ('000 tonnes)
0.00
0.20
0.40
0.60
0.80
1.00
1.20
1.40
1998 2003 2008 2013
Fishing mortality: 2-4
0
20
40
60
80
100
120
140
160
1998 2003 2008 2013
Billions
Recruitment. Age: 0
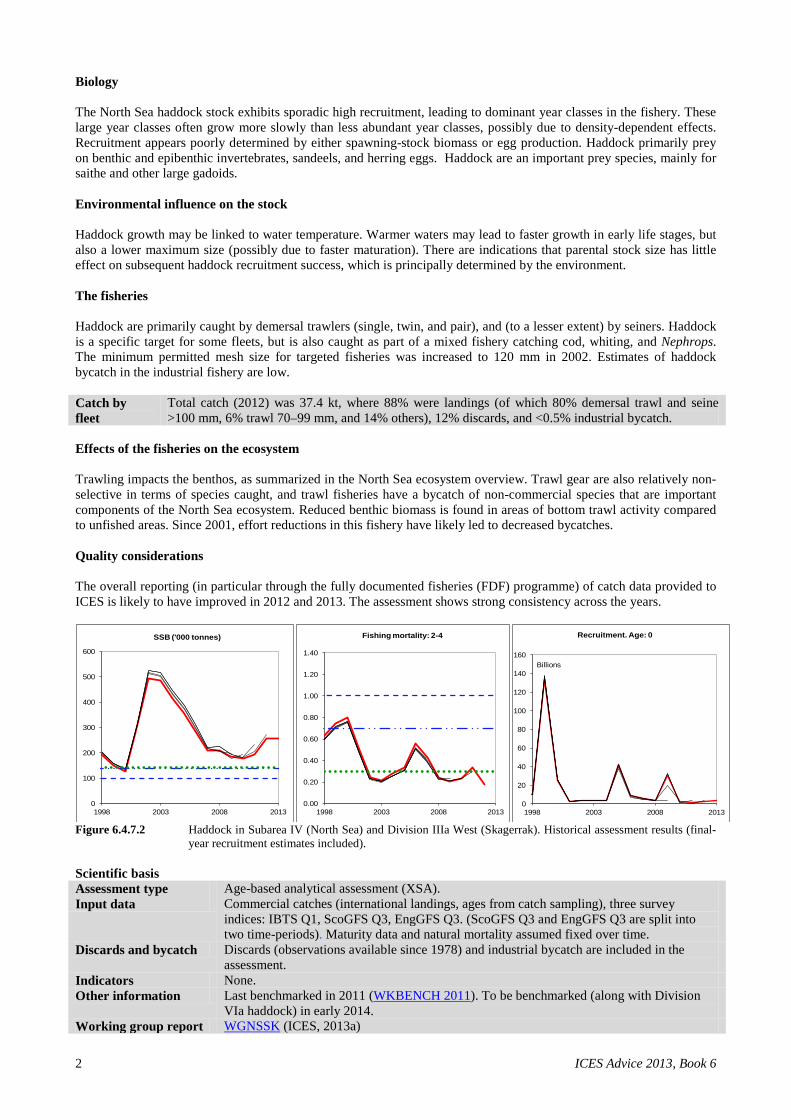
Figure 6.4.7.2 Haddock in Subarea IV (North Sea) and Division IIIa West (Skagerrak). Historical assessment results (final-
year recruitment estimates included). Scientific basis Assessment type Age-based analytical assessment (XSA). Input data Commercial catches (international landings, ages from catch sampling), three survey
indices: IBTS Q1, ScoGFS Q3, EngGFS Q3. (ScoGFS Q3 and EngGFS Q3 are split into two time-periods). Maturity data and natural mortality assumed fixed over time.
Discards and bycatch Discards (observations available since 1978) and industrial bycatch are included in the assessment.
Indicators None. Other information Last benchmarked in 2011 (WKBENCH 2011). To be benchmarked (along with Division
VIa haddock) in early 2014. Working group report WGNSSK (ICES, 2013a)
ICES Advice 2013 Book 6 3
6.4.7 Supporting information June 2013 ECOREGION North Sea STOCK Haddock in Subarea IV (North Sea) and Division IIIa West (Skagerrak)
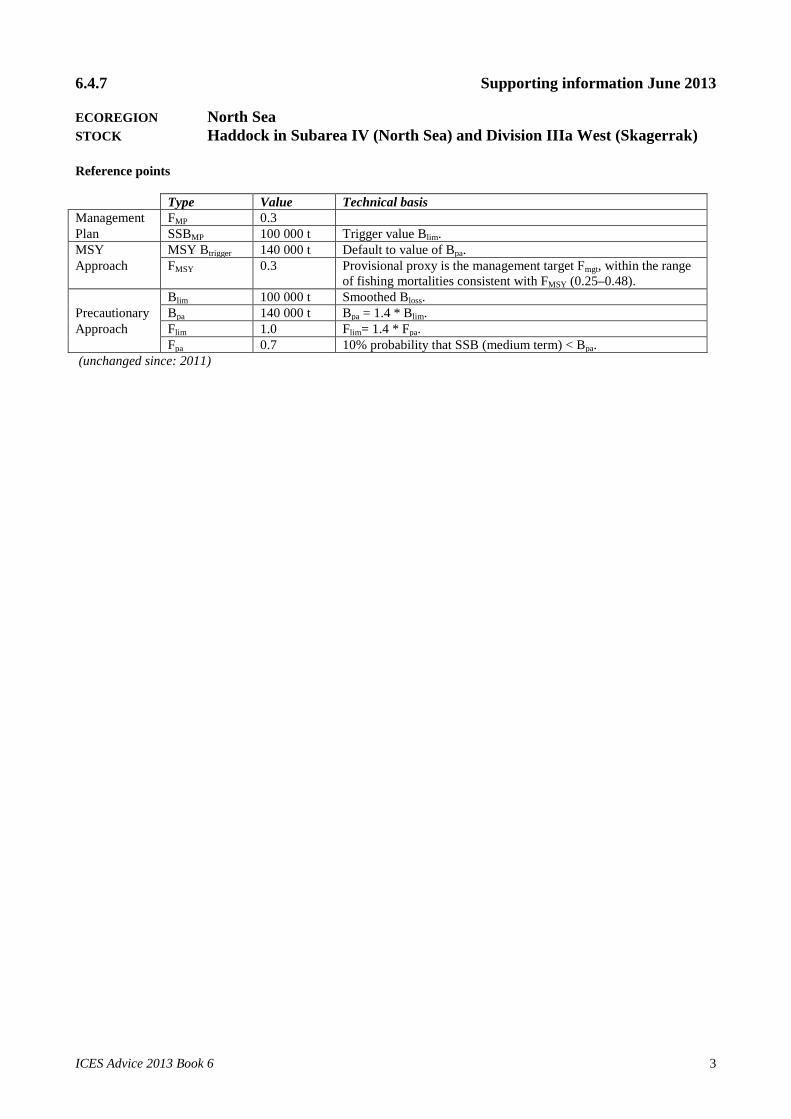
Reference points Type Value Technical basis Management FMP 0.3 Plan SSBMP 100 000 t Trigger value Blim. MSY MSY Btrigger 140 000 t Default to value of Bpa. Approach FMSY 0.3 Provisional proxy is the management target Fmgt, within the range
of fishing mortalities consistent with FMSY (0.25–0.48). Blim 100 000 t Smoothed Bloss. Precautionary Bpa 140 000 t Bpa = 1.4 * Blim. Approach Flim 1.0 Flim= 1.4 * Fpa. Fpa 0.7 10% probability that SSB (medium term) < Bpa. (unchanged since: 2011)
4 ICES Advice 2013, Book 6
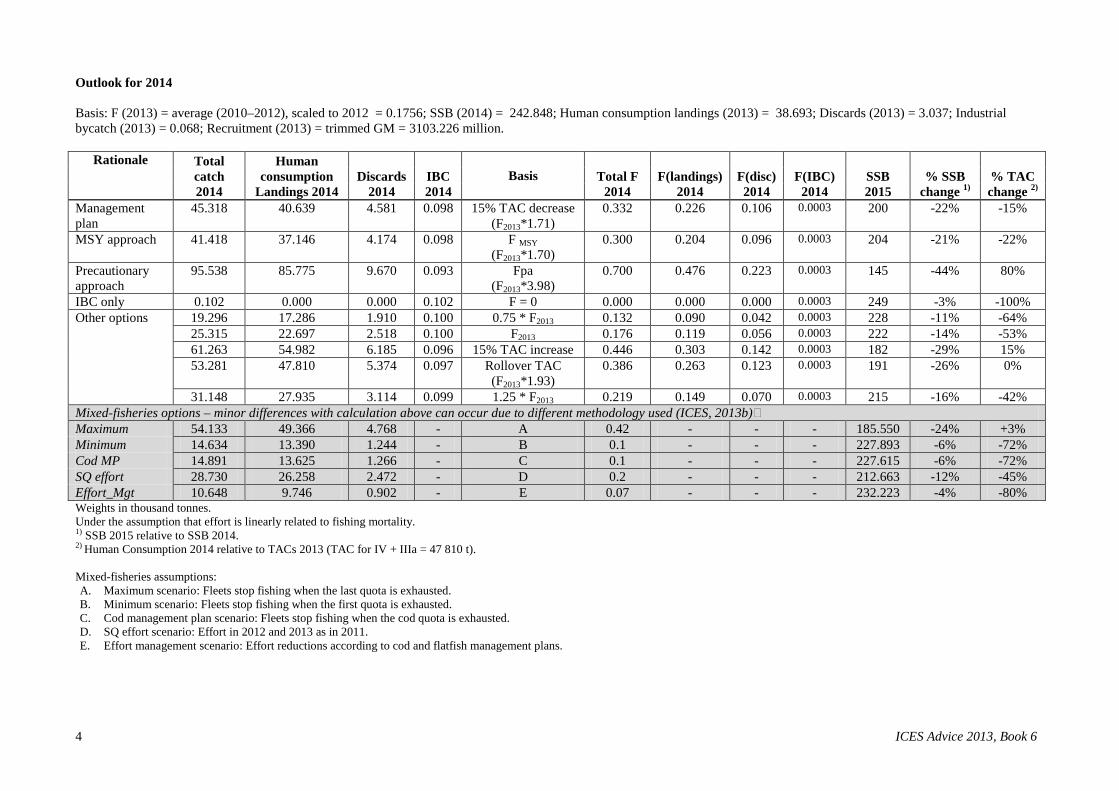
Outlook for 2014 Basis: F (2013) = average (2010–2012), scaled to 2012 = 0.1756; SSB (2014) = 242.848; Human consumption landings (2013) = 38.693; Discards (2013) = 3.037; Industrial bycatch (2013) = 0.068; Recruitment (2013) = trimmed GM = 3103.226 million.
Rationale Total catch 2014
Human consumption
Landings 2014 Discards
2014 IBC 2014
Basis Total F 2014
F(landings) 2014
F(disc) 2014
F(IBC) 2014
SSB 2015
% SSB change 1)
% TAC change 2)
Management plan
45.318 40.639 4.581 0.098 15% TAC decrease (F2013*1.71)
0.332 0.226 0.106 0.0003 200 -22% -15%
MSY approach 41.418 37.146 4.174 0.098 F MSY (F2013*1.70)
0.300 0.204 0.096 0.0003 204 -21% -22%
Precautionary approach
95.538 85.775 9.670 0.093 Fpa (F2013*3.98)
0.700 0.476 0.223 0.0003 145 -44% 80%
IBC only 0.102 0.000 0.000 0.102 F = 0 0.000 0.000 0.000 0.0003 249 -3% -100% Other options 19.296 17.286 1.910 0.100 0.75 * F2013 0.132 0.090 0.042 0.0003 228 -11% -64% 25.315 22.697 2.518 0.100 F2013 0.176 0.119 0.056 0.0003 222 -14% -53% 61.263 54.982 6.185 0.096 15% TAC increase 0.446 0.303 0.142 0.0003 182 -29% 15% 53.281 47.810 5.374 0.097 Rollover TAC
(F2013*1.93) 0.386 0.263 0.123 0.0003 191 -26% 0%
31.148 27.935 3.114 0.099 1.25 * F2013 0.219 0.149 0.070 0.0003 215 -16% -42% Mixed-fisheries options – minor differences with calculation above can occur due to different methodology used (ICES, 2013b) Maximum 54.133 49.366 4.768 - A 0.42 - - - 185.550 -24% +3% Minimum 14.634 13.390 1.244 - B 0.1 - - - 227.893 -6% -72% Cod MP 14.891 13.625 1.266 - C 0.1 - - - 227.615 -6% -72% SQ effort 28.730 26.258 2.472 - D 0.2 - - - 212.663 -12% -45% Effort_Mgt 10.648 9.746 0.902 - E 0.07 - - - 232.223 -4% -80% Weights in thousand tonnes. Under the assumption that effort is linearly related to fishing mortality. 1) SSB 2015 relative to SSB 2014. 2) Human Consumption 2014 relative to TACs 2013 (TAC for IV + IIIa = 47 810 t). Mixed-fisheries assumptions: A. Maximum scenario: Fleets stop fishing when the last quota is exhausted. B. Minimum scenario: Fleets stop fishing when the first quota is exhausted. C. Cod management plan scenario: Fleets stop fishing when the cod quota is exhausted. D. SQ effort scenario: Effort in 2012 and 2013 as in 2011. E. Effort management scenario: Effort reductions according to cod and flatfish management plans.
ICES Advice 2013, Book 6 5
Management plan In 2008 the EU and Norway agreed a revised management plan for this stock, which states that every effort will be made to maintain a minimum level of SSB greater than 100 000 t (Blim). Furthermore, fishing was restricted on the basis of a TAC consistent with a fishing mortality rate of no more than 0.30 for appropriate age groups, along with a limitation on interannual TAC variability of ±15%. Following a minor revision in 2008, interannual quota flexibility (“banking and borrowing”) of up to ±10% is permitted (although this facility has not yet been used). The stipulations of the management plan have been adhered to by the EU and Norway since its implementation in January 2007. Following the agreed management plan implies fishing at the target rate of 0.3, which results in a TAC (Human Consumption landings) reduction of more than 15%. Therefore, the maximum TAC reduction of 15% is applied, resulting in human consumption landings of no more than 40 639 t in 2014. If rates of discards and industrial bycatch do not change from the average of the last 3 years (2010–2012), this implies catches of no more than 45 318 t. This advice implies a reduction in TAC (15%) and increase in F (71%) which is due to the absence of young fish recruiting to the population, and hence a predicted decline in spawning-stock biomass. The possibility of extended periods of low recruitment was accounted for in the 2008 evaluation of the management plan that was deemed to be sustainable. MSY approach Following the ICES MSY approach implies fishing mortality to be increased to 0.3, resulting in a TAC (Human Consumption landings) of no more than 37 146 t in 2014. If rates of discards and industrial bycatch do not change from the average of the last 3 years (2010–2012), this implies catches of no more than 41 418 t. This is expected to lead to an SSB of 204 000 t in 2015. Precautionary approach The fishing mortality in 2014 should be no more than Fpa, corresponding to human consumption landings of 85 775 t in 2014. If rates of discards and industrial bycatch do not change from the average of the last 3 years (2010–2012), this implies catches of no more than 95 538 t, This is expected to keep SSB just above Bpa in 2015. Mixed fisheries In contrast to single-species advice there is no single recommendation for mixed fisheries (ICES, 2013b), but rather a range of example scenarios, assuming fishing patterns and catchability in 2013 and 2014 are unchanged from those in 2012. Major differences between the outcomes of the various scenarios indicate potential undershoot or overshoot of the advised landings corresponding to the single-species advice. As a result, fleet dynamics may change, but cannot be determined. Cod is the limiting species for the North Sea demersal fisheries in 2014. In all scenarios except the ‘max’, the haddock management plan catch options could not be fully utilized. Additional considerations Adherence to the EU–Norway management plan has contributed to lower fishing mortality levels and greatly improved stability of yield. Discards are highly variable without obvious long-term trend but appear to be declining in recent years. Discard rates in 2012 are the lowest observed in the time series and appear to be linked to low recruitment. ICES has developed a generic approach to evaluate whether new survey information that becomes available in September forms a basis to update the advice. If this is the case, ICES will publish new advice in November 2013. Management plan evaluations The evaluations of the management plan that were carried out during 2007 and 2008 used a recruitment model which is thought to capture the sporadic nature of haddock recruitment. On this basis, a target F = 0.3 with TAC constraint ±15% leads to a low risk (<12% in any year) of B < Blim over the next 20 years, and a mean risk of 5% over all years. Lower Fs lead to lower risks. Interannual quota flexibility (banking and borrowing) has also been evaluated and it is concluded that this has no significant impact on sustainability. ICES concludes that the management plan can be accepted as precautionary and can be used as the basis for advice. Regulations and their effects
ICES Advice 2013 Book 6 6
Effort restrictions in the EU were introduced in 2003 (annexes to the annual TAC regulations) for the protection of the North Sea cod stock. In addition, a long-term plan for the recovery of cod stocks was adopted in 2008 (EC regulation 1342/2008). In 2009, the effort management programme switched from a days-at-sea to a kW-day system (EC regulation 43/2009), in which different amounts of kW-days are allocated within each area by member state to different groups of vessels depending on gear and mesh size. Effort ceilings are updated annually. However, for 2013, the European Council decided upon a roll-over of effort level of 2012 into 2013 for both the cod and the sole/plaice management plan. Overall nominal effort (kW-days) by EU demersal trawls, seines, beam trawls, gill/trammel nets and longlines (all mesh sizes included) in the North Sea, Skagerrak, and Eastern Channel had been substantially reduced since the implementation of the two successive effort management plans in 2003 and 2008 (−40% between 2003 and 2012, -16% between 2008 and 2012). Following the introduction of days-at-sea regulations in 2003, there was a substantial switch from the larger mesh (>100 mm, TR1) gear to the smaller mesh (70–99 mm, TR2) gear. Subsequently, effort by TR1 has been relatively stable, whereas effort in TR2 and in small mesh beam trawl (80–120 mm, BT2), has shown a pronounced decline (−14%, −45%, and −48%, respectively, between 2004 and 2012). Gill and trammel nets fisheries have remained stable (ICES, 2013b). Effort in large mesh size beam trawl (>=120 mm, BT1) has increased significantly in 2012 after a decade of continuous decline. Nominal effort reported by Norway has increased since 2011 due to the generalization of electronic logbooks. Scotland implemented in February 2008 a national scheme known as the ‘Conservation Credits Scheme’. The principle of this two-part scheme involves additional time at sea in return for the adoption of measures which aim to reduce mortality on cod and lead to a reduction in discard numbers (real-time closures and technical measures). In 2010 there were 165 closures, and from July 2010 the area of each closure increased (from 50 square nautical miles to 225 square nautical miles). During 2011 there were 185 of these larger closures, while there were 173 in 2012. The effects of this regulation on the behaviour of the fleet and on the haddock stock have been investigated, but do not show a consistent pattern. Changes in fishing technology and fishing patterns The expansion of the closed-circuit TV (CCTV) and fully documented fisheries (FDF) programmes in 2010–2013 in Scotland, Denmark, and England is expected to have contributed to the reduction of cod mortality. Under this scheme, UK vessels are not permitted to discard any cod, while Danish vessels are still permitted to discard undersize cod. For both nations, all cod caught are counted against the quota. Vessels carrying CCTV systems may preferentially target haddock to prevent exhausting the cod quota and having to tie up. The uptake of Scottish haddock quota in 2012 was very close to 100%, which contrasts with historical under-utilisation of the quota and supports the hypothesis of increased targeting in combination with a quota that was predicted to be restrictive. Information from the fishing industry The 2012 report of the North Sea Stock Survey (Napier, 2012) shows the industry’s perception of increasing haddock abundance in all areas of the North Sea in 2012. This does not concur with the stock assessment perception up to 2009. In the last three years both the stock assessment and industry perception show an increasing trend. Effect of the environment on the stock Baudron et al. (2011) has suggested that haddock growth may be linked to temperature. Warmer waters lead to faster growth in early life stages, but also (potentially) faster maturation and hence a lower maximum size. Water temperature in the North Sea has increased and Wright et al. (2011) also shows that smaller size at maturity was partly linked to temperature rises and a greater proportion of haddock maturing at a younger age. Other ongoing work (Marine Scotland, unpublished) has indicated that haddock recruitment is only weakly linked to spawning-stock biomass, being more obviously determined by ecosystem factors. Revisions in data and methodologies The approach used to collate discard data has changed to conform to the EU Data Collection Framework (DCF), beginning with the 2009 data year. Direct comparisons with the previous method are not available, but analysis shows that the 2009 estimates are well within the range of recent variation. This suggests that the new collation method has not changed the perception of discard rates for haddock. Prior to 1977 there were few discard observations, therefore discard estimates used in the assessment come from a statistical model. Since 1978, observed discards are used in the assessment. Discard estimates for 2012 derived from sampling by the main countries fishing haddock.
ICES Advice 2013, Book 6 7
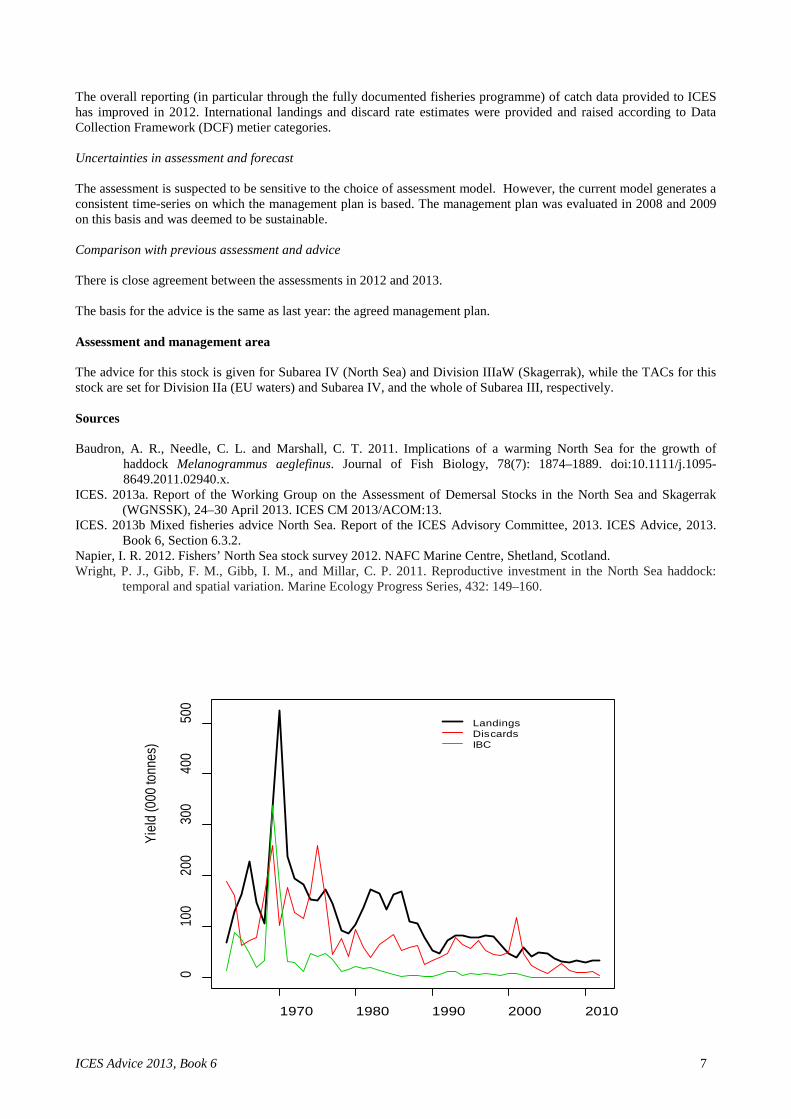
The overall reporting (in particular through the fully documented fisheries programme) of catch data provided to ICES has improved in 2012. International landings and discard rate estimates were provided and raised according to Data Collection Framework (DCF) metier categories. Uncertainties in assessment and forecast The assessment is suspected to be sensitive to the choice of assessment model. However, the current model generates a consistent time-series on which the management plan is based. The management plan was evaluated in 2008 and 2009 on this basis and was deemed to be sustainable. Comparison with previous assessment and advice There is close agreement between the assessments in 2012 and 2013. The basis for the advice is the same as last year: the agreed management plan. Assessment and management area The advice for this stock is given for Subarea IV (North Sea) and Division IIIaW (Skagerrak), while the TACs for this stock are set for Division IIa (EU waters) and Subarea IV, and the whole of Subarea III, respectively. Sources Baudron, A. R., Needle, C. L. and Marshall, C. T. 2011. Implications of a warming North Sea for the growth of
haddock Melanogrammus aeglefinus. Journal of Fish Biology, 78(7): 1874–1889. doi:10.1111/j.1095-8649.2011.02940.x.
ICES. 2013a. Report of the Working Group on the Assessment of Demersal Stocks in the North Sea and Skagerrak (WGNSSK), 24–30 April 2013. ICES CM 2013/ACOM:13.
ICES. 2013b Mixed fisheries advice North Sea. Report of the ICES Advisory Committee, 2013. ICES Advice, 2013. Book 6, Section 6.3.2.
Napier, I. R. 2012. Fishers’ North Sea stock survey 2012. NAFC Marine Centre, Shetland, Scotland. Wright, P. J., Gibb, F. M., Gibb, I. M., and Millar, C. P. 2011. Reproductive investment in the North Sea haddock:
temporal and spatial variation. Marine Ecology Progress Series, 432: 149–160.
1970 1980 1990 2000 2010
010
020
030
040
050
0
Yiel
d (0
00 to
nnes
)
LandingsDiscardsIBC
ICES Advice 2013 Book 6 8
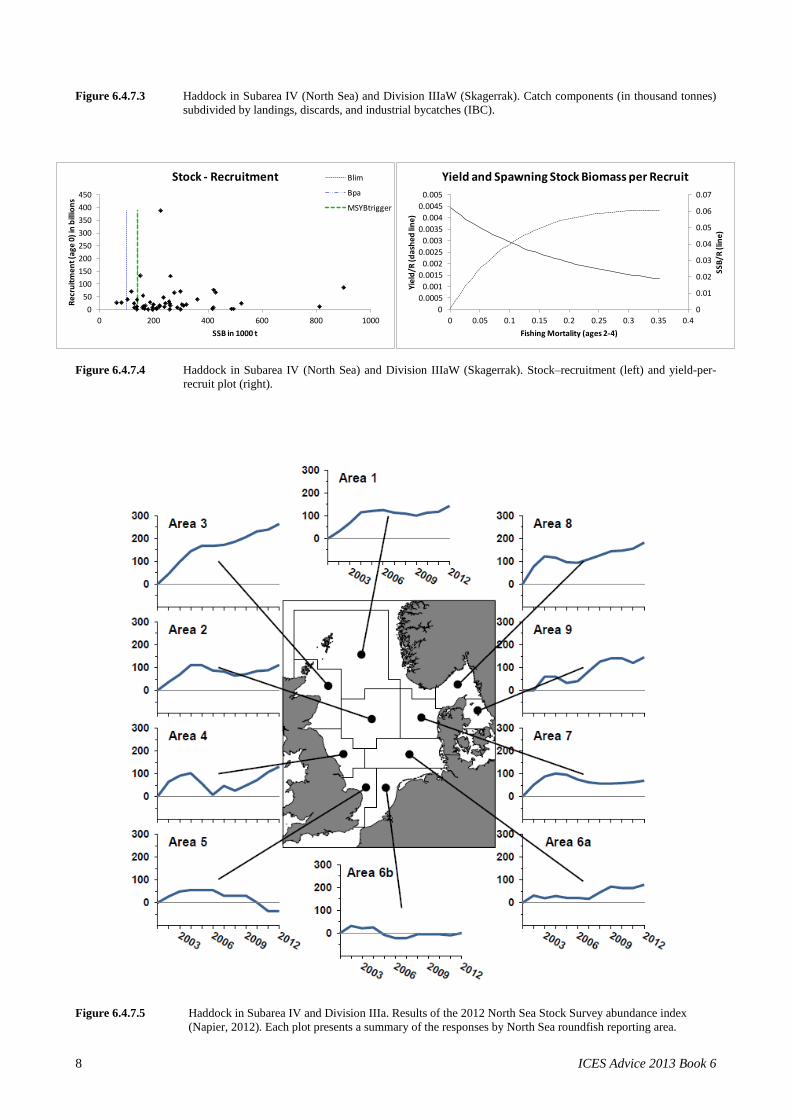
Figure 6.4.7.3 Haddock in Subarea IV (North Sea) and Division IIIaW (Skagerrak). Catch components (in thousand tonnes)
subdivided by landings, discards, and industrial bycatches (IBC).
Figure 6.4.7.4 Haddock in Subarea IV (North Sea) and Division IIIaW (Skagerrak). Stock–recruitment (left) and yield-per-recruit plot (right).
Figure 6.4.7.5 Haddock in Subarea IV and Division IIIa. Results of the 2012 North Sea Stock Survey abundance index
(Napier, 2012). Each plot presents a summary of the responses by North Sea roundfish reporting area.
050
100150200250300350400450
0 200 400 600 800 1000
Recr
uitm
ent (
age
0) in
bill
ions
SSB in 1000 t
Stock - Recruitment Blim
Bpa
MSYBtrigger
0
0.01
0.02
0.03
0.04
0.05
0.06
0.07
00.0005
0.0010.0015
0.0020.0025
0.0030.0035
0.0040.0045
0.005
0 0.05 0.1 0.15 0.2 0.25 0.3 0.35 0.4
SSB/
R (li
ne)
Yiel
d/R
(das
hed
line)
Fishing Mortality (ages 2-4)
Yield and Spawning Stock Biomass per Recruit
ICES Advice 2013, Book 6 9
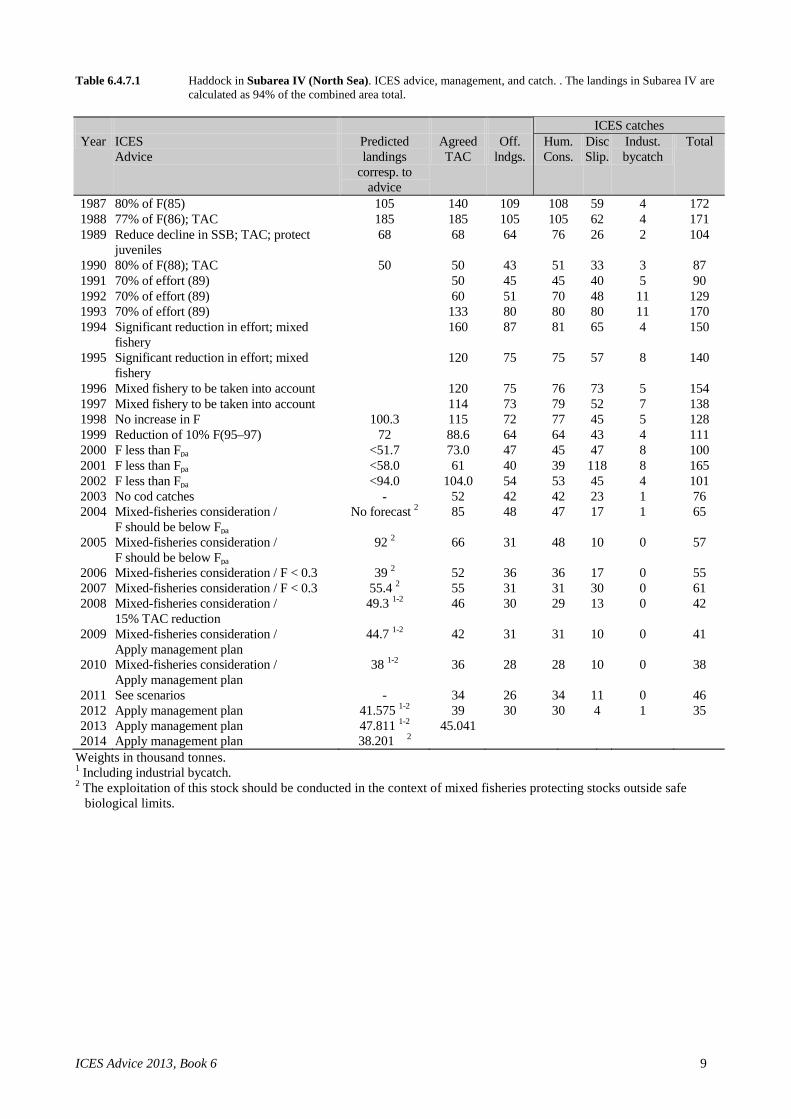
Table 6.4.7.1 Haddock in Subarea IV (North Sea). ICES advice, management, and catch. . The landings in Subarea IV are calculated as 94% of the combined area total.
ICES catches
Year ICES Advice
Predicted landings
corresp. to advice
Agreed TAC
Off. lndgs.
Hum. Cons.
Disc Slip.
Indust. bycatch
Total
1987 80% of F(85) 105 140 109 108 59 4 172 1988 77% of F(86); TAC 185 185 105 105 62 4 171 1989 Reduce decline in SSB; TAC; protect
juveniles 68 68 64 76 26 2 104
1990 80% of F(88); TAC 50 50 43 51 33 3 87 1991 70% of effort (89) 50 45 45 40 5 90 1992 70% of effort (89) 60 51 70 48 11 129 1993 70% of effort (89) 133 80 80 80 11 170 1994 Significant reduction in effort; mixed
fishery 160 87 81 65 4 150
1995 Significant reduction in effort; mixed fishery
120 75 75 57 8 140
1996 Mixed fishery to be taken into account 120 75 76 73 5 154 1997 Mixed fishery to be taken into account 114 73 79 52 7 138 1998 No increase in F 100.3 115 72 77 45 5 128 1999 Reduction of 10% F(95–97) 72 88.6 64 64 43 4 111 2000 F less than Fpa <51.7 73.0 47 45 47 8 100 2001 F less than Fpa <58.0 61 40 39 118 8 165 2002 F less than Fpa <94.0 104.0 54 53 45 4 101 2003 No cod catches - 52 42 42 23 1 76 2004 Mixed-fisheries consideration /
F should be below Fpa No forecast 2 85 48 47 17 1 65
2005 Mixed-fisheries consideration / F should be below Fpa
92 2 66 31 48 10 0 57
2006 Mixed-fisheries consideration / F < 0.3 39 2 52 36 36 17 0 55 2007 Mixed-fisheries consideration / F < 0.3 55.4 2 55 31 31 30 0 61 2008 Mixed-fisheries consideration /
15% TAC reduction 49.3 1-2 46 30 29 13 0 42
2009 Mixed-fisheries consideration / Apply management plan
44.7 1-2 42 31 31 10 0 41
2010 Mixed-fisheries consideration / Apply management plan
38 1-2 36 28 28 10 0 38
2011 See scenarios - 34 26 34 11 0 46 2012 Apply management plan 41.575 1-2 39 30 30 4 1 35 2013 Apply management plan 47.811 1-2 45.041 2014 Apply management plan 38.201 2
Weights in thousand tonnes. 1 Including industrial bycatch. 2 The exploitation of this stock should be conducted in the context of mixed fisheries protecting stocks outside safe
biological limits.
ICES Advice 2013 Book 6 10
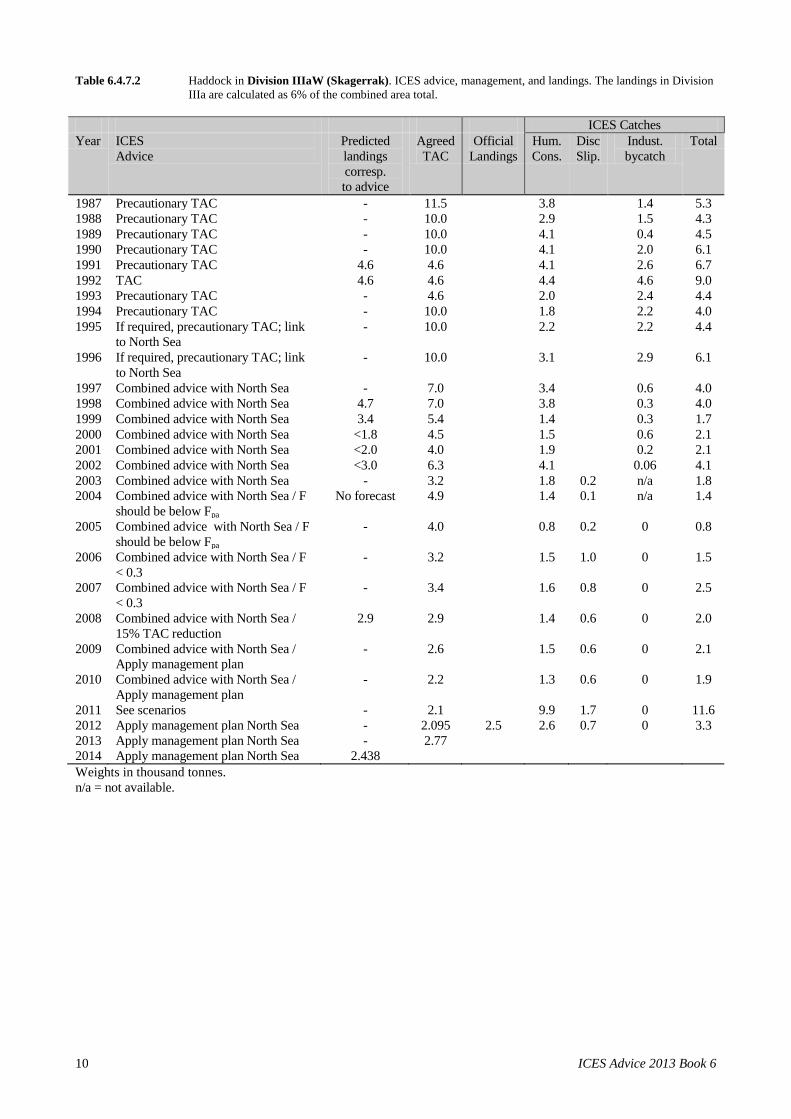
Table 6.4.7.2 Haddock in Division IIIaW (Skagerrak). ICES advice, management, and landings. The landings in Division IIIa are calculated as 6% of the combined area total.
ICES Catches Year ICES
Advice Predicted landings corresp. to advice
Agreed TAC
Official Landings
Hum. Cons.
Disc Slip.
Indust. bycatch
Total
1987 Precautionary TAC - 11.5 3.8 1.4 5.3 1988 Precautionary TAC - 10.0 2.9 1.5 4.3 1989 Precautionary TAC - 10.0 4.1 0.4 4.5 1990 Precautionary TAC - 10.0 4.1 2.0 6.1 1991 Precautionary TAC 4.6 4.6 4.1 2.6 6.7 1992 TAC 4.6 4.6 4.4 4.6 9.0 1993 Precautionary TAC - 4.6 2.0 2.4 4.4 1994 Precautionary TAC - 10.0 1.8 2.2 4.0 1995 If required, precautionary TAC; link
to North Sea - 10.0 2.2 2.2 4.4
1996 If required, precautionary TAC; link to North Sea
- 10.0 3.1 2.9 6.1
1997 Combined advice with North Sea - 7.0 3.4 0.6 4.0 1998 Combined advice with North Sea 4.7 7.0 3.8 0.3 4.0 1999 Combined advice with North Sea 3.4 5.4 1.4 0.3 1.7 2000 Combined advice with North Sea <1.8 4.5 1.5 0.6 2.1 2001 Combined advice with North Sea <2.0 4.0 1.9 0.2 2.1 2002 Combined advice with North Sea <3.0 6.3 4.1 0.06 4.1 2003 Combined advice with North Sea - 3.2 1.8 0.2 n/a 1.8 2004 Combined advice with North Sea / F
should be below Fpa No forecast 4.9 1.4 0.1 n/a 1.4
2005 Combined advice with North Sea / F should be below Fpa
- 4.0 0.8 0.2 0 0.8
2006 Combined advice with North Sea / F < 0.3
- 3.2 1.5 1.0 0 1.5
2007 Combined advice with North Sea / F < 0.3
- 3.4 1.6 0.8 0 2.5
2008 Combined advice with North Sea / 15% TAC reduction
2.9 2.9 1.4 0.6 0 2.0
2009 Combined advice with North Sea / Apply management plan
- 2.6 1.5 0.6 0 2.1
2010 Combined advice with North Sea / Apply management plan
- 2.2 1.3 0.6 0 1.9
2011 See scenarios - 2.1 9.9 1.7 0 11.6 2012 Apply management plan North Sea - 2.095 2.5 2.6 0.7 0 3.3 2013 Apply management plan North Sea - 2.77 2014 Apply management plan North Sea 2.438 Weights in thousand tonnes. n/a = not available.
ICES Advice 2013, Book 6 11
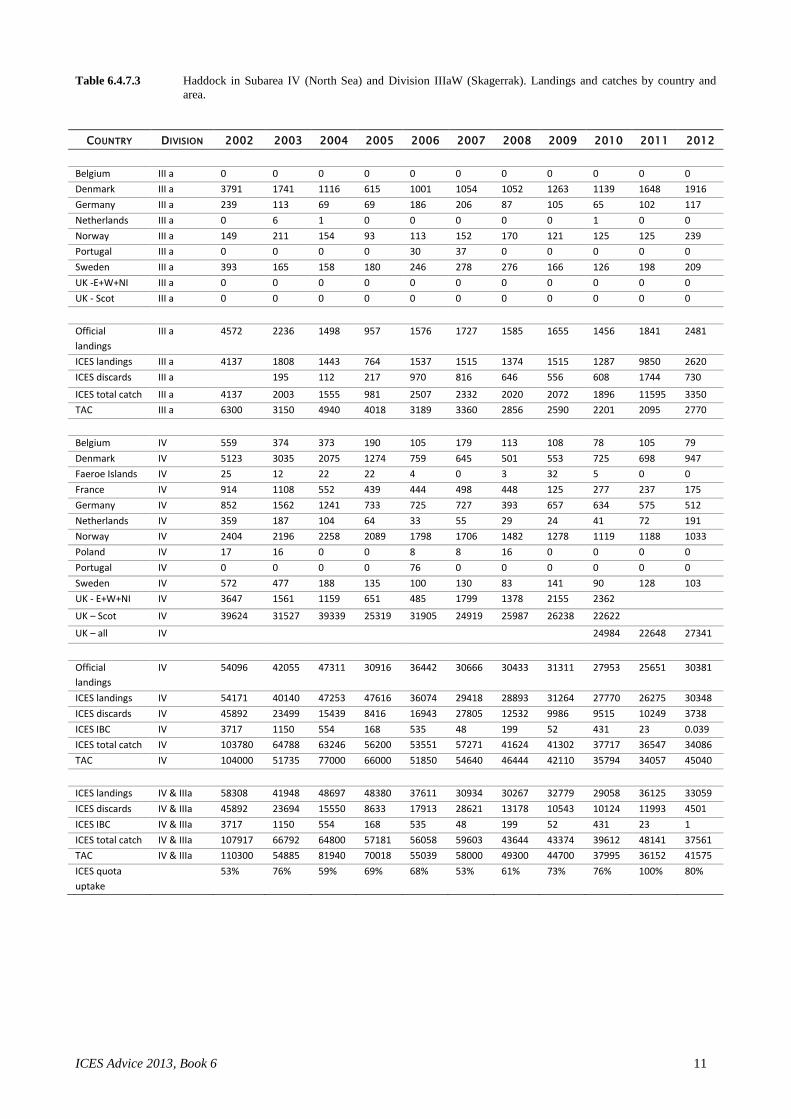
Table 6.4.7.3 Haddock in Subarea IV (North Sea) and Division IIIaW (Skagerrak). Landings and catches by country and area.
COUNTRY DIVISION 2002 2003 2004 2005 2006 2007 2008 2009 2010 2011 2012 Belgium III a 0 0 0 0 0 0 0 0 0 0 0 Denmark III a 3791 1741 1116 615 1001 1054 1052 1263 1139 1648 1916 Germany III a 239 113 69 69 186 206 87 105 65 102 117 Netherlands III a 0 6 1 0 0 0 0 0 1 0 0 Norway III a 149 211 154 93 113 152 170 121 125 125 239 Portugal III a 0 0 0 0 30 37 0 0 0 0 0 Sweden III a 393 165 158 180 246 278 276 166 126 198 209 UK -E+W+NI III a 0 0 0 0 0 0 0 0 0 0 0 UK - Scot III a 0 0 0 0 0 0 0 0 0 0 0 Official landings
III a 4572 2236 1498 957 1576 1727 1585 1655 1456 1841 2481
ICES landings III a 4137 1808 1443 764 1537 1515 1374 1515 1287 9850 2620 ICES discards III a 195 112 217 970 816 646 556 608 1744 730 ICES total catch III a 4137 2003 1555 981 2507 2332 2020 2072 1896 11595 3350 TAC III a 6300 3150 4940 4018 3189 3360 2856 2590 2201 2095 2770 Belgium IV 559 374 373 190 105 179 113 108 78 105 79 Denmark IV 5123 3035 2075 1274 759 645 501 553 725 698 947 Faeroe Islands IV 25 12 22 22 4 0 3 32 5 0 0 France IV 914 1108 552 439 444 498 448 125 277 237 175 Germany IV 852 1562 1241 733 725 727 393 657 634 575 512 Netherlands IV 359 187 104 64 33 55 29 24 41 72 191 Norway IV 2404 2196 2258 2089 1798 1706 1482 1278 1119 1188 1033 Poland IV 17 16 0 0 8 8 16 0 0 0 0 Portugal IV 0 0 0 0 76 0 0 0 0 0 0 Sweden IV 572 477 188 135 100 130 83 141 90 128 103 UK - E+W+NI IV 3647 1561 1159 651 485 1799 1378 2155 2362 UK – Scot IV 39624 31527 39339 25319 31905 24919 25987 26238 22622 UK – all IV 24984 22648 27341
Official landings
IV 54096 42055 47311 30916 36442 30666 30433 31311 27953 25651 30381
ICES landings IV 54171 40140 47253 47616 36074 29418 28893 31264 27770 26275 30348 ICES discards IV 45892 23499 15439 8416 16943 27805 12532 9986 9515 10249 3738 ICES IBC IV 3717 1150 554 168 535 48 199 52 431 23 0.039 ICES total catch IV 103780 64788 63246 56200 53551 57271 41624 41302 37717 36547 34086 TAC IV 104000 51735 77000 66000 51850 54640 46444 42110 35794 34057 45040 ICES landings IV & IIIa 58308 41948 48697 48380 37611 30934 30267 32779 29058 36125 33059 ICES discards IV & IIIa 45892 23694 15550 8633 17913 28621 13178 10543 10124 11993 4501 ICES IBC IV & IIIa 3717 1150 554 168 535 48 199 52 431 23 1 ICES total catch IV & IIIa 107917 66792 64800 57181 56058 59603 43644 43374 39612 48141 37561 TAC IV & IIIa 110300 54885 81940 70018 55039 58000 49300 44700 37995 36152 41575 ICES quota uptake
53% 76% 59% 69% 68% 53% 61% 73% 76% 100% 80%
ICES Advice 2013 Book 6 12
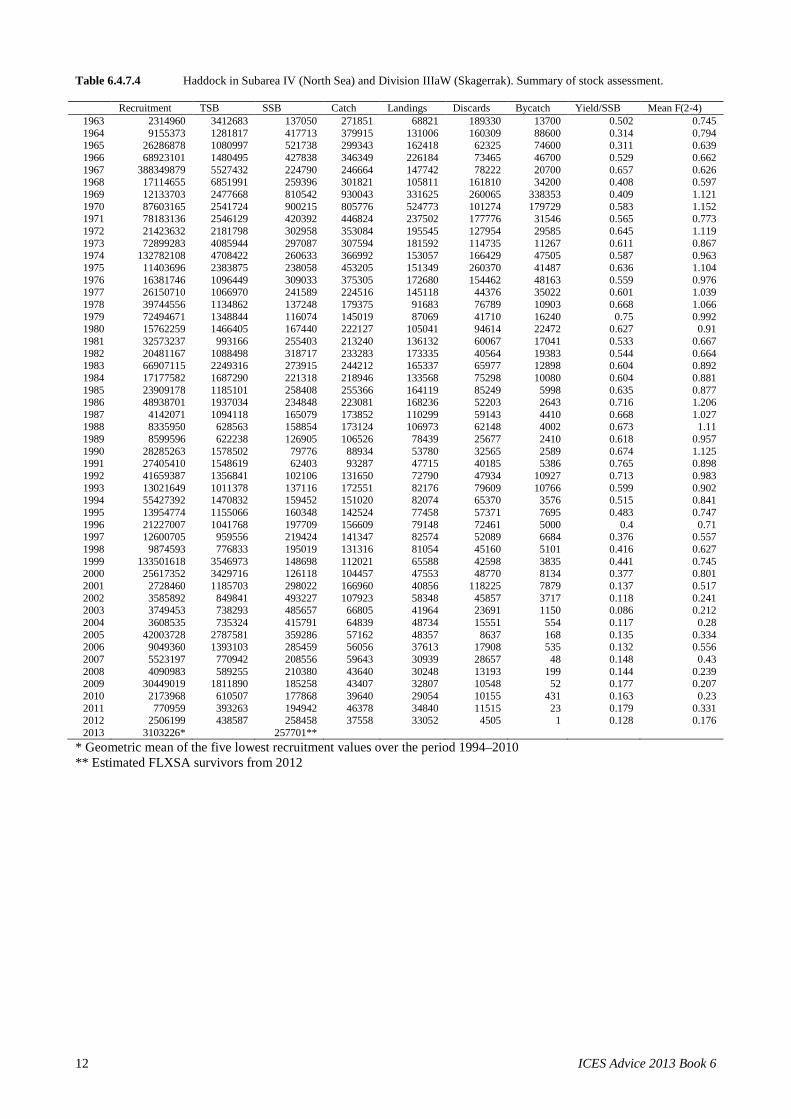
Table 6.4.7.4 Haddock in Subarea IV (North Sea) and Division IIIaW (Skagerrak). Summary of stock assessment.
Recruitment TSB SSB Catch Landings Discards Bycatch Yield/SSB Mean F(2-4)
1963 2314960 3412683 137050 271851 68821 189330 13700 0.502 0.745 1964 9155373 1281817 417713 379915 131006 160309 88600 0.314 0.794 1965 26286878 1080997 521738 299343 162418 62325 74600 0.311 0.639 1966 68923101 1480495 427838 346349 226184 73465 46700 0.529 0.662 1967 388349879 5527432 224790 246664 147742 78222 20700 0.657 0.626 1968 17114655 6851991 259396 301821 105811 161810 34200 0.408 0.597 1969 12133703 2477668 810542 930043 331625 260065 338353 0.409 1.121 1970 87603165 2541724 900215 805776 524773 101274 179729 0.583 1.152 1971 78183136 2546129 420392 446824 237502 177776 31546 0.565 0.773 1972 21423632 2181798 302958 353084 195545 127954 29585 0.645 1.119 1973 72899283 4085944 297087 307594 181592 114735 11267 0.611 0.867 1974 132782108 4708422 260633 366992 153057 166429 47505 0.587 0.963 1975 11403696 2383875 238058 453205 151349 260370 41487 0.636 1.104 1976 16381746 1096449 309033 375305 172680 154462 48163 0.559 0.976 1977 26150710 1066970 241589 224516 145118 44376 35022 0.601 1.039 1978 39744556 1134862 137248 179375 91683 76789 10903 0.668 1.066 1979 72494671 1348844 116074 145019 87069 41710 16240 0.75 0.992 1980 15762259 1466405 167440 222127 105041 94614 22472 0.627 0.91 1981 32573237 993166 255403 213240 136132 60067 17041 0.533 0.667 1982 20481167 1088498 318717 233283 173335 40564 19383 0.544 0.664 1983 66907115 2249316 273915 244212 165337 65977 12898 0.604 0.892 1984 17177582 1687290 221318 218946 133568 75298 10080 0.604 0.881 1985 23909178 1185101 258408 255366 164119 85249 5998 0.635 0.877 1986 48938701 1937034 234848 223081 168236 52203 2643 0.716 1.206 1987 4142071 1094118 165079 173852 110299 59143 4410 0.668 1.027 1988 8335950 628563 158854 173124 106973 62148 4002 0.673 1.11 1989 8599596 622238 126905 106526 78439 25677 2410 0.618 0.957 1990 28285263 1578502 79776 88934 53780 32565 2589 0.674 1.125 1991 27405410 1548619 62403 93287 47715 40185 5386 0.765 0.898 1992 41659387 1356841 102106 131650 72790 47934 10927 0.713 0.983 1993 13021649 1011378 137116 172551 82176 79609 10766 0.599 0.902 1994 55427392 1470832 159452 151020 82074 65370 3576 0.515 0.841 1995 13954774 1155066 160348 142524 77458 57371 7695 0.483 0.747 1996 21227007 1041768 197709 156609 79148 72461 5000 0.4 0.71 1997 12600705 959556 219424 141347 82574 52089 6684 0.376 0.557 1998 9874593 776833 195019 131316 81054 45160 5101 0.416 0.627 1999 133501618 3546973 148698 112021 65588 42598 3835 0.441 0.745 2000 25617352 3429716 126118 104457 47553 48770 8134 0.377 0.801 2001 2728460 1185703 298022 166960 40856 118225 7879 0.137 0.517 2002 3585892 849841 493227 107923 58348 45857 3717 0.118 0.241 2003 3749453 738293 485657 66805 41964 23691 1150 0.086 0.212 2004 3608535 735324 415791 64839 48734 15551 554 0.117 0.28 2005 42003728 2787581 359286 57162 48357 8637 168 0.135 0.334 2006 9049360 1393103 285459 56056 37613 17908 535 0.132 0.556 2007 5523197 770942 208556 59643 30939 28657 48 0.148 0.43 2008 4090983 589255 210380 43640 30248 13193 199 0.144 0.239 2009 30449019 1811890 185258 43407 32807 10548 52 0.177 0.207 2010 2173968 610507 177868 39640 29054 10155 431 0.163 0.23 2011 770959 393263 194942 46378 34840 11515 23 0.179 0.331 2012 2506199 438587 258458 37558 33052 4505 1 0.128 0.176 2013 3103226* 257701**
* Geometric mean of the five lowest recruitment values over the period 1994–2010 ** Estimated FLXSA survivors from 2012
ICES Advice 2013, Book 6 13
Annex 6.4.7 EU and Norway Management plan “The plan shall consist of the following elements:
1. Every effort shall be made to maintain a minimum level of Spawning Stock Biomass greater than 100,000 tonnes (Blim).
2. For 2009 and subsequent years the Parties agreed to restrict their fishing on the basis of a TAC consistent with a fishing mortality rate of no more than 0.3 for appropriate age-groups, when the SSB in the end of the year in which the TAC is applied is estimated above 140,000 tonnes (Bpa).
3. Where the rule in paragraph 2 would lead to a TAC, which deviates by more than 15 % from the TAC of the preceding year, the Parties shall establish a TAC that is no more than 15 % greater or 15 % less than the TAC of the preceding year.
4. Where the SSB referred to in paragraph 2 is estimated to be below Bpa but above Blim the TAC shall not exceed a level which will result in a fishing mortality rate equal to 0.3-0.2*(Bpa-SSB)/(Bpa-Blim). This consideration overrides paragraph 3.
5. Where the SSB referred to in paragraph 2 is estimated to be below Blim the TAC shall be set at a level corresponding to a total fishing mortality rate of no more than 0.1. This consideration overrides paragraph 3.
6. In the event that ICES advises that changes are required to the precautionary reference points Bpa (140,000t) or Blim, (100,000t) the Parties shall meet to review paragraphs 1-5.
7. In order to reduce discarding and to increase the spawning stock biomass and the yield of haddock, the Parties agreed that the exploitation pattern shall, while recalling that other demersal species are harvested in these fisheries, be improved in the light of new scientific advice from inter alia ICES.
8. No later than 31 December 2013, the parties shall review the arrangements in paragraphs 1 to 7 in order to ensure that they are consistent with the objective of the plan. This review shall be conducted after obtaining inter alia advice from ICES concerning the performance of the plan in relation to its objective.
9. This arrangement enters into force on 1 January 2009.”