Assessment of Eastern Georges Bank Haddock for … 2014 EGB Haddock...Shaded text has not been...
96
CERT Comité d'évaluation des ressources transfrontalières TRAC Transboundary Resources Assessment Committee Ce document est disponible sur l’Internet à : This document is available on the Internet at : http://www.mar.dfo-mpo.gc.ca/science/TRAC/trac.html Document de travail 2014/ Working Paper 2014/ Ne pas citer sans autorisation des auteurs Not to be cited without permission of the authors Assessment of Eastern Georges Bank Haddock for 2014 L. Van Eeckhaute 1 and Elizabeth N. Brooks 2 1 Fisheries and Oceans Canada 531 Brandy Cove Road St. Andrews, New Brunswick E5B 2L9 Canada 2 NOAA/NMFS Northeast Fisheries Science Center 166 Water Street Woods Hole, MA 02543 USA
Transcript of Assessment of Eastern Georges Bank Haddock for … 2014 EGB Haddock...Shaded text has not been...

CERT Comité d'évaluation des ressources transfrontalières
TRAC Transboundary Resources Assessment Committee
Ce document est disponible sur l’Internet à : This document is available on the Internet at : http://www.mar.dfo-mpo.gc.ca/science/TRAC/trac.html
Document de travail 2014/ Working Paper 2014/
Ne pas citer sans autorisation des auteurs
Not to be cited without permission of the authors
Assessment of Eastern Georges Bank Haddock for 2014
L. Van Eeckhaute1 and Elizabeth N. Brooks2
1Fisheries and Oceans Canada 531 Brandy Cove Road
St. Andrews, New Brunswick E5B 2L9 Canada
2NOAA/NMFS
Northeast Fisheries Science Center 166 Water Street
Woods Hole, MA 02543 USA

Shaded text has not been updated.

Shaded text has not been updated.
i
ABSTRACT
The total catch of eastern Georges Bank (EGB) haddock in 2013 was 5,066 mt of the 10,400 mt combined Canada/United States of America (USA) quota. The 2013 Canadian catch decreased from 5,064 in 2012 to 4,631 mt while the USA catch in 2013 was 435 mt, a small decrease from the 2012 catch of 569 mt. Haddock discards from the Canadian scallop fishery and the USA groundfish fishery were estimated at 10 and 91 mt, respectively. Under restrictive management measures, combined Canada/USA catches declined from over 6,500 mt in 1991 to a low of 2,150 mt in 1995, averaged about 3,600 mt during 1996 to1999 and have generally increased since then. Catches reached a peak in 2009 at 19,855 mt and have declined since then as the outstanding 2003 year class moved through the fishery. Adult population biomass (ages 3+) has increased from near an historical low of 10,300 mt in 1993 to 76,500 mt in 2003. It decreased to about 53,000 mt at the beginning of 2005 but subsequently increased to 121,500 mt in 2009, higher than the 1931-1955 maximum of about 90,000 mt. Adult biomass subsequently decreased to 40,600 in 2012 but increased in 2013 and again in 2014 to 160,300 mt. The exceptional 2003 and 2010 year classes, estimated at 243 million and 334 million age-1 fish, respectively, are the largest observed in the assessment time series (1931-1955 and 1969-2013). The preliminary estimate for the 2013 year class is 1,546 million fish at age 1. Except for the strong 2000 and 2011 year classes and the exceptional 2003, 2010 and 2013 year classes, recruitment has fluctuated between 2.1 and 27.3 million since 1990. Fully recruited fishing mortality fluctuated between 0.27 and 0.47 during the 1980s, and increased in 1993 to a high of 0.55, the highest observed. Fully recruited fishing mortality was below Fref = 0.26 during 1995 to 2003, fluctuated around 0.3 during 2004 to 2006, then declined and stayed below Fref and was 0.16 in 2013. Positive signs of productivity include expanded age structure, broad spatial distribution, large biomass and three exceptional year classes and two strong year classes since 2000. On the negative side, condition has decreased substantially and size at age has declined. Assuming a 2014 catch equal to the 27,000 mt total quota, a combined Canada/USA catch of 45,500 mt in 2015 results in a neutral risk (50%) that the 2015 fishing mortality rate would exceed Fref = 0.26. A catch of 38,000 mt in 2015 results in a low risk (25%) that the 2015 fishing mortality rate will exceed Fref. The 2010 year class at age 5 is expected to contribute 85% of the catch biomass. The next highest contribution to the 2015 catch biomass of 6% is expected from the 2011 year class at age 4. The probability that the 2016 biomass will not increase by 20% is negligible. Adult biomass is projected to be very high, 568,200 mt at the beginning of 2016 at the Fref catch level.
RÉSUMÉ
<< Abstract or Résumé may be sent to CSAS for translation at the e-mail address below.

Shaded text has not been updated.
ii
Le Résumé ou Abstract peut être envoyé au SCCS pour traduction à l’adresse ci-haut >>

Shaded text has not been updated.
3
INTRODUCTION For the purpose of developing a sharing proposal and consistent management by Canada and the United States of America (USA), an agreement was reached that the transboundary management unit for haddock would be limited to the eastern portion of Georges Bank (EGB; DFO statistical unit areas j and m in NAFO sub-division 5Ze; USA statistical areas 551, 552, 561 and 562 in NAFO sub-division 5Ze; Figure 1; DFO 2002). This assessment applies the approach used by Van Eeckhaute et al. (2013) to Canadian and USA fisheries information updated to 2013. Results from the Fisheries and Oceans Canada (DFO) survey, updated to 2014, the USA National Marine Fisheries Service (NMFS) spring survey, updated to 2014 and the NMFS autumn survey, updated to 2013, were incorporated. The NMFS surveys since 2009, which use a new vessel, the NOAA ship Henry B. Bigelow, and a new net and protocols, were made equivalent to surveys undertaken by the former NOAA ship Albatross IV with length based conversion factors.
FISHERY Commercial Catches Haddock on Georges Bank have supported a commercial fishery since the early 1920s (Clark et al.1982). Catches from EGB during the 1930s to 1950s ranged between 15,000 mt and 40,000 mt (Figure 2), averaging about 25,000 mt (Schuck 1951, R. Brown pers. com.). Records of catches by unit area for 1956 to 1968 have not been located; however, based on records for NAFO Subdivision 5Ze, catches from EGB probably attained record high levels of about 60,000 mt during the early 1960s. Catches in the late 1970s and early 1980s (Table 1) reached a maximum of 23,344 mt and were associated with good recruitment. Substantial quantities of small fish were discarded in those years (Overholtz et al. 1983). Catches subsequently declined and fluctuated around 5,000 mt during the mid to late 1980s. Under restrictive management measures (Table 2), combined Canada/USA catches declined from 6,504 mt in 1991 to a low of 2,150 mt in 1995, varied between about 3,000 mt and 4,000 mt until 1999, and increased to 15,256 mt in 2005 (Figure 3). Combined catches varied between 12,510 mt and 19,855 mt from 2006 to 2011 then decreased in 2012 to 5633 mt and in 2013 to 5,066 mt. In 2013, the total catch represented 49% of the combined 10,400 mt quota. Canada caught 72% of its 6,448 mt allocation while the USA caught 11% of its 3,952 mt allocation. The total catch is well below the quota due to reduced availability of haddock and bycatch restrictions on the Canadian and USA fisheries. Canadian Some elements of the management measures used on EGB are described in Table 2. Quotas are the principal means used to regulate the Canadian groundfish fisheries on Georges Bank. Quota regulation requires effective monitoring of fishery catch. Weights of all Canadian landings since 1992 have been monitored at dockside. Canadian catches since 1995 have usually been below the quota due to closure of some fleet sectors when the cod quotas were reached. At-sea observer coverage increased from 2011 levels for all gears and represented 32% of otter trawl, 24% of longline and 16% of gillnet landings which amounted to an overall observed level of 31% of the haddock landings in 2013. Between 1994 and 2004, the Canadian fishery for groundfish on EGB was prohibited from 1 January to 30 May. In 2005, increasing haddock abundance led to permission to conduct an

Shaded text has not been updated.
4
exploratory Canadian groundfish fishery in January and February that has continued since that time. Observer coverage for this fishery has been higher than at other times of the year. So as not to adversely affect the rebuilding of cod on EGB, the winter fishery was closed February 4th in 2013, based on when it was determined that cod were actively spawning in the previous year, i.e. when 30% of cod were in the spawning or post-spawning stages from spawning data collected by observers.. Canadian Landings Canadian landings in 2013 decreased to 4,631 mt from 5,064 mt in 2012. The 2012 and 2013 catches are the lowest since 2000. In recent years, the Canadian fishery has been conducted primarily by vessels using otter trawls and longlines with some handlines and gillnets. In 2013, almost all of the catch was taken by tonnage class 1 to 3 (less than 150 tons) vessels, corresponding roughly to vessels less than 65 ft in overall length. Otter trawl gear accounted for 94% and longline gear accounted for 6% of the haddock landings, and there were minimal landings from gillnet (Table 3). The highest catch occurred in October, followed by September, January, December and November, in that order (Table 4, Figure 4). The January/February winter fishery landed 1,028 mt of haddock, accounting for 22% of the total Canadian landings, somewhat higher than the previous year. Quarter 4 had the highest percentage of total Canadian landings at 45%. Prior to 1985, Canadian landings include haddock landings reported by the scallop fishery. Landings of haddock by the scallop fleet were low (Table 3) with a maximum of 38 mt reported in 1987. Canadian Discards Since 1996, the scallop fishery has been prohibited from landing haddock and this species is therefore discarded. Discards from this fleet ranged between 29 and 186 mt since 1969 (Table 1; Van Eeckhaute et al. 2005, 2006, 2010 and 2011, Gavaris et al. 2007, 2008 and 2009). In 2013 there were 17 observed scallop trips (Table 5). The monthly discard rates are calculated using a 3-month moving window average. Since 2011, the 3-month moving window used to calculate the discard rate includes December of the previous year for the January discard rate and January of the following year for the December rate (Van Eeckhaute et al. 2011). Discards from 2005 onward were recalculated to reflect a change in the effort measure used from freezer trawler hours to hours x meters. The effect on haddock discards was minimal. Discards in 2013 were estimated at 10 mt, the lowest in the time series (Table 6). Compliance with mandatory retention is thought to be high since at least 1992, so discards in the groundfish fishery are considered to be negligible. USA Management measures for the USA fishery have been primarily effort based since 1994; however, in 2004, quota management was introduced to regulate the USA groundfish fishery for EGB haddock (Table 2). From 2008 to 2010, the USA portion of the EGB management area was closed to vessels fishing with trawl gear from May 1 to July 31. From 2011 onwards, the regulation only applies to the common pool which is a miniscule fraction of USA boats that fish on EGB (the common pool received 0.62% and 0.28% of the EGB quota in 2011 and 2012, respectively).
Shaded text has not been updated.
5
The minimum size for landed haddock had been reduced to 18 inches (45.7 cm) in October 2007 but reverted back to 19 inches (48.2 cm) in August, 2008. On May 1, 2009, the minimum size was again reduced to 18 inches through a NMFS interim action. This minimum size limit was retained in Amendment 16, which went into effect on May 1, 2010. On September 15, 2008 the Ruhle trawl (previously called the Eliminator Trawl) was authorized for use in the USA portion of EGB management area. The Ruhle trawl is intended to reduce by-catch of cod. Also, beginning on May 1, 2010, many participants in the multispecies groundfish fishery organized into sectors, with each unique sector receiving a portion of the overall quota known as an Annual Catch Entitlement (ACE). Those vessels not joining a sector remained in the common pool, which received a portion of the overall quota. A discard provision went into effect on May 1, 2010 requiring that all legal sized fish be retained by vessels in a sector. On May 11, 2011, the Closed Area II Special Access Permit (SAP) was modified to allow targeting of haddock from August 1 to January 31. Also, on 14 September 2011, the haddock catch cap regulation for the herring midwater trawl fishery increased to 1% of the Georges Bank Annual Biological Catch (ABC). USA Landings USA landings of EGB haddock in 2013 were derived from mandatory fishing vessel trip reports (VTRs) and dealer reports. Statistical methodology was applied to allocate unknown landings to statistical area from 1994 to 2013 (Wigley et al. 2008a and Palmer 2008). Some of the landings for trawl gear that were reported in 2008 to 2010, during the months when EGB was closed to trawl gear, come from the allocation algorithm which assigns a statistical area when area is missing or there are inconsistencies in reported areas on logbooks. Trawl landings that were allocated to EGB during May to July for 2008-2010 comprised 3% to 5% of total annual US landings. USA calendar year landings (Table 1) of EGB haddock decreased from 443 mt in 2012 to 344 mt in 2013. The 2013 USA landings peaked in quarter 4 (47%), primarily due to landings in December and February, which represent 24% and 13% of total annual landings (Table 7). As in other years, the otter trawl gear accounted for the majority of the USA landings (331 mt; Table 8). The contribution by other gear, 13 mt, was 4%. For USA fishing year May 1, 2013 to Apr. 30, 2014, the USA catch quota for sectors was 3,952 mt of which only 8.7% was realized in landings (11.0% of quota, including discards). The catch quota for the common pool was 19 mt, none of which was caught. In recent years, landings have been constrained in part by the low cod quota, the closed area, as well as the delayed opening of the EGB area to trawlers until August 1, in effect from 2008 to 2010 for all USA trawl gear and, since 2011, for the common pool only. The use of the Ruhle and Separator trawls may have reduced interactions with the cod quota. USA Discards Discards were estimated from the ratio of discarded haddock to kept of all species, a new methodology that was first applied for the 2009 Eastern Georges Bank haddock assessment. This ratio is calculated by year-quarter (or other suitable time step)-gear-mesh and prorated to the total landings of all species in the same time-gear category to obtain total discards (mt) (Wigley et al. 2008b). Where time steps within the year are sparse, imputation is carried out. Total discards in 2013 were 91 mt, an decrease from 126 mt in 2012 (Table 1 and 9). Discards were mostly from the second half of the year. USA discards from the large mesh otter trawl

Shaded text has not been updated.
6
fishery decreased slightly from 87 mt in 2012 to 84 mt in 2013. Discards from this fleet accounted for 19.3% (by weight) of the USA haddock catch in 2013. Small mesh discards were 6 mt in 2013, a decrease from 38 mt in 2012. The scallop fishery contributed a very small amount of discards in 2013. Size and Age Composition Ageing Precision and Accuracy D. Knox provided ages for the 2013 Canadian fishery and 2014 DFO survey and S.J. Sutherland provided ages for the 2013 US fishery and the NMFS 2013 autumn and 2014 spring surveys. Age testing was conducted between the DFO reader and the NMFS reader and intra-reader testing was conducted at both labs. The NMFS reader also completed two tests against their haddock reference collection which resulted in 91% and 93% agreement. Inter-lab agreement ranged from 84% to 98%. No bias was detected for the exchange. Intra-reader agreement on non-reference collection samples for the NMFS reader ranged between 96% and 99%. For the DFO reader, intra-reader agreement ranged between 93% and 98%. Age determinations at both labs were considered to be reliable for characterizing catch at age (Table 10; http://www.nefsc.noaa.gov/fbp/QA-QC/hd-results.html). Canadian The size and age composition of haddock in the 2013 Canadian groundfish fishery was characterized using port and at-sea samples from all principal gears (Table 11). Landings were applied to length samples combined by gear-month, then combined to calendar quarters before applying quarterly age length keys. Canadian fishery weights were derived from fishery lengths using a length-weight relationship which was derived from commercial fishery samples (round weight (kg) = 0.0000158 length (cm)2.91612; Waiwood and Neilson 1985). Gillnet landings were low and no length samples were available. Therefore, gillnet landings were added in at the quarter level. For trips that were sampled by both at-sea observers and port samples, the length frequencies from the two sources were combined with appropriate weighting from each source before using to ensure that samples were used in a consistent manner. The size composition of haddock discards in the 2013 Canadian scallop fishery was characterized by quarter using length samples obtained from 17 observed scallop trips which comprised 15% of the total trips and 12% of the total effort hours. The 2005 to 2012 discards catch at age was updated to reflect changes in estimated amounts due to a change in the effort measure used and changes made to the observer data. The 2013 DFO survey ages, augmented with port samples, were applied to the first quarter landings and discard length compositions. Fishery age samples for quarters 2, 3 and 4 were applied to the corresponding length compositions for both the groundfish fishery and discards. The modal length of haddock in the 2013 Canadian fishery was 40.5 cm for otter trawlers and 42.5 cm for longliners (Figure 5). Haddock discarded by the scallop fleet had a peak at 14.5 cm and a lesser peak at 36.5 cm. The 9+ age group, comprised almost exclusively of the 2003 year-class, dominated quarter 1 (48%) Canadian landings, accounted for 25.5% of quarter 2 but decreased in importance for quarters 3 (7%) and 4 (4%). It accounted for 13% in numbers of the total Canadian landings. The 2010 year class (age 3) dominated quarters 3 and 4 at 69% and 86%, respectively (Table 12 and Figure 6). Age 3 (2010 year class) made the highest contribution to the Canadian

Shaded text has not been updated.
7
discards (43% by number) followed by the 2013 year class (age 0) at 37%. For the 4th quarter age 0 contributed 76% of the discards. USA USA landings of EGB haddock are sorted into “large” and “scrod” market categories at sea and are sampled in port for lengths and ages. Landings of large haddock totaled 28 mt and scrod haddock totaled 269 mt in 2013 (Table 9). Length sampling for USA EGB landings in 2013 was very limited, with no samples in quarters 1 for both market categories, and no samples for large haddock in quarter 4. Length and age samples were pooled to estimate catch at age by half-year rather than by quarter, and were augmented with length and age samples from US statistical area 522 and 525. After augmenting samples, there was a total of 4,090 lengths for EGB commercial landings and a total of 1,803 ages. USA fishery weights were derived from fishery lengths using a length-weight relationship for each half year. For quarters 1 and 2, that equation is (round weight (kg) = 6.07E-06*length (cm)3.10782; for quarters 3 and 4, that equation is (round weight (kg) = 7.12E-06*length (cm)3.08054. USA fishermen are required to discard haddock under the legal size limit (18 inches/45.7 cm). A new regulation for the 2010 fishing year required vessels participating in a sector to retain all legal sized haddock. USA discards at age of EGB haddock for calendar year 2013 were estimated by half-year from at-sea observer data. In fishing year 2012, the number of observed trips from the at-sea monitoring program was 148, a decrease from the previous year when there were 202. There were 552 trips to EGB for groundfish gear types, however the fraction of trips sampled varied by gear: 53% of otter trawl trips, 40% of gillnet trips, 14% of scallop trips, and 0% long line trips (out of 16 total long line trips). As 92% of the discarding was due to the otter trawl fleet, there were few length samples from remaining gears (scallop dredge and midwater trawl). Therefore, length samples were combined across gears. The resulting combined length frequencies by half-year were converted to discarded number at age by applying the age length keys from the NMFS spring bottom trawl survey (821 ages) to quarters 1 and 2 and from the autumn bottom trawl survey (579 ages) to quarters 3 and 4. The length composition of USA landings in 2013 peaked between 42 and 44 cm (Figure 7). The 2010 year-class dominated the landings but the discards were dominated by age 3 in the first half (2010 year class) and by age 0 (2013 year class) in the second half (Table 12 and Figure 8).. In numbers, discards represented 31% of the US catch.
Combined Canada/USA Catch at Age The 2013 Canadian and USA landings and discards at age estimates (Table 12) were summed to obtain the combined annual catch at age and appended to the 1969 to 2012 catch at age data (Van Eeckhaute and Brooks 2013; Table 13; Figure 9). The average fishery weights at age are presented in Table 14 and Figure 10 and the average lengths at age in Table 15. The catch at age tracks year classes well. The contribution from older ages in recent years has increased when compared to the 1990s. In comparison to the observed 2013 catch, the age composition of the catch projections in numbers made in 2012 and 2013 for the 2013 catch predicted at least twice the proportion of age group 9+ and a 10% to 16%, respectively, lower proportion of age 3s. (Figure 11). The 2010 year-class (age 3) dominated the fishery in 2013, accounting for 57% by weight and 66% by number.

Shaded text has not been updated.
8
Age 2 had contributed a large proportion of the catch during 1969 to 1994 but its contribution decreased dramatically in subsequent years (Figure 12). The increase in the dominant age in the catch is attributable primarily to a change in mesh type by the Canadian fishery, from diamond to square, and an increase in mesh size (Table 2). The combined 2005 to 2012 catch was dominated by ages 5, 6 and 7, a reflection of the domination of the 2000 and 2003 year classes, especially the 2003 year class, which continued to contribute substantially at older ages. The age composition during the 1969 to 1974 period was also atypical since it was dominated by the outstanding 1962 and 1963 year classes which continued to contribute substantially at ages 6 and older.
ABUNDANCE INDICES Research Surveys Surveys of Georges Bank have been conducted by DFO each year (February/March) since 1986 and by NMFS each autumn (October/November) since 1963 and each spring (April) since 1968. All surveys use a stratified random design (Figure 13 and 14). The CCGS Alfred Needler is the standard vessel used for the DFO Georges Bank survey, but, due to unavailability of the Needler, the CCGS Wilfred Templeman, a sister ship to the Needler, was used in 1993, 2004, 2007 and 2008. No conversion factors are available for the Templeman, however, this vessel is considered to be similar in fishing strength to the Needler. For the NMFS surveys, two vessels have been employed from 1963 to 2008 and there was a change in the trawl door type in 1985. Vessel and door type conversion factors (Table 16), derived experimentally from comparative fishing, have been applied to the survey results to make the series consistent (Forrester et al. 1997). Additionally, two different trawl nets have been used on the NMFS spring survey, a modified Yankee 41 during 1973-81 and a Yankee 36 in other years, but no conversion factors are available for haddock. Since spring 2009, the NMFS surveys have been conducted with the NOAA FSV Henry B. Bigelow, a new net (4 seam, 3 bridle) and revised protocols. Length based conversion factors have been calculated (Table 17 and Figure 15) and were applied by dividing Bigelow catches at length by the length specific conversion value to make the Bigelow survey catches equivalent to the FRV Albatross IV catches (Brooks et al. 2010). The spatial distributions of catches by age group (1, 2, and 3+ for spring and 0, 1 and 2+ for autumn) for the 2013 NMFS fall survey, the 20134 DFO survey, and the 2014 NMFS spring survey are shown in comparison to the average distribution over the previous 10-year period (Figure 16-18). During the fall, age 0 is spread throughout the 5Zjm area, and age 1 haddock are also spread out over the bank but are more concentrated on the Canadian side than age 0. Older haddock migrate to deeper water along the northern edge and peak and to a lesser extent along the southern edge and so are mainly found on the Canadian side at this time of year. In Feb/March, the DFO survey finds ages 1 and 2 similarly distributed near the bank edges and mostly in the eastern part of the management unit. Ages 3 and older are concentrated on the bank near the northeast peak and edge and also in 5Zm near the Canada/US boundary and spreading north-eastward from there just north of 41°30’. In March/April the NMFS survey finds age 1 concentrated along the southern flank, age 2 is spread throughout the 5Zjm area, similar to the adults, which are now more widely dispersed than they were earlier in the year as observed from the DFO survey.

Shaded text has not been updated.
9
The 2013 NMFS fall survey had many very large catches and one exceptionally large catch of 20 thousand along the southern flank on the USA side of age 0 haddock (2013 year class). In comparison, the 2014 DFO survey catches of this year class were generally smaller and very variable. Of note is one exceptionally large tow of 36 thousand near the southern edge on the Canadian side. All except 3 tows from the 2014 NMFS spring survey caught the 2013 year class exhibiting mostly fairly good catches which were widely spread throughout the 5Zjm area. The 3+ (2+ for fall) age group was well represented in all three surveys and they were distributed similarly to past distributions. Catches of the 2012 year class (age 2 in spring surveys and 1 in fall survey) were low for all three surveys (Figure 16-18). Age-specific, swept area abundance indices show that the three surveys are consistent and track year-class strengths well (Table 18, 19 and 20; Figure 19). Some year effects are evident. For example, low spring catches occurred in 1997 in both the DFO and NMFS surveys and the 2010 year class (age 4) catch in the 2014 DFO survey shows a substantial drop from the catch the previous year. The most recent surveys were dominated by the 2013 and 2010 year classes. Both the DFO and NMFS fall surveys exhibit the highest index values for the 2013 year class in each time series. The fall value is 4.5 times and the DFO value is more than 2 times higher than the next highest value in their respective series. The NMFS spring index value for this year class is the second highest in the time series. The abundance of older ages since about 2000 has increased in comparison to the 1980s and 1990s. Adult biomass indices (ages 2-8 in autumn; 3-8 in spring) peaked during the early 1960s (Figure 20). After declining to a record low in the early 1970s, they peaked again in the late 1970s, although at a lower level, and again during the early 1980s at about half the level of the 1970s peak. Adult biomass generally increased during the late 1990s and reached some record highs since the 2000s, with, however, some substantial drops in between. The NMFS fall survey adult biomass increased in 2012 with the addition of the 2010 year class to the 2-8 age group and increased again in 2013. The NMFS spring and DFO surveys showed decreases in adult biomass from 2013 to 2014. The NMFS spring decrease was small but the DFO index fell substantially from the previous year’s value, the series highest. The indices for the 2010 year class at age 3 (fall) and age 4 (DFO and NMFS spring) are among each series’ 3 highest values for their respective age (Tables 18, 19 and 20). The recruitment indices for the 2012 year class are similar to but somewhat stronger than the weak 2007 year class (Figure 21). Georges Bank groundfish fishermen continued to corroborate the findings of the surveys with regard to the high abundance of the 2013 year class and reported that they were catching a relatively large number of small haddock in their catches.
GROWTH Canadian and USA fishery weights at age show similar trends (Table 14, Figure 10). Low sampling for small year classes at older ages results in increased variability. Except for ages 1 and 2, combined fishery weights at age in 2013 decreased (Table 14). A declining trend is visible starting around 2000. DFO survey weights and lengths at age in 2014 (Table 21 and 22; Figure 22) showed some decreases (ages 1, 4, 5 and 8) and some increases (ages 2, 3, 6 and 7) but the size at age remains low compared to the pre-2000 period. Average size at age for older haddock has declined substantially so that haddock age 3 and older are now at, or smaller, than the size that the next younger age group was in previous years before the declines occurred. Ages 5 to 8 are similar in weight and length indicating that the maximum size at age has decreased substantially as they are now generally less than the size that age 4 was before
Shaded text has not been updated.
10
2000. The 2013 year class length and weight at age 1 are similar to the 2010 year class at age 1 which, except for age 3, has lower weights and lengths than to the 2003 year class.
Weights at age from the DFO survey are used as beginning of year population weights and are calculated using the method described in Gavaris and Van Eeckhaute (1998) in which weights observed from the survey are weighted by population numbers at length and age. Canadian fishery weights are derived from fishery lengths using a length-weight relationship (Waiwood and Neilson 1985).
HARVEST STRATEGY The Transboundary Management Guidance Committee (TMGC) has adopted a strategy to maintain a low to neutral risk of exceeding the fishing mortality limit reference, Fref = 0.26 (TMGC 2003). When stock conditions are poor, fishing mortality rates should be further reduced to promote rebuilding. The TMGC agreed to a common F strategy at its December 2002 TMGC meeting. The F references used by both countries for “healthy” or “rebuilt” stocks were virtually identical, i.e., 0.25 for Canada and 0.26 for the USA (TMGC Meeting Summary, Oct. 2, 2003).
ESTIMATION OF STOCK PARAMETERS Calibration of Virtual Population Analysis (VPA) Calibrated Virtual Population Analysis (VPA) was used to estimate stock parameters. The adaptive framework, ADAPT, (Gavaris 1988) was used to calibrate the VPA with the research survey data. Details of the model formulations and model assumptions can be found in the 1998 benchmark assessment (Gavaris and Van Eeckhaute 1998). Minor changes that were made since 1998 are described in Table 23 and include the updating of the 2005 to 2012 scallop discards catch at age and corrections to the 2011 NFMS fall survey and the 2012 NMFS spring survey. The VPA was based on an annual catch at age, Ca,t for ages a = 0, 1, 2…8, 9+, and time t = 1969, 1970…2013 where t represents the beginning of the time interval during which the catch was taken. Catch discards were included in the catch at age. The population was calculated to the beginning of 2014. The VPA was calibrated to bottom trawl survey abundance indices, Is,a,t for s = DFO, ages a = 1, 2, 3…8, time t = 1986.17, 1987.17… 2012.17, 2013.17, 2014.00 s = NMFS spring (Yankee 36), ages a = 1, 2, 3…8, time t = 1969.28…1972.28 and 1982.28… 2013.28, 2014.00 s = NMFS spring (Yankee 41), ages a = 1, 2, 3…8, time t = 1973.28, 1974.28…1981.28 s = NMFS autumn, ages a = 0, 1, 2…5, time t = 1969.79, 1970.79… 2013.79. Since the population is calculated to beginning year 2014, the NMFS and DFO spring surveys in 2014 were designated as occurring at time 2014.00.

Shaded text has not been updated.
11
Statistical properties of estimators were determined using conditional non-parametric bootstrapping of model residuals (Efron and Tibshirani 1993, Gavaris and Van Eeckhaute 1998). Population abundance estimates at age 1 and 2 exhibit a large relative error of 59% and 41%, respectively, and a large relative bias at age 1 of 15%. The relative error for other ages is between 24% and 33% with a relative bias for ages 2 and older between 1% and 7% (Table 24). While trends in the three surveys are generally consistent, the survey indices exhibit high variability and the average magnitude of residuals is large relative to other assessments. Although several large residuals are apparent, these do not appear to have a substantial impact on estimates of current abundance (Figure 23 to 27). Some patterns in the residuals (by cohort and by year) suggest year class and/or year effects. Negative residuals are prevalent in the most recent surveys (2013/2014). Retrospective Analysis Retrospective analyses were used to detect any trends to consistently overestimate or underestimate biomass, fishing mortality and recruitment relative to the terminal year estimates (Figure 28 and 29). The addition of an extra year’s data has caused a bias to appear between the present assessment results and previous assessments. A bias in the estimates of ages 3+ biomass for the years 2006 to 2011 and ages 5-8 F for fishing years 2009 to 2012. This bias is not evident between previous assessments. Recruitment estimates may sometimes change substantially when more data becomes available, e.g., the 2008 year class. The current retrospective analysis indicates a tendency to overestimate initial year class size. The 2010 and 2011 year classes are both estimated about a third smaller than the previous year’s retrospective estimates. A historical retrospective analysis which incorporates all data and model formulation changes by plotting the results from previous assessments back to the last benchmark in 1998 instead of peeling back years from the current assessment is illustrated in Figure 30. This analysis shows that the perception of the stock has remained fairly stable through the data and model changes but is also exhibiting a bias between the results from the current assessment and past assessments..
STATE OF RESOURCE Evaluation of the state of the resource was based on results from the VPA for the years 1969 to 2014. For each cohort, the terminal population abundance estimates from ADAPT were adjusted for bias estimated from the bootstrap, and used to construct the history of stock status (Table 25, 26 and 27). This approach for bias adjustment was considered preferable to using potentially biased point estimates of stock parameters (O'Boyle 1998). The weights at age from the DFO survey (Table 21) were used to estimate beginning of year population biomass (Table 27). A weight of 2.4 kg, which was midway between the age 6 and 8 weight for that cohort, was used for age 7 in 1995 as no data were available for that age group. The 1986-95 average weight at each age was used for 1969-85. The adult (ages 3+) population biomass trend reflects the survey adult biomass trends (scaled with catchabilities; Figure 31). Adult biomass increased during the late 1970s and early 1980s to 38,000 mt in 1981. The increase was due to recruitment of the strong 1975 and 1978 year-classes which were both estimated to be above 50 million age-1 fish (Figure 32). However, adult biomass declined rapidly in the early 1980s as these two cohorts were fished intensely at ages 2 and 3 and subsequent recruitment was poor. Improved recruitment in the 1990s and the

Shaded text has not been updated.
12
strong 2000 year class (76 million at age 1), lower exploitation, and reduced capture of small fish in the fisheries allowed the biomass to increase from near a historical low of 10,300 mt in 1993 to 76,500 mt in 2003. Adult biomass decreased to 53,000 mt in 2005 but subsequently increased to 121,500 mt in 2009, higher than the 1931-1955 maximum adult biomass of about 90,000 mt. The near tripling of the biomass from 2005 to 2009 was due to the exceptional 2003 year-class, estimated at 243 million age-1 fish. The biomass decreased after the 2009 high and in 2012 the adult biomass was 40,600 mt but increased in 2013, when the 2010 year class joined the 3+ group, to 125,200 mt and again in 2014 to 160,300 (80% confidence interval: 123,500 mt – 206,400 mt, Figure 33). Except for the strong 2000 and 2011 year classes (76 and 51 million fish, respectively) and the exceptional 2003 and 2010 year classes, recruitment has fluctuated between 2.1 and 27.3 million age 1 fish since 1990. The 2001, 2002, 2004, 2006, 2007, 2008 and 2009 year classes, at less than 6 million fish, are below the median of 8.5 million age 1 fish for 1995 to 2014. The preliminary estimate of the 2013 year class at 1,546 million fish is the highest in the time series (1931-1955 and 1969-2014) and is about 3 times the 2010 year class which is the next highest at 334 million fish. Since 2003, the age at full recruitment to the fishery has been age 5 (rather than age 4 as in previous years) due to a decline in size at age. Comparison of age 4 and 5 fishing mortality (Table 26) and average weights at age from the fishery and survey (Figure 34) indicate that full recruitment to the fishery since 2003 occurs around age 5. Fishery weights are approaching survey (population) weights at age 5, and, when beginning of year to mid-year growth is accounted for, indicate that age 5 fish are fully selected by the fishery. Fully recruited fishing mortality (population weighted average of fully recruited ages) is presented, therefore, for ages 4-8 for pre-2003 and ages 5-8 for 2003 onwards. Fully recruited fishing mortality fluctuated between 0.27 and 0.47 during the 1980s (Figure 35). After reaching a high of 0.55 in 1993, it decreased to well below Fref = 0.26 after 1994, stayed below Fref until 2003, fluctuated around 0.3 during 2004 to 2006, then declined and stayed below Fref and was 0.16 in 2013 (80% confidence interval: 0.14 – 0.20, Figure 33). Consistent with the increase in age at full recruitment into the fishery, the partial recruitment at age for EGB haddock is normalized to ages 4-8 population weighted F for 1969 to 2002 and to ages 5-8 population weighted F from 2003 onwards (Table 28; Figure 36). Average partial recruitment estimates are less variable when weighted by population numbers and is considered more appropriate than the unweighted average. Gains in fishable biomass may be partitioned into those associated with somatic growth of haddock which have previously recruited to the fishery, and those associated with new recruitment to the fishery (Rivard 1980). We used age 2 as the age of first recruitment to the fishery. This choice facilitated comparisons with historic stock productivity but may be less representative of the current fishery selectivity. Since 1993, surplus production (biomass gains from growth and from recruitment, decremented by losses due to natural deaths) often exceeded fishery harvest yields, resulting in net population biomass increases (Figure 37). In 2009 to 2011, surplus production decreased substantially as growth of the 2003 year class slowed and gains from recruitment remained low but increased again, well above yield, in 2012 and 2013 due to the recruitment of the outstanding 2010 year class. Growth of fish is the dominant component of the biomass gain but recruitment accounts for significant portions when stronger year classes enter the population, e.g. the 2003 year class in 2005 and the 2010 year class in 2012 and (Figure 38). The biomass contributed by the 2003 and 2010 year classes, both when they recruited at age 2 and through growth during that year was greater than that of any other cohorts since 1969.

Shaded text has not been updated.
13
PRODUCTIVITY
Recruitment, as well as age structure, spatial distribution and fish growth reflect changes in the productive potential. Data to approximate the age composition of the catch from unit areas 5Zj and 5Zm during 1931 to 1955 were used to reconstruct a population analysis of EGB that was suitable for comparison of productivity to recent years (Gavaris and Van Eeckhaute 1997, Figure 32). The catch and survey age structure displays a broad representation of age groups, reflecting improving recruitment and lower exploitation since 1995 (Figure 9 and 19). Recruitment, while highly variable, has generally been higher when adult biomass has been above 40,000 mt (Figure 39). Since 1969, only the 1975, 1978, 2000, 2003, 2010, 2011 and 2013 year classes have been above the average abundance of 40.5 million age one fish of year classes observed during the period 1931-55. The recruits-per-adult biomass ratio has been highly variable since 1969. It was generally low during the 1980s but higher during the 1990s, comparable to the 1931-1955 period (Figure 40) when the 3+ biomass was above 40,000 mt. Since 2001, with the exception of 2003, 2010, 2011 and 2013, recruits per spawner have again been low. The very high 3+ biomass (greater than about 100,000 mt) observed since 2006 has produced two exceptional year class but has also produced four below average year classes (Figure 39). The spatial distribution patterns observed during the most recent bottom trawl surveys were similar to the average patterns over the previous ten years for the spring surveys. Consistent with the pattern observed for previous exceptional year-classes, the 2013 year-classwas widely distributed throughout the survey area, especially during the NMFS spring and fall surveys (Figure 16, 17 and 18). Fish condition as measured by Fulton’s K for ages 1 to 9, combined, derived from the DFO survey exhibits a declining trend since about 2001 and declined to its lowest value in 2014 (Figure 41). Except in 2009, the condition factor of haddock has been below the series average since 2003, similar to the trends in condition observed in Eastern Georges Bank cod and Georges Bank yellowtail flounder. Fish condition derived from the NMFS fall survey shows a similar decline (note that weights are available only since 1992 from this survey). The strong 2003 and 2010 year classes sometimes show much lower condition than the ages 1-9 average from the DFO survey. The increase in condition in fall 2008 and spring 2009 coincides with reports from the fishery of high sandlance abundance during this period (Pers. comm. Alain d’Entremont). Fulton’s K for the 2013 year class was very low in fall 2013 but improved in late winter of 2014. Condition of the 2010 year class in the fall has been increasing with each subsequent year and was above the series average in 2013. Both fishery and survey average lengths and weights at age have declined (Figure 10, 22 and 34) and the 2003 year class appears to have reached its maximum growth potential at a smaller size than previous year classes (Table 22 and Figure 42). Some year classes of low abundance like the 2005 and 2007 initially started out with high growth rates but growth rates decreased as they aged. The 2010 year class lengths at age 1 and 2 are less than the 2003 year class but similar at age 3 and 4 (Figure 42).
Shaded text has not been updated.
14
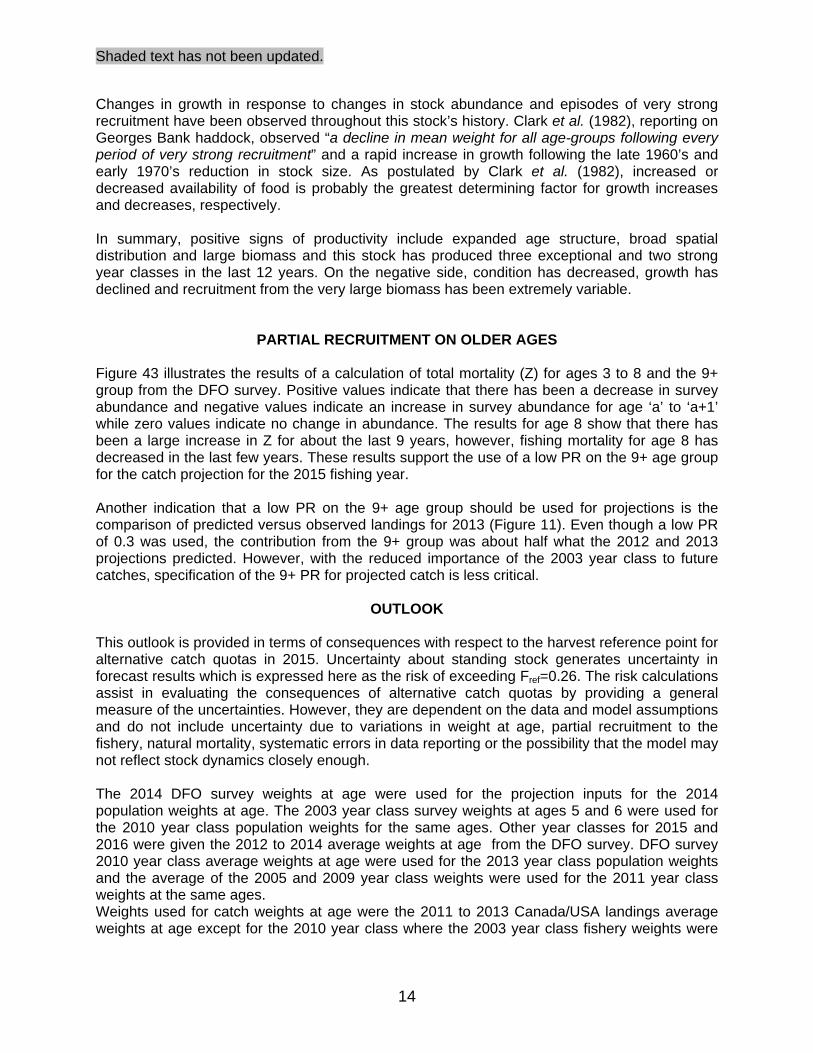
Changes in growth in response to changes in stock abundance and episodes of very strong recruitment have been observed throughout this stock’s history. Clark et al. (1982), reporting on Georges Bank haddock, observed “a decline in mean weight for all age-groups following every period of very strong recruitment” and a rapid increase in growth following the late 1960’s and early 1970’s reduction in stock size. As postulated by Clark et al. (1982), increased or decreased availability of food is probably the greatest determining factor for growth increases and decreases, respectively. In summary, positive signs of productivity include expanded age structure, broad spatial distribution and large biomass and this stock has produced three exceptional and two strong year classes in the last 12 years. On the negative side, condition has decreased, growth has declined and recruitment from the very large biomass has been extremely variable.
PARTIAL RECRUITMENT ON OLDER AGES Figure 43 illustrates the results of a calculation of total mortality (Z) for ages 3 to 8 and the 9+ group from the DFO survey. Positive values indicate that there has been a decrease in survey abundance and negative values indicate an increase in survey abundance for age ‘a’ to ‘a+1’ while zero values indicate no change in abundance. The results for age 8 show that there has been a large increase in Z for about the last 9 years, however, fishing mortality for age 8 has decreased in the last few years. These results support the use of a low PR on the 9+ age group for the catch projection for the 2015 fishing year. Another indication that a low PR on the 9+ age group should be used for projections is the comparison of predicted versus observed landings for 2013 (Figure 11). Even though a low PR of 0.3 was used, the contribution from the 9+ group was about half what the 2012 and 2013 projections predicted. However, with the reduced importance of the 2003 year class to future catches, specification of the 9+ PR for projected catch is less critical.
OUTLOOK This outlook is provided in terms of consequences with respect to the harvest reference point for alternative catch quotas in 2015. Uncertainty about standing stock generates uncertainty in forecast results which is expressed here as the risk of exceeding Fref=0.26. The risk calculations assist in evaluating the consequences of alternative catch quotas by providing a general measure of the uncertainties. However, they are dependent on the data and model assumptions and do not include uncertainty due to variations in weight at age, partial recruitment to the fishery, natural mortality, systematic errors in data reporting or the possibility that the model may not reflect stock dynamics closely enough. The 2014 DFO survey weights at age were used for the projection inputs for the 2014 population weights at age. The 2003 year class survey weights at ages 5 and 6 were used for the 2010 year class population weights for the same ages. Other year classes for 2015 and 2016 were given the 2012 to 2014 average weights at age from the DFO survey. DFO survey 2010 year class average weights at age were used for the 2013 year class population weights and the average of the 2005 and 2009 year class weights were used for the 2011 year class weights at the same ages. Weights used for catch weights at age were the 2011 to 2013 Canada/USA landings average weights at age except for the 2010 year class where the 2003 year class fishery weights were
Shaded text has not been updated.
15
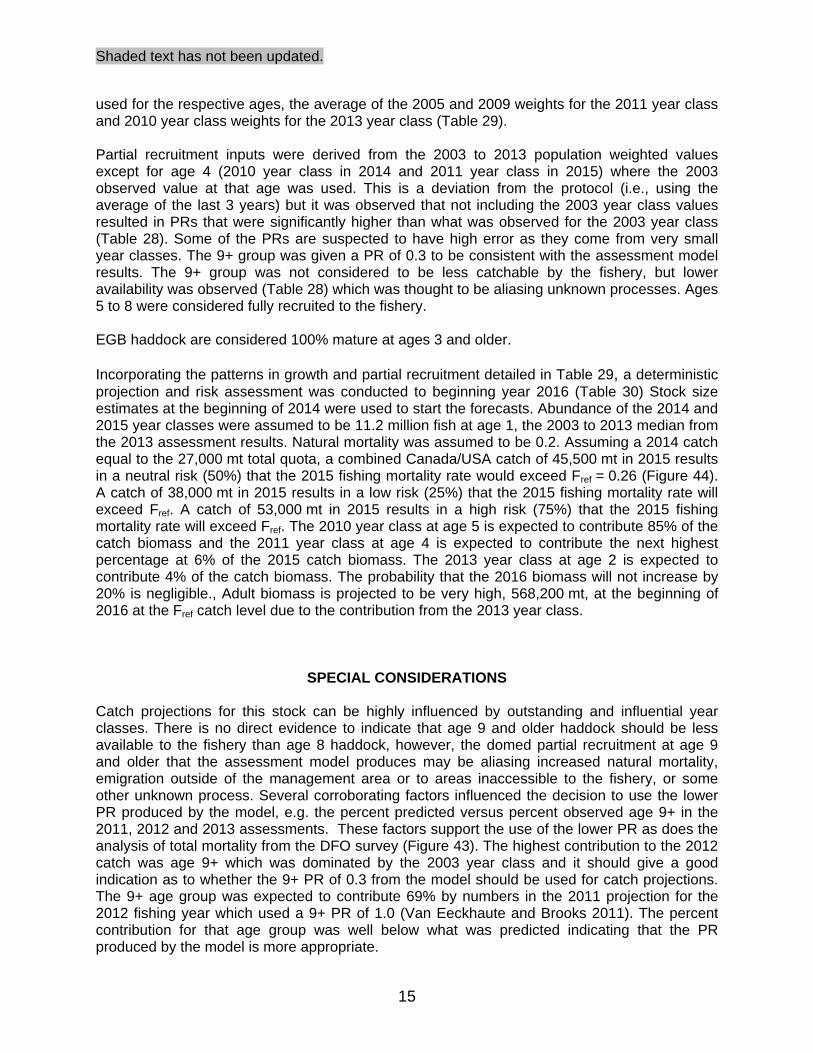
used for the respective ages, the average of the 2005 and 2009 weights for the 2011 year class and 2010 year class weights for the 2013 year class (Table 29). Partial recruitment inputs were derived from the 2003 to 2013 population weighted values except for age 4 (2010 year class in 2014 and 2011 year class in 2015) where the 2003 observed value at that age was used. This is a deviation from the protocol (i.e., using the average of the last 3 years) but it was observed that not including the 2003 year class values resulted in PRs that were significantly higher than what was observed for the 2003 year class (Table 28). Some of the PRs are suspected to have high error as they come from very small year classes. The 9+ group was given a PR of 0.3 to be consistent with the assessment model results. The 9+ group was not considered to be less catchable by the fishery, but lower availability was observed (Table 28) which was thought to be aliasing unknown processes. Ages 5 to 8 were considered fully recruited to the fishery. EGB haddock are considered 100% mature at ages 3 and older. Incorporating the patterns in growth and partial recruitment detailed in Table 29, a deterministic projection and risk assessment was conducted to beginning year 2016 (Table 30) Stock size estimates at the beginning of 2014 were used to start the forecasts. Abundance of the 2014 and 2015 year classes were assumed to be 11.2 million fish at age 1, the 2003 to 2013 median from the 2013 assessment results. Natural mortality was assumed to be 0.2. Assuming a 2014 catch equal to the 27,000 mt total quota, a combined Canada/USA catch of 45,500 mt in 2015 results in a neutral risk (50%) that the 2015 fishing mortality rate would exceed Fref = 0.26 (Figure 44). A catch of 38,000 mt in 2015 results in a low risk (25%) that the 2015 fishing mortality rate will exceed Fref. A catch of 53,000 mt in 2015 results in a high risk (75%) that the 2015 fishing mortality rate will exceed Fref. The 2010 year class at age 5 is expected to contribute 85% of the catch biomass and the 2011 year class at age 4 is expected to contribute the next highest percentage at 6% of the 2015 catch biomass. The 2013 year class at age 2 is expected to contribute 4% of the catch biomass. The probability that the 2016 biomass will not increase by 20% is negligible., Adult biomass is projected to be very high, 568,200 mt, at the beginning of 2016 at the Fref catch level due to the contribution from the 2013 year class.
SPECIAL CONSIDERATIONS Catch projections for this stock can be highly influenced by outstanding and influential year classes. There is no direct evidence to indicate that age 9 and older haddock should be less available to the fishery than age 8 haddock, however, the domed partial recruitment at age 9 and older that the assessment model produces may be aliasing increased natural mortality, emigration outside of the management area or to areas inaccessible to the fishery, or some other unknown process. Several corroborating factors influenced the decision to use the lower PR produced by the model, e.g. the percent predicted versus percent observed age 9+ in the 2011, 2012 and 2013 assessments. These factors support the use of the lower PR as does the analysis of total mortality from the DFO survey (Figure 43). The highest contribution to the 2012 catch was age 9+ which was dominated by the 2003 year class and it should give a good indication as to whether the 9+ PR of 0.3 from the model should be used for catch projections. The 9+ age group was expected to contribute 69% by numbers in the 2011 projection for the 2012 fishing year which used a 9+ PR of 1.0 (Van Eeckhaute and Brooks 2011). The percent contribution for that age group was well below what was predicted indicating that the PR produced by the model is more appropriate.
Shaded text has not been updated.
16
In 2015, most of the exceptional 2013 year class will be below the current minimum size regulation used by the US, which could lead to significant discarding. This is not expected to be an issue in the Canadian fishery due to the different gear types and management measures. Cod and haddock are often caught together in groundfish fisheries, although their catchabilities to the fisheries differ and they are not necessarily caught in proportion to their relative abundance. With current fishing practices and catch ratios, the achievement of rebuilding objectives for cod may constrain the harvesting of haddock. Modifications to fishing gear and practices, with enhanced monitoring, may mitigate these concerns. The table in Appendix A summarizes the performance of the management system. It reports the TRAC advice, expected beginning of year 3+ biomass in the year following the catch year, the TMGC quota decision, actual catch, and realized stock conditions for this stock. Fishing mortality and trajectory of age 3+ biomass from the assessment following the catch year are compared to results from this assessment. These comparisons were kindly provided in 2011 by Tom Nies (staff member of the New England Fishery Management Council, NEFMC) and updated for this assessment. The largest differences in expected and actual results occurred when projection inputs for partial recruitment and weights at age for large dominant year classes (i.e., 2000 and 2003) were higher than the realized values. When year class specific input values were used, expected and actual results were similar. These results indicate that stock biomass is being adequately estimated by the model for management purposes, but, misspecification of partial recruitment and weights at age, especially of very large and influential year classes, can result in higher than expected fishing mortality due to catch advice being set too high.
ACKNOWLEDGEMENTS G. Donaldson and D. Frotten of DFO and at sea observers from Javitech Ltd. provided samples from the Canadian fishery. D. Knox and S. Sutherland provided ageing information for the DFO and NMFS surveys and Canadian and USA fisheries. We thank members of the fishing industry who spent time to discuss their experiences in the fishery. We also thank NMFS reviewers for their suggestions to improve the document.
LITERATURE CITED Brooks, E.N., T.J. Miller, C.M. Legault, L. O’Brien, K.J. Clark, S. Gavaris, and L. Van Eeckhaute.
2010. Determining length-based calibration factors for cod, haddock, and yellowtail flounder. TRAC Ref. Doc. 2010/08: 25 p.
Clark, S.H., W.J. Overholtz, and R.C. Hennemuth. 1982. Review and assessment of the
Georges Bank and Gulf of Maine haddock fishery. J. Northw. Atl. Fish. Sci. 3: 1-27. DFO. 2002. Development of a sharing allocation proposal for transboundary resources of cod,
haddock and yellowtail flounder on Georges Bank. DFO Mar. Prov., Reg. Fish. Manag. Rep. 2002/01:59 p.
Efron, B., and R.J. Tibshirani. 1993. An Introduction to the Bootstrap. Chapman & Hall. New
York. 436p.

Shaded text has not been updated.
17
Forrester, J.R.S., C.J. Byrne, M.J. Fogarty, M.P. Sissenwine, and E.W. Bowman. 1997. Background papers on USA vessel, trawl, and door conversion studies. SAW/SARC 24 Working Paper Gen 6. Northeast Fish. Sci. Cent., Woods Hole, MA.
Gavaris, S. 1988. An adaptive framework for the estimation of population size. CAFSAC Res.
Doc. 88/29: 12 p. Gavaris, S., and L. Van Eeckhaute. 1997. Assessment of haddock on eastern Georges Bank.
DFO CSAS Res. Doc. 97/54: 72 p Gavaris, S., and L. Van Eeckhaute. 1998. Assessment of haddock on eastern Georges Bank.
DFO CSAS Res. Doc. 98/66: 75 p. Gavaris, S., A. Glass, and I. Jonsen. 2008. Discards of Atlantic cod, haddock and yellowtail
flounder from the 2007 Canadian scallop fishery on Georges Bank. TRAC Ref. Doc. 2008/04: 6p.
Gavaris, S., G. Robert, and L. Van Eeckhaute. 2007. Discards of Atlantic cod, haddock and
yellowtail flounder from the 2005 and 2006 Canadian scallop fishery on Georges Bank. TRAC Ref. Doc. 2007/03: 10 p.
Gavaris, S., J. Sameoto, A. Glass, and I. Jonsen. 2009. Discards of Atlantic cod, haddock and
yellowtail flounder from the 2008 Canadian scallop fishery on Georges Bank. TRAC Ref. Doc. 2009/05: 25p.
O’Boyle, R.N. (Chair). 1998. Proceedings of the Transboundary Resource Assessment
Committee; 20-24 April 1998. CSAS Proc. Ser. 98/10: 49p. Overholtz, W.J., S.H. Clark, and D.Y. White. 1983. A review of the status of the Georges Bank
and Gulf of Maine haddock stocks for 1983. Woods Hole Lab. Ref. Doc. 83-23, NOAA, NMFS, p.1-33.
Palmer, M. 2008. A Method to Apportion Landings with Unknown Area, Month and Unspecified
Market Categories Among Landings with Similar Region and Fleet Characteristics. Groundfish Assessment Review Meeting (GARM III-Biological Reference Points Meeting). Working Paper 4.4. 9 p.
Rivard, D. 1980. Back-calculating production from cohort analysis, with discussion on surplus
production for two redfish stocks. CAFSAC Res. Doc. 80/23: 26 p. Schuck, H.A. 1951. Studies of Georges Bank haddock, Part I: Landings by pounds, numbers
and sizes of fish. Fish. Bull. U.S., 52: 151-176. TMGC. 2003. Transboundary Management Guidance Committee Guidance Document 2003/1:
7 p. Van Eeckhaute, L. and E.N. Brooks. 2011. Assessment of eastern Georges Bank haddock for
2011. TRAC Ref. Doc 2011/03: 104 p. Van Eeckhaute, L. and E.N. Brooks. 2013. Assessment of eastern Georges Bank haddock for
2013. TRAC Ref. Doc 2013/#: 91 p.

Shaded text has not been updated.
18
Van Eeckhaute, L, E.N. Brooks, and S.C. Hansen. 2012. Assessment of eastern Georges Bank
haddock for 2012. TRAC Ref. Doc. 2012/01: 98 p Van Eeckhaute, L., L. Brooks, and M. Traver. 2009. Assessment of eastern Georges Bank
haddock for 2009. TRAC Ref. Doc. 2009/02: 96 p. Van Eeckhaute, L., and S. Gavaris. 2006. Estimation of cod, haddock and yellowtail flounder
discards from the Canadian Georges Bank scallop fishery for 2005. TRAC Reference Document - 2006/04; 6p
Van Eeckhaute, L., S. Gavaris, and H. Stone. 2005. Estimation of cod, haddock and yellowtail
flounder discards from the Canadian Georges Bank scallop fishery from 1960 to 2004. DFO TRAC Ref. Doc. 2005/02: 21 p.
Van Eeckhaute, L., J. Sameoto and A. Glass. 2010. Discards of Atlantic cod, haddock and
yellowtail flounder from the 2009 Canadian scallop fishery on Georges Bank. TRAC Ref. Doc. 2010/10: 7p.
Van Eeckhaute, L., Y. Wang, J. Sameoto and A. Glass. 2011. Discards of Atlantic cod, haddock
and yellowtail flounder from the 2010 Canadian scallop fishery on Georges Bank. TRAC Ref. Doc. 2011/05 (in prep.). 14p.
Waiwood, K.G., and J.D. Neilson. 1985. The 1985 assessment of 5Ze haddock. CAFSAC Res.
Doc. 85/95:49 p. Wigley S.E., P. Hersey, and J.E. Palmer. 2008a. A Description of the Allocation Procedure
Applied to the 1994 to 2007 Commercial Landings Data. US Dept. Commer., Northeast Fish. Sci. Cent. Ref. Doc. 08-18; 61 p.
Wigley, S.E., M.C. Palmer, J. Blaylock, and P.J. Rago. 2008b. A Brief Description of the Discard
Estimation for the National By-Catch Report. Northeast Fish. Sci. Cent. Ref. Doc. 08-02; 35 p.

Shaded text has not been updated.
19
Table 1. Nominal catches (mt) of haddock from eastern Georges Bank (EGB) during 1969-2013. For “Other” it was assumed that 40% of the total 5Z catch was in EGB. USA landings and 1989 to 2007 USA discards were revised (Van Eeckhaute et al. 2009). Canadian discards are from the scallop fishery and USA discards are from the groundfish fishery.
Landings Discards Totals Quotas Year Canada USA Other Canada USA Canada USA Catch Canadian USA2
1969 3941 6624 695 123 4064 6624 11382 1970 1970 3154 357 116 2086 3154 5597 1971 1610 3533 770 111 1721 3533 6024 1972 609 1551 502 133 742 1551 2795 1973 1565 1397 396 98 1663 1397 3455 1974 462 955 573 160 757 622 1712 2907 1975 1353 1705 29 186 1539 1705 3273 1976 1355 974 24 160 1515 974 2513 1977 2871 2428 151 2966 3022 5394 8416 1978 9968 4725 177 1556 10145 6281 16426 1979 5080 5213 186 5266 5213 10479 1980 10017 5615 151 7561 10168 13176 23344 1981 5658 9081 177 5835 9081 14916 1982 4872 6286 130 5002 6286 11287 1983 3208 4453 119 3327 4453 7780 1984 1463 5121 124 1587 5121 6708 1985 3484 1684 186 3670 1684 5354 1986 3415 2201 92 3507 2201 5708 1987 4703 1418 138 4841 1418 6259 1988 40461 1694 151 4197 1694 5891 1989 3060 785 138 137 3198 922 4121 1990 3340 1189 128 76 3468 1265 4732 1991 5456 931 117 0 5573 931 6504 1992 4058 1629 130 9 4188 1638 5826 5000 1993 3727 424 114 106 3841 530 4371 5000 1994 2411 24 114 1279 2525 1302 3827 3000 1995 2065 15 69 0 2134 16 2150 2500 1996 3663 26 52 5 3715 31 3746 4500 1997 2749 55 60 1 2809 56 2865 3200 1998 3371 271 102 0 3473 271 3744 3900 1999 3681 359 49 5 3729 364 4093 3900 2000 5402 340 29 3 5431 343 5774 5400 2001 6774 762 39 22 6813 784 7597 6989 2002 6488 1090 29 16 6517 1106 7623 6740 2003 6775 1677 98 96 6874 1772 8646 6933 2004 9745 1847 93 235 9838 2081 11919 9900 5100 2005 14484 649 49 76 14533 724 15257 15410 7590 2006 11984 313 58 275 12043 588 12630 14520 7480 2007 11890 2563 58 3063 11948 562 12510 12730 6270 2008 14781 11383 33 523 14814 1190 16003 14950 8050 2009 17595 21523 53 553 17648 2208 19855 18900 11100 2010 16578 2167 15 34 16593 2201 18794 17612 11988 2011 11232 1322 16 87 11248 1409 12656 12540 9460 2012 5034 443 30 126 5064 569 5633 9120 6880 2013 4621 344 10 91 4631 435 5066 6448 3952 1 1895 mt excluded because of suspected area misreporting. 2The USA quota pertains to the USA fishing year of May 1 to Apr. 30 while the USA catches reported in this table pertain to the calendar year. 3USA landings and discards revised in 2011.

Shaded text has not been updated.
20
Table 2. Regulatory measures implemented for the 5Z and eastern Georges Bank (EGB) fishery management units by the United States (USA) and Canada, respectively, from 1977, when jurisdiction was extended to 200 miles for coastal states, to the present.
Year USA Canada 1977-82 Mesh size of 5 1/8” (140 mm), seasonal
spawning closures, quotas and trip limits.
1982-85 All catch controls eliminated, retained closed area and mesh size regulations, implemented minimum landings size (43 cm).
First 5Ze assessment in 1983.
Oct.1984 Implementation of the ‘Hague’ line, the boundary between Canada and the USA. 1985 5 ½” mesh size, Areas 1 and 2 closed
February-May.
1989 Combined cod-haddock-pollock quota for 4X-5Zc
1990 EGB adopted as management unit. For mobile gear (MG) < 65 ft. – trip limits with a 30% by-catch of haddock to a maximum of 8 trips of 35,000 lbs per trip between June 1 and Oct. 31 and minimum square mesh size 130 mm. Fixed gear required to use large hooks until June
1991 Established overfishing definitions for haddock.
MG < 65 ft similar to 1990 but diamond mesh size increased to minimum 145 mm.
1992 Introduction of Individual Transferable Quotas (ITQ) and dockside monitoring. Total allowable catch (TAC) = 5000 mt.
1993 Area 2 closure in effect from Jan 1-June30. Otter trawl (OT) fishery permitted to operate in Jan. and Feb. Increase in use of square mesh, minimum 130 mm). TAC = 5000 mt.
1994
Jan.: Expanded Area 2 closure to include June and increased extent of area. Area 1 closure not in effect. 500 lb trip limit. Catch data obtained from mandatory log books combined with dealer reports (replaces interview system). May: 6” mesh restriction. Dec.: Area 1,2 closed year-round.
Spawning closure extended to Jan. 1 to May 31. Fixed gear vessels must choose between 5Z or 4X for the period of June to September. Small fish protocol. Increased at sea monitoring. OT > 65 could not begin fishing until July 1. Predominantly square mesh, minimum 130 mm by end of year. TAC = 3000 mt.
1995 All OT vessels using square mesh, mimimum 130 mm. Fixed gear vessels with a history since 1990 of 25t or more for 3 years of cod, haddock, pollock, hake or cusk combined can participate in 5Z fishery. ITQ vessels require at least 2t of cod and 8t of haddock quota to fish Georges. TAC = 2500 mt. Restrictions on catching of cod and haddock under 43 cm (small fish protocol).
1996 July: Additional Days-at-Sea restrictions, trip limit raised to 1000 lbs.
Fixed gear history requirement dropped. TAC = 4500 mt.

Shaded text has not been updated.
21
Year USA Canada 1997 May: Additional scheduled Days-at-sea
restrictions. September: Trip limit raised to 1000 lbs/day, maximum of 10,000 lbs/trip.
All OT vessels using square mesh, mimimum 130 mm. Vessels over 65 ft operated on enterprise allocations, otter trawlers under 65 ft on individual quotas, fixed gear vessels 45-65 ft on self-administered individual quotas and fixed gear vessels under 45 ft on community quotas administered by local boards. TAC = 3,200 mt.
1998 Sept. 1: Trip limit raised to 3000 lbs/day, maximum of 30,000 lbs/trip.
All OT vessels using square mesh, mimimum 130 mm. Fixed gear vessels 45-65 ft operated on individual quotas. TAC = 3,900 mt.
1999 May 1: Trip limit 2,000 lbs/day, max. 20,000 lbs/trip. Square mesh size increased to 6.5” (diamond is 6”). June 15: Scallop exemption fishery in Closed Area II. Nov. 5: Trip limit 5,000 lbs/day, max. 50,000 lbs/trip.
All OT vessels using square mesh, mimimum 130 mm. TAC = 3,900 mt.; mandatory cod separator panel when no observer on board.
2000 October: Daily trip limit suspended to April 2001but retained max. trip limit of 50,000 lbs/trip.
All OT vessels using square mesh, mimimum 130 mm. TAC = 5,400 mt.
2001-2002
Day and trip limit adjustments. Daily trip limit suspended July 5, 2002.
All OT vessels using square mesh, mimimum 130 mm. TAC = 6,989 and 6,740 mt for 2001 and 2002 respectively.
2002-2003
30,000 – 50,000 lb/trip limit. Trip limit suspended in Oct. 2003.
All OT vessels using square mesh, mimimum 130 mm. TAC = 6,933 mt for 2003.
Canada – USA Resource Sharing Agreement on Georges Bank 2004 May 1, day and trip limits removed. Quota
management introduced. TAC1 = 5,100 mt. Oct. 1: unit areas 561 and 562 closed to groundfish vessels. Nov. 19: Special Access Program (SAP) for haddock opened. Dec. 31: Haddock SAP closed.
All OT vessels using square mesh, mimimum 130 mm. TAC = 9,900 mt.
2005 TAC1= 7,590 mt. Jan. 14: separator trawl required. Fishery was closed in August when cod by-catch quota reached.
All OT vessels using square mesh, mimimum 130 mm. TAC = 15,410 mt; exploratory winter fishery Jan. to Feb. 18, 2005.
2006 TAC1= 7,480 mt; EGB area closed to USA fishery in first half of year when USA cod quota nearly reached.
All OT vessels using square mesh, mimimum 130 mm. TAC = 14,520 mt; exploratory winter fishery Jan. to Feb. 6, 2006.
2007 TAC1=6,270 mt. June 20: EGB area closed to USA fishery due to USA cod catch nearing quota. August 9: Minimum haddock size reduced to 18 inches; October 20: EGB area opened to USA fishery.
All OT vessels using square mesh, mimimum 130 mm. TAC = 12,730 mt; exploratory winter fishery Jan. to Feb. 15, 2007

Shaded text has not been updated.
22
Year USA Canada 2008 TAC1=8,050 mt. Minimum size reverts back
to 19 in. in August. Prohibitions on yellowtail flounder fishing Jan 24 to April 30. Trawl fishery opening delayed until Aug. 1. Ruhle trawl (type of separator trawl) approved for use beginning Sept 15. Restrictions on cod catches.
All OT vessels using square mesh, mimimum 130 mm. TAC = 14,950 mt; winter fishery Jan. 1, to Feb. 8, 2008.
2009 TAC1=11,100 mt. May 1: Interim action by NMFS set the minimum size at 18 inches.
All OT vessels using square mesh, mimimum 130 mm. TAC = 18,900 mt; winter fishery Jan. 1 to Feb. 7, 2009. Industry test fishery/survey in deep water in February to assess spawning condition of haddock in deep water. Test fishery terminated after 2 trips.
2010 TAC1=11,988 mt May 1, 2010: Sector Management with Annual Catch Entitlements (ACEs) and accountability measures implemented (Amendment 16). Minimum haddock size limit set to 18 inches. All legal size fish must be retained by sector vessels.
All OT vessels using square mesh, mimimum 130 mm. TAC = 17,612 mt; winter fishery Jan. 1 to Feb. 7, 2010
2011 TAC1=9,460 mt All OT vessels using square mesh, mimimum 130 mm. TAC = 12,540 mt; winter fishery Jan. 1 to Feb. 6, 2011
2012 TAC1=6,880 mt All OT vessels using square mesh, minimum 130 mm. TAC = 9,120 mt; winter fishery Jan. 1 to Feb. 4, 2012
2013 TAC1=3,952 mt July: Minimum size reduced from 18” to 16”
TAC = 10,400 mt; winter fishery Jan. 1 to Feb. 4, 2013. All OT vessels using square mesh, minimum 130 mm.
2014 TAC = 27,000 mt; winter fishery Jan. 1 to Feb. 3, 2014. Experimental use of 145 mm diamond mesh in winter fishery. Starting in June, 145 mm diamond use continued and experimental use of 125 mm square. Continued use of 130 mm square.
1For fishing year from May 1 to April 30

Shaded text has not been updated.
23
Table 3. Canadian landings (mt) of haddock from eastern Georges Bank during 1969-2013 by gear category and tonnage class for principal gears.
Year Otter Trawl
Longline Scallop Fishery
Other Total Side
Stern 2 3 4 5 Total1 2 3 Total1
1969 777 0 1 225 2902 3127 2 21 23 15 0 39411970 575 2 0 133 1179 1314 6 72 78 2 1 19701971 501 0 0 16 939 955 18 129 151 3 0 16101972 148 0 0 2 260 263 23 169 195 1 2 6091973 633 0 0 60 766 826 23 80 105 0 1 15651974 27 0 6 8 332 346 29 59 88 1 0 4621975 222 0 1 60 963 1024 25 81 107 0 0 13531976 217 0 2 59 905 967 48 108 156 0 15 13551977 370 92 243 18 2025 2378 43 51 94 1 28 28711978 2456 237 812 351 5639 7039 121 47 169 17 287 99681979 1622 136 858 627 1564 3185 190 80 271 2 0 50801980 1444 354 359 950 6254 7917 129 51 587 4 65 100171981 478 448 629 737 2344 4159 331 99 1019 1 1 56581982 115 189 318 187 3341 4045 497 187 712 0 0 48721983 106 615 431 107 1130 2283 593 195 815 1 3 32081984 5 180 269 21 149 620 614 192 835 2 1 14631985 72 840 1401 155 348 2745 562 33 626 2 39 34841986 51 829 1378 95 432 2734 475 98 594 4 32 34151987 48 782 1448 49 1241 3521 854 113 1046 38 50 470319882 72 1091 1456 186 398 3183 428 200 695 16 80 40461989 0 489 573 376 536 1976 713 175 977 12 95 30601990 0 928 890 116 471 2411 623 173 853 7 69 33401991 0 1610 1647 81 689 4028 900 271 1309 8 111 54561992 0 797 1084 56 645 2583 984 245 1384 4 87 40581993 0 535 1179 67 699 2489 794 156 1143 2 93 37271994 0 495 911 79 112 1597 498 47 714 9 91 24111995 0 523 896 14 214 1647 256 75 390 7 21 20651996 1 836 1405 166 270 2689 561 107 947 0 26 36631997 0 680 1123 91 96 1991 501 116 722 0 36 27491998 0 863 1340 98 71 2422 570 252 921 0 28 33711999 0 954 1471 174 145 2761 486 241 887 0 32 36802000 0 1313 2269 230 246 4146 619 258 1186 0 70 54022001 0 1564 2555 0 757 5112 754 302 1633 0 29 67742002 0 1217 2720 0 657 4954 794 151 1521 0 12 64882003 0 1186 3246 0 0 4985 806 249 1776 0 14 67752004 0 2152 4651 0 67 7744 716 223 2000 0 1 97452005 0 2929 7393 326 0 12115 646 78 2368 0 1 144842006 0 1805 6076 601 0 10088 491 84 1896 0 1 119842007 0 1982 6112 159 0 10034 363 28 1854 0 1 118902008 0 2413 7894 0 0 12615 532 0 2164 0 2 147812009 0 3112 9884 27 0 15407 585 0 2185 0 3 175952010 0 2645 8921 661 0 14100 544 0 2476 0 2 165782011 0 1606 6432 113 0 9664 413 0 1566 0 1 112322012 0 744 2819 29 0 4201 180 0 832 0 1 50342013 0 647 3030 42 0 4348 24 0 272 0 1 4621
1 Total includes catches for tonnage classes which are not listed. 2 Catches in 1988 of 26t, 776t, 1091t and 2t for side otter trawlers and stern otter trawlers tonnage classes 2, 3 and 5 respectively were excluded because of suspected area misreporting.

Shaded text has not been updated.
24
Table 4. Monthly landings (mt) of haddock by Canada from eastern Georges Bank during 1969-2013.
Year Jan Feb Mar Apr May Jun Jul Aug Sep Oct Nov Dec Total1969 105 74 6 291 588 691 559 580 551 360 102 34 39411970 2 105 0 1 574 345 103 456 242 103 26 12 19701971 0 9 1 0 400 132 283 278 97 246 141 21 16101972 0 119 2 0 2 111 84 116 98 68 7 2 6091973 4 10 0 0 0 184 198 572 339 232 22 4 15651974 19 0 1 0 0 58 63 53 96 61 92 19 4621975 4 14 0 0 0 166 256 482 100 166 118 45 13531976 0 7 62 68 60 587 152 190 186 26 9 7 13551977 102 177 7 0 23 519 1059 835 13 59 56 22 28711978 104 932 44 22 21 319 405 85 642 5433 1962 0 99681979 123 898 400 175 69 1393 885 396 406 261 53 22 50801980 38 134 14 29 223 2956 2300 965 1411 1668 104 176 100171981 38 481 568 4 254 1357 1241 726 292 82 378 239 56581982 129 309 1 11 46 1060 769 682 585 837 398 44 48721983 32 67 29 47 60 1288 387 483 526 195 88 6 32081984 3 5 81 88 73 433 219 254 211 71 25 0 14631985 1 11 33 99 26 354 392 1103 718 594 61 93 34841986 11 28 79 99 40 1339 1059 369 233 139 12 8 34151987 24 26 138 70 12 1762 1383 665 405 107 97 14 470319881 39 123 67 79 15 1816 1360 315 130 65 13 24 40461989 33 94 48 7 20 1398 356 566 141 272 108 18 30601990 35 14 50 0 7 1178 668 678 469 199 18 22 33401991 144 166 49 26 21 1938 1004 705 566 576 123 137 54561992 118 205 97 152 36 1381 619 414 398 401 209 28 40581993 468 690 96 78 25 723 505 329 202 198 230 183 37271994 3 3 1 2 0 398 693 373 375 220 211 133 24111995 5 1 1 1 0 762 327 290 281 109 197 93 20651996 0 0 0 0 0 1067 672 706 359 278 191 391 36631997 0 0 0 0 0 328 751 772 426 190 116 166 27491998 0 0 0 0 0 687 420 580 707 542 164 271 33711999 37 0 0 0 0 898 975 562 573 295 269 70 36812000 1 0 0 0 0 1368 1175 1026 848 658 175 150 54022001 0 0 0 0 0 971 1335 930 1267 1075 647 548 67742002 0 0 0 0 0 572 1703 983 1364 820 593 452 64882003 0 0 0 0 0 840 1767 1290 930 952 676 320 67752004 0 0 0 0 0 1547 2268 2109 1753 1275 556 236 97452005 1025 1182 0 0 13 1423 3004 3820 2199 1198 357 266 144842006 1176 381 0 0 0 1093 2433 2668 2211 1149 558 316 119842007 1100 454 0 0 0 1432 3034 2510 1916 991 231 222 118902008 1867 1604 0 0 0 1640 2539 2446 2382 1314 645 343 147812009 2977 947 0 0 0 2217 1996 2889 2479 2191 1239 659 175952010 2391 574 0 0 0 1861 2893 3809 2257 1572 692 530 165782011 1954 466 0 0 0 941 2074 2554 1751 931 299 262 112322012 692 634 0 0 0 583 949 1077 490 419 61 128 50342013 843 185 0 0 0 193 50 350 939 1004 488 569 46211 Catches in 1988 of 3t, 1846t and 46t for Jan., Feb., and Mar., respectively for otter trawlers were excluded because of suspected area misreporting

Shaded text has not been updated.
25
Table 5. Prorated discards (kg) and fishing effort (hr) for eastern Georges Bank haddock from the observed trips of the Canadian scallop fishery in December 2012 to January 2014. Note that there were no observed trips in Dec 2012. Effort hours are in hours x meters.
Trip ID Board Date Land Date Proration
Effort (hrs x m) Dredges Discards (kg)
Obs. Total Prop. Observed Prorated
T2013-01 2013-01-28 2013-02-08 283 498 0.57 53 93 1212 T2013-02 2013-02-11 2013-03-04 678 1270 0.53 43 81 2556 T2013-03 2013-02-16 2013-03-04 502 981 0.51 11 21 1491 T2013-04 2013-03-22 2013-04-04 555 1031 0.54 123 228 1656 T2013-05 2013-03-27 2013-04-04 226 402 0.56 39 69 626 T2013-06 2013-04-04 2013-04-19 581 1192 0.49 115 236 1791 T2013-07 2013-04-17 2013-04-26 232 432 0.54 4 7 969 T2013-08 2013-05-19 2013-05-28 135 261 0.52 2 4 596 T2013-09 2013-05-25 2013-06-05 304 584 0.52 11 21 856 T2013-10 2013-06-18 2013-06-27 174 328 0.53 2 4 768 T2013-11 2013-07-08 2013-07-20 528 998 0.53 0 0 1526 T2013-12 2013-07-21 2013-08-02 616 1138 0.54 4 7 1526 T2013-13 2013-08-21 2013-08-30 261 495 0.53 33 63 1060 T2013-14 2013-08-22 2013-09-05 681 1341 0.51 17 33 1837 T2013-15 2013-10-16 2013-10-31 837 1533 0.55 170 311 1838 T2013-16 2013-10-18 2013-10-24 172 254 0.68 14 21 634 T2013-17 2013-10-20 2013-11-04 521 1028 0.51 77 152 1399 T2014-01 2014-01-24 2014-01-27 37 65 0.57 8 14 207

Shaded text has not been updated.
26
Table 6. Haddock discards from the Canadian scallop fishery on Georges Bank for 2013 calculated using a 3-month moving window to estimate discard rates. The discard rates for Jan and Dec are calculated by including observed trips from Dec 2012 and Jan 2014, respectively. Note that there were several months with no observed trips. Effort hours are in hours x meters.
Year Month Prorated Discards
Observed Effort
(hrs x m)
Discard Rate
(kg/hr x m)
Fleet Effort
(hrs x m)
Discards (mt)
Cumulative Annual
Discards (mt)
2012 Dec1 0 0 2013 Jan1 0 0 0.037 406 0.015 0.015 Feb 195 5259 0.065 7800 0.510 0.525 Mar 298 2282 0.072 12364 0.884 1.409 Apr 243 2760 0.087 25684 2.240 3.649 May 25 1452 0.055 26694 1.459 5.108 Jun 4 768 0.007 18757 0.129 5.236 Jul 7 3052 0.016 21088 0.337 5.573 Aug 96 2897 0.017 32794 0.570 6.143 Sep1 0 0 0.086 27609 2.366 8.509 Oct 484 3871 0.125 11823 1.478 9.987 Nov1 0 0 0.125 2213 0.277 10.264 Dec1 0 0 0.068 733 0.050 10.3142014 Jan 14 207 1No observed trips in December 2012 and January, September, November and December 2013.

Shaded text has not been updated.
27
Table 7. Monthly landings (mt) of haddock by the United States from eastern Georges Bank during 1969-2013. An allocation algorithm was applied to landings from 1994 to 2013 to determine area fished (Wigley et al. 2008a).
Year Jan Feb Mar Apr May Jun Jul Aug Sep Oct Nov Dec Total1969 525 559 976 1826 670 810 204 219 249 226 203 157 66241970 169 219 242 375 608 374 324 333 179 219 61 50 31541971 155 361 436 483 668 503 338 152 147 165 58 68 35331972 150 196 91 90 239 261 97 164 84 63 52 64 15511973 90 111 77 85 139 365 217 196 37 3 22 55 13971974 135 70 47 70 122 160 165 43 27 6 19 91 9551975 152 123 32 116 388 489 138 95 57 24 52 39 17051976 116 147 84 106 323 162 7 6 5 2 3 13 9741977 75 211 121 154 374 372 434 191 73 52 146 226 24281978 336 437 263 584 752 750 467 221 245 426 194 49 47251979 274 329 352 548 766 816 588 659 224 202 282 172 52131980 632 1063 742 784 711 461 324 254 221 91 110 222 56151981 551 1852 634 628 882 1327 1233 873 321 284 242 255 90811982 425 755 502 348 719 1805 757 145 201 216 276 138 62861983 492 931 272 181 310 1145 231 178 187 110 227 190 44531984 540 961 366 281 627 1047 370 303 250 196 92 89 51211985 165 190 254 300 352 206 60 47 1 24 41 43 16831986 184 396 334 479 496 221 31 6 12 6 6 29 22011987 225 52 43 307 233 342 67 30 24 4 23 68 14181988 196 152 207 245 366 316 30 19 6 1 45 110 16941989 114 56 47 164 161 145 15 8 1 5 25 46 7851990 148 21 155 274 214 306 23 3 5 5 16 19 11891991 105 28 76 133 89 434 1 20 6 0 19 19 9311992 253 81 51 149 353 669 20 20 17 3 2 12 16291993 15 12 16 55 88 209 6 3 3 7 2 8 4241994 0 1 1 3 1 1 12 1 0 1 1 2 241995 1 1 3 4 2 3 1 0 0 0 1 0 151996 2 1 2 3 7 3 3 2 1 1 1 1 261997 5 4 3 4 11 6 2 1 9 4 2 6 551998 5 19 23 29 31 50 21 17 39 22 1 15 2711999 35 15 30 52 71 62 23 18 28 0 0 22 3592000 6 13 89 48 42 22 21 15 24 2 17 42 3402001 42 9 228 146 81 97 51 12 8 38 21 31 7622002 92 105 91 150 272 175 66 46 17 42 11 24 10902003 94 24 86 506 310 319 57 17 4 51 40 169 16772004 97 21 174 725 101 349 256 26 57 5 5 31 184720051 2 0 45 34 210 158 103 93 0 0 1 2 64920061 1 0 0 23 192 87 0 7 0 0 1 3 31320071 1 0 5 71 43 60 3 0 0 25 47 0 25620081 0 0 6 26 31 80 47 92 65 153 98 539 11382009 13 4 41 677 30 109 38 458 140 31 195 418 21522010 130 13 281 503 100 76 16 367 193 118 224 147 21672011 75 70 110 341 165 150 76 123 40 34 43 93 13222012 50 10 30 112 113 48 17 4 20 18 5 17 4432013 23 4 9 28 11 9 29 40 29 34 43 84 3441Restrictions placed on USA fishery in eastern Georges Bank due to bycatch limitations.

Shaded text has not been updated.
28
Table 8. United States landings (mt) of haddock from eastern Georges Bank during 1969-2013 by gear category and tonnage class. An allocation algorithm was applied to landings from 1994 to 2013 to determine area fished (Wigley et al. 2008a).
Year Otter Trawl
Other Total 3 4
1969 3013 3610 0 6624 1970 1602 1551 0 3154 1971 1760 1768 0 3533 1972 861 690 0 1551 1973 638 759 0 1397 1974 443 512 0 955 1975 1025 679 0 1705 1976 671 303 0 974 1977 1724 703 0 2428 1978 3140 1582 3 4725 1979 3285 1927 1 5213 1980 2654 2955 4 5615 1981 3601 5433 15 9081 1982 2589 3660 37 6286 1983 1162 3276 15 4453 1984 1855 3261 5 5121 1985 857 823 4 1683 1986 993 1207 1 2201 1987 766 651 1 1418 1988 920 768 6 1694 1989 359 419 6 785 1990 488 697 4 1189 1991 404 527 0 931 1992 650 979 0 1629 1993 153 272 0 424 1994 13 11 0 24 1995 4 11 0 15 1996 12 14 0 26 1997 39 15 1 55 1998 123 147 1 271 1999 126 229 4 359 2000 107 233 0 340 2001 248 513 1 762 2002 462 626 2 1090 2003 798 879 0 1677 2004 676 1169 2 1847 2005 255 359 35 649 2006 159 110 44 313 2007 139 101 16 256 2008 284 745 108 1138 2009 632 1395 125 2152 2010 472 1532 162 2167 2011 314 954 53 1322 2012 88 350 5 443 2013 50 281 13 344

Shaded text has not been updated.
29
Table 9. United States landings and discards of haddock in 2013 by quarter and market category from eastern Georges Bank and National Marine Fisheries Service sampling intensity for lengths and ages. Note that summaries by market category are not possible for discards as the fish are discarded at sea and are not given a market category. Numbers in parentheses refer to sample sizes after augmenting samples from US commercial statistical areas 522 and 525.
Market Category Large Scrod Unclassified Total Landings (mt) Quarter 1 11 26 0 37Quarter 2 8 39 1 48Quarter 3 3 77 17 98Quarter 4 6 127 29 161Total 28 269 47 344 Number lengths measured Quarter 1 0 (394) 0 (368) 0 0 (762)Quarter 2 183 (726) 209 (510) 0 392 (1236)Quarter 3 13 (12) 51 (261) 0 64 (273)Quarter 4 0 (271) 314 (778) 0 314 (1049)Total 196 (1403) 574 (1917) 0 770 (3320) Number aged Quarter 1 0 (188) 0 (138) 0 0 (326)Quarter 2 127 (355) 101 (227) 0 228 (582)Quarter 3 0 (0) 0 (73) 0 0 (73)Quarter 4 0 (118) 151 (325) 0 151 (443)Total 127 (661) 252 (763) 0 379 (1424) Discards (mt)
Quarter 1 N/A N/A N/A Quarter 2 N/A N/A N/A 28Quarter 3 N/A N/A N/A Quarter 4 N/A N/A N/A 64
Total N/A N/A N/A 91

Shaded text has not been updated.
30
Table 10. Inter- and intra-reader testing for Georges Bank haddock ageing. (SJS=S. Sutherland (National Marine Fisheries Service, (NMFS)) and DK=D. Knox (Canadian Department of Fisheries and Oceans, DFO), CV=coefficient of variation). Sample Source
Test Type
Date Completed
Age Reader
Sample Size
CV (%) Agreement
(%) Bowker's
test DFO/NMFS Exchange: 2013 US Commercial (Q1&2) Exchange Spring 2014 SJS vs DK 88 1.90 84.1 n/s 2013 Can. Commercial (Q2,3,4) Exchange Spring 2014 SJS vs DK 66 0.49 95.5 2014 DFO Survey Exchange Spring 2014 SJS vs DK 114 0.47 96.5 2013 NMFS Autumn Survey Exchange Spring 2014 SJS vs DK 105 0.38 98.1 Combined Exchange Spring 2014 SJS vs DK 373 0.79 93.8 NMFS testing: 2013 NMFS Autumn Survey Precision Feb 2014 SJS 96 0.49 99.0 2013 US Commercial (Q4) Precision Mar 2014 SJS 100 0.16 99.0 2013 US Commercial (Q3) Precision Mar 2014 SJS 100 0.06 99.0 2013 US Commercial (Q2) Precision Feb 2014 SJS 97 0.08 99.0 2013 US Commercial (Q1) Precision Dec 2013 SJS 98 0.38 95.9 2013 NMFS Spring Survey Precision June 2013 SJS 99 0.08 99.0 Haddock Reference Collection Accuracy Apr 2014 SJS 57 1.68 92.7 Haddock Reference Collection Accuracy July 2013 SJS 56 1.69 91.1 DFO testing: 2014 DFO survey Precision Spring 2014 DK 129 0.68 96.1 2013 Canadian Commercial (Q4) Precision 2014 DK 114 0.26 98.2 2013 Canadian Commercial (Q3) Precision 2013 DK 104 1.02 93.3 2013 Canadian Commercial (Q2) Precision 2013 DK 112 0.69 95.5

Shaded text has not been updated.
31
Table 11. Haddock age and length samples for landings from the Canadian groundfish fishery and for discards from the scallop dredge fishery in 2013 from eastern Georges Bank. (OTB=Otter Trawl Bottom, LL=Long Line, GN=Gill Net, DR=Scallop Dredge)
Qtr. Gear Month Landings
(kg)
Length Frequency Samples Ages3
At Sea Port Trips Measured Samples Measured
1 OTB Jan DFO Survey = 530 Port = 50 At Sea = 0 Total =580
Feb
DR1
2 OTB June Port = 134 At Sea = 170 Total = 170 GN2 June
DR1 3 OTB July
Port = 319 At Sea = 91 Total = 429
Aug Sept LL July Aug Sept GN2 July Aug Sept DR1 4 OTB Oct
Port = 364 At Sea = 49 Total = 452
Nov Dec LL Oct Nov GN2 Oct Nov DR1
Totals 1,631 1Scallop fishery samples were combined by quarter.

Shaded text has not been updated.
32
Table 12. Components of the 2013 catch at age in numbers of haddock from eastern Georges Bank by quarter or half year.
Age Group
0 1 2 3 4 5 6 7 8 9+ Total
Canadian Landings
2013 Q1 0 0 590 134527 68047 29091 63211 32575 44597 343303 715943
2013 Q2 0 1 782 38172 17653 18365 22517 9940 6782 39019 153232
2013 Q3 0 4539 68346 979077 109837 34497 76192 20091 30711 100818 1424110
2013 Q4 99 2460 99721 1946002 25386 21498 65849 5505 16171 85933 2268625
Year total 99 7001 169440 3097779 220925 103451 227770 68111 98262 569074 4561911
United States Landings1
2013 H1 0 0 0 12013 7035 1510 3422 2602 4894 32939 64415
2013 H2 0 0 6262 233899 3218 2048 1234 587 2759 5798 255804
Year total 0 0 6262 245912 10252 3558 4656 3189 7653 38737 320219
Canadian Discards
2013 Q1 0 49 179 1665 59 9 19 11 20 137 2149
2013 Q2 0 0 235 4394 145 95 72 64 30 357 5393
2013 Q3 1393 2029 527 3104 93 25 49 18 24 59 7320
2013 Q4 7892 279 388 1791 3 1 8 1 1 5 10369
Year total 9286 2357 1330 10954 301 131 148 93 75 557 25232
United States Discards1
2013 H1 0 208 5230 46762 937 356 190 100 208 966 54956
2013 H2 152253 14804 14883 56144 743 115 77 964 116 3700 243798
Year total 152253 15012 20113 102906 1680 470 267 1064 324 4666 298754
Total Catch
2013 161637 24370 197144 3457550 233157 107610 232842 72457 106314 613034 52061161United States landings and discards at age were calculated by half year, however, landings and discards occurred in other
quarters.

Shaded text has not been updated.
33
Table 13. Total annual commercial catch at age numbers (000’s) of haddock from eastern Georges Bank during 1969-2013. Estimates of discards are included.
Year Age Group
0 1 2 3 4 5 6 7 8 9+ 0+1969 6 0 18 1451 262 334 2909 831 91 283 61841970 0 66 84 7 351 151 130 1153 372 193 25081971 43 0 1201 251 31 252 159 161 774 412 32841972 118 346 1 390 72 21 94 39 16 451 15471973 7 1119 1758 6 364 38 10 39 8 169 35171974 9 37 2257 276 0 32 3 0 29 63 27061975 553 18 279 1504 216 5 36 2 2 31 26451976 1 402 157 173 834 135 0 19 0 18 17391977 0 1 8028 66 182 307 164 0 15 15 87781978 110 6 291 9956 164 173 306 80 10 9 111051979 12 212 17 208 4307 364 201 217 43 14 55971980 31 32 17701 343 302 2425 193 130 52 12 212201981 6 55 693 6773 400 497 1243 119 33 7 98261982 1 2 731 1057 2848 205 379 730 62 65 60801983 75 11 149 663 554 1653 208 104 409 35 38601984 1 72 100 259 350 270 1131 186 166 318 28541985 353 9 2147 386 182 199 128 381 53 117 39541986 0 89 39 2586 175 143 124 119 174 42 34921987 19 0 2081 131 1536 100 58 83 70 111 41901988 1 53 53 2199 124 894 111 39 46 100 36191989 8 2 1274 86 776 143 347 34 23 47 27401990 18 31 8 1346 133 770 73 168 43 43 26331991 35 22 466 91 2076 89 391 72 146 61 34501992 151 49 249 324 129 1466 90 320 26 91 28951993 4 80 283 357 291 91 667 41 157 76 20491994 13 36 423 870 186 73 101 190 89 48 20281995 4 8 79 534 414 53 25 3 52 16 11881996 6 4 32 489 864 419 60 18 3 72 19671997 1 29 94 73 535 484 195 13 8 34 14661998 19 18 195 292 260 541 448 114 12 35 19321999 2 27 44 752 319 249 347 256 99 25 21192000 1 6 320 449 1268 264 213 217 186 67 29912001 0 22 65 1733 533 847 263 204 232 204 41052002 0 1 333 218 1891 379 671 115 110 289 40082003 486 7 10 1831 288 1487 426 479 110 234 53582004 4 332 26 75 3646 605 1498 519 421 263 73882005 0 14 241 29 224 6891 526 823 128 157 90342006 1 20 16 2515 44 289 4544 234 551 154 83672007 0 2 39 181 7345 148 168 1431 136 187 96372008 0 4 30 273 268 9721 102 85 708 95 112882009 3 17 125 192 741 261 11222 73 58 379 130742010 15 31 56 391 314 844 382 9849 50 210 121422011 1 243 107 181 515 228 676 108 6233 75 83662012 3 75 638 174 126 351 174 379 138 2055 41122013 162 24 197 3458 233 108 233 72 106 613 5206
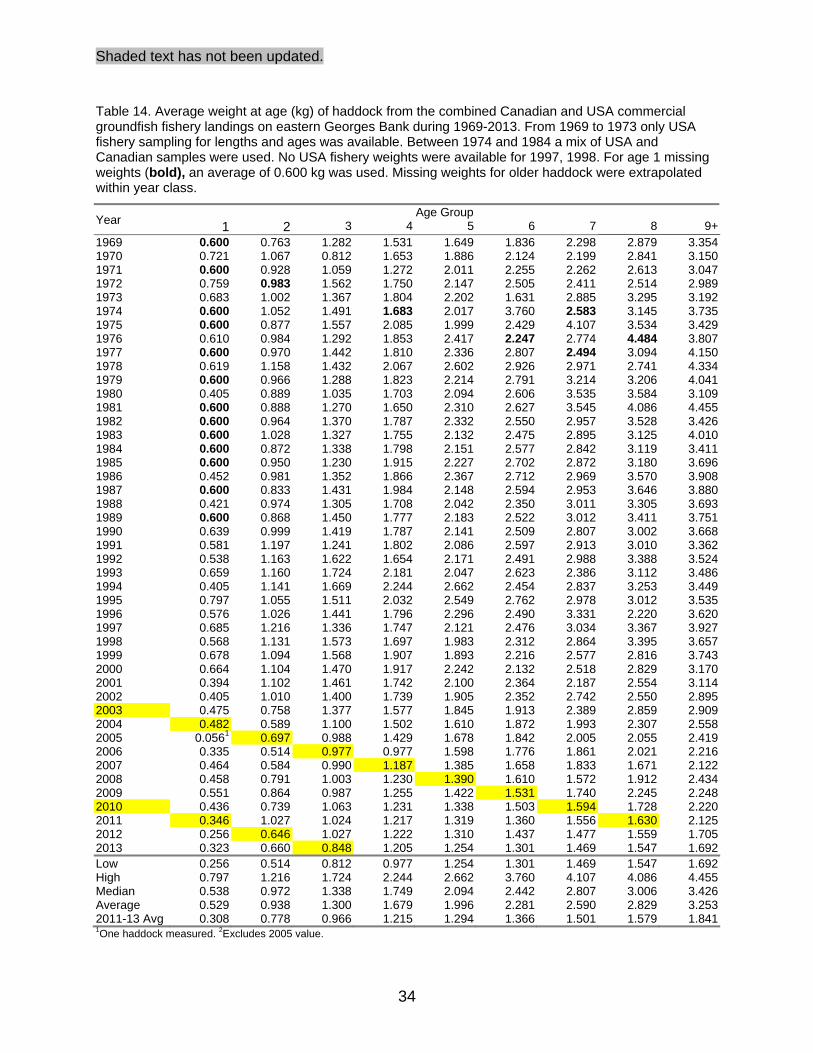
Shaded text has not been updated.
34
Table 14. Average weight at age (kg) of haddock from the combined Canadian and USA commercial groundfish fishery landings on eastern Georges Bank during 1969-2013. From 1969 to 1973 only USA fishery sampling for lengths and ages was available. Between 1974 and 1984 a mix of USA and Canadian samples were used. No USA fishery weights were available for 1997, 1998. For age 1 missing weights (bold), an average of 0.600 kg was used. Missing weights for older haddock were extrapolated within year class.
Year Age Group
1 2 3 4 5 6 7 8 9+1969 0.600 0.763 1.282 1.531 1.649 1.836 2.298 2.879 3.3541970 0.721 1.067 0.812 1.653 1.886 2.124 2.199 2.841 3.1501971 0.600 0.928 1.059 1.272 2.011 2.255 2.262 2.613 3.0471972 0.759 0.983 1.562 1.750 2.147 2.505 2.411 2.514 2.9891973 0.683 1.002 1.367 1.804 2.202 1.631 2.885 3.295 3.1921974 0.600 1.052 1.491 1.683 2.017 3.760 2.583 3.145 3.7351975 0.600 0.877 1.557 2.085 1.999 2.429 4.107 3.534 3.4291976 0.610 0.984 1.292 1.853 2.417 2.247 2.774 4.484 3.8071977 0.600 0.970 1.442 1.810 2.336 2.807 2.494 3.094 4.1501978 0.619 1.158 1.432 2.067 2.602 2.926 2.971 2.741 4.3341979 0.600 0.966 1.288 1.823 2.214 2.791 3.214 3.206 4.0411980 0.405 0.889 1.035 1.703 2.094 2.606 3.535 3.584 3.1091981 0.600 0.888 1.270 1.650 2.310 2.627 3.545 4.086 4.4551982 0.600 0.964 1.370 1.787 2.332 2.550 2.957 3.528 3.4261983 0.600 1.028 1.327 1.755 2.132 2.475 2.895 3.125 4.0101984 0.600 0.872 1.338 1.798 2.151 2.577 2.842 3.119 3.4111985 0.600 0.950 1.230 1.915 2.227 2.702 2.872 3.180 3.6961986 0.452 0.981 1.352 1.866 2.367 2.712 2.969 3.570 3.9081987 0.600 0.833 1.431 1.984 2.148 2.594 2.953 3.646 3.8801988 0.421 0.974 1.305 1.708 2.042 2.350 3.011 3.305 3.6931989 0.600 0.868 1.450 1.777 2.183 2.522 3.012 3.411 3.7511990 0.639 0.999 1.419 1.787 2.141 2.509 2.807 3.002 3.6681991 0.581 1.197 1.241 1.802 2.086 2.597 2.913 3.010 3.3621992 0.538 1.163 1.622 1.654 2.171 2.491 2.988 3.388 3.5241993 0.659 1.160 1.724 2.181 2.047 2.623 2.386 3.112 3.4861994 0.405 1.141 1.669 2.244 2.662 2.454 2.837 3.253 3.4491995 0.797 1.055 1.511 2.032 2.549 2.762 2.978 3.012 3.5351996 0.576 1.026 1.441 1.796 2.296 2.490 3.331 2.220 3.6201997 0.685 1.216 1.336 1.747 2.121 2.476 3.034 3.367 3.9271998 0.568 1.131 1.573 1.697 1.983 2.312 2.864 3.395 3.6571999 0.678 1.094 1.568 1.907 1.893 2.216 2.577 2.816 3.7432000 0.664 1.104 1.470 1.917 2.242 2.132 2.518 2.829 3.1702001 0.394 1.102 1.461 1.742 2.100 2.364 2.187 2.554 3.1142002 0.405 1.010 1.400 1.739 1.905 2.352 2.742 2.550 2.8952003 0.475 0.758 1.377 1.577 1.845 1.913 2.389 2.859 2.9092004 0.482 0.589 1.100 1.502 1.610 1.872 1.993 2.307 2.5582005 0.0561 0.697 0.988 1.429 1.678 1.842 2.005 2.055 2.4192006 0.335 0.514 0.977 0.977 1.598 1.776 1.861 2.021 2.2162007 0.464 0.584 0.990 1.187 1.385 1.658 1.833 1.671 2.1222008 0.458 0.791 1.003 1.230 1.390 1.610 1.572 1.912 2.4342009 0.551 0.864 0.987 1.255 1.422 1.531 1.740 2.245 2.2482010 0.436 0.739 1.063 1.231 1.338 1.503 1.594 1.728 2.2202011 0.346 1.027 1.024 1.217 1.319 1.360 1.556 1.630 2.1252012 0.256 0.646 1.027 1.222 1.310 1.437 1.477 1.559 1.7052013 0.323 0.660 0.848 1.205 1.254 1.301 1.469 1.547 1.692Low 0.256 0.514 0.812 0.977 1.254 1.301 1.469 1.547 1.692High 0.797 1.216 1.724 2.244 2.662 3.760 4.107 4.086 4.455Median 0.538 0.972 1.338 1.749 2.094 2.442 2.807 3.006 3.426Average 0.529 0.938 1.300 1.679 1.996 2.281 2.590 2.829 3.2532011-13 Avg 0.308 0.778 0.966 1.215 1.294 1.366 1.501 1.579 1.8411One haddock measured. 2Excludes 2005 value.

Shaded text has not been updated.
35
Table 15. Average lengths at age (cm) of haddock from the combined Canadian and USA commercial groundfish fishery landings on eastern Georges Bank during 1969-2013.
Year Age Group
0 1 2 3 4 5 6 7 8 9+
1969 42.5 50.2 53.4 54.9 56.6 61.2 66.7 70.61970 40.1 47.0 43.4 54.9 57.4 60.0 60.4 66.4 68.61971 44.7 46.6 50.0 58.4 61.3 61.9 64.2 68.11972 40.6 53.3 55.4 59.4 63.3 63.5 62.0 67.31973 39.2 45.2 52.5 55.4 60.3 54.7 65.8 69.2 69.01974 45.6 52.1 59.6 72.5 69.2 73.31975 42.5 52.8 59.7 59.8 63.7 75.8 72.7 71.71976 37.4 44.6 49.5 57.1 62.3 65.8 72.61977 44.1 51.2 55.9 61.1 65.4 68.8 76.71978 37.6 46.4 50.5 57.3 63.5 65.8 65.9 66.1 76.11979 44.3 49.0 55.3 59.3 64.7 68.4 67.8 74.01980 32.5 42.5 44.9 54.3 58.6 63.1 71.6 71.0 67.01981 42.9 48.8 53.2 60.4 63.4 70.7 75.5 76.31982 44.4 50.1 55.1 60.6 63.1 66.3 71.5 70.91983 45.0 49.2 54.4 58.8 62.0 65.4 67.6 73.41984 44.1 50.5 55.8 59.8 63.6 66.5 68.2 70.31985 43.3 47.5 55.8 59.2 63.6 65.9 67.9 70.81986 33.7 43.8 49.6 55.1 60.1 63.7 66.3 70.8 72.01987 41.4 50.3 56.5 58.0 62.2 66.3 71.3 71.91988 32.8 43.7 48.6 53.7 58.0 60.6 67.1 68.5 69.31989 41.9 50.0 54.1 59.2 61.9 66.6 70.3 70.01990 37.9 44.2 50.0 55.4 58.2 63.4 63.7 64.9 69.41991 36.2 47.0 48.3 54.2 58.3 62.2 66.7 64.9 66.61992 35.7 46.4 52.7 53.9 58.2 63.2 65.5 71.6 67.81993 38.3 46.4 53.3 58.0 57.0 61.7 62.4 65.2 67.91994 32.5 46.1 52.6 58.1 61.6 59.7 62.9 65.6 67.41995 40.2 45.0 50.9 56.3 60.8 62.5 64.1 64.2 67.91996 36.4 44.6 50.0 53.9 58.6 60.1 66.7 58.1 68.41997 38.7 47.2 48.8 53.4 57.0 60.2 64.4 66.9 70.51998 36.5 46.1 51.6 52.8 55.7 58.7 63.3 67.2 68.81999 38.7 45.6 51.5 55.1 54.9 57.9 61.0 63.0 69.32000 38.5 45.7 50.4 55.2 58.3 57.1 60.4 62.9 65.32001 32.1 45.5 50.4 53.5 56.9 59.2 57.6 60.3 64.52002 32.5 44.3 49.6 53.5 55.2 59.2 62.6 60.7 63.52003 34.2 40.2 49.3 51.8 54.7 55.3 59.7 63.8 64.02004 34.5 36.9 45.6 50.8 52.3 54.7 55.9 58.3 60.12005 16.51 38.8 44.1 49.9 52.8 54.5 56.1 56.5 59.22006 30.4 35.2 43.7 43.9 51.9 53.8 54.7 56.1 57.82007 34.0 36.7 43.9 46.8 49.3 52.5 54.3 52.3 57.12008 33.3 40.7 44.3 47.6 49.6 52.0 51.3 55.0 59.62009 36.0 42.0 44.4 47.9 49.7 51.4 52.9 57.7 57.82010 33.1 39.9 45.1 47.6 49.1 50.9 52.1 53.3 58.42011 30.7 44.0 44.7 47.4 48.9 49.5 51.8 52.5 57.82012 27.7 37.9 44.8 47.4 48.6 50.2 50.7 51.5 53.2
2013 22.8 30.0 38.2 41.8 47.2 47.8 48.4 50.5 51.4 53.0Low 22.8 27.72 35.2 41.8 43.9 47.8 48.4 50.5 51.4 53.2High 22.8 40.62 47.2 53.3 59.7 63.5 72.5 75.8 75.5 76.7Median 22.8 35.72 44.1 49.6 54.1 58.2 60.4 63.5 65.4 68.4Average 22.8 35.22 43.3 48.7 53.3 56.8 59.5 62.2 64.0 66.9Avg. 2011-13 22.8 29.5 40.0 43.7 47.3 48.4 49.4 51.0 51.8 54.71One haddock measured. 2Excludes 16.5 cm value in 2005.
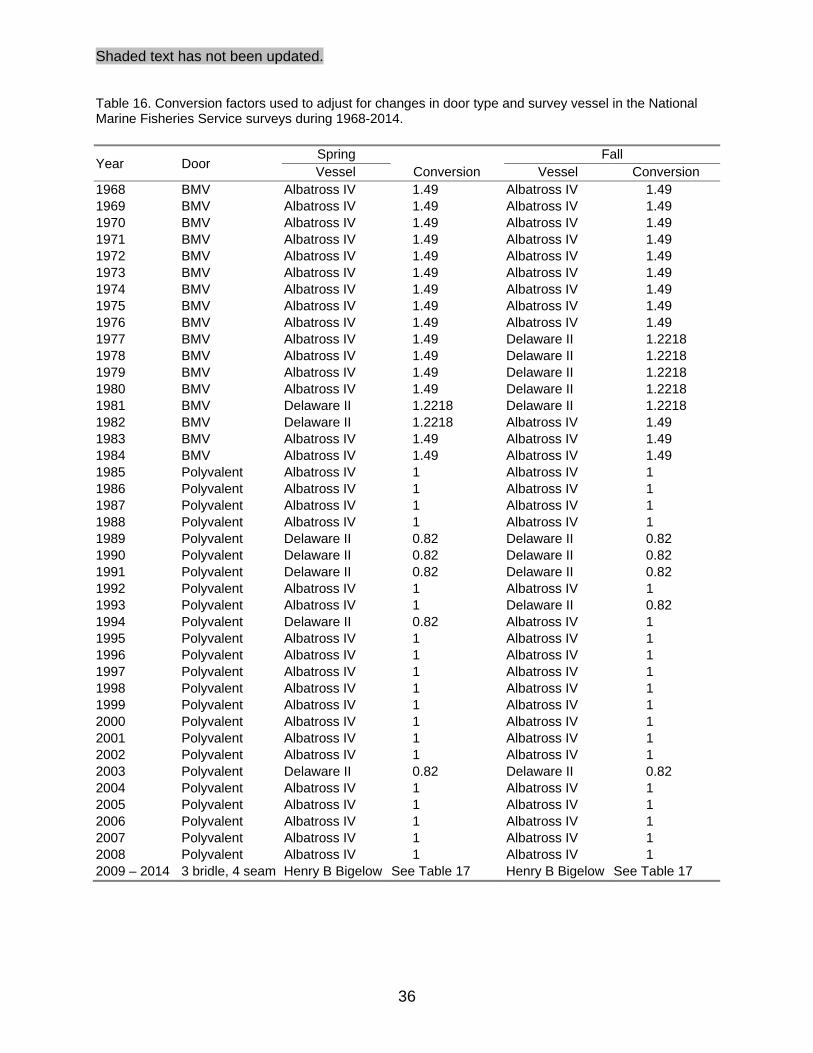
Shaded text has not been updated.
36
Table 16. Conversion factors used to adjust for changes in door type and survey vessel in the National Marine Fisheries Service surveys during 1968-2014.
Year Door Spring Fall Vessel Conversion Vessel Conversion
1968 BMV Albatross IV 1.49 Albatross IV 1.49 1969 BMV Albatross IV 1.49 Albatross IV 1.49 1970 BMV Albatross IV 1.49 Albatross IV 1.49 1971 BMV Albatross IV 1.49 Albatross IV 1.49 1972 BMV Albatross IV 1.49 Albatross IV 1.49 1973 BMV Albatross IV 1.49 Albatross IV 1.49 1974 BMV Albatross IV 1.49 Albatross IV 1.49 1975 BMV Albatross IV 1.49 Albatross IV 1.49 1976 BMV Albatross IV 1.49 Albatross IV 1.49 1977 BMV Albatross IV 1.49 Delaware II 1.2218 1978 BMV Albatross IV 1.49 Delaware II 1.2218 1979 BMV Albatross IV 1.49 Delaware II 1.2218 1980 BMV Albatross IV 1.49 Delaware II 1.2218 1981 BMV Delaware II 1.2218 Delaware II 1.2218 1982 BMV Delaware II 1.2218 Albatross IV 1.49 1983 BMV Albatross IV 1.49 Albatross IV 1.49 1984 BMV Albatross IV 1.49 Albatross IV 1.49 1985 Polyvalent Albatross IV 1 Albatross IV 1 1986 Polyvalent Albatross IV 1 Albatross IV 1 1987 Polyvalent Albatross IV 1 Albatross IV 1 1988 Polyvalent Albatross IV 1 Albatross IV 1 1989 Polyvalent Delaware II 0.82 Delaware II 0.82 1990 Polyvalent Delaware II 0.82 Delaware II 0.82 1991 Polyvalent Delaware II 0.82 Delaware II 0.82 1992 Polyvalent Albatross IV 1 Albatross IV 1 1993 Polyvalent Albatross IV 1 Delaware II 0.82 1994 Polyvalent Delaware II 0.82 Albatross IV 1 1995 Polyvalent Albatross IV 1 Albatross IV 1 1996 Polyvalent Albatross IV 1 Albatross IV 1 1997 Polyvalent Albatross IV 1 Albatross IV 1 1998 Polyvalent Albatross IV 1 Albatross IV 1 1999 Polyvalent Albatross IV 1 Albatross IV 1 2000 Polyvalent Albatross IV 1 Albatross IV 1 2001 Polyvalent Albatross IV 1 Albatross IV 1 2002 Polyvalent Albatross IV 1 Albatross IV 1 2003 Polyvalent Delaware II 0.82 Delaware II 0.82 2004 Polyvalent Albatross IV 1 Albatross IV 1 2005 Polyvalent Albatross IV 1 Albatross IV 1 2006 Polyvalent Albatross IV 1 Albatross IV 1 2007 Polyvalent Albatross IV 1 Albatross IV 1 2008 Polyvalent Albatross IV 1 Albatross IV 1 2009 – 2014 3 bridle, 4 seam Henry B Bigelow See Table 17 Henry B Bigelow See Table 17

Shaded text has not been updated.
37
Table 17. Conversion factors for Georges Bank haddock used to adjust for changes in net, doors, survey vessel and protocols for the National Marine Fisheries Service surveys during 2009 to 2013 when the Henry B. Bigelow was the research vessel used. Bigelow catches are divided by the conversion factor to equate to Albatross IV catches.
Length (cm) Conversion factor1 – 18 2.626169
19 2.580551 20 2.534933 21 2.489315 22 2.443697 23 2.398079 24 2.352462 25 2.306844 26 2.261226 27 2.215608 28 2.169990 29 2.124372 30 2.078754 31 2.033136 32 1.987518 33 1.941900 34 1.896283 35 1.850665 36 1.805047 37 1.759429 38 1.713811 39 1.668193 40 1.622575 41 1.576957 42 1.531339 43 1.485721 44 1.440104 45 1.394486 46 1.348868 47 1.303250 48 1.257632 49 1.212014 50 1.166396
51 and greater 1.163990
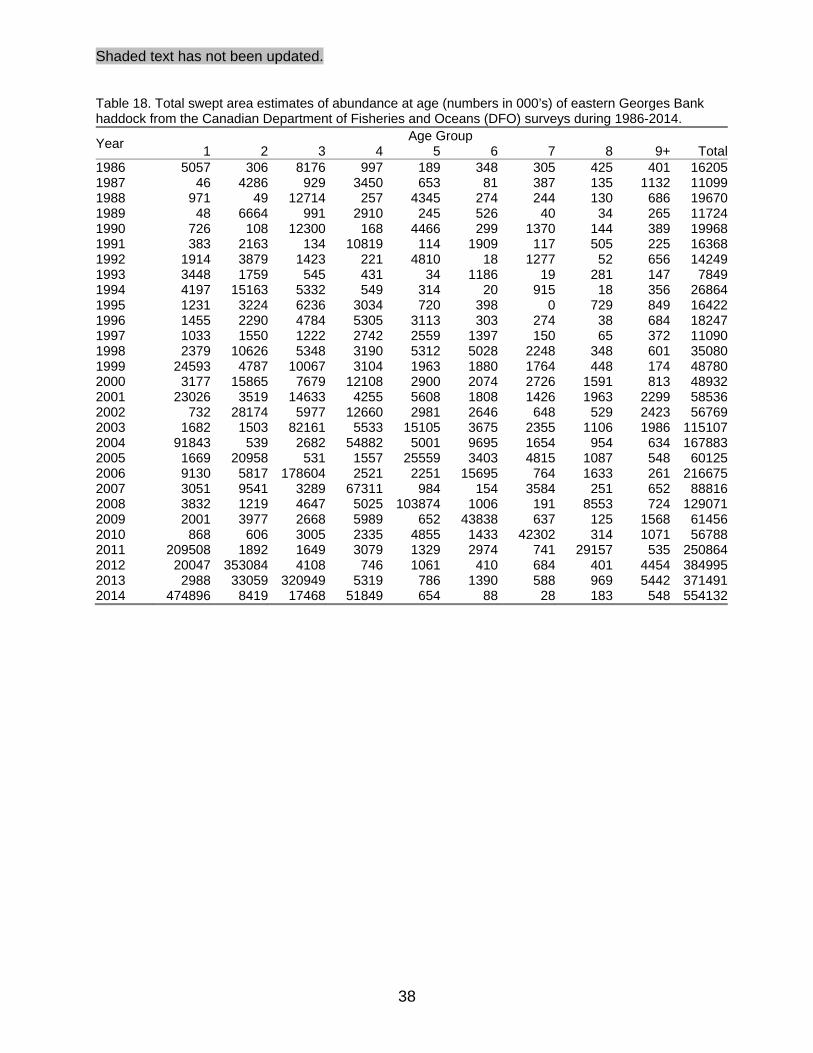
Shaded text has not been updated.
38
Table 18. Total swept area estimates of abundance at age (numbers in 000’s) of eastern Georges Bank haddock from the Canadian Department of Fisheries and Oceans (DFO) surveys during 1986-2014.
Year Age Group
1 2 3 4 5 6 7 8 9+ Total1986 5057 306 8176 997 189 348 305 425 401 162051987 46 4286 929 3450 653 81 387 135 1132 110991988 971 49 12714 257 4345 274 244 130 686 196701989 48 6664 991 2910 245 526 40 34 265 117241990 726 108 12300 168 4466 299 1370 144 389 199681991 383 2163 134 10819 114 1909 117 505 225 163681992 1914 3879 1423 221 4810 18 1277 52 656 142491993 3448 1759 545 431 34 1186 19 281 147 78491994 4197 15163 5332 549 314 20 915 18 356 268641995 1231 3224 6236 3034 720 398 0 729 849 164221996 1455 2290 4784 5305 3113 303 274 38 684 182471997 1033 1550 1222 2742 2559 1397 150 65 372 110901998 2379 10626 5348 3190 5312 5028 2248 348 601 350801999 24593 4787 10067 3104 1963 1880 1764 448 174 487802000 3177 15865 7679 12108 2900 2074 2726 1591 813 489322001 23026 3519 14633 4255 5608 1808 1426 1963 2299 585362002 732 28174 5977 12660 2981 2646 648 529 2423 567692003 1682 1503 82161 5533 15105 3675 2355 1106 1986 1151072004 91843 539 2682 54882 5001 9695 1654 954 634 1678832005 1669 20958 531 1557 25559 3403 4815 1087 548 601252006 9130 5817 178604 2521 2251 15695 764 1633 261 2166752007 3051 9541 3289 67311 984 154 3584 251 652 888162008 3832 1219 4647 5025 103874 1006 191 8553 724 1290712009 2001 3977 2668 5989 652 43838 637 125 1568 614562010 868 606 3005 2335 4855 1433 42302 314 1071 567882011 209508 1892 1649 3079 1329 2974 741 29157 535 2508642012 20047 353084 4108 746 1061 410 684 401 4454 3849952013 2988 33059 320949 5319 786 1390 588 969 5442 3714912014 474896 8419 17468 51849 654 88 28 183 548 554132

Shaded text has not been updated.
39
Table 19. Total swept area estimated abundance at age (numbers in 000’s) of eastern Georges Bank haddock from the National Marine Fisheries Service spring surveys during 1968-2014. From 1973-81, a 41 Yankee trawl was used while a 36 Yankee trawl was used in other years up to and including 2008. Since 2009 a new net, vessel and protocols were used and conversion factors to equate to Albatross IV catches were applied. Note that the 2012 survey results have been revised.
Year Age Group
1 2 3 4 5 6 7 8 9+ Total1968 0 3254 68 679 4853 2045 240 123 234 114961969 17 35 614 235 523 3232 1220 358 489 67241970 478 190 0 560 998 441 3165 2491 769 90921971 0 655 261 0 144 102 58 1159 271 26501972 2594 0 771 132 25 47 211 27 1214 50201973 2455 5639 0 1032 154 0 276 0 1208 107631974 1323 20596 4084 0 354 0 43 72 322 267951975 528 567 6016 1063 0 218 127 45 208 87731976 8228 402 424 1127 532 0 0 0 22 107351977 126 26003 262 912 732 568 0 22 102 287271978 0 743 20859 641 880 1163 89 23 116 245161979 10496 441 1313 9764 475 72 445 42 9 230561980 4355 66450 1108 1086 5761 613 371 693 360 807971981 3281 2823 27085 2906 751 2455 347 56 21 397251982 584 3703 1658 7802 767 455 697 0 0 156661983 238 770 686 359 2591 30 0 798 58 55291984 1366 1414 1046 910 847 1189 133 73 490 74691985 40 8911 1396 674 1496 588 1995 127 483 157091986 3334 280 3597 246 210 333 235 560 159 89531987 122 5480 144 1394 157 231 116 370 0 80131988 305 61 1868 235 611 203 218 178 0 36781989 84 6665 619 1343 267 791 58 92 47 99661990 1654 70 10338 598 1042 110 182 0 0 139951991 740 2071 432 3381 192 203 66 87 25 71981992 529 287 205 158 602 32 46 46 0 19051993 1870 1116 197 232 195 717 77 35 43 44801994 1025 4272 1487 269 184 118 278 28 84 77451995 921 2312 4184 1727 265 152 51 272 214 100991996 912 1365 3789 3190 1905 237 36 0 496 119311997 1635 1226 380 595 470 343 24 44 20 47361998 549 6046 2005 1281 1184 303 58 15 122 115621999 6286 1914 3655 661 1128 1062 468 476 46 156962000 2675 2131 3399 1624 636 564 438 305 165 119382001 10503 1186 3304 1232 374 294 113 20 20 170472002 231 40432 10938 4044 1492 473 287 229 236 583622003 125 1105 16915 2245 3773 476 200 82 286 252062004 195013 4724 2644 45872 3544 5261 960 1245 842 2601042005 540 32911 257 614 5818 671 1196 240 67 423132006 2961 1247 48882 213 949 6650 325 574 187 619882007 1468 11383 2055 95882 180 441 2168 222 312 1141102008 3402 1671 4332 240 38569 836 371 1739 480 516392009 2896 2758 1589 5126 801 23985 563 483 1259 394622010 481 644 3326 1461 3785 517 20735 0 600 315482011 16812 1319 834 707 551 1052 303 6751 155 284842012 19701 99410 1372 362 725 657 908 43 3532 1267092013 2583 9575 60096 1197 506 411 349 292 1101 761112014 91436 4429 8306 28732 291 65 78 49 153 133540

Shaded text has not been updated.
40
Table 20. Total swept area estimated abundance at age (numbers in 000’s) of eastern Georges Bank haddock from National Marine Fisheries Service fall surveys during 1963-2013. Since 2009 a new net, vessel and protocols were used and conversion factors to equate to Albatross IV catches were applied. Note that the 2011 survey has been revised.
Year Age Group
0 1 2 3 4 5 6 7 8+ Total1963 105993 40995 10314 3378 5040 4136 1477 451 276 1720611964 1178 123976 46705 4358 807 1865 477 211 167 1797421965 259 1503 51338 8538 479 302 142 148 208 629181966 9325 751 1742 20323 3631 671 138 133 84 367981967 0 3998 73 327 1844 675 141 88 88 72331968 55 113 800 28 37 2223 547 177 313 42931969 356 0 0 509 62 30 739 453 108 22571970 0 6400 336 16 415 337 500 902 578 94831971 2626 0 788 97 0 265 27 73 594 44711972 4747 2396 0 232 0 0 53 0 275 77021973 1223 16797 1598 0 168 0 0 8 16 198091974 151 234 961 169 0 6 0 0 70 15891975 30365 664 192 1042 239 0 0 0 28 325301976 738 121717 431 25 484 71 0 17 37 1235211977 47 238 26323 445 125 211 84 4 4 274801978 14642 547 530 7706 56 42 94 0 0 236171979 1598 21605 14 335 1489 45 12 0 0 250981980 3556 2788 5829 0 101 1081 108 25 4 134921981 596 4617 2585 2748 89 136 318 0 15 111031982 62 0 673 465 2508 153 97 528 42 45271983 3609 444 236 501 289 402 17 12 86 55981984 45 3775 856 233 194 45 262 0 41 54511985 12148 381 1646 199 70 68 46 30 21 146111986 30 7471 109 961 52 50 72 24 23 87931987 508 0 843 28 152 38 22 0 0 15921988 122 3983 184 2348 155 400 142 140 38 75131989 167 83 2645 112 509 68 73 0 0 36561990 1217 1041 36 1456 65 196 24 5 0 40401991 705 331 267 52 289 25 10 0 0 16791992 3484 1052 172 110 0 95 0 18 18 49481993 687 6656 3601 585 0 87 96 30 0 117421994 625 782 927 419 96 32 0 24 0 29051995 892 1436 5993 3683 550 30 0 0 53 126371996 1742 453 570 2302 963 167 0 0 0 61961997 217 5738 3368 592 690 385 0 0 13 110041998 2566 2966 4214 1085 705 526 722 0 0 127841999 3268 1236 5364 5060 837 2825 148 1150 991 208792000 1368 5284 6226 3712 622 229 0 146 97 176842001 659 16626 1382 6939 3000 1586 306 127 58 306842002 172 1864 44602 6040 5120 1660 863 457 354 611312003 196182 60 285 3415 655 739 20 99 158 2016132004 2864 116289 322 775 17200 1034 2410 416 528 1418372005 4981 3114 95159 340 532 3631 347 242 155 1085022006 930 8752 1040 65817 1083 82 796 0 16 785172007 1264 1922 11764 965 52456 955 562 244 0 701322008 1902 1865 1162 2564 477 21289 0 74 484 298182009 2010 862 1352 1082 2504 388 20906 88 237 294302010 172390 1154 585 1069 393 1166 589 9909 172 1874282011 14019 106939 349 225 281 331 650 219 3673 1266862012 3493 10311 72573 237 151 83 102 80 754 877842013 909714 3149 6643 52237 445 106 21 0 360 972675

Shaded text has not been updated.
41
Table 21. Average weight at age (kg) of eastern Georges Bank haddock from the Canadian Department of Fisheries and Oceans surveys during 1986-2014. These weights are used to represent beginning of year population weights. 9+ weights are population weighted averages. Highlighted cells indicated exceptionally strong year classes.
Year Age Group
1 2 3 4 5 6 7 8 9+1986 0.135 0.451 0.974 1.445 3.044 2.848 3.598 3.376 3.9181987 0.150 0.500 0.716 1.672 2.012 2.550 3.148 3.151 3.6291988 0.097 0.465 0.931 1.795 1.816 1.918 2.724 3.264 3.8711989 0.062 0.474 0.650 1.392 1.995 2.527 2.158 2.859 3.1411990 0.149 0.525 0.924 1.181 1.862 2.073 2.507 2.815 3.4721991 0.120 0.685 0.800 1.512 1.695 2.434 2.105 3.122 3.4321992 0.122 0.602 1.118 1.061 2.078 2.165 2.709 2.284 3.4401993 0.122 0.481 1.227 1.803 1.274 2.332 2.343 2.739 3.2801994 0.107 0.469 1.047 1.621 1.927 2.154 3.154 2.688 3.0841995 0.086 0.493 0.963 1.556 2.222 2.445 2.41 2.991 3.1841996 0.139 0.495 0.919 1.320 1.932 2.555 2.902 2.611 3.5881997 0.132 0.506 0.782 1.205 1.664 2.176 2.454 2.577 3.1581998 0.107 0.535 1.035 1.161 1.570 1.954 2.609 3.559 3.4621999 0.130 0.474 0.911 1.290 1.259 1.869 2.131 2.722 2.9922000 0.116 0.543 0.949 1.478 1.871 1.789 2.298 2.508 2.9012001 0.093 0.524 1.005 1.371 1.798 2.165 2.250 2.593 2.9282002 0.096 0.332 0.778 1.138 1.494 1.965 2.177 2.206 2.7082003 0.080 0.369 0.846 1.063 1.477 1.645 2.208 2.229 2.4872004 0.064 0.310 0.781 1.151 1.306 1.558 1.622 1.956 2.2162005 0.028 0.218 0.493 0.696 1.226 1.321 1.531 1.600 2.4442006 0.059 0.171 0.389 0.657 0.870 1.366 1.591 1.742 2.3552007 0.077 0.246 0.405 0.709 0.992 1.745 1.559 1.671 1.8622008 0.107 0.329 0.573 0.795 0.927 1.254 1.729 1.476 1.8972009 0.114 0.387 0.775 0.999 0.987 1.258 1.482 2.680 2.228
2010 0.072 0.385 0.749 0.960 1.120 1.207 1.333 1.772 2.066
2011 0.038 0.322 0.612 0.900 0.953 1.018 1.120 1.371 1.721
2012 0.070 0.186 0.457 0.506 0.997 1.104 1.084 1.190 1.3462013 0.070 0.261 0.412 0.789 1.092 0.972 1.100 1.142 1.457
2014 0.042 0.323 0.537 0.648 0.911 1.214 1.214 0.953 1.432 Low 0.028 0.171 0.389 0.506 0.870 0.972 1.084 0.953 1.346High 0.150 0.685 1.227 1.803 3.044 2.848 3.598 3.559 3.918Median 0.097 0.465 0.782 1.161 1.494 1.918 2.167 2.577 2.928Average 0.096 0.416 0.785 1.168 1.530 1.848 2.101 2.339 2.748Avg. 1991-2000 0.118 0.528 0.975 1.401 1.749 2.187 2.523 2.780 3.252Avg. 2012-2014 0.061 0.257 0.469 0.648 1.000 1.097 1.133 1.095 1.412
1The weight midway between the age 6 and 8 weight for that cohort was used as data were not available for this age group.

Shaded text has not been updated.
42
Table 22. Average lengths at age (cm) of eastern Georges Bank haddock from the Canadian Department of Fisheries and Oceans surveys during 1986-2014. Highlighted cells indicated exceptionally strong year classes.
Year Age Group
1 2 3 4 5 6 7 8 9+1986 22.9 36.2 45.4 51.0 63.7 61.9 67.8 66.0 70.71987 24.2 36.3 39.7 53.4 57.1 61.1 65.1 65.8 69.61988 22.3 36.4 45.1 55.7 55.9 58.0 62.4 65.8 71.51989 19.5 35.9 39.1 50.4 56.8 61.3 58.0 64.6 66.31990 24.7 35.8 44.4 48.0 55.9 58.7 61.6 63.1 67.51991 23.1 40.7 42.7 51.7 52.9 60.2 58.3 65.1 67.81992 23.2 39.2 47.7 46.8 57.7 62.5 63.9 60.3 68.11993 23.6 36.6 49.7 55.5 50.0 60.4 59.3 63.7 67.31994 22.3 35.8 45.8 53.8 57.6 58.5 65.9 66.5 65.41995 20.2 36.3 45.1 52.7 59.0 62.5 65.0 66.01996 24.2 36.2 44.4 50.1 56.9 62.7 66.2 61.8 68.41997 23.6 37.1 42.1 48.9 54.2 59.5 62.4 63.5 66.81998 21.8 37.6 46.4 47.3 52.9 57.2 62.5 69.3 68.71999 23.7 35.9 44.8 49.8 48.9 56.1 58.9 63.6 66.62000 22.7 37.6 44.3 52.1 56.4 54.7 59.6 61.7 64.72001 21.7 37.5 46.1 51.1 56.2 60.0 59.0 62.5 65.52002 21.5 31.8 42.1 47.5 52.0 58.1 60.3 59.2 64.42003 20.2 34.0 43.3 46.8 52.0 53.8 61.2 61.3 63.32004 19.1 31.8 42.0 47.9 50.6 53.3 55.3 59.1 60.22005 15.1 29.1 37.2 41.1 49.7 51.6 53.8 54.3 62.72006 18.7 27.0 34.0 40.2 42.6 51.8 52.8 55.7 62.22007 20.6 29.6 34.2 41.0 46.7 55.0 53.5 54.1 55.4 2008 23.1 33.1 39.4 43.0 45.7 50.5 56.3 52.9 57.9 2009 23.2 34.7 42.6 45.8 44.9 49.3 51.9 61.7 59.4
2010 20.3 34.8 43.0 46.3 48.3 50.5 51.4 55.7 59.82011 16.6 32.5 40.1 45.8 47.5 47.6 49.3 52.3 56.92012 19.9 26.7 36.2 37.1 47.0 48.7 48.6 50.1 52.02013 19.8 30.0 35.0 43.9 48.3 48.2 49.4 50.4 53.5
2014 16.4 32.4 37.9 40.5 46.8 49.2 50.5 47.8 54.0 Low 15.1 26.7 34.0 37.1 42.6 47.6 48.6 47.8 52.0High 24.7 40.7 49.7 55.7 63.7 62.7 67.8 69.3 71.5Median 21.8 35.8 42.7 47.9 52.0 57.2 59.0 61.7 65.4Average 21.3 34.4 42.1 47.8 52.2 56.0 58.0 60.1 63.5
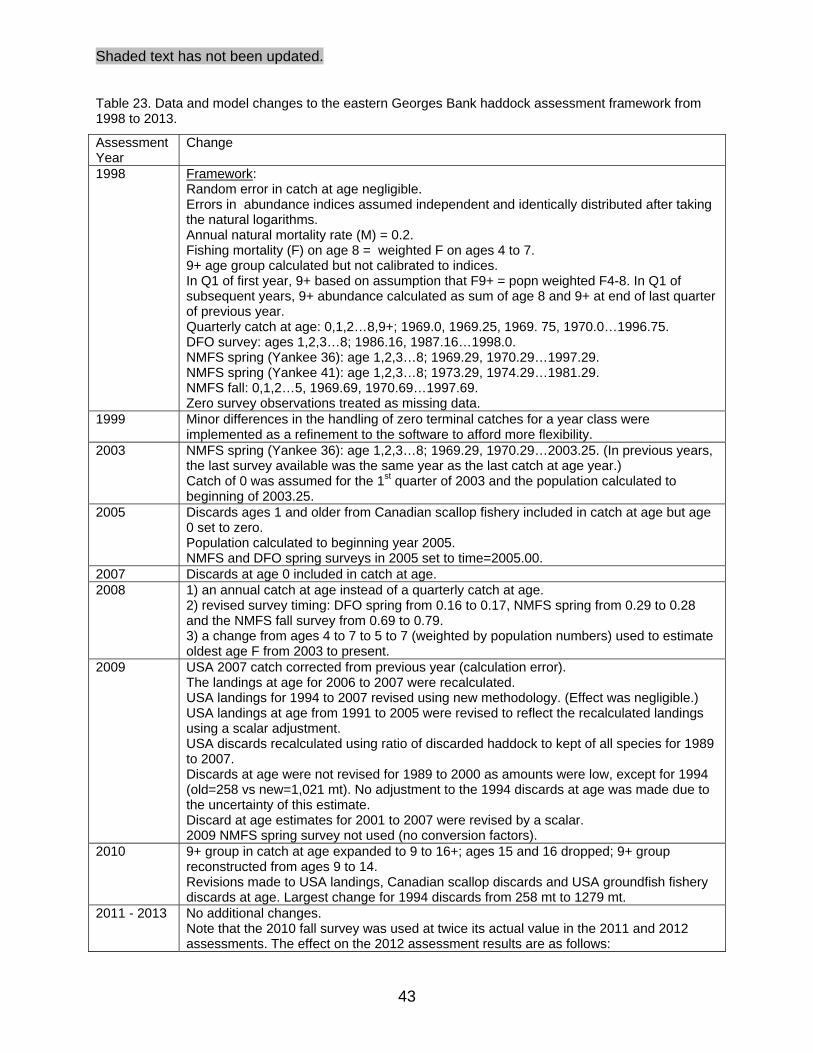
Shaded text has not been updated.
43
Table 23. Data and model changes to the eastern Georges Bank haddock assessment framework from 1998 to 2013.
Assessment Year
Change
1998 Framework: Random error in catch at age negligible. Errors in abundance indices assumed independent and identically distributed after taking the natural logarithms. Annual natural mortality rate (M) = 0.2. Fishing mortality (F) on age 8 = weighted F on ages 4 to 7. 9+ age group calculated but not calibrated to indices. In Q1 of first year, 9+ based on assumption that F9+ = popn weighted F4-8. In Q1 of subsequent years, 9+ abundance calculated as sum of age 8 and 9+ at end of last quarter of previous year. Quarterly catch at age: 0,1,2…8,9+; 1969.0, 1969.25, 1969. 75, 1970.0…1996.75. DFO survey: ages 1,2,3…8; 1986.16, 1987.16…1998.0. NMFS spring (Yankee 36): age 1,2,3…8; 1969.29, 1970.29…1997.29. NMFS spring (Yankee 41): age 1,2,3…8; 1973.29, 1974.29…1981.29. NMFS fall: 0,1,2…5, 1969.69, 1970.69…1997.69. Zero survey observations treated as missing data.
1999 Minor differences in the handling of zero terminal catches for a year class were implemented as a refinement to the software to afford more flexibility.
2003 NMFS spring (Yankee 36): age 1,2,3…8; 1969.29, 1970.29…2003.25. (In previous years, the last survey available was the same year as the last catch at age year.) Catch of 0 was assumed for the 1st quarter of 2003 and the population calculated to beginning of 2003.25.
2005 Discards ages 1 and older from Canadian scallop fishery included in catch at age but age 0 set to zero. Population calculated to beginning year 2005. NMFS and DFO spring surveys in 2005 set to time=2005.00.
2007 Discards at age 0 included in catch at age. 2008 1) an annual catch at age instead of a quarterly catch at age.
2) revised survey timing: DFO spring from 0.16 to 0.17, NMFS spring from 0.29 to 0.28 and the NMFS fall survey from 0.69 to 0.79. 3) a change from ages 4 to 7 to 5 to 7 (weighted by population numbers) used to estimate oldest age F from 2003 to present.
2009 USA 2007 catch corrected from previous year (calculation error). The landings at age for 2006 to 2007 were recalculated. USA landings for 1994 to 2007 revised using new methodology. (Effect was negligible.) USA landings at age from 1991 to 2005 were revised to reflect the recalculated landings using a scalar adjustment. USA discards recalculated using ratio of discarded haddock to kept of all species for 1989 to 2007. Discards at age were not revised for 1989 to 2000 as amounts were low, except for 1994 (old=258 vs new=1,021 mt). No adjustment to the 1994 discards at age was made due to the uncertainty of this estimate. Discard at age estimates for 2001 to 2007 were revised by a scalar. 2009 NMFS spring survey not used (no conversion factors).
2010 9+ group in catch at age expanded to 9 to 16+; ages 15 and 16 dropped; 9+ group reconstructed from ages 9 to 14. Revisions made to USA landings, Canadian scallop discards and USA groundfish fishery discards at age. Largest change for 1994 discards from 258 mt to 1279 mt.
2011 - 2013 No additional changes. Note that the 2010 fall survey was used at twice its actual value in the 2011 and 2012 assessments. The effect on the 2012 assessment results are as follows:

Shaded text has not been updated.
44
2010 yc declined from 589 M to 532 M 1+ population declined from 644,586 K to 597,434 K 3+ population declined from 57,745 to 55,964 K 3+ biomass declined from 70,679 mt to 68,521 mt risk analysis for 2013 Fref catch declined by 700 mt from 10,400 mt to 9,700 mt
2014 NMFS 2012 spring survey: For the 2012 and 2013 assessments the survey results did not incorporate some lengths for which there were no ages. The numbers involved were small. Updated values also reflect an increase in the number of tows, changes to the numbers per tow and a large increase in the numbers aged. NMFS 2011 fall survey: The NMFS 2011 fall survey used incorrect stratum area values for strata 5Z3 and 5Z4 for the 2012 and 2013 assessments. Updated values also reflect changes to the numbers per tow. Canadian scallop discards: Revised 2005 to 2012 to reflect updated values due to change from freezer trawler equivalents to hours x meters as new effort measure and other data changes. Largest percent difference from previous values for age/year was 19%. Largest annual change was 7%. Canadian scallop discards contribute a very small amount to the total catch.

Shaded text has not been updated.
45
Table 24. Statistical properties of estimates of population abundance (numbers in 000’s) at beginning of year 2014 and survey calibration constants (unitless, survey:population) for eastern Georges Bank haddock obtained from a bootstrap with 1000 replications.
Age Estimate Standard
Error Relative
Error Bias
Relative Bias
Population Abundance (000’s) 1 1811316 1071226 0.591 265143 0.146 2 13012 5268 0.405 967 0.074 3 34989 11186 0.320 1350 0.039 4 186702 49466 0.265 6955 0.037 5 1496 391 0.261 51 0.034 6 711 189 0.266 18 0.025 7 630 209 0.331 19 0.030 8 797 191 0.240 11 0.014
Survey Calibration Constants Canadian Department of Fisheries and Oceans Survey
1 0.277 0.046 0.166 0.004 1.307 2 0.493 0.084 0.171 0.010 0.020 3 0.897 0.147 0.163 0.009 0.010 4 0.907 0.146 0.161 0.009 0.010 5 0.916 0.157 0.171 0.009 0.010 6 0.762 0.128 0.168 0.013 0.017 7 0.797 0.136 0.171 0.015 0.019 8 0.827 0.140 0.169 0.005 0.006
National Marine Fisheries Service (NMFS) Spring Survey – Yankee 36 – 1969-72/1982-2014
1 0.146 0.022 0.150 0.003 0.020 2 0.355 0.053 0.149 0.000 0.001 3 0.451 0.070 0.155 0.001 0.003 4 0.414 0.059 0.143 0.003 0.007 5 0.471 0.067 0.142 0.005 0.011 6 0.403 0.057 0.142 0.005 0.012 7 0.401 0.058 0.145 0.005 0.012 8 0.387 0.061 0.158 0.007 0.017
NMFS Spring Survey – Yankee 41 – 1973-811 0.228 0.071 0.312 0.009 0.038 2 0.534 0.165 0.309 0.022 0.042 3 0.652 0.202 0.310 0.028 0.044 4 0.806 0.257 0.319 0.039 0.049 5 0.895 0.287 0.321 0.031 0.035 6 0.811 0.306 0.378 0.065 0.080 7 1.488 0.541 0.363 0.125 0.084 8 0.724 0.238 0.329 0.036 0.050
NMFS Fall Survey 0 0.157 0.022 0.137 0.002 0.012 1 0.321 0.046 0.144 0.003 0.009 2 0.255 0.034 0.133 0.002 0.009 3 0.246 0.033 0.134 0.002 0.009 4 0.207 0.029 0.138 0.001 0.006 5 0.170 0.023 0.137 0.001 0.007

Shaded text has not been updated.
46
Table 25. Beginning of year population abundance (numbers in 000’s) for eastern Georges Bank haddock during 1969-2014 from a virtual population analysis using the bootstrap bias adjusted population abundance at the beginning of 2014. Highlighted cells follow three recent large year classes, the 2000, 2003 and 2010.
Year Age Group
1 2 3 4 5 6 7 8 9+ 1+ 2+ 3+1969 804 193 3639 872 911 7650 2497 250 776 17592 16789 165961970 3593 658 141 1681 479 447 3659 1299 506 12463 8870 82121971 235 2881 463 109 1061 256 249 1961 971 8187 7952 50711972 5303 192 1285 155 62 642 69 61 1340 9109 3806 36141973 11637 4029 157 702 63 32 441 21 728 17811 6174 21441974 3082 8519 1728 123 251 18 17 327 454 14517 11436 29171975 3448 2490 4947 1166 100 176 12 14 557 12910 9462 69731976 54074 2807 1787 2701 761 78 112 8 437 62765 8691 58841977 6038 43909 2157 1307 1463 501 64 74 348 55862 49824 59141978 4057 4942 28725 1706 906 922 263 52 319 41893 37836 328941979 52344 3317 3784 14595 1249 587 480 144 287 76785 24441 211251980 6238 42664 2700 2910 8084 695 300 199 301 64091 57853 151891981 4616 5078 19099 1901 2111 4443 396 130 352 38124 33508 284311982 2096 3730 3533 9569 1197 1281 2521 217 358 24501 22406 186761983 2553 1714 2396 1944 5278 796 708 1409 356 17155 14602 128871984 16098 2081 1269 1367 1094 2838 465 486 1047 26744 10646 85651985 1639 13115 1614 806 804 652 1312 214 821 20977 19338 62231986 13906 1334 8805 974 496 480 419 731 694 27841 13935 126011987 2188 11305 1057 4888 640 278 282 237 973 21846 19659 83541988 16040 1791 7383 747 2624 434 176 156 828 30178 14138 123471989 1021 13085 1419 4071 500 1347 255 109 674 22481 21459 83751990 2381 834 9565 1083 2635 281 791 178 578 18326 15945 151111991 2064 1921 676 6618 767 1466 164 497 542 14715 12651 107301992 8107 1670 1154 471 3556 548 849 71 664 17090 8983 73131993 12144 6593 1143 654 270 1600 368 408 496 23677 11532 49391994 11429 9870 5142 616 276 139 714 264 531 28981 17552 76811995 5723 9324 7700 3427 337 160 25 414 528 27638 21915 125911996 5644 4678 7563 5822 2433 228 108 18 709 27205 21561 168821997 16814 4618 3801 5751 3989 1615 133 72 528 37321 20507 158891998 8188 13740 3696 3046 4225 2830 1146 97 454 37423 29235 154951999 27252 6688 11074 2763 2259 2972 1913 836 409 56167 28915 222272000 8776 22288 5436 8388 1974 1626 2121 1336 907 52852 44077 217892001 75893 7179 17959 4045 5726 1379 1139 1541 1609 116470 40577 333972002 3670 62116 5819 13140 2832 3924 893 749 2186 95329 91659 295432003 2132 3003 50556 4568 9055 1977 2609 628 2043 76569 74438 714342004 243376 1739 2450 39738 3480 6075 1235 1705 1876 301675 58298 565592005 5750 198960 1401 1938 29247 2304 3628 547 2317 246092 240342 413822006 10551 4695 162677 1121 1385 17752 1413 2231 2088 203911 193361 1886652007 5519 8620 3830 130917 877 874 10452 947 2901 164938 159419 1507982008 5429 4517 7023 2972 100557 585 564 7268 2860 131776 126347 1218302009 2794 4441 3671 5504 2192 73565 387 385 7567 100505 97711 932702010 4148 2272 3523 2832 3838 1559 50124 251 6116 74662 70514 682422011 334338 3368 1810 2532 2036 2384 933 32176 4978 384554 50216 468482012 50532 273513 2661 1318 1610 1461 1345 667 24743 357851 307319 338062013 14738 41305 223357 2022 966 1002 1040 761 18827 304018 289280 2479752014 1546172 12045 33639 179747 1445 694 611 786 15388 1790528 244355 232310

Shaded text has not been updated.
47
Table 26. Fishing mortality rates for eastern Georges Bank haddock during 1969-2013 from a virtual population analysis using the bootstrap bias adjusted population abundance at the beginning of 2013. The aggregated rates are weighted by population numbers. The rates for ages 4 to 8 and 5 to 8 are also shown as exploitation rate (%). Highlighted cells follow two recent large year classes, the 2000 and 2003.
Year Age Group
1 2 3 4 5 6 7 8 9+ 4-8 4-8(%) 5-8 5-8(%)1969 0.000 0.111 0.572 0.399 0.512 0.538 0.453 0.508 0.508 0.508 36.4 0.516 36.91970 0.021 0.152 0.057 0.261 0.425 0.383 0.424 0.377 0.538 0.377 28.7 0.410 30.71971 0.000 0.608 0.892 0.369 0.302 1.114 1.202 0.564 0.623 0.564 39.5 0.570 39.81972 0.075 0.005 0.404 0.705 0.468 0.175 0.973 0.342 0.460 0.342 26.4 0.275 21.91973 0.112 0.647 0.045 0.830 1.056 0.410 0.101 0.571 0.294 0.571 39.8 0.245 19.71974 0.013 0.343 0.193 0.000 0.154 0.181 0.015 0.103 0.164 0.103 8.9 0.124 10.61975 0.006 0.132 0.405 0.227 0.051 0.255 0.218 0.218 0.063 0.218 17.8 0.184 15.31976 0.008 0.064 0.113 0.413 0.217 0.000 0.208 0.000 0.046 0.357 27.3 0.197 16.21977 0.000 0.224 0.035 0.166 0.262 0.444 0.000 0.247 0.048 0.247 19.9 0.297 23.41978 0.002 0.067 0.477 0.112 0.235 0.452 0.405 0.244 0.033 0.244 19.7 0.349 26.91979 0.004 0.006 0.062 0.391 0.385 0.471 0.679 0.401 0.056 0.401 30.2 0.464 33.91980 0.006 0.604 0.151 0.121 0.399 0.363 0.639 0.335 0.046 0.335 26.0 0.402 30.21981 0.013 0.163 0.491 0.263 0.299 0.366 0.401 0.330 0.024 0.330 25.6 0.348 26.81982 0.001 0.242 0.398 0.395 0.208 0.393 0.382 0.377 0.224 0.377 28.7 0.344 26.61983 0.005 0.101 0.361 0.375 0.420 0.338 0.176 0.383 0.114 0.383 29.0 0.385 29.11984 0.005 0.054 0.254 0.330 0.317 0.572 0.577 0.467 0.405 0.467 34.1 0.505 36.21985 0.006 0.198 0.305 0.285 0.316 0.242 0.384 0.320 0.170 0.320 25.0 0.330 25.61986 0.007 0.033 0.389 0.221 0.379 0.333 0.372 0.303 0.069 0.303 23.8 0.341 26.41987 0.000 0.226 0.147 0.422 0.189 0.259 0.391 0.389 0.135 0.389 29.4 0.275 21.91988 0.004 0.033 0.395 0.201 0.467 0.331 0.277 0.394 0.143 0.394 29.7 0.436 32.31989 0.002 0.113 0.070 0.235 0.378 0.332 0.158 0.265 0.079 0.265 21.2 0.319 24.91990 0.014 0.010 0.168 0.145 0.386 0.335 0.266 0.309 0.085 0.309 24.2 0.355 27.21991 0.012 0.310 0.161 0.421 0.137 0.346 0.646 0.389 0.132 0.389 29.4 0.315 24.61992 0.007 0.179 0.367 0.356 0.599 0.198 0.531 0.527 0.164 0.527 37.4 0.543 38.31993 0.007 0.049 0.419 0.665 0.462 0.607 0.132 0.546 0.185 0.546 38.5 0.517 36.91994 0.003 0.048 0.206 0.401 0.344 1.509 0.345 0.458 0.105 0.458 33.6 0.483 35.01995 0.002 0.009 0.079 0.143 0.190 0.191 0.119 0.149 0.035 0.149 12.5 0.170 14.21996 0.001 0.008 0.074 0.178 0.210 0.342 0.201 0.192 0.119 0.192 15.9 0.220 18.01997 0.002 0.023 0.021 0.108 0.143 0.143 0.111 0.125 0.073 0.125 10.7 0.142 12.01998 0.002 0.016 0.091 0.099 0.152 0.191 0.116 0.144 0.088 0.144 12.2 0.160 13.51999 0.001 0.007 0.078 0.136 0.129 0.137 0.159 0.139 0.071 0.139 11.8 0.140 11.92000 0.001 0.016 0.095 0.182 0.159 0.155 0.119 0.166 0.085 0.166 13.9 0.148 12.52001 0.000 0.010 0.112 0.157 0.178 0.235 0.219 0.181 0.151 0.181 15.1 0.191 15.82002 0.000 0.006 0.042 0.172 0.159 0.208 0.152 0.176 0.157 0.176 14.7 0.183 15.22003 0.004 0.004 0.041 0.072 0.199 0.270 0.225 0.214 0.135 0.180 15.0 0.214 17.62004 0.002 0.016 0.034 0.106 0.212 0.315 0.613 0.316 0.167 0.157 13.2 0.316 24.72005 0.003 0.001 0.023 0.136 0.299 0.288 0.286 0.297 0.078 0.289 22.8 0.297 23.42006 0.002 0.004 0.017 0.045 0.260 0.329 0.200 0.316 0.085 0.303 23.8 0.316 24.72007 0.000 0.005 0.053 0.064 0.204 0.237 0.163 0.171 0.073 0.073 6.4 0.171 14.32008 0.001 0.007 0.044 0.104 0.112 0.213 0.181 0.113 0.037 0.113 9.7 0.113 9.72009 0.007 0.031 0.058 0.160 0.140 0.183 0.231 0.182 0.057 0.180 15.0 0.182 15.12010 0.008 0.027 0.128 0.127 0.275 0.311 0.242 0.246 0.038 0.240 19.4 0.246 19.82011 0.001 0.034 0.112 0.246 0.127 0.370 0.134 0.237 0.017 0.237 19.2 0.237 19.22012 0.001 0.002 0.071 0.106 0.261 0.134 0.364 0.254 0.095 0.221 18.0 0.251 20.22013 0.002 0.005 0.016 0.128 0.123 0.269 0.076 0.163 0.036 0.147 12.4 0.157 13.2
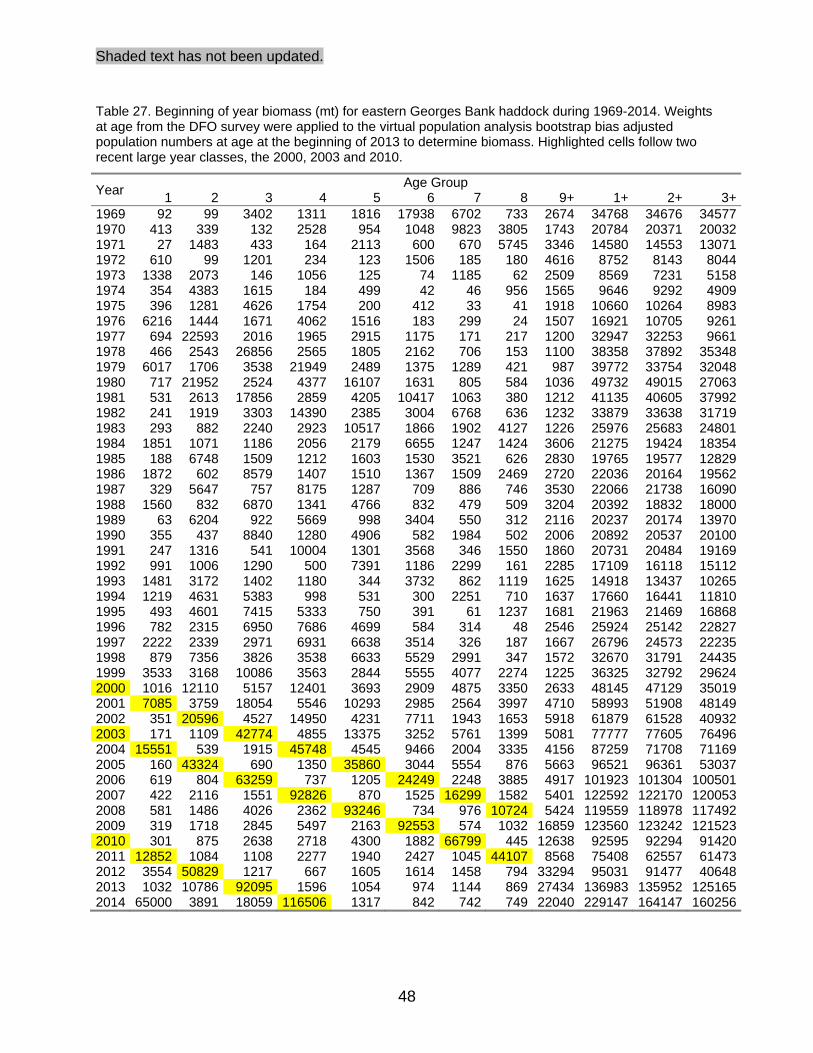
Shaded text has not been updated.
48
Table 27. Beginning of year biomass (mt) for eastern Georges Bank haddock during 1969-2014. Weights at age from the DFO survey were applied to the virtual population analysis bootstrap bias adjusted population numbers at age at the beginning of 2013 to determine biomass. Highlighted cells follow two recent large year classes, the 2000, 2003 and 2010.
Year Age Group
1 2 3 4 5 6 7 8 9+ 1+ 2+ 3+1969 92 99 3402 1311 1816 17938 6702 733 2674 34768 34676 345771970 413 339 132 2528 954 1048 9823 3805 1743 20784 20371 200321971 27 1483 433 164 2113 600 670 5745 3346 14580 14553 130711972 610 99 1201 234 123 1506 185 180 4616 8752 8143 80441973 1338 2073 146 1056 125 74 1185 62 2509 8569 7231 51581974 354 4383 1615 184 499 42 46 956 1565 9646 9292 49091975 396 1281 4626 1754 200 412 33 41 1918 10660 10264 89831976 6216 1444 1671 4062 1516 183 299 24 1507 16921 10705 92611977 694 22593 2016 1965 2915 1175 171 217 1200 32947 32253 96611978 466 2543 26856 2565 1805 2162 706 153 1100 38358 37892 353481979 6017 1706 3538 21949 2489 1375 1289 421 987 39772 33754 320481980 717 21952 2524 4377 16107 1631 805 584 1036 49732 49015 270631981 531 2613 17856 2859 4205 10417 1063 380 1212 41135 40605 379921982 241 1919 3303 14390 2385 3004 6768 636 1232 33879 33638 317191983 293 882 2240 2923 10517 1866 1902 4127 1226 25976 25683 248011984 1851 1071 1186 2056 2179 6655 1247 1424 3606 21275 19424 183541985 188 6748 1509 1212 1603 1530 3521 626 2830 19765 19577 128291986 1872 602 8579 1407 1510 1367 1509 2469 2720 22036 20164 195621987 329 5647 757 8175 1287 709 886 746 3530 22066 21738 160901988 1560 832 6870 1341 4766 832 479 509 3204 20392 18832 180001989 63 6204 922 5669 998 3404 550 312 2116 20237 20174 139701990 355 437 8840 1280 4906 582 1984 502 2006 20892 20537 201001991 247 1316 541 10004 1301 3568 346 1550 1860 20731 20484 191691992 991 1006 1290 500 7391 1186 2299 161 2285 17109 16118 151121993 1481 3172 1402 1180 344 3732 862 1119 1625 14918 13437 102651994 1219 4631 5383 998 531 300 2251 710 1637 17660 16441 118101995 493 4601 7415 5333 750 391 61 1237 1681 21963 21469 168681996 782 2315 6950 7686 4699 584 314 48 2546 25924 25142 228271997 2222 2339 2971 6931 6638 3514 326 187 1667 26796 24573 222351998 879 7356 3826 3538 6633 5529 2991 347 1572 32670 31791 244351999 3533 3168 10086 3563 2844 5555 4077 2274 1225 36325 32792 296242000 1016 12110 5157 12401 3693 2909 4875 3350 2633 48145 47129 350192001 7085 3759 18054 5546 10293 2985 2564 3997 4710 58993 51908 481492002 351 20596 4527 14950 4231 7711 1943 1653 5918 61879 61528 409322003 171 1109 42774 4855 13375 3252 5761 1399 5081 77777 77605 764962004 15551 539 1915 45748 4545 9466 2004 3335 4156 87259 71708 711692005 160 43324 690 1350 35860 3044 5554 876 5663 96521 96361 530372006 619 804 63259 737 1205 24249 2248 3885 4917 101923 101304 1005012007 422 2116 1551 92826 870 1525 16299 1582 5401 122592 122170 1200532008 581 1486 4026 2362 93246 734 976 10724 5424 119559 118978 1174922009 319 1718 2845 5497 2163 92553 574 1032 16859 123560 123242 1215232010 301 875 2638 2718 4300 1882 66799 445 12638 92595 92294 914202011 12852 1084 1108 2277 1940 2427 1045 44107 8568 75408 62557 614732012 3554 50829 1217 667 1605 1614 1458 794 33294 95031 91477 406482013 1032 10786 92095 1596 1054 974 1144 869 27434 136983 135952 1251652014 65000 3891 18059 116506 1317 842 742 749 22040 229147 164147 160256

Shaded text has not been updated.
49
Table 28. Partial recruitment of haddock normalized to ages 4 to 8 for 1969 to 2002 and to ages 5 to 8 for 2003 to 2013 from the eastern Georges Bank Canadian commercial fishery. Average F’s used to normalize the partial recruitment were weighted by population numbers. 1Weighted by population.
Age Group Year 1 2 3 4 5 6 7 8 9+ 1969 0.00 0.22 1.13 0.79 1.01 1.06 0.89 1.00 1.00 1970 0.05 0.40 0.15 0.69 1.13 1.02 1.12 1.00 1.43 1971 1.08 1.58 0.65 0.53 1.97 2.13 1.00 1.10 1972 0.22 0.01 1.18 2.06 1.37 0.51 2.84 1.00 1.34 1973 0.20 1.13 0.08 1.45 1.85 0.72 0.18 1.00 0.51 1974 0.11 2.78 1.56 1.24 1.46 0.12 0.83 1.33 1975 0.03 0.60 1.85 1.04 0.24 1.17 1.00 1.00 0.29 1976 0.02 0.17 0.31 1.13 0.59 0.57 0.13 1977 0.00 0.91 0.14 0.67 1.06 1.80 0.00 1.00 0.19 1978 0.01 0.28 1.95 0.46 0.96 1.85 1.66 1.00 0.14 1979 0.01 0.01 0.16 0.97 0.96 1.17 1.69 1.00 0.14 1980 0.02 1.80 0.45 0.36 1.19 1.08 1.91 1.00 0.14 1981 0.04 0.49 1.49 0.80 0.91 1.11 1.22 1.00 0.07 1982 0.00 0.64 1.05 1.05 0.55 1.04 1.01 1.00 0.60 1983 0.01 0.26 0.94 0.98 1.10 0.88 0.46 1.00 0.30 1984 0.01 0.12 0.54 0.71 0.68 1.23 1.24 1.00 0.87 1985 0.02 0.62 0.95 0.89 0.99 0.76 1.20 1.00 0.53 1986 0.02 0.11 1.28 0.73 1.25 1.10 1.23 1.00 0.23 1987 0.00 0.58 0.38 1.09 0.49 0.67 1.01 1.00 0.35 1988 0.01 0.08 1.00 0.51 1.19 0.84 0.70 1.00 0.36 1989 0.01 0.43 0.26 0.89 1.43 1.25 0.60 1.00 0.30 1990 0.05 0.03 0.54 0.47 1.25 1.08 0.86 1.00 0.27 1991 0.03 0.80 0.41 1.08 0.35 0.89 1.66 1.00 0.34 1992 0.01 0.34 0.70 0.68 1.14 0.38 1.01 1.00 0.31 1993 0.01 0.09 0.77 1.22 0.85 1.11 0.24 1.00 0.34 1994 0.01 0.11 0.45 0.88 0.75 3.29 0.75 1.00 0.23 1995 0.01 0.06 0.53 0.96 1.28 1.28 0.80 1.00 0.23 1996 0.00 0.04 0.39 0.93 1.09 1.78 1.05 1.00 0.62 1997 0.01 0.18 0.17 0.86 1.14 1.14 0.89 1.00 0.59 1998 0.02 0.11 0.63 0.69 1.06 1.33 0.81 1.00 0.61 1999 0.01 0.05 0.56 0.98 0.93 0.99 1.14 1.00 0.51 2000 0.00 0.10 0.57 1.09 0.96 0.93 0.72 1.00 0.51 2001 0.00 0.06 0.62 0.86 0.98 1.30 1.21 1.00 0.83 2002 0.00 0.03 0.24 0.98 0.90 1.18 0.86 1.00 0.89
2003 0.016 0.02 0.19 0.34 0.93 1.26 1.05 1.00 0.63 2004 0.005 0.05 0.11 0.34 0.67 1.00 1.94 1.00 0.53 2005 0.009 0.004 0.08 0.46 1.01 0.97 0.96 1.00 0.26 2006 0.006 0.01 0.05 0.14 0.82 1.04 0.63 1.00 0.27 2007 0.002 0.03 0.31 0.37 1.19 1.38 0.95 1.00 0.43 2008 0.008 0.06 0.39 0.92 0.99 1.88 1.60 1.00 0.33 2009 0.036 0.17 0.32 0.88 0.77 1.01 1.27 1.00 0.31 2010 0.033 0.11 0.52 0.52 1.12 1.26 0.98 1.00 0.16 2011 0.003 0.14 0.47 1.04 0.54 1.56 0.57 1.00 0.07 2012 0.006 0.01 0.28 0.42 1.04 0.54 1.45 1.01 0.38 2013 0.010 0.03 0.10 0.82 0.78 1.72 0.48 1.04 0.23 Avg 1998-021 0.004 0.06 0.55 0.97 0.98 1.15 0.94 1.00 0.76Avg 2009-131 0.004 0.02 0.12 0.78 0.89 1.03 0.98 1.00 0.28Avg 2011-131 0.004 0.01 0.11 0.82 0.76 1.28 0.90 1.00 0.29Avg 2003-131 0.005 0.01 0.11 0.40 0.98 1.04 0.99 1.00 0.30

Shaded text has not been updated.
50
Table 29. Input for projections and risk analyses of eastern Georges Bank haddock for the 2015 fishery. A catch of 27,000 mt in 2014 and natural mortality = 0.2 were assumed for the forecasts. The 2010 and 2013 year classes are highlighted.
Year Age Group
1 2 3 4 5 6 7 8 9+ Population Numbers (000s) 2014 1546172 12045 33639 179747 1445 694 611 786 15388
Partial Recruitment to the Fishery1 2014 0.005 0.01 0.11 0.372 1 1 1 1 0.32015 0.005 0.01 0.11 0.372 1 1 1 1 0.3 Weight at beginning of year for population (kg)3
2014 0.044 0.324 0.544 0.654 0.914 1.214 1.214 0.954 1.434
2015 0.06 0.195 0.47 0.896 0.937 1.1 1.13 1.1 1.412016 0.06 0.26 0.415 0.65 1.016 1.267 1.13 1.1 1.41 Weight at age for catch (kg)8
2014 0.359 0.78 1.0110 1.1911 1.29 1.37 1.5 1.58 1.842015 0.31 0.659 0.97 1.2310 1.3911 1.37 1.5 1.58 1.84 Maturity 2014 0 0 1 1 1 1 1 1 12015 0 0 1 1 1 1 1 1 1
1Based on 2003 to 2013 weighted average except where indicated and ages 5 to 8 assumed fully recruited. 2Based on observed values from 2003 year class. 32012-2014 average weights at age from the Canadian Department of Fisheries and Oceans (DFO) survey unless indicated otherwise.
42014 average weights at age from DFO survey. 52010 year class average weights at age from DFO survey used for 2013 year class. 6Average of 2005 and 2009 year class average weights at age from DFO survey used for 2011 year class. 72003 year class average weights at age from DFO survey used for 2010 year class. 82011 to 2013 average weights at age from Canadian/USA landings except where indicated. 92010 year class average weights at age from Canadian/USA landings used for 2013 year class.. 102005 and 2009 year class average weights at age from Canadian/USA landings used for 2011 year class. 112003 year class average weights at age from Canadian/USA landings used for 2010 year class.

Shaded text has not been updated.
51
Table 30. Bias adjusted deterministic projection results for eastern Georges Bank haddock for the 2015 fishery using 11.2 million age 1 recruits (2003 to 2013 median from 2013 assessment results) for the 2014 and 2015 year classes, the input values detailed in Table 29 and assuming that the 2014 quota of 27,000 mt is caught. Natural mortality was assumed to be 0.2. Highlighted values indicate the 2013 and 2010 year classes.
Year Age Group
1 2 3 4 5 6 7 8 9+ 1+ 2+ 3+ Population Numbers (000s)
2014 1546172 12045 33639 179747 1445 694 611 786 15388 1790527 244355 2323102015 11177 1263883 9830 26593 130795 860 413 364 11918 1455833 1444656 1807732016 11177 9139 1032093 7821 19775 82569 543 261 9255 1172633 1161456 1152317
Population Biomass (mt)
2014 65000 3891 18059 116506 1317 842 742 749 22040 229147 164147 1602562015 682 235082 4610 23774 121247 944 468 399 16828 404033 403352 1682692016 682 2349 425222 5068 20032 103871 615 285 13068 571194 570512 568163
Fishing mortality
2014 0.002 0.003 0.035 0.118 0.319 0.319 0.319 0.319 0.0962015 0.001 0.003 0.029 0.096 0.26 0.26 0.26 0.26 0.078
Projected Catch Numbers (000s)
2014 2231 35 1051 18157 359 172 152 195 1274 23626 21395 213602015 13 2975 251 2214 27258 179 86 76 812 33864 33851 30876
Catch Biomass (mt)
2014 772 27 1067 21552 465 236 228 309 2345 27000 26228 262012015 4 1922 243 2726 37889 245 129 120 1494 44771 44767 42845

Shaded text has not been updated.
52
Figure 1. Fisheries statistical unit areas in North Atlantic Fisheries Organization Subdivision 5Ze. Alpha-numeric codes, e.g. 5Zej, are the Canadian Department of Fisheries and Oceans designations and numeric codes, e.g. 561, are National Marine Fisheries Service designations. The eastern Georges Bank management unit is outlined by a heavy red line..
70° 69° 68° 67° 66°
40°
41°
42°
Georges Bank
5Zeg521
5Zeo526
5Zeh522
5Zen525
5Zem
551
552
5Zej561
562
Northern Edge
Northeast
Peak
InternationalBoundary
GreatSouthChannel
NantucketShoals
Closed Area II
Cape Cod
200m
100m
50m

Shaded text has not been updated.
53
Figure 2. Historical catch of eastern Georges Bank haddock during 1931-1955 (Gavaris and Van Eeckhaute 1997) compared to recent catches during 1969-2013. Catch data for 1956 to 1968 were not available by unit area.
Figure 3. Nominal catches of eastern Georges Bank haddock during 1969-2013.

Shaded text has not been updated.
54
Figure 4. Haddock landings by the Canadian commercial groundfish fishery and discards from the scallop fishery from eastern Georges Bank by month and gear in 2013 (wide bars) with sampling levels (narrow bars). Landings from the gillnet fishery were very low and no samples were available. OTB=otter trawl bottom, LL= longline, GN=gill net, DR=scallop dredge.
Figure 5. Haddock numbers at length landed by components of the Canadian commercial groundfish fisheries and haddock discards at length from the Canadian scallop fishery on eastern Georges Bank in 2013. The scallop dredge length frequencies are expanded according to the axis on the right. OTB=otter trawl bottom, LL=longline, DR=scallop dredge. Landings and sampling from the gillnet fishery were very low.
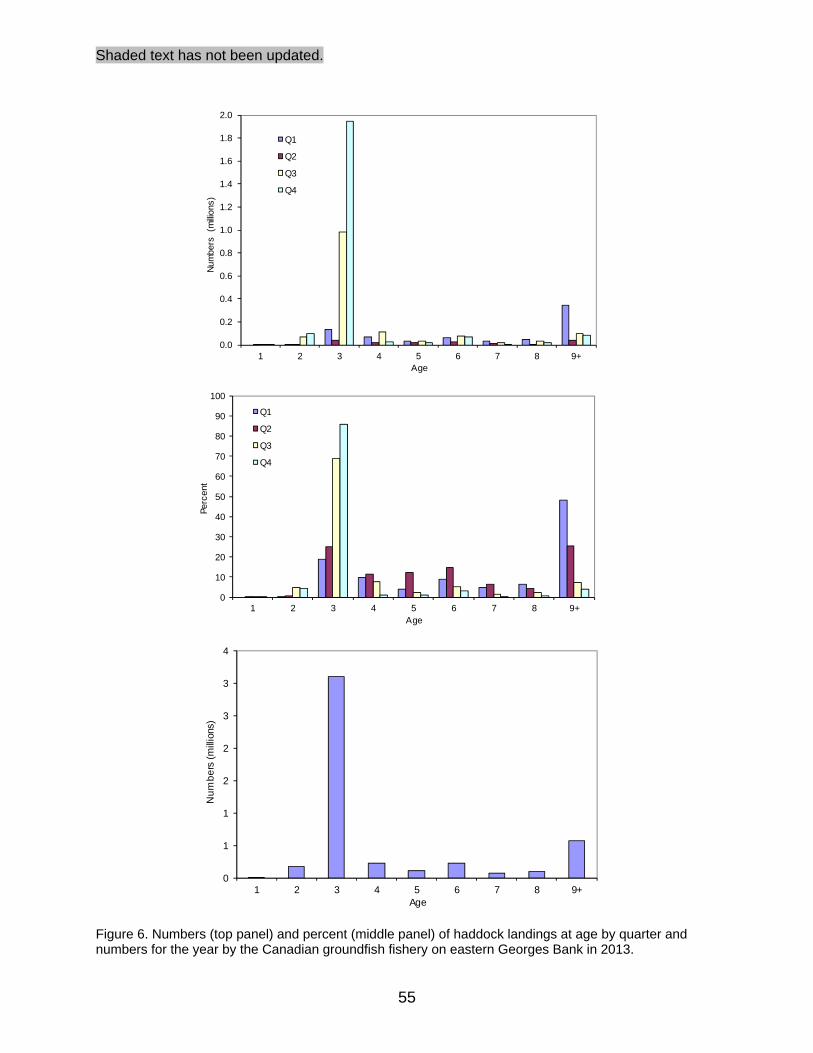
Shaded text has not been updated.
55
Figure 6. Numbers (top panel) and percent (middle panel) of haddock landings at age by quarter and numbers for the year by the Canadian groundfish fishery on eastern Georges Bank in 2013.
0
10
20
30
40
50
60
70
80
90
100
1 2 3 4 5 6 7 8 9+
Perc
ent
Age
Q1
Q2
Q3
Q4
0.0
0.2
0.4
0.6
0.8
1.0
1.2
1.4
1.6
1.8
2.0
1 2 3 4 5 6 7 8 9+
Num
bers
(m
illion
s)
Age
Q1
Q2
Q3
Q4
0
1
1
2
2
3
3
4
1 2 3 4 5 6 7 8 9+
Nu
mb
ers
(m
illio
ns)
Age

Shaded text has not been updated.
56
Figure 7. Haddock landings and discards by gear in metric tonnes (upper) and length composition (lower; total numbers for landings and numbers measured for discards) by the United States from eastern Georges Bank in 2013.

Shaded text has not been updated.
57
Figure 8. Haddock landings and discards at age in numbers and percent by half year from the USA eastern Georges Bank groundfish fisheries in 2013.
0
10
20
30
40
50
60
70
80
90
100
1 2 3 4 5 6 7 8 9+
Per
cent
Age
US Landings (Percent)
Q12
Q34
0.00
0.05
0.10
0.15
0.20
0.25
1 2 3 4 5 6 7 8 9+
Num
bers
of
fish
(mill
ions
)
Age
US Landings (Numbers)
Q12
Q34
0
10
20
30
40
50
60
70
80
90
0 1 2 3 4 5 6 7 8 9
Per
cent
Age
US Discards (Percent)
Q12
Q34
0.00
0.02
0.04
0.06
0.08
0.10
0.12
0.14
0.16
0.18
0 1 2 3 4 5 6 7 8 9
Num
ber
of f
ish
(mill
ions
)
Age
US Discards (numbers)
Q12
Q34
0.00
0.05
0.10
0.15
0.20
0.25
0.30
0.35
0 1 2 3 4 5 6 7 8 9+
Num
bers
of
fish
(mill
ions
)
Age
US Catch (Numbers)
Q12
Q34
0
10
20
30
40
50
60
70
80
90
100
0 1 2 3 4 5 6 7 8 9+
Per
cent
Age
US Catch (Percent)
Q12
Q34

Shaded text has not been updated.
58
Figure 9. Total commercial catch at age (numbers) of eastern Georges Bank haddock during 1969-2013. The 2000 and 2003 year classes are indicated in blue and purple, respectiviely. The bubble area is proportional to catch magnitude.
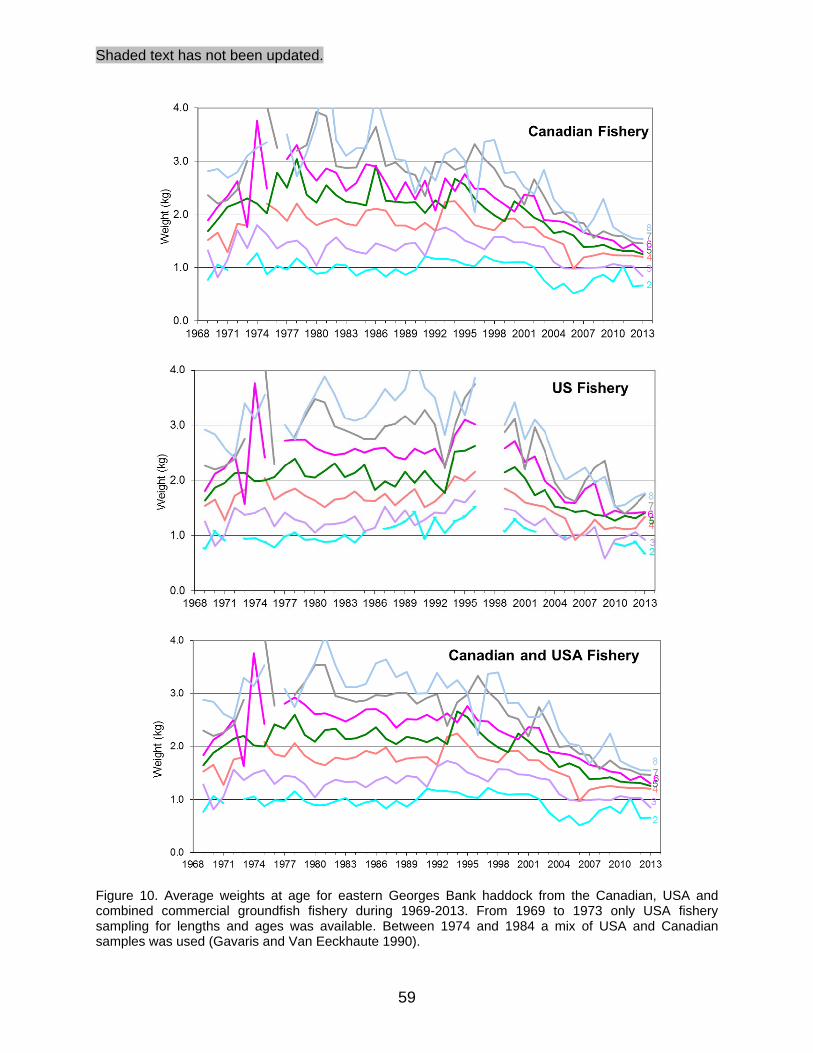
Shaded text has not been updated.
59
Figure 10. Average weights at age for eastern Georges Bank haddock from the Canadian, USA and combined commercial groundfish fishery during 1969-2013. From 1969 to 1973 only USA fishery sampling for lengths and ages was available. Between 1974 and 1984 a mix of USA and Canadian samples was used (Gavaris and Van Eeckhaute 1990).
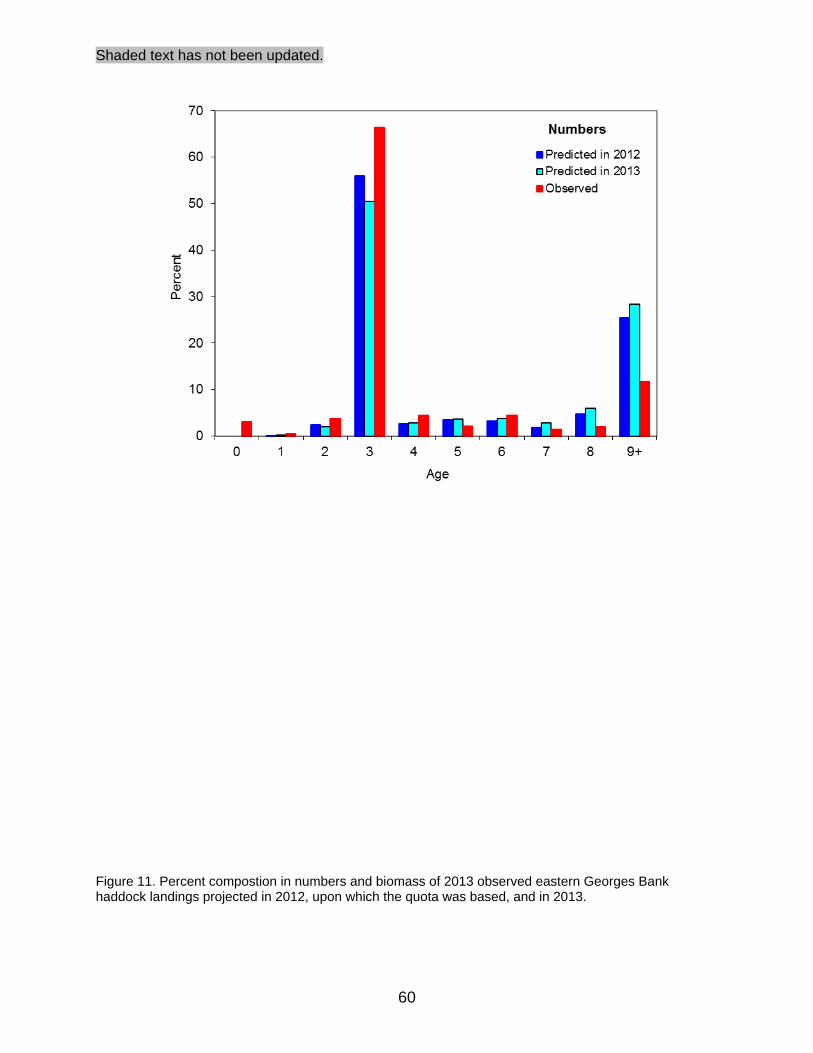
Shaded text has not been updated.
60
Figure 11. Percent compostion in numbers and biomass of 2013 observed eastern Georges Bank haddock landings projected in 2012, upon which the quota was based, and in 2013.
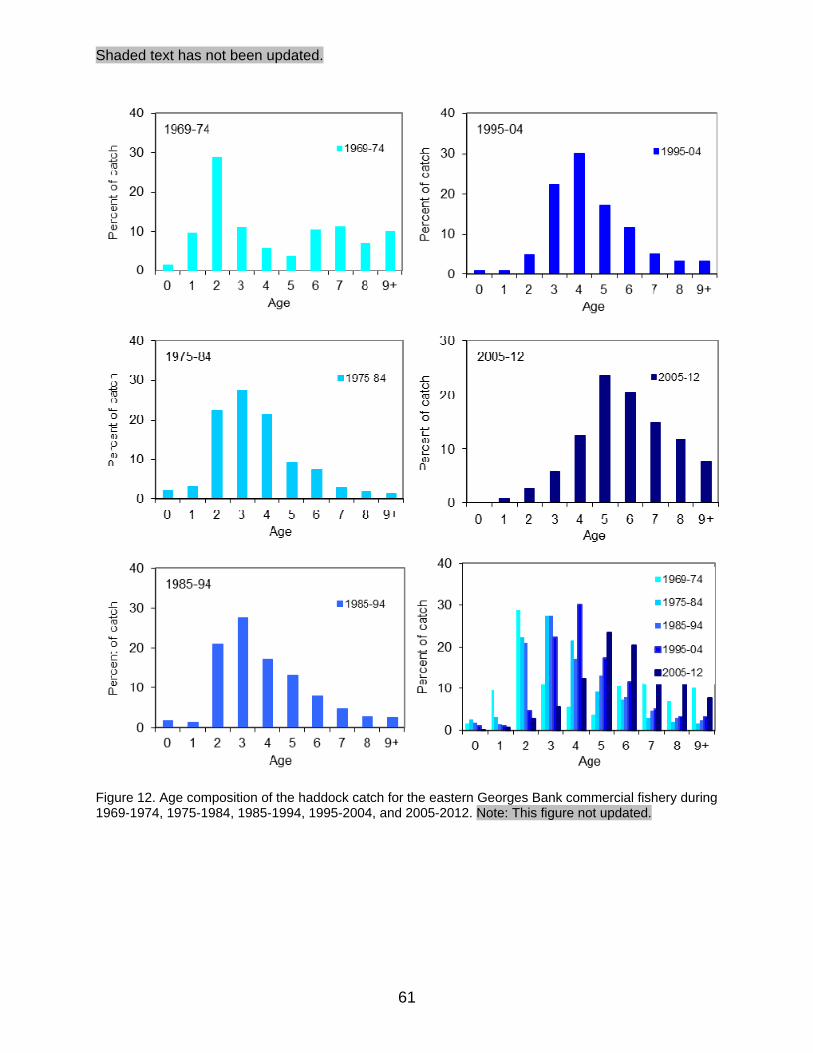
Shaded text has not been updated.
61
Figure 12. Age composition of the haddock catch for the eastern Georges Bank commercial fishery during 1969-1974, 1975-1984, 1985-1994, 1995-2004, and 2005-2012. Note: This figure not updated.

Shaded text has not been updated.
62
Figure 13. Stratification scheme used for National Marine Fisheries Service surveys. The eastern Georges Bank management area is indicated by shading.
Figure 14. Stratification scheme used for the Canadian Department of Fisheries and Oceans survey. The eastern Georges Bank management area is indicated by shading.
68° 67° 66°
41°
42°
17
1816
19
20
16
21 222222
68° 67° 66°
41°
42°
5Z15Z2
5Z3
5Z4

Shaded text has not been updated.
63
Figure 15. Conversion factors for NMFS surveys conducted by the Henry B. Bigelow since 2009. Factors are applied by dividing the Bigelow catch at length by the length specific conversion factor to make them equivalent to Albatross IV catches.
Haddock
0
0.5
1
1.5
2
2.5
3
0 10 20 30 40 50 60 70 80
Length (cm)
Co
nve
rsio
n f
act
or

Shaded text has not been updated.
64
Figure 16. Distribution of eastern Georges Bank haddock abundance (number/tow) as observed from the National Marine Fisheries Service fall survey. The squares (left panels) are shaded relative to the average survey catch for 2003 to 2012. The expanding symbols (right panels) represent the 2013 survey catches. Length based conversion coefficients have been applied since the 2009 survey to make them comparable to surveys undertaken by the Albatross IV.
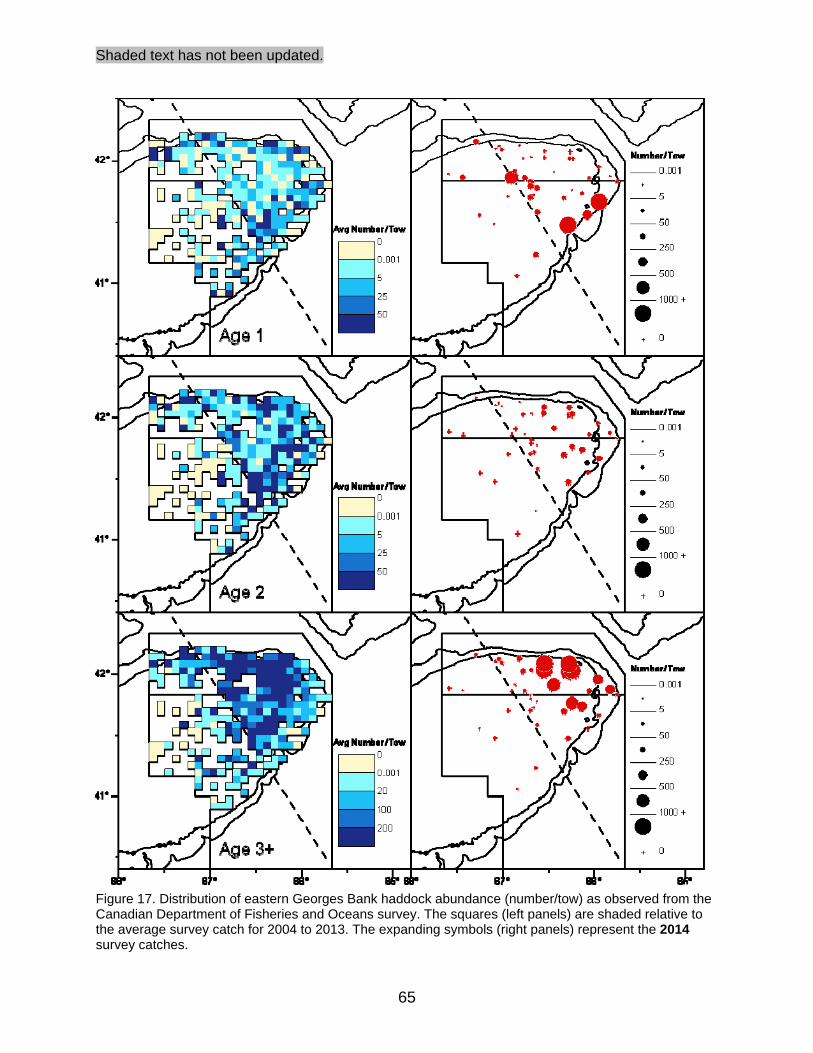
Shaded text has not been updated.
65
Figure 17. Distribution of eastern Georges Bank haddock abundance (number/tow) as observed from the Canadian Department of Fisheries and Oceans survey. The squares (left panels) are shaded relative to the average survey catch for 2004 to 2013. The expanding symbols (right panels) represent the 2014 survey catches.

Shaded text has not been updated.
66
Figure 18. Distribution of eastern Georges Bank haddock abundance (number/tow) as observed from the National Marine Fisheries Service spring survey. The squares (left panels) are shaded relative to the average survey catch for 2004 to 2013. The expanding symbols (right panels) represent the 2014 survey catches. Length based conversion coefficients have been applied since the 2009 survey to make them comparable to surveys undertaken by the Albatross IV.

Shaded text has not been updated.
67
Figure 19. Estimated abundance at age (numbers in 000's) of eastern Georges Bank haddock for the Canadian Department of Fisheries and Oceans (DFO) for 1986 to 2014, the National Marine Fisheries Service (NMFS) spring survey for 1968 to 2014 and the NMFS fall survey for 1963 to 2013. Bubble area is proportional to magnitude (see Tables 18-20). Conversion factors to adjust for changes in door type and survey vessel were applied to the NMFS surveys. From 1973-81 (yellow circles), a 41 Yankee trawl was used for the NMFS spring survey while a 36 Yankee
1960
1965
1970
1975
1980
1985
1990
1995
2000
2005
2010
2015
0 1 2 3 4 5 6 7 8 9 10
Su
rve
y ye
ar
Age
DFO Spring
+
1960
1965
1970
1975
1980
1985
1990
1995
2000
2005
2010
2015
0 1 2 3 4 5 6 7 8 9 10
Age
NMFS Spring
+
1960
1965
1970
1975
1980
1985
1990
1995
2000
2005
2010
2015
-1 0 1 2 3 4 5 6 7 8 9Age
NMFS Fall
+

Shaded text has not been updated.
68
was used in the other years. Length based conversion coefficients have been applied to the NMFS surveys since the 2009 survey to make them comparable to surveys undertaken by the Albatross IV. Symbol size has not been adjusted between surveys for the catchability of the survey.
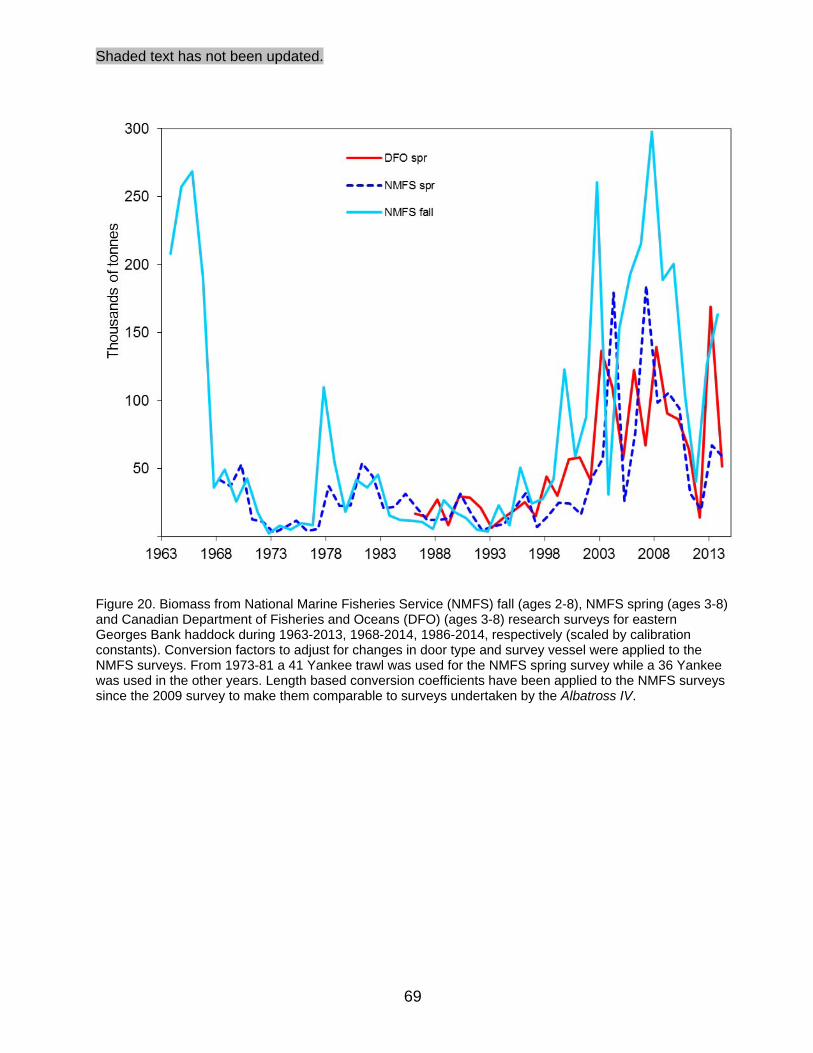
Shaded text has not been updated.
69
Figure 20. Biomass from National Marine Fisheries Service (NMFS) fall (ages 2-8), NMFS spring (ages 3-8) and Canadian Department of Fisheries and Oceans (DFO) (ages 3-8) research surveys for eastern Georges Bank haddock during 1963-2013, 1968-2014, 1986-2014, respectively (scaled by calibration constants). Conversion factors to adjust for changes in door type and survey vessel were applied to the NMFS surveys. From 1973-81 a 41 Yankee trawl was used for the NMFS spring survey while a 36 Yankee was used in the other years. Length based conversion coefficients have been applied to the NMFS surveys since the 2009 survey to make them comparable to surveys undertaken by the Albatross IV.

Shaded text has not been updated.
70
Figure 21. Year-class abundance for ages 0 and 1 from the National Marine Fisheries Service (NMFS) fall survey for 1963-2013 and ages 1 and 2 from the NMFS spring survey for 1968-2014 and the Canadian Department of Fisheries and Oceans (DFO) research survey for 1986-2014 (scaled by calibration constants) for eastern Georges Bank haddock. Conversion factors to adjust for changes in door type and survey vessel were applied to the NMFS surveys. From 1973-81 a 41 Yankee trawl was used for the NMFS spring survey while a 36 Yankee was used in the other years. Length based conversion coefficients have been applied to the NMFS surveys since the 2009 survey to make them comparable to surveys undertaken by the Albatross IV.
10
20
30
40
1962 1967 1972 1977 1982 1987 1992 1997 2002 2007 2012
Rec
ruits
(m
illio
ns)
Year-class
40
1040
2040
3040
4040
5040
6040NMFS fall 0
DFO spr 1
NMFS spr 1
NMFS fall 1
DFO spr 2
NMFS spr 2
1975
yc
1985
yc
1998
yc
2000
yc
2003
yc
2010
yc

Shaded text has not been updated.
71
Figure 22. Average weights (upper panel) and lengths (lower panel) at age for eastern Georges Bank haddock derived from Canadian Department of Fisheries and Oceans surveys during 1986-2014.

Shaded text has not been updated.
72
Figure 23. Residuals of survey abundance indices, by year and age group, from the Canadian Department of Fisheries and Oceans (DFO) research survey 1986 to 2014 and the National Marine Fisheries Service (NMFS) spring and autumn surveys during 1969 to 2014 and 1969 to 2013, respectively, for eastern Georges Bank haddock. Solid symbols indicate positive values, open symbols indicate negative values. Bubble area is proportional to magnitude. From 1973-81 (light blue circles), a Yankee 41 trawl was used for the NMFS spring survey while a Yankee 36 trawl was used in the other years.
1967
1972
1977
1982
1987
1992
1997
2002
2007
2012
0 1 2 3 4 5 6 7 8 9
DFO Spring1967
1972
1977
1982
1987
1992
1997
2002
2007
2012
0 1 2 3 4 5 6 7 8 9
NMFS Spring1967
1972
1977
1982
1987
1992
1997
2002
2007
2012
-1 0 1 2 3 4 5 6
NMFS Fall

Shaded text has not been updated.
73
Figure 24. Age by age plots of the observed and predicted ln abundance index versus ln population numbers for eastern Georges Bank haddock from the Department of Fisheries and Oceans survey during 1986-2014.
86
87
88
89
9091
929394
9596 9798
99
00
01
0203
04
05
06
070809
10
11
12
13
14
3
5
7
9
11
13
6 8 10 12 14
lnC
PUE
Age 1
86
87
88
89
90
9192
93
94
959697
9899
00
01
02
0304
05
0607
08
09
10
11
12
13
14
3
7
11
16
6 8 10 12 14
lnC
PUE
Age 2
86
87
88
89
90
91
92
93
94 9596
97
989900
01
02
03
04
05
06
0708
091011
12
13
14
4
6
8
10
12
6 8 10 12
lnC
PUE
Age 3
86
87
88
89
90
91
929394
9596979899
00
01
02
03
04
0506
07
08 09
1011
12
13
14
4
6
8
10
12
5 7 9 11 13
lnC
PUE
Age 4
86
87
88
89
90
91
92
93
94
95
96 9798
9900
0102
03
04
05
06
07
08
09
10
111213 14
3
5
7
9
11
4.9 6.9 8.9 10.9
lnC
PUE
Age 5
86
87
8889
90
91
92
93
94
9596
97
98
9900010203
0405
06
07
08
09
1011
12
13
14
2
4
6
8
10
4 6 8 10 12
lnC
PUE
Age 6
868788
89
90
91
92
93
94
9697
98 9900
0102
0304
05
06
07
08
09
10
111213
14
2
4
6
8
10
4.00 6.00 8.00 10.00 12.00
lnC
PUE
ln Population
Age 7
86
8788
89
90
91
92
93
94
95
9697
98 99
0001
0203 0405
06
07
08
09
10
11
12
13
14
1.4
3.4
5.4
7.4
9.4
1.3 3.3 5.3 7.3 9.3
lnC
PUE
ln Population
Age 8

Shaded text has not been updated.
74
Figure 25. Age by age plots of the observed and predicted ln abundance index versus ln population numbers for eastern Georges Bank haddock from the National Marine Fisheries Service spring survey with a Yankee 36 net during 1969-1972 and 1982-2014.
69
70
82
83
84
85
86
87
88
89
90
9192 93
94959697
98
99
00
01
02
03
04
05
06
06070809
10
1112
13
14
2
4
6
8
10
12
6 8 10 12 14
lnC
PUE
Age 1
69
70
71
83
8485
86
87
88
89
90
91
92
93
94
9596
9798
99
00 0102
03
04
05
06
06
07
0809
1011
12
1314
3
5
7
9
11
13
5 7 9 11 13
lnC
PUE
Age 2
69
72
82
83
8485
86
87
88
89
90
91
92
9394
95
9697
98
99
0001 02
0304
05
06
06
07
08
09
10
1112
13
14
4.8
6.8
8.8
10.8
5.8 7.8 9.8 11.8
lnC
PUE
Age 3
69
70
82
83
84
8586
87
88
89
90
91
92
939495
9697
98
9900
0102
03
04
05
06
06
07
08
09
10
1113
14
4
6
8
10
12
4 6 8 10 12
lnC
PUE
Age 4
6970
71
72
82
83
8485
8687
88
89
90
91
92
939495
96
97
989900
01
02
030405
06
07
08
09
10
111213
14
3
5
7
9
3.8 5.8 7.8 9.8 11.8
lnC
PUE
Age 5
69
70
71
72
82
83
8485
8687 88
89
9091
92
93
94 9596
97 98
9900
010203
04
05
06
0708
09
10
1112
13
14
3
5
7
9
11
4 6 8 10 12
lnC
PUE
Age 6
69
70
71
72
82
85
86
8788
89
90
91
9293
94
95
9697
98
99
0001
02
0304
05 06
06
07
0809
10
11
12
13
14
1
3
5
7
9
11
2 4 6 8 10 12
lnC
PUE
ln Population
Age 7
69
70
71
72
84
8586
8788
89
91 93
949597
98
00
01
0203
04
05
06
04
05
06
07
08
09
11
13
14
2
4
6
8
3 5 7 9 11
lnC
PUE
ln Population
Age 8

Shaded text has not been updated.
75
Figure 26. Age by age plots of the observed and predicted ln abundance index versus ln population numbers for eastern Georges Bank haddock from the National Marine Fisheries Service spring survey with a Yankee 41 net during 1973-1981.
73
74
75
76
77
79
8081
4
6
8
10
7.9 9.9
lnC
PUE
Age 1
73
74
7576
77
7879
80
81
5
7
9
11
7 9 11
lnC
PUE
Age 2
7475
7677
78
7980
81
5
7
9
11
7 9 11
lnC
PU
E
Age 3
73 75 7677
78
79
80
81
6
8
10
6 8 10
lnC
PU
E
Age 4
73
7476
7778
79
80
81
3
5
7
9
3 5 7 9
lnC
PUE
Age 5
75
77
78
79
80
81
4
6
8
4 6 8
lnC
PUE
Age 6
73
74
7578
7980 81
1
3
5
7
0 2 4 6 8
lnC
PUE
ln Population
Age 7
74
75
7778
79
80
81
2
4
6
2 4 6
lnC
PUE
ln Population
Age 8
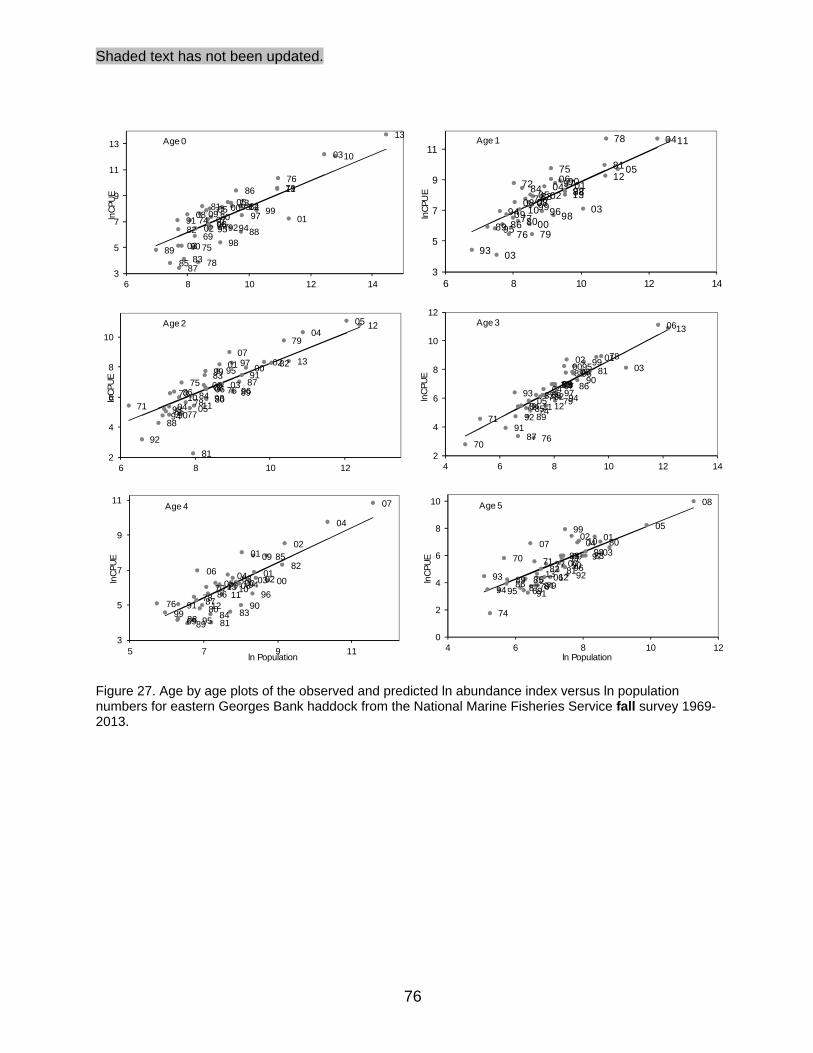
Shaded text has not been updated.
76
Figure 27. Age by age plots of the observed and predicted ln abundance index versus ln population numbers for eastern Georges Bank haddock from the National Marine Fisheries Service fall survey 1969-2013.
69
7273
74
75
76
77
78
79
8081
82
83
84
85
86
87
88
89 90
9192
93
94959697
98
990001
02
03
03
0505
060708 09
10
11
12
13
3
5
7
9
11
13
6 8 10 12 14
lnC
PUE
Age 0
72
74
75
76
77
78
7980
81
8384
86
88
89
9092
93
94
95
96
97
9899
00
0102
03
04
05
08
03
04
05
06
070809 10
11
12
13
3
5
7
9
11
6 8 10 12 14
lnC
PUE
Age 1
71
7375
76
7778
79
80
81
8283
84
85
8687
88
89
90
91
92
9394
95
96
97
98
99 0001 02
03
04
0504
05
06
07
080910
11
12
13
2
4
6
8
10
6 8 10 12
lnC
PUE
Age 2
69
70
7172 74
75
76
77
78
79
81
82838485
86
87
88
89
90
9192
93 94
9596
9798
99000102
03
0405
06
07
080910
11 12
13
2
4
6
8
10
12
4 6 8 10 12 14
lnC
PUE
Age 3
69
70
7678
79
80
81
82
8384
85
8687
8889
9091
94
95
96
99
0001020304
00
0102
03
04
0506
07
08
09
1011
12
13
3
5
7
9
11
5 7 9 11
lnC
PUE
ln Population
Age 4
69
70 71
74
76
77
7879
80
8182
83
848586 87
88
89
90
91
9293
9495
969798
99
00
0102
0304
05
06
07
08
09
10
11
1213
0
2
4
6
8
10
4 6 8 10 12
lnC
PUE
ln Population
Age 5
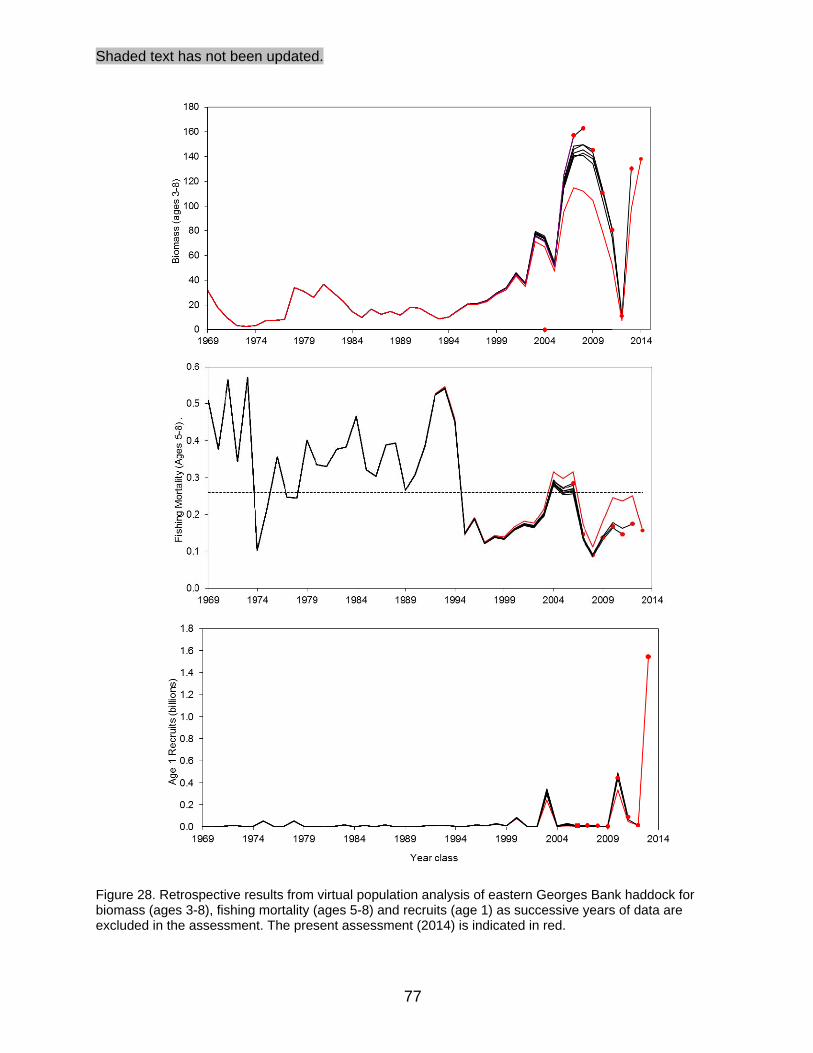
Shaded text has not been updated.
77
Figure 28. Retrospective results from virtual population analysis of eastern Georges Bank haddock for biomass (ages 3-8), fishing mortality (ages 5-8) and recruits (age 1) as successive years of data are excluded in the assessment. The present assessment (2014) is indicated in red.

Shaded text has not been updated.
78
Figure 29. Relative retrospective results from virtual population analysis of eastern Georges Bank haddock for biomass (ages 3-8), fishing mortality (ages 5-8) and recruits (age 1) as successive years of data are excluded in the assessment. Changes are relative to the 2014 assessment.
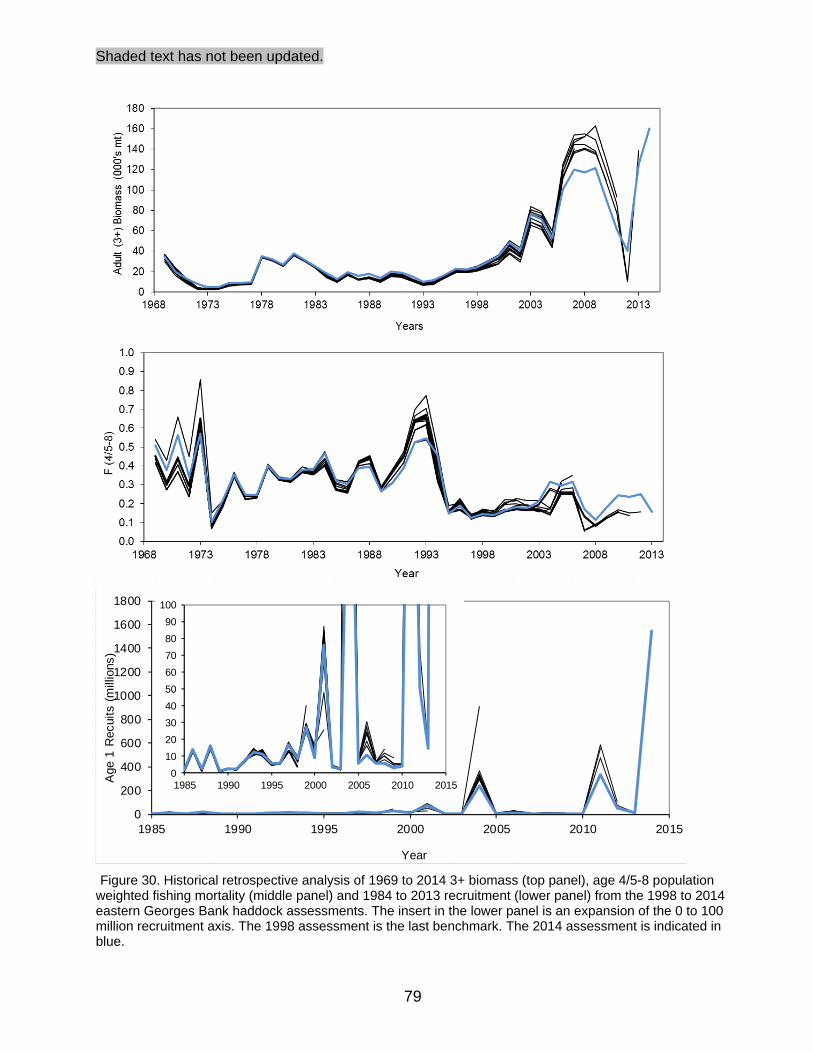
Shaded text has not been updated.
79
Figure 30. Historical retrospective analysis of 1969 to 2014 3+ biomass (top panel), age 4/5-8 population weighted fishing mortality (middle panel) and 1984 to 2013 recruitment (lower panel) from the 1998 to 2014 eastern Georges Bank haddock assessments. The insert in the lower panel is an expansion of the 0 to 100 million recruitment axis. The 1998 assessment is the last benchmark. The 2014 assessment is indicated in blue.
0
200
400
600
800
1000
1200
1400
1600
1800
1985 1990 1995 2000 2005 2010 2015
Age
1 R
ecui
ts (
mill
ions
)
Year
0
10
20
30
40
50
60
70
80
90
100
1985 1990 1995 2000 2005 2010 2015

Shaded text has not been updated.
80
Figure 31. The 1969 to 2014 eastern Georges Bank adult haddock (ages 3+) biomass trend from virtual population analysis compared with the survey adult biomass (scaled with catchabilities) trends.
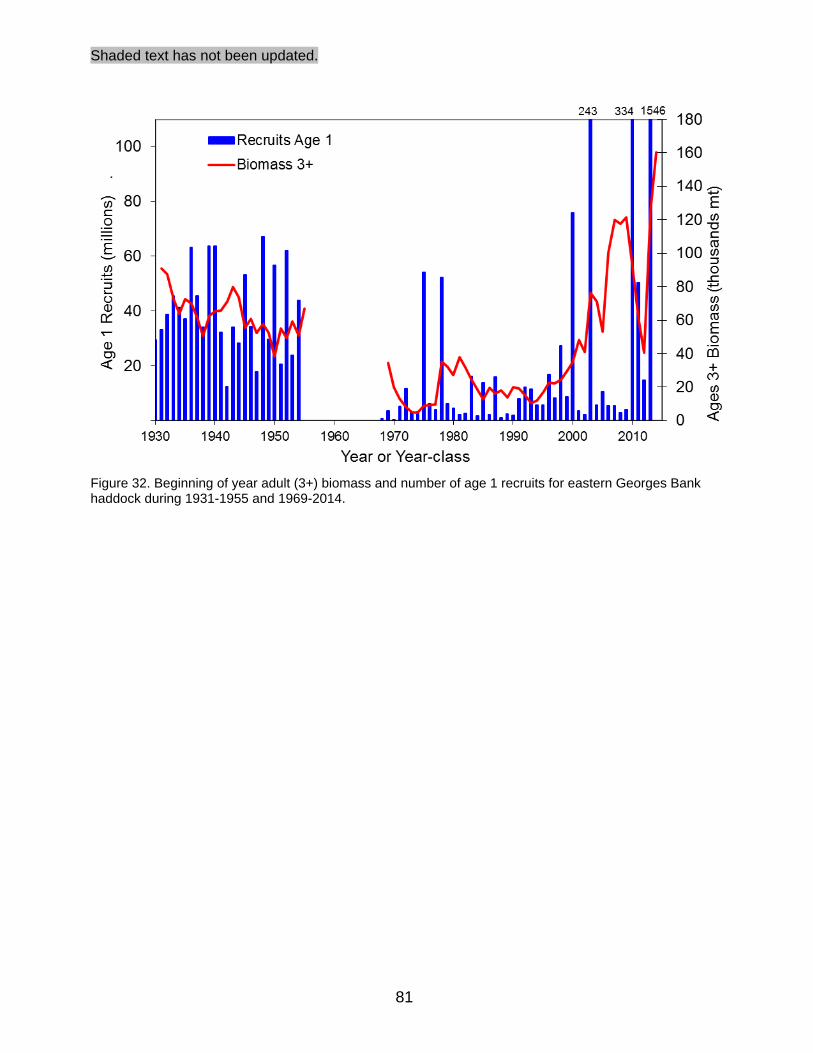
Shaded text has not been updated.
81
Figure 32. Beginning of year adult (3+) biomass and number of age 1 recruits for eastern Georges Bank haddock during 1931-1955 and 1969-2014.

Shaded text has not been updated.
82
Figure 33. Cumulative probability distribution with 80% confidence intervals for 2014 age 3+ biomass (000 mt) and 2013 age 5-8 fishing mortality for eastern Georges Bank haddock.
0
0.25
0.5
0.75
1
0 50 100 150 200 250 300 350
Pro
ba
bili
ty
Biomass (000 mt)
0
0.25
0.5
0.75
1
0 0.05 0.1 0.15 0.2 0.25 0.3
Pro
ba
bili
ty
Fishing Mortality

Shaded text has not been updated.
83
Figure 34. Average weights at age for eastern Georges Bank haddock from the Canada/USA commercial groundfish fishery during 1969-2012 and from the Canadian Department of Fisheries and Oceans survey during 1986-2013. Note: This figure has not been updated for 2014.
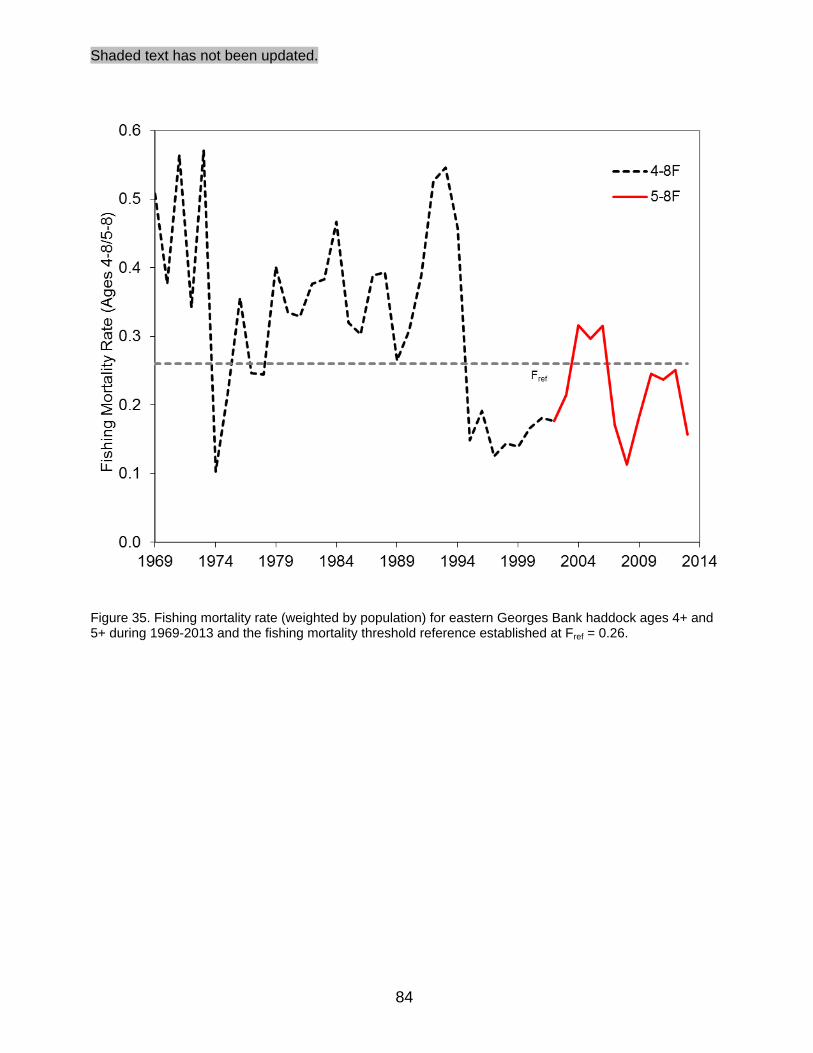
Shaded text has not been updated.
84
Figure 35. Fishing mortality rate (weighted by population) for eastern Georges Bank haddock ages 4+ and 5+ during 1969-2013 and the fishing mortality threshold reference established at Fref = 0.26.

Shaded text has not been updated.
85
Figure 36. Partial recruitment of eastern Georges Bank haddock for the population weighted average of 1998 to 2002, 2003 to 2013, 2009 to 2013 and 2011 to 2013 and for the 2003 year class. The partial recruitment is normalized to ages 4-8 for years before 2003 and to ages 5-8 for years after 2002.
Figure 37. Surplus production of eastern Georges Bank haddock available to the commercial fishery compared to the harvested yield during 1969-2013.
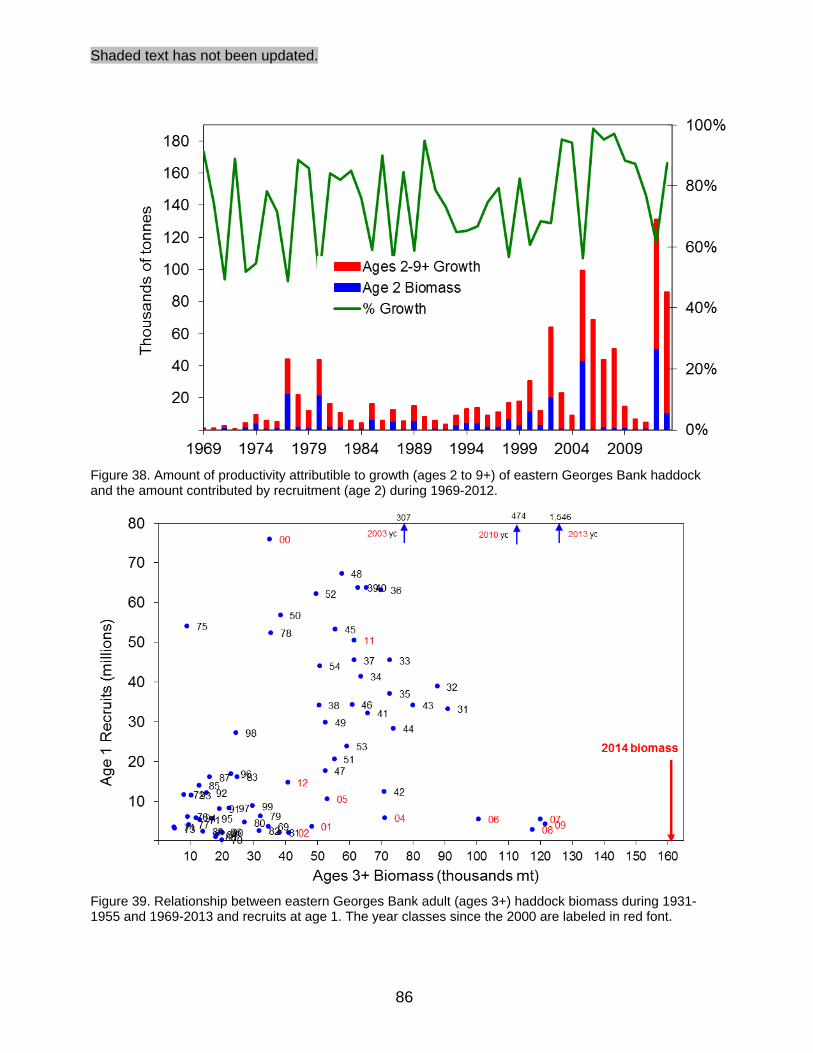
Shaded text has not been updated.
86
Figure 38. Amount of productivity attributible to growth (ages 2 to 9+) of eastern Georges Bank haddock and the amount contributed by recruitment (age 2) during 1969-2012.
Figure 39. Relationship between eastern Georges Bank adult (ages 3+) haddock biomass during 1931-1955 and 1969-2013 and recruits at age 1. The year classes since the 2000 are labeled in red font.

Shaded text has not been updated.
87
Figure 40. Ratio of recruits (numbers at age 1) to spawning biomass (kg) for eastern Georges Bank haddock during 1931-1955 and during 1969-2013. Upper graph is in absolute numbers, lower graph is on a ln scale. Dotted lines in lower graph indicate averages over the two periods.
-5.4
-4.4
-3.4
-2.4
-1.4
-0.4
0.6
1.6
2.6
1930 1940 1950 1960 1970 1980 1990 2000 2010
ln R
ecru
its/S
paw
ning
Bio
mas
s
Year-class
1975
20002003 2010
2013
0
1
2
3
4
5
6
7
8
9
10
11
12
13
1930 1940 1950 1960 1970 1980 1990 2000 2010
Rec
ruits
/Spa
wni
ng B
iom
ass
Year-class
1975
2000
20032010
2013

Shaded text has not been updated.
88
Figure 41. Condition as indicated by Fulton’s K for eastern Georges Bank haddock from the Canadian Department of Fisheries and Oceans survey for age group 1-9 during 1986-2014 (upper) and from the NMFS fall survey for ages 0-5 (lower) compared to the average for each time series. The 2003, 2010 and 2013 year classes are also shown.

Shaded text has not been updated.
89
Figure 42. Length at age of eastern Georges Bank haddock year classes from the DFO survey.

Shaded text has not been updated.
90
Figure 43. Eastern Georges Bank haddock total mortality (Z’s) for ages 3 to 9+ for 1986 to 2013 from the Canadian Department of Fisheries and Oceans survey and the age 8 fishing mortality from VPA (bottom right).
-3
-2
-1
0
1
2
3
1985 1990 1995 2000 2005 2010
Sur
vey
Z
Age 3
-3
-2
-1
0
1
2
3
1985 1990 1995 2000 2005 2010
Sur
vey
Z
Age 4
-3
-2
-1
0
1
2
3
1985 1990 1995 2000 2005 2010
Sur
vey
Z
Age 5
-3
-2
-1
0
1
2
3
1985 1990 1995 2000 2005 2010
Sur
vey
Z
Age 6
-3
-2
-1
0
1
2
3
1985 1990 1995 2000 2005 2010
Sur
vey
Z
Age 7
-3
-2
-1
0
1
2
3
1985 1990 1995 2000 2005 2010
Sur
vey
Z
Age 8
-3
-2
-1
0
1
2
3
1985 1990 1995 2000 2005 2010
Sur
vey
Z
Age 9+
0.0
0.1
0.2
0.3
0.4
0.5
0.6
1985 1990 1995 2000 2005 2010
4-8
F
F Age 8

Shaded text has not been updated.
91
Figure 44. Risk of 2015 fishing mortality exceeding Fref = 0.26 for eastern Georges Bank haddock for increasing catch quotas.
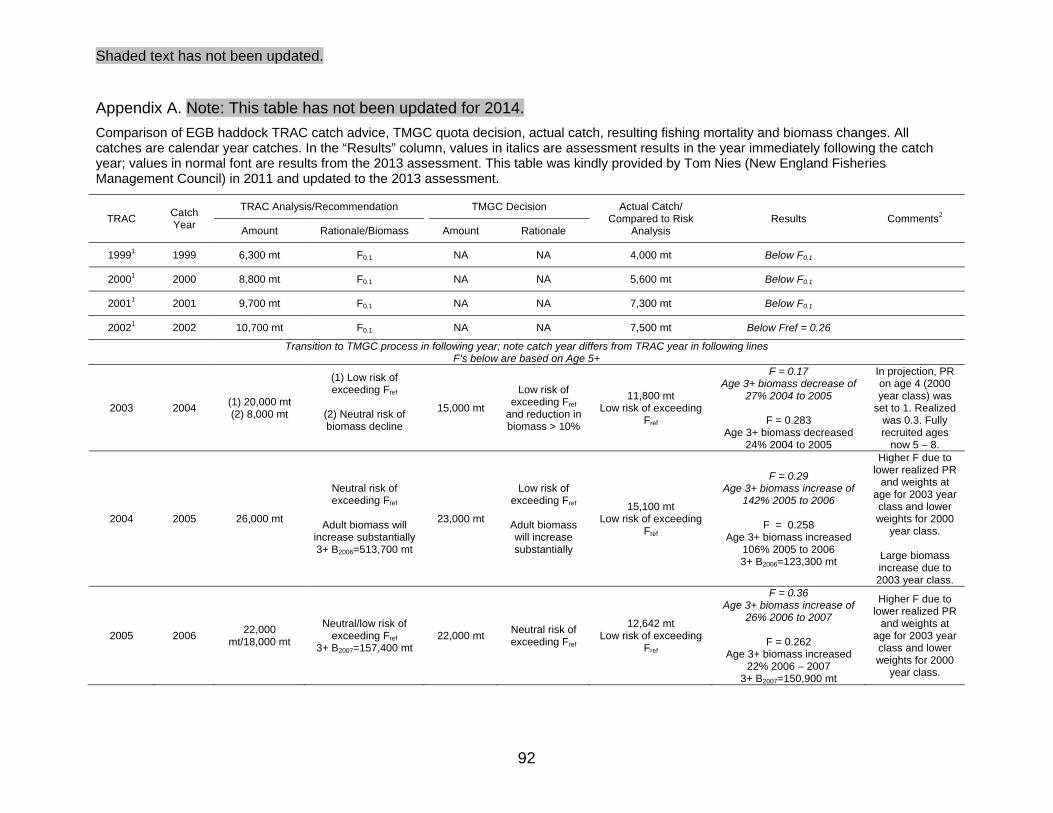
Shaded text has not been updated.
92
Appendix A. Note: This table has not been updated for 2014.
Comparison of EGB haddock TRAC catch advice, TMGC quota decision, actual catch, resulting fishing mortality and biomass changes. All catches are calendar year catches. In the “Results” column, values in italics are assessment results in the year immediately following the catch year; values in normal font are results from the 2013 assessment. This table was kindly provided by Tom Nies (New England Fisheries Management Council) in 2011 and updated to the 2013 assessment.
TRAC Catch Year
TRAC Analysis/Recommendation TMGC Decision Actual Catch/ Compared to Risk
Analysis Results Comments2
Amount Rationale/Biomass Amount Rationale
19991 1999 6,300 mt F0.1 NA NA 4,000 mt Below F0.1
20001 2000 8,800 mt F0.1 NA NA 5,600 mt Below F0.1
20011 2001 9,700 mt F0.1 NA NA 7,300 mt Below F0.1
20021 2002 10,700 mt F0.1 NA NA 7,500 mt Below Fref = 0.26
Transition to TMGC process in following year; note catch year differs from TRAC year in following lines F’s below are based on Age 5+
2003 2004 (1) 20,000 mt (2) 8,000 mt
(1) Low risk of exceeding Fref
(2) Neutral risk of biomass decline
15,000 mt
Low risk of exceeding Fref
and reduction in biomass > 10%
11,800 mt Low risk of exceeding
Fref
F = 0.17 Age 3+ biomass decrease of
27% 2004 to 2005
F = 0.283 Age 3+ biomass decreased
24% 2004 to 2005
In projection, PR on age 4 (2000 year class) was
set to 1. Realized was 0.3. Fully recruited ages
now 5 – 8.
2004 2005 26,000 mt
Neutral risk of exceeding Fref
Adult biomass will
increase substantially 3+ B2006=513,700 mt
23,000 mt
Low risk of exceeding Fref
Adult biomass will increase substantially
15,100 mt Low risk of exceeding
Fref
F = 0.29 Age 3+ biomass increase of
142% 2005 to 2006
F = 0.258 Age 3+ biomass increased
106% 2005 to 2006 3+ B2006=123,300 mt
Higher F due to lower realized PR
and weights at age for 2003 year class and lower weights for 2000
year class.
Large biomass increase due to 2003 year class.
2005 2006 22,000
mt/18,000 mt
Neutral/low risk of exceeding Fref
3+ B2007=157,400 mt 22,000 mt
Neutral risk of exceeding Fref
12,642 mt Low risk of exceeding
Fref
F = 0.36 Age 3+ biomass increase of
26% 2006 to 2007
F = 0.262 Age 3+ biomass increased
22% 2006 – 2007 3+ B2007=150,900 mt
Higher F due to lower realized PR
and weights at age for 2003 year class and lower weights for 2000
year class.

Shaded text has not been updated.
93
TRAC Catch Year
TRAC Analysis/Recommendation TMGC Decision Actual Catch/ Compared to Risk
Analysis Results Comments2
Amount Rationale Amount Rationale
2006 2007 19,000
mt/16,000 mt
Neutral/low risk of exceeding Fref
3+ B2008=161,900 mt 19,000 mt
Neutral risk of exceeding Fref
12,680 mt Low risk of exceeding
Fref
F = 0.14 Age 3+ biomass increase of
4% 2007 – 2008
F = 0.136 Age 3+ biomass increased
<1% 2007 to 2008 3+ B2008=151,300 mt
2003 year class specific values for projection inputs.
2007 2008 26,700 mt/ 23,000 mt
Neutral/low risk of exceeding Fref
3+ B2009=145,700 mt 23,000 mt
Low risk of exceeding Fref
15,995 mt Low risk of exceeding
Fref
F = 0.09 Age 3+ biomass increase of
7% 2008 to 2009
F = 0.087 Age 3+ biomass increased
6% 2008 to 2009 3+ B2009=159,900 mt
2003 year class specific values for projection inputs.
2008 2009 33,000 mt /28,000 mt
Neutral/low risk of exceeding Fref
3+ B2010=125,500 mt 30,000 mt
Low to neutral risk of
exceeding Fref
19,707 mt Low risk of exceeding
Fref
F = 0.13 Age 3+ biomass decrease of
21% 2009 to 2010
F = 0.133 Age 3+ biomass decreased
22% 2009 to 2010 3+ B2010=125,000 mt
2003 year class specific values for projection inputs.
2009 2010 29,600 mt/ 25,900 mt
Neutral/low risk of exceeding Fref
3+ B2011=94,700 mt 29,600 mt
Low to neutral risk of
exceeding Fref
18,794 mt Low risk of exceeding
Fref
F = 0.148 Age 3+ biomass decrease of
28% 2010 to 2011
F = 0.168 Age 3+ biomass decreased
29% 2010 to 2011 3+ B2011=89,100 mt
2003 and 2005 year class
specific values for projection inputs.
2010 2011 22,000 mt/ 19,000 mt
Neutral/low risk of exceeding Fref
3+ B2012=67,800 mt 22,000 mt
Neutral risk of exceeding Fref
12,655 mt Low risk of exceeding
Fref
F = 0.135 Age 3+ biomass decrease of
29% 2011 to 2012
F = 0.152 Age 3+ biomass decreased
30% 2011 to 2012 3+ B2012=62,700 mt
2003 and 2005 year class
specific values for projection inputs.
2011 2012 16,000 mt/ 13,900 mt
Neutral/low risk of exceeding Fref
Adult biomass will increase substantially
from 2012 to 2013 (2010 year class )
3+ B2013=188,700 mt
16,000mt Neutral risk of exceeding Fref
5,631 mt Low risk of exceeding
Fref
F = 0.157 Age 3+ biomass increased
193% 2012 to 2013 3+ B2013=183,600 mt
2003, 2005 and 2010 year class
specific values for projection inputs.
PR9+ for projection higher
than model

Shaded text has not been updated.
94
TRAC Catch Year
TRAC Analysis/Recommendation TMGC Decision Actual Catch/ Compared to Risk
Results Comments2
estimate.
2012 2013 10,400 mt/ 9,300 mt
Neutral/low risk of exceeding Fref
Adult biomass will increase substantially
from 2012 to 2013 (growth of 2010 year
class) 3+B2014= 306,000mt
10,400 mt Neutral risk of exceeding Fref
N/A N/A
2003 year class values for 2010
year class inputs. Model estimate
for PR9+ used for projection.
2013 2014 31,500 mt/ 27,000 mt
Neutral/low risk of exceeding Fref
Adult biomass will decrease slightly from
series maximum projected for 2014.
3+B2015=240,000 mt
N/A N/A N/A N/A
2003 year class values for 2010
year class inputs. Model estimate
for PR9+ used for projection.
1 Prior to implementation of US/CA Understanding 2Comments by L. Van Eeckhaute