6.3.10 Haddock ( Melanogrammus aeglefinus ) in … Reports/Advice/2015...Haddock (Melanogrammus...
12
ICES Advice on fishing opportunities, catch, and effort Greater North Sea and Celtic Seas Ecoregions Published 30 June 2015 Version 2, 11 November 2016 ICES Advice 2015, Book 6 1 6.3.10 Haddock ( Melanogrammus aeglefinus ) in Subarea IV and Divisions VIa and IIIa West (North Sea, West of Scotland, Skagerrak) ICES stock advice ICES advises that when the MSY approach is applied, catches in 2016 should be no more than 59 945 tonnes. If this stock is not under the EU landing obligation in 2016 and discard rates do not change from the average (2012–2014), this implies landings of no more than 48 621 tonnes. Stock development over time Fishing mortality (F) has been below FMSY since 2008 and spawning-stock biomass (SSB) has been above MSY Btrigger since 2008. Recruitment is characterized by occasional large year classes, the last of which was the strong 1999 year class. The 2014 recruitment estimate is higher than recent poor recruitment years, but is still below the long-term average. Figure 6.3.10.1 * Haddock in Subarea IV and Divisions VIa and IIIa West. Summary of stock assessment (weights in thousand tonnes), last year’s recruitment estimate is shaded. Stock and exploitation status Table 6.3.10.1 Haddock in Subarea IV and Divisions VIa and IIIa West. State of the stock and fishery, relative to reference points. Fishing pressure Stock size 2012 2013 2014 2013 2014 2015 Maximum Sustainable Yield FMSY Appropriate MSY Btrigger Above trigger Precautionary approach Fpa, Flim Below possible reference points Bpa, Blim Full reproductive capacity Management plan FMGT - - - Not applicable SSBMGT - - - Not applicable * Version 2: Summary of stocks assessment figures updated
Transcript of 6.3.10 Haddock ( Melanogrammus aeglefinus ) in … Reports/Advice/2015...Haddock (Melanogrammus...

ICES Advice on fishing opportunities, catch, and effort Greater North Sea and Celtic Seas Ecoregions Published 30 June 2015 Version 2, 11 November 2016
ICES Advice 2015, Book 6 1
6.3.10 Haddock (Melanogrammus aeglefinus) in Subarea IV and Divisions VIa and IIIa West (North Sea, West of Scotland, Skagerrak)
ICES stock advice ICES advises that when the MSY approach is applied, catches in 2016 should be no more than 59 945 tonnes. If this stock is not under the EU landing obligation in 2016 and discard rates do not change from the average (2012–2014), this implies landings of no more than 48 621 tonnes. Stock development over time Fishing mortality (F) has been below FMSY since 2008 and spawning-stock biomass (SSB) has been above MSY Btrigger since 2008. Recruitment is characterized by occasional large year classes, the last of which was the strong 1999 year class. The 2014 recruitment estimate is higher than recent poor recruitment years, but is still below the long-term average.
Figure 6.3.10.1* Haddock in Subarea IV and Divisions VIa and IIIa West. Summary of stock assessment (weights in thousand tonnes), last year’s recruitment estimate is shaded.
Stock and exploitation status Table 6.3.10.1 Haddock in Subarea IV and Divisions VIa and IIIa West. State of the stock and fishery, relative to reference points.
Fishing pressure Stock size 2012 2013 2014 2013 2014 2015 Maximum Sustainable Yield FMSY Appropriate MSY
Btrigger Above trigger
Precautionary approach
Fpa, Flim
Below possible reference points
Bpa, Blim Full reproductive capacity
Management plan FMGT - - - Not applicable SSBMGT - - - Not applicable
* Version 2: Summary of stocks assessment figures updated
Published 30 June 2015 Advice on fishing opportunities, catch, and effort
2 ICES Advice 2015, Book 6
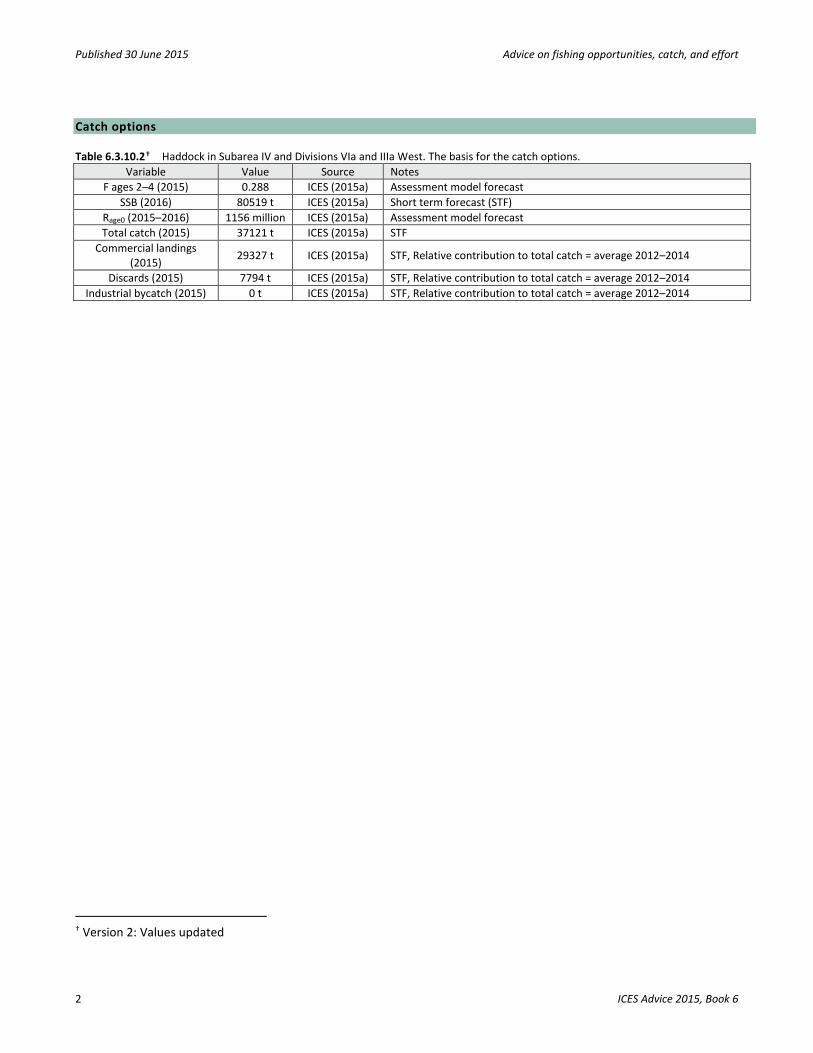
Catch options Table 6.3.10.2† Haddock in Subarea IV and Divisions VIa and IIIa West. The basis for the catch options.
Variable Value Source Notes F ages 2–4 (2015) 0.288 ICES (2015a) Assessment model forecast
SSB (2016) 80519 t ICES (2015a) Short term forecast (STF) Rage0 (2015–2016) 1156 million ICES (2015a) Assessment model forecast Total catch (2015) 37121 t ICES (2015a) STF
Commercial landings (2015) 29327 t ICES (2015a) STF, Relative contribution to total catch = average 2012–2014
Discards (2015) 7794 t ICES (2015a) STF, Relative contribution to total catch = average 2012–2014 Industrial bycatch (2015) 0 t ICES (2015a) STF, Relative contribution to total catch = average 2012–2014
† Version 2: Values updated

ICES Advice on fishing opportunities, catch, and effort Published 30 June 2015
ICES Advice 2015, Book 6 3
Table 6.3.10.3‡ Haddock in Subarea IV and Divisions VIa and IIIa West. The catch options. All weights in thousand tonnes.
Rationale Total catch 2016
Wanted catch* 2016
Unwanted
catch* 2016
IBC** 2016 Basis Total F
2016
F(wanted)
2016
F(unwanted) 2016
F(IBC) 2016
SSB 2017
% SSB change***
% TAC Change wanted catch^
MSY approach 59.945 48.621 11.324 0.000 FMSY 0.37 0.31 0.06 0 162.811 102 2
Previous management strategy ^^
49.254 39.991 9.262 0.000 FMGT from previous
MS 0.3 0.251 0.049 0 173.242 115 -16
IBC only 0.000 0.000 0.000 0.000 No HC fishery 0.000 0.000 0.000 0.000 221.973 176 -100
Other options
36.424 29.636 6.788 0.000 0.75 × F(2015) 0.216 0.181 0.035 0 185.76 131 -38
49.302 40.156 9.146 0.000 F(2015) 0.288 0.241 0.047 0 172.836 115 -16
58.418 47.388 11.03 0.000 1.25 × F(2015) 0.36 0.301 0.059 0 164.301 104 -1
49.992 40.588 9.404 0.000 15% TAC decrease 0.305 0.255 0.05 0 172.519 114 -15
58.864 47.751 11.113 0.000 Rollover TAC 0.363 0.303 0.059 0 163.856 104 0
67.735 54.914 12.821 0.000 15% TAC increase 0.42 0.352 0.069 0 155.194 93 15
Mixed-fisheries options – minor differences with calculation above can occur because of the different methodology used (ICES, 2015b). Not updated in the current version Maximum 102.907 A 0.55 164.911 35 Minimum 23.760 B 0.11 243.610 100 Cod 42.903 C 0.20 224.129 84 SQ effort 51.330 D 0.24 215.637 77 Value 60.086 E 0.29 206.868 70 Effort_Mgt 40.751 F 0.19 226.307 86
* “Wanted” and “unwanted” catch are used to described fish that would be landed and discarded in the absence of the EU landing obligation based on discard rates estimates for 2012–2014. ** Industrial bycatch (IBC) also based on average proportion of the total catch for 2012–2014. *** SSB 2017 relative to SSB 2016. ^ Wanted catch 2016 relative to the combined TACs 2015 (TAC IV = 40.711; TAC IIIa = 2.504; TAC VIa = 4.536; Total = 47.751). ^^ EU–Norway management strategy for Subarea IV and Division IIIa-West applied to whole stock area. Mixed-fisheries assumptions (note:”fleet’s stock share” is used to describe the share of the fishing opportunities for each particular fleet, which has been calculated based on the single-stock advice for 2016 and the historical proportion of the stock landings taken by the fleet): A. Maximum scenario: Each fleet stops fishing when its last stock share is exhausted. B. Minimum scenario: Each fleet stops fishing when its first stock share is exhausted. C. Cod scenario: Each fleet stops fishing when its cod stock share is exhausted. D. SQ (status quo) effort scenario: The effort of each fleet in 2015 and 2016 is as in 2014. E. Value scenario: The effort of each fleet is equal to the weighted average of the efforts required to catch the fleet’s quota share of each of the stocks, where the weights are the relative catch values of each stock in the fleet’s portfolio. F. Effort management scenario: Effort reductions according to cod and flatfish management plans.
‡ Version 2: Catch options updated

Published 30 June 2015 Advice on fishing opportunities, catch, and effort
4 ICES Advice 2015, Book 6
Basis of the advice Table 6.3.10.4 Haddock in Subarea IV and Divisions VIa and IIIa West. The basis of the advice.
Advice basis MSY approach Management plan There is currently no agreed management plan for haddock for the stock area.
Quality of the assessment The overall reporting of catch data provided to ICES has improved during 2012–2014 through such aspects as the fully documented fisheries (FDF) programme and increased coverage by the Scottish industry/science observer sampling scheme. The assessment is based on the North Sea (Subarea IV and Division IIIaW) survey indices which are considered to be sufficiently representative of the whole stock. No combined survey index for the whole area is available. Some of the differences from the previous assessment are due to changes in the estimates of natural mortality used in the assessment (ICES, 2014a).
Figure 6.3.10.2§ Haddock in Subarea IV and Divisions VIa and IIIa West. Historical assessment results (final-year recruitment estimates included). Horizontal lines show FMSY (solid), Blim (dashed), and the MSY Btrigger (dotted).
Issues relevant for the advice This is the second year in which advice has been provided for the haddock stock in Subarea IV, Division IIIaW, and Division VIa. Up to and including 2013, separate advice was provided for haddock in the North Sea and Skagerrak (Subarea IV and Division IIIaW) and West of Scotland (Division VIa). For this reason the EU–Norway management strategy is no longer considered appropriate. Results from a North Sea mixed-fisheries analysis are presented in ICES (2015c). Assuming fishing patterns and catchability in 2015 and 2016 are unchanged from those in 2014, and in the case of a strictly implemented discard ban, North Sea whiting and Nephrops FU 6 (if it was managed with an own TAC for the FU) would be the most limiting stocks, constraining 46% and 34% of the 2014 effort, respectively. Results for the haddock stock are also included as additional rows in the catch options table of this advice sheet.
§ Version 2: Historical assessment figures updated
ICES Advice on fishing opportunities, catch, and effort Published 30 June 2015
ICES Advice 2015, Book 6 5
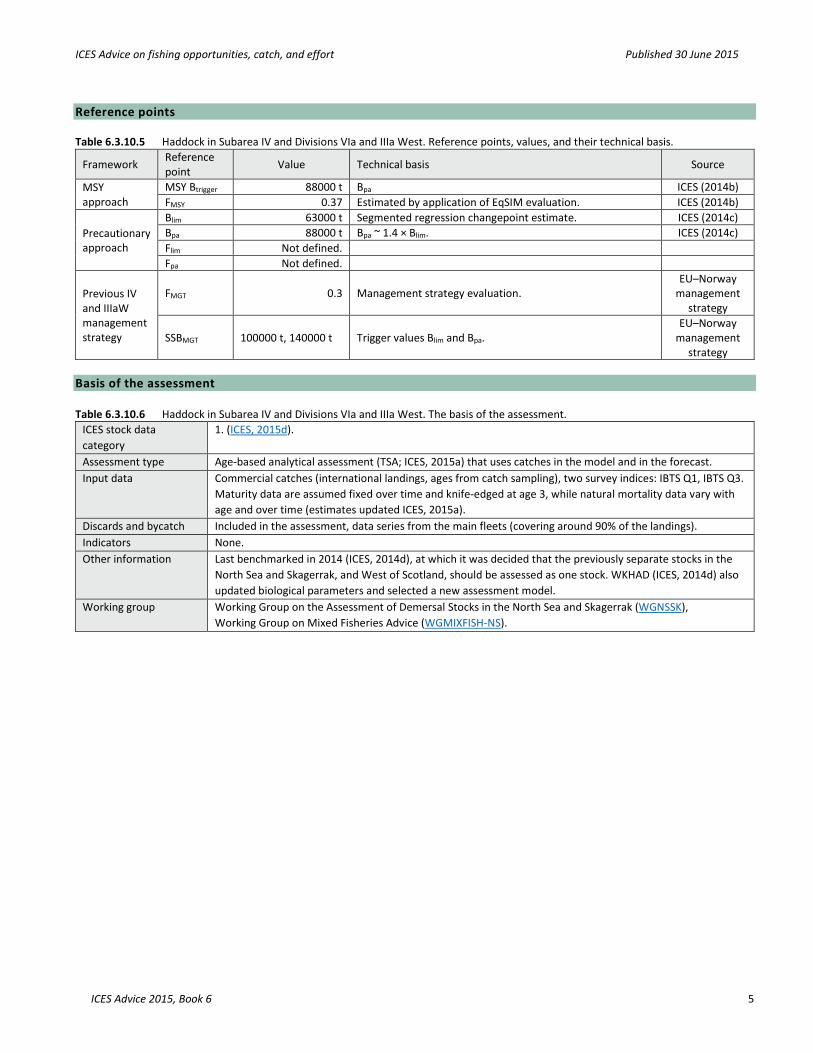
Reference points Table 6.3.10.5 Haddock in Subarea IV and Divisions VIa and IIIa West. Reference points, values, and their technical basis.
Framework Reference point Value Technical basis Source
MSY approach
MSY Btrigger 88000 t Bpa ICES (2014b) FMSY 0.37 Estimated by application of EqSIM evaluation. ICES (2014b)
Precautionary approach
Blim 63000 t Segmented regression changepoint estimate. ICES (2014c) Bpa 88000 t Bpa ~ 1.4 × Blim. ICES (2014c) Flim Not defined. Fpa Not defined.
Previous IV and IIIaW management strategy
FMGT 0.3 Management strategy evaluation. EU–Norway
management strategy
SSBMGT 100000 t, 140000 t Trigger values Blim and Bpa. EU–Norway
management strategy
Basis of the assessment Table 6.3.10.6 Haddock in Subarea IV and Divisions VIa and IIIa West. The basis of the assessment.
ICES stock data category
1. (ICES, 2015d).
Assessment type Age-based analytical assessment (TSA; ICES, 2015a) that uses catches in the model and in the forecast. Input data Commercial catches (international landings, ages from catch sampling), two survey indices: IBTS Q1, IBTS Q3.
Maturity data are assumed fixed over time and knife-edged at age 3, while natural mortality data vary with age and over time (estimates updated ICES, 2015a).
Discards and bycatch Included in the assessment, data series from the main fleets (covering around 90% of the landings). Indicators None. Other information Last benchmarked in 2014 (ICES, 2014d), at which it was decided that the previously separate stocks in the
North Sea and Skagerrak, and West of Scotland, should be assessed as one stock. WKHAD (ICES, 2014d) also updated biological parameters and selected a new assessment model.
Working group Working Group on the Assessment of Demersal Stocks in the North Sea and Skagerrak (WGNSSK), Working Group on Mixed Fisheries Advice (WGMIXFISH-NS).

Published 30 June 2015 Advice on fishing opportunities, catch, and effort
6 ICES Advice 2015, Book 6
Information from stakeholders The proportions reporting a greater abundance of haddock tended to be highest in the northern part of the North Sea (including areas 1, 2, 3, 8, and 9; Figure 6.3.10.3). The highest proportion reporting a lower abundance was in the west (area 4) while no change was most commonly reported in the south (Napier, 2014).
Figure 6.3.10.3 Cumulative time-series of index of perceptions of abundance of haddock, by area (see page 14 of Napier (2014) for an
explanation of the index).

ICES Advice on fishing opportunities, catch, and effort Published 30 June 2015
ICES Advice 2015, Book 6 7
History of advice, catch, and management Table 6.3.10.7a Haddock in Subarea IV. History of ICES advice, the agreed TAC, and ICES estimates of landings. All weights in thousand
tonnes.
Year ICES advice Predicted
landings corresp. to advice
Predicted catch
corresponding to advice ^
Agreed TAC
Off. lndgs.
Hum. cons.
Disc. Slip.
Indust. bycatch Total
1987 80% of F(85) 105 140 109 108 59 4 172 1988 77% of F(86); TAC 185 185 105 105 62 4 171 1989 Reduce decline in SSB; TAC; protect juveniles 68 68 64 76 26 2 104 1990 80% of F(88); TAC 50 50 43 51 33 3 87 1991 70% of effort (89) 50 45 45 40 5 90 1992 70% of effort (89) 60 51 70 48 11 129 1993 70% of effort (89) 133 80 80 80 11 170 1994 Significant reduction in effort; mixed fishery 160 87 81 65 4 150 1995 Significant reduction in effort; mixed fishery 120 75 75 57 8 140 1996 Mixed fishery to be taken into account 120 75 76 73 5 154 1997 Mixed fishery to be taken into account 114 73 79 52 7 138 1998 No increase in F 100.3 115 72 77 45 5 128 1999 Reduction of 10% F(95–97) 72 88.6 64 64 43 4 111 2000 F less than Fpa < 51.7 73.0 47 45 47 8 100 2001 F less than Fpa < 58.0 61 40 39 118 8 165 2002 F less than Fpa < 94.0 104.0 54 53 45 4 101 2003 No cod catches - 52 42 42 23 1 76
2004 Mixed-fisheries considerations / F should be below Fpa
No forecast * 85 48 47 17 1 65
2005 Mixed-fisheries considerations / F should be below Fpa
92 * 66 31 48 10 0 57
2006 Mixed-fisheries considerations / F < 0.3 39 * 52 36 36 17 0 55 2007 Mixed-fisheries considerations / F < 0.3 55.4 * 55 31 31 30 0 61
2008 Mixed-fisheries considerations / 15% TAC reduction 49.3 *,** 46 30 29 13 0 42
2009 Mixed-fisheries considerations / Apply management plan 44.7 *,** 42 31 31 10 0 41
2010 Mixed-fisheries considerations / Apply management plan 38 *,** 36 28 28 10 0 38
2011 See scenarios - 34 26 34 11 0 46 2012 Apply management plan 41.575 *,** 39 30 30 4 1 35 2013 Apply management plan 47.811 *,** 45.041 37 *** 39 *** 2 *** 0 *** 41 ***
2014 Apply management plan 38.201 * 38.284 35 35 4 0.065 *** 39
2015 (November update) MSY approach 68.690 40.711 2016 MSY approach ≤ 59.945**
* The exploitation of this stock should be conducted in the context of mixed fisheries, protecting stocks outside safe biological limits.
** Including industrial bycatch. *** Subarea IV and Division IIIaW combined. ^ Catch advice since 2015 corresponds to Subarea IV and Divisions IIIa-West and VIa.
** Version 2: Predicted catch value updated

Published 30 June 2015 Advice on fishing opportunities, catch, and effort
8 ICES Advice 2015, Book 6
Table 6.3.10.7b Haddock in Division IIIa West. History of ICES advice, the agreed TAC, and ICES estimates of landings. All weights in thousand tonnes.
Year ICES advice
Predicted landings
corresp. to advice
Predicted catch
corresp. to advice
**
Agreed TAC
Official landings
ICES estimates
Hum. cons.
Disc. Slip.
Indust. bycatch Total
1987 Precautionary TAC - 11.5 3.8 1.4 5.3 1988 Precautionary TAC - 10.0 2.9 1.5 4.3 1989 Precautionary TAC - 10.0 4.1 0.4 4.5 1990 Precautionary TAC - 10.0 4.1 2.0 6.1 1991 Precautionary TAC 4.6 4.6 4.1 2.6 6.7 1992 TAC 4.6 4.6 4.4 4.6 9.0 1993 Precautionary TAC - 4.6 2.0 2.4 4.4 1994 Precautionary TAC - 10.0 1.8 2.2 4.0
1995 If required, precautionary TAC; link to North Sea - 10.0 2.2 2.2 4.4
1996 If required, precautionary TAC; link to North Sea - 10.0 3.1 2.9 6.1
1997 Combined advice with North Sea - 7.0 3.4 0.6 4.0 1998 Combined advice with North Sea 4.7 7.0 3.8 0.3 4.0 1999 Combined advice with North Sea 3.4 5.4 1.4 0.3 1.7 2000 Combined advice with North Sea < 1.8 4.5 1.5 0.6 2.1 2001 Combined advice with North Sea < 2.0 4.0 1.9 0.2 2.1 2002 Combined advice with North Sea < 3.0 6.3 4.1 0.06 4.1 2003 Combined advice with North Sea - 3.2 1.8 0.2 n/a 1.8
2004 Combined advice with North Sea / F should be below Fpa
No forecast 4.9 1.4 0.1 n/a 1.4
2005 Combined advice with North Sea / F should be below Fpa
- 4.0 0.8 0.2 0 0.8
2006 Combined advice with North Sea / F < 0.3 - 3.2 1.5 1.0 0 1.5 2007 Combined advice with North Sea / F < 0.3 - 3.4 1.6 0.8 0 2.5
2008 Combined advice with North Sea / 15% TAC reduction 2.9 2.9 1.4 0.6 0 2.0
2009 Combined advice with North Sea / Apply management plan - 2.6 1.5 0.6 0 2.1
2010 Combined advice with North Sea / Apply management plan - 2.2 1.3 0.6 0 1.9
2011 See scenarios - 2.1 9.9 1.7 0 11.6 2012 Apply management plan North Sea - 2.095 2.5 2.6 0.7 0 3.3 2013 Apply management plan North Sea - 2.770 2 * * * * 2014 Apply management plan North Sea 2.438 2.355 2.1 2.3 0.1 * 2.4 2015 (November update) MSY approach 68.690 2.504
2016 MSY approach ≤ 59.945 ††
* Combined in Table 6.3.7.2. ** Catch advice since 2015 corresponds to Subarea IV and Divisions IIIa-West and VIa.
†† Version 2: Predicted catch value updated

ICES Advice on fishing opportunities, catch, and efforts Published 30 June 2015
ICES Advice 2015, Book 6 9
Table 6.3.10.7c Haddock in Division VIa. History of ICES advice, the agreed TAC, and ICES estimates of landings. All weights in thousand tonnes.
Year ICES advice/ Single-stock exploitation boundaries from 2004 onwards *
Predicted landings corresp.
to advice
Predicted catch
corresp. to advice^^^
Agreed TAC Official landings
ICES estimates
Hum. cons. Disc. Slip. Total
1987 Reduce F towards Fmax 20.0 32.0 27 27.0 16.2 43.2 1988 No increase in F; TAC 25.0 35.0 21 21.2 9.5 30.7 1989 80% of F(87); TAC 15.0 35.0 24 16.7 3.0 19.7 1990 80% of F(88); TAC 14.0 24.0 13 10.1 5.4 15.5 1991 70% of effort (89) - 15.2 10 10.6 8.7 19.2 1992 70% of effort (89) - 12.5 7 11.4 ** 9.3 ** 20.5 ** 1993 70% of effort (89) - 17.6 13 19.1 ** 16.8 ** 35.9 ** 1994 30% reduction in effort - 16.0 9 14.2 ** 11.1 ** 25.3 ** 1995 Significant reduction in effort - 21.0 13 12.4 8.6 20.9 1996 Significant reduction in effort - 22.9 13 13.5 11.4 24.8 1997 Significant reduction in effort - 20.0 13 12.9 6.5 19.3 1998 No increase in F 20.8 *** 25.7 14 14.4 5.5 19.9 1999 F reduced to Fpa 14.3 *** 19.0 11 10.5 4.9 15.3 2000 Maintain F below Fpa < 14.9 *** 19.0 7 7.0 7.9 14.9 2001 Reduce F below Fpa < 11.2 *** 13.9 7 687 6.6 13.4 2002 Reduce F below Fpa < 14.1 *** 14.1 7 7.1 8.9 16.0 2003 No cod catches - 8.7 4.9 5.3 4.1 9.4 2004 Fpa* 12.2 6.5 3.0 3.9 3.7 7.6 2005 ¾ × Fpa* 7.6 7.6 3.2 3.8 2.9 6.7 2006 0.7 × Fpa* 8.0 7.81 5.7 6.3 4.6 10.9 2007 0.87 × Fpa* 7.2 7.2 3.7 3.8 4.0 7.7 2008 SSB >Bpa* 4.2 6.12 2.8 2.8 1.2 4.1 2009 No fishing and recovery plan* 0 3.52 2.8 2.9 1.6 4.5 2010 No fishing and recovery plan 0 2.67 2.9 3.0 2.8 5.8 2011 See scenarios 0 2.005 1.7 1.7 1.5 3.3 2012 MSY framework ^^ 5.6 ^ 6.015 5.0 5.1 0.5 5.6 2013 MSY framework 3.1 4.211 4.7 4.6 1.0 5.6 2014 MSY approach 6.432 ^^ 3.988 4.0 4.0 0.8 4.8 2015 (November update) MSY approach 68.690 4.536 2016 MSY approach ≤ 59.945 ‡‡ * Single-stock boundary and the exploitation of this stock should be conducted in the context of mixed fisheries, protecting stocks outside safe biological limits. ** Adjusted for misreporting. *** For Division VIa only. ^ An error in this advice was detected in 2012 (the previous value of 10.2 thousand tonnes was incorrect). ^^ This value (6.432) refers to total catch, including discards. Therefore, it is not directly comparable to the value advised for 2013 (3.1), which referred only to landings. ^^^ Catch advice since 2015 corresponds to Subarea IV and Divisions IIIa-West and VIa.
‡‡ Version 2: Predicted catch value updated

ICES Advice on fishing opportunities, catch, and effort Published 30 June 2015
ICES Advice 2015, Book 6 10
History of catch and landings Table 6.3.10.8 Haddock in Subarea IV and Divisions VIa and IIIa West. Catch distribution by fleet in 2014 as estimated by ICES.
Catch (2014) Landings Discards Industrial bycatch
46.298 kt 96% demersal trawl and
seine >100 mm 2% trawl 70–99 mm 2% others 5.090 kt discards 0.065 kt
41.143 kt Table 6.3.10.9 Haddock in Subarea IV and Divisions VIa and IIIa West. History of commercial catch and landings; both the official and
ICES estimated values are presented by area for each country participating in the fishery. All weights in tonnes. Division IIIa Country 2006 2007 2008 2009 2010 2011 2012 2013 2014 DE 186 206 87 105 65 102 120 90 114 DK 1001 1054 1052 1263 1139 1661 1916 1456 1763 NL 0 0 0 0 1 0 0 5 6 NO 113 152 170 121 81 125 239 223 81 PT 30 37 0 0 0 0 0 0 0 SE 246 278 276 166 126 198 210 217 219 UK 0 0 0 0 0 0 0 3 0 Subarea IV Country 2006 2007 2008 2009 2010 2011 2012 2013 2014 BE 106 178 112 108 78 106 78 78 98 DE 726 727 393 657 634 575 548 677 677 DK 759 645 501 552 725 697 947 1283 1079 ES 0 0 0 0 0 0 0 0 0 FO 4 0 3 32 5 0 0 0 0 FR 444 498 448 135 276 320 175 177 209 GL 5 8 0 4 0 0 0 0 0 IE 0 0 0 0 0 0 0 0 0 IS 0 0 0 0 0 0 0 0 0 NL 33 55 29 24 41 71 191 172 99 NO 1798 1706 1482 1278 1126 1195 1069 1661 2705 PL 8 8 16 0 0 0 0 0 0 PT 76 0 0 0 0 0 0 0 0 SE 100 130 83 141 90 128 103 113 154 UK 32390 26717 27365 28393 24983 23343 0 32993 29758 Division VIa Country 2006 2007 2008 2009 2010 2011 2012 2013 2014 DE 7 0 1 0 1 0 0 0 0 ES 44 5 10 21 28 36 15 0 19 FO 1 2 0 0 0 0 0 0 0 FR 291 211 151 136 89 73 32 51 67 IE 526 759 879 297 396 290 845 746 653 NO 17 16 28 18 9 4 0 6 15 UK 4947 2780 1776 2380 2415 1364 0 3878 3230 Northern Shelf 2006 2007 2008 2009 2010 2011 2012 2013 2014 Official landings 43858 36172 34862 35831 32308 30288 6488 43830 40945 ICES landings 43334 34672 33058 35590 31940 36570 38162 43681 41143 ICES discards 23094 32651 14503 12326 13071 13067 5032 3038 5090 ICES IBC 535 48 199 52 431 24 1 54 65 ICES total catch 66962 67371 47759 47968 45442 49661 43195 46772 46298 TAC IV 51850 54640 46444 42110 35794 34057 39000 45041 40711 TAC IIIa 3189 3360 2856 2590 2201 2100 2095 2770 2504 TAC VIa 7810 7200 6120 3520 2670 2005 6015 4211 4536 Total TAC 62849 65200 55420 48220 40665 38162 47110 52022 47751

ICES Advice on fishing opportunities, catch, and effort Published 30 June 2015
ICES Advice 2015, Book 6 11
Summary of the assessment Table 6.3.10.10§§ Haddock in Subarea IV and Divisions VIa and IIIa West. Assessment summary (weights in tonnes).
Year
Recruitment
Age 0 High Low SSB
High Low Landings Discards Industrial
bycatch Mean F
Ages (2–4)
High Low
thousands tonnes tonnes tonnes tonnes 1972 9328640 14204080 9328640 301240 344620 257860 234019 14436 29585 0.848 0.962 0.734 1973 38405840 49759280 38405840 283400 316900 249900 207489 12610 11267 0.763 0.879 0.647 1974 72158740 96907640 72158740 331980 373860 290100 167528 18180 47505 0.72 0.838 0.602 1975 3930370 8344330 3930370 162170 179210 145130 160271 29332 41487 0.851 0.985 0.717 1976 7154090 10733390 7154090 197760 232220 163300 184421 16977 48163 0.794 0.932 0.656 1977 16274290 20373890 16274290 353840 419300 288380 156639 48732 35022 0.797 0.943 0.651 1978 32364350 37040430 32364350 155730 179390 132070 102970 32860 10903 0.859 1.001 0.717 1979 68639010 79137750 68639010 95100 110360 79840 97896 35054 16240 0.898 1.04 0.756 1980 12268230 14754290 12268230 103960 120820 87100 111371 68831 22472 0.848 0.976 0.72 1981 20591510 24442910 20591510 198050 221030 175070 147806 61683 17041 0.673 0.777 0.569 1982 12157950 14251670 12157950 453900 494960 412840 195456 41297 19383 0.578 0.662 0.494 1983 39465430 44351630 39465430 299100 326840 271360 188754 51584 12898 0.695 0.789 0.601 1984 8266560 9804620 8266560 246120 271900 220340 158205 79012 10080 0.833 0.941 0.725 1985 12665430 14909590 12665430 171750 187270 156230 182946 58373 5998 0.78 0.88 0.68 1986 22769550 25706970 22769550 294110 325070 263150 185137 36063 2643 0.866 0.972 0.76 1987 1801580 2936340 1801580 169470 186450 152490 135022 55674 4410 0.882 0.994 0.77 1988 2052920 4054480 2052920 127990 143790 112190 126227 49833 4002 0.912 1.032 0.792 1989 3592490 4767770 3592490 183460 205060 161860 92840 32453 2410 0.89 1.014 0.766 1990 11670120 13340800 11670120 85920 96480 75360 61605 22548 2589 0.845 0.965 0.725 1991 11764750 13410610 11764750 55560 62540 48580 55208 36610 5386 0.853 0.973 0.733 1992 17850000 20364480 17850000 59470 65070 53870 81566 42477 10927 0.853 0.951 0.755 1993 5222010 6230170 5222010 121170 135370 106970 98631 70748 10766 0.898 1 0.796 1994 19432730 22172170 19432730 139810 158030 121590 95141 70668 3576 0.876 0.984 0.768 1995 5210790 6123610 5210790 188540 212820 164260 89859 71262 7695 0.811 0.919 0.703 1996 7586740 8936200 7586740 122690 135210 110170 92615 10720 5000 0.832 0.936 0.728 1997 4303890 5118410 4303890 241300 267880 214720 95391 67879 6684 0.654 0.746 0.562 1998 3204910 3823670 3204910 168240 185100 151380 95472 61399 5101 0.755 0.859 0.651 1999 45057750 51470730 45057750 131080 146240 115920 76009 43562 3835 0.931 1.055 0.807 2000 8807810 10019050 8807810 77100 86900 67300 54504 64185 8134 1.017 1.151 0.883 2001 913480 1862480 913480 46800 52260 41340 47592 11788 7879 0.739 0.849 0.629 2002 1419020 1704400 1419020 431230 488070 374390 65405 86051 3717 0.513 0.599 0.427 2003 1384880 2015180 1384880 339660 376220 303100 47282 25975 1150 0.322 0.382 0.262 2004 1510170 1750810 1510170 214960 240200 189720 51896 20020 554 0.314 0.372 0.256 2005 13596730 15255430 13596730 142160 162460 121860 51528 12389 168 0.358 0.422 0.294 2006 2591420 2918000 2591420 84080 98820 69340 43334 23094 535 0.583 0.669 0.497 2007 1754680 1975900 1754680 54050 64150 43950 34672 32651 48 0.555 0.641 0.469 2008 1316960 1502880 1316960 185820 206940 164700 33058 14503 199 0.341 0.401 0.281 2009 9526650 10641170 9526650 135080 149540 120620 35590 12326 52 0.273 0.323 0.223 2010 988730 1371110 988730 117250 129770 104730 31940 13071 431 0.278 0.332 0.224 2011 391170 604490 391170 86790 97830 75750 36570 13067 24 0.386 0.46 0.312 2012 1232790 1457530 1232790 231510 259510 203510 38162 5032 1 0.234 0.286 0.182 2013 523510 772450 523510 181770 205870 157670 43734 3305 54 0.219 0.269 0.169 2014 4716120 6825260 4716120 118520 138380 98660 41143 5090 65 0.312 0.392 0.232 2015 1155730 2318350 1155730 94590 115130 74050
§§ Version 2: Values updated

Published 30 June 2015 Advice on fishing opportunities, catch, and effort
12 ICES Advice 2015, Book 6
Sources and references ICES. 2014a. Interim Report of the Working Group on Multispecies Assessment Methods (WGSAM), 20–24 October 2014, London, UK. ICES CM 2014/SSGSUE:11. 104 pp.
ICES. 2014b. Report of the Joint ICES–MYFISH Workshop to consider the basis for FMSY ranges for all stocks (WKMSYREF3), 17–21 November 2014, Charlottenlund, Denmark. ICES CM 2014/ACOM:64. 147 pp.
ICES. 2014c. Report of the Working Group on the Assessment of Demersal Stocks in the North Sea and Skagerrak (WGNSSK), 30 April–7 May 2014. ICES CM 2014/ACOM:13.
ICES. 2014d. Report of the ICES Benchmark Workshop for Northern Haddock Stocks (WKHAD), February–March 2014, Aberdeen and Copenhagen. ICES CM 2014/ACOM:41.
ICES. 2015a. Report of the Working Group on the Assessment of Demersal Stocks in the North Sea and Skagerrak (WGNSSK), 28 April–7 May 2015. ICES CM 2015/ACOM:13.
ICES. 2015b. Report of the Working Group on Mixed-Fisheries Advice for the North Sea (WGMIXFISH-Advice), 25–29 May 2015. ICES CM 2015/ACOM:22.
ICES. 2015c. Mixed-fisheries advice for Subarea IV (North Sea) and Divisions IIIa North (Skagerrak) and VIId (Eastern Channel). In Report of the ICES Advisory Committee, 2015. ICES Advice 2015, Book 6, Section 6.2.2.2.
ICES. 2015d. Advice basis. In Report of the ICES Advisory Committee, 2015. ICES Advice 2015, Book 1. In preparation.
Napier, I. R. 2014. Fishers’ North Sea stock survey 2014. NAFC Marine Centre, Shetland, Scotland. http://nsss.eu.