6.1 Confidence Intervals for the Mean (Large...
12
Chapter 6 Larson/Farber 5 th ed 1 Chapter Outline: 6.1 Confidence Intervals for the Mean (Large Samples) 6.3 Confidence Intervals for Population Proportions Chapter 6: Confidence Intervals Section 6.1 Objectives Understanding point estimates and interval estimates and a margin of error Construct and interpret confidence intervals for the population mean Determine the minimum sample size required when estimating μ Point Estimate for Population μ Point Estimate A single value estimate for a population parameter Most unbiased point estimate of the population mean μ is the sample mean x Estimate Population Parameter… with Sample Statistic Mean: μ x Example: Point Estimate for Population μ A social networking website allows its users to add friends, send messages, and update their personal profiles. The following represents a random sample of the number of friends for 40 users of the website. Find a point estimate of the population mean, μ. (Source: Facebook) 140 105 130 97 80 165 232 110 214 201 122 98 65 88 154 133 121 82 130 211 153 114 58 77 51 247 236 109 126 132 125 149 122 74 59 218 192 90 117 105
Transcript of 6.1 Confidence Intervals for the Mean (Large...
Chapter 6
Larson/Farber 5th ed 1
Chapter Outline: 6.1 Confidence Intervals for the Mean (Large Samples) 6.3 Confidence Intervals for Population Proportions
Chapter 6:
Confidence Intervals
Section 6.1 Objectives
Understanding point estimates and interval estimates and
a margin of error
Construct and interpret confidence intervals for the
population mean
Determine the minimum sample size required when
estimating μ
Point Estimate for Population μ
Point Estimate
A single value estimate for a population parameter
Most unbiased point estimate of the population mean μ
is the sample mean
x
Estimate Population
Parameter…
with Sample
Statistic
Mean: μ x
Example: Point Estimate for Population μ
A social networking website allows its users to add
friends, send messages, and update their personal profiles.
The following represents a random sample of the number
of friends for 40 users of the website. Find a point
estimate of the population mean, µ. (Source: Facebook)
140 105 130 97 80 165 232 110 214 201 122
98 65 88 154 133 121 82 130 211 153 114
58 77 51 247 236 109 126 132 125 149 122
74 59 218 192 90 117 105
Chapter 6
Larson/Farber 5th ed 2
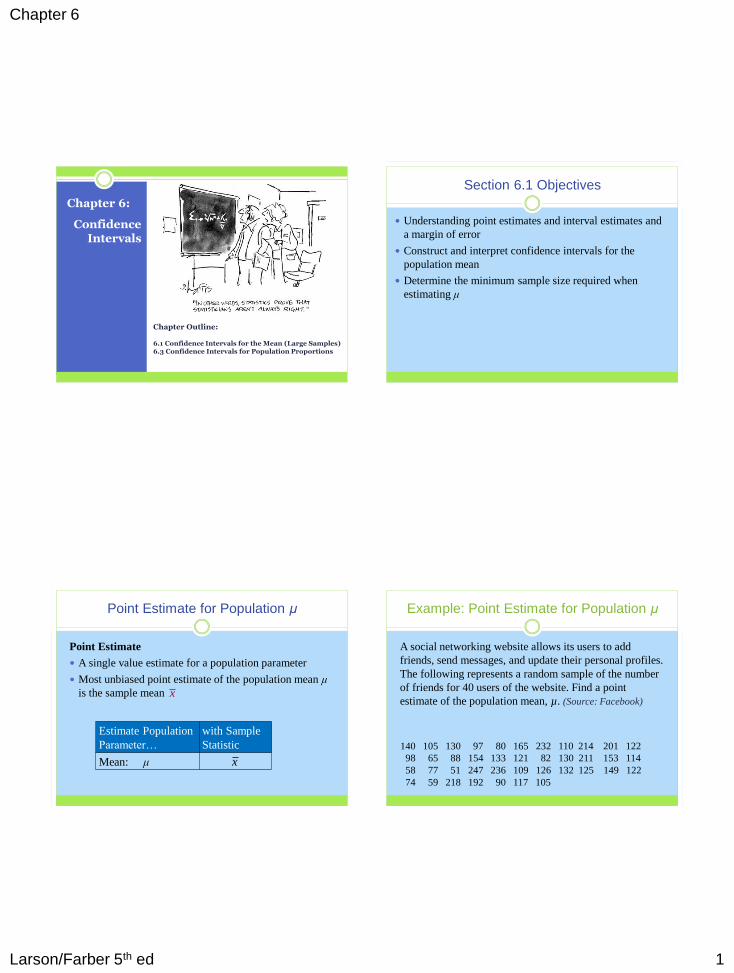
Solution: Point Estimate for Population μ
The sample mean of the data is
5232130.8
40
xx
n
Your point estimate for the mean number of friends for
all users of the website is 130.8 friends.
115 120 125 130 135 140 150 145
Point estimate
115 120 125 130 135 140 150 145
Point estimate
130.8x
How confident do we want to be that the interval estimate
contains the population mean μ?
Interval Estimate
Interval estimate
An interval, or range of values, used to estimate a
population parameter.
( )
Interval estimate
Right endpoint 146.5
Left endpoint
115.1
Level of Confidence
Level of confidence c
The probability that the interval estimate contains the
population parameter.
z z = 0 –zc zc
Critical values
½(1 – c) ½(1 – c)
c is the area under the
standard normal curve
between the critical values.
The remaining area in the tails is 1 – c .
c
Use the Standard
Normal Table to find the
corresponding z-scores.
zc
Common Levels of Confidence
If the level of confidence is 90%, this means that we are
90% confident that the interval contains the population
mean μ.
z z = 0 zc
The corresponding z-scores are ±1.645.
c = 0.90
½(1 – c) = 0.05 ½(1 – c) = 0.05
–zc = –1.645 zc = 1.645
Chapter 6
Larson/Farber 5th ed 3
Common Levels of Confidence
The horizontal segments
represent 90% confidence
intervals for different
samples of the same size.
In the long run, 9 of every
10 such intervals will
contain μ.
μ z
z = 0 zc zc
Common Levels of Confidence
If the level of confidence is 95%, this means that we are
95% confident that the interval contains the population
mean, μ.
The corresponding z-scores are ± 1.96.
0.95
0.025 0.025
zc = 1.96 zc = 1.96
z
z = 0 zc zc
Common Levels of Confidence
If the level of confidence is 99%, this means that we are
99% confident that the interval contains the population
mean, μ.
The corresponding z-scores are ± 2.575.
0.99
0.005 0.005
zc = 2.575 zc = 2.575
Margin of Error
The difference between the point estimate and the actual population
parameter value is called the sampling error.
When μ is estimated, the sampling error is the difference μ –x.
Since μ is usually unknown, the maximum value for the error can
be calculated using the level of confidence.
Given a level of confidence, the margin of error (sometimes called
the maximum error of estimate or error tolerance) E is the greatest
possible distance between the point estimate and the value of the
parameter it is estimating.
c x cσ
E z σ zn
When n 30, the sample standard
deviation, s, can be used for .
Chapter 6
Larson/Farber 5th ed 4
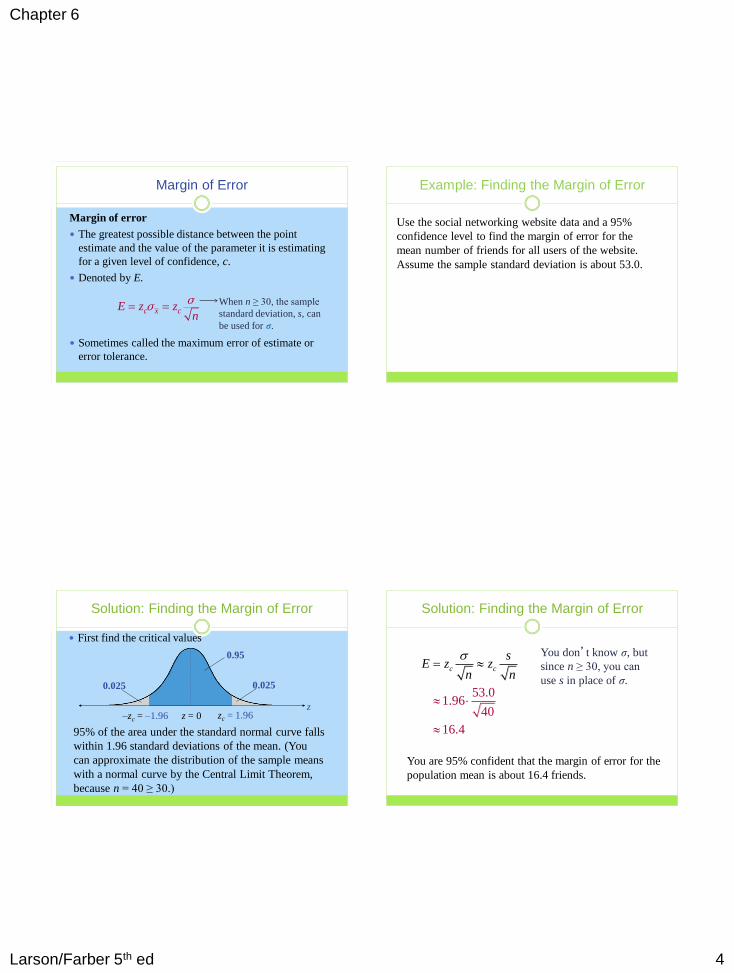
Margin of Error
Margin of error
The greatest possible distance between the point
estimate and the value of the parameter it is estimating
for a given level of confidence, c.
Denoted by E.
Sometimes called the maximum error of estimate or
error tolerance.
c x cE z zn
σ
σ When n ≥ 30, the sample
standard deviation, s, can
be used for σ.
Example: Finding the Margin of Error
Use the social networking website data and a 95%
confidence level to find the margin of error for the
mean number of friends for all users of the website.
Assume the sample standard deviation is about 53.0.
zc
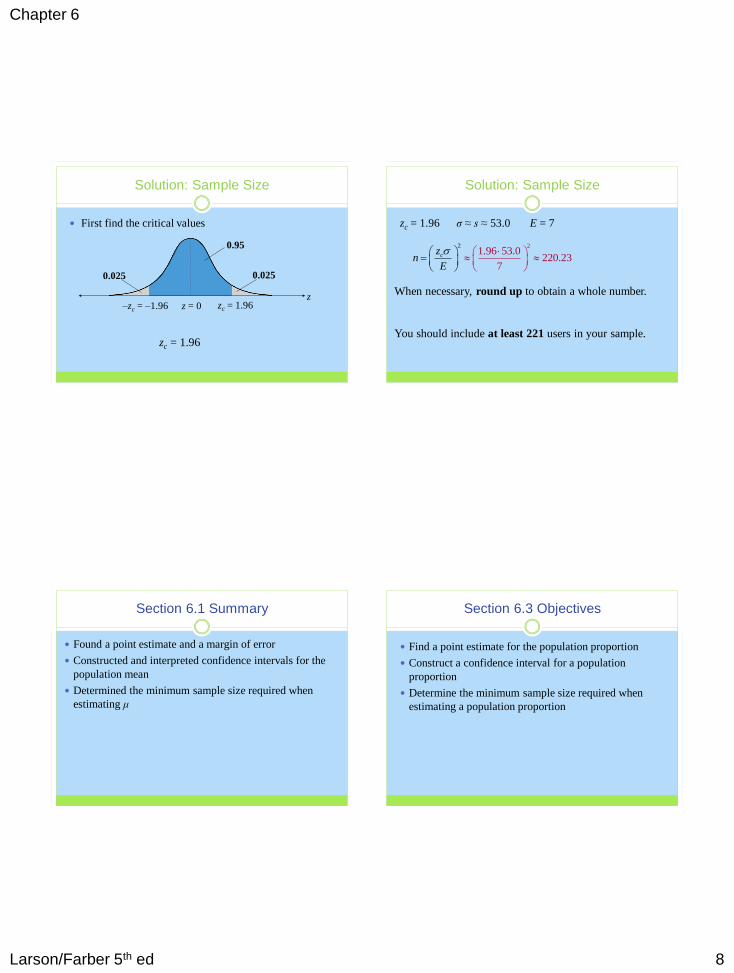
Solution: Finding the Margin of Error
First find the critical values
z zc z = 0
0.95
0.025 0.025
–zc = –1.96
95% of the area under the standard normal curve falls
within 1.96 standard deviations of the mean. (You
can approximate the distribution of the sample means
with a normal curve by the Central Limit Theorem,
because n = 40 ≥ 30.)
zc = 1.96
Solution: Finding the Margin of Error
53.01.96
40
16.4
c c
sE z z
n n
You don’t know σ, but
since n ≥ 30, you can
use s in place of σ.
You are 95% confident that the margin of error for the
population mean is about 16.4 friends.
Chapter 6
Larson/Farber 5th ed 5
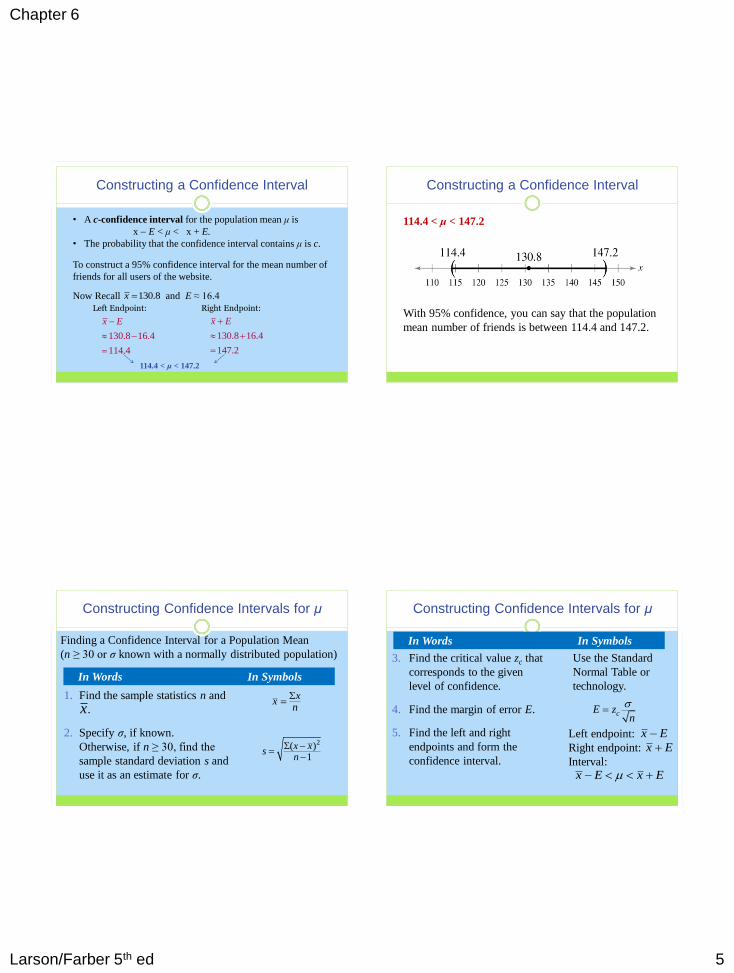
Constructing a Confidence Interval
To construct a 95% confidence interval for the mean number of
friends for all users of the website.
Now Recall and E ≈ 16.4 130.8x
130.8 16.4
114.4
x E
130.8 16.4
147.2
x E
114.4 < μ < 147.2
Left Endpoint: Right Endpoint:
• A c-confidence interval for the population mean μ is
x E < μ < x + E.
• The probability that the confidence interval contains μ is c.
Constructing a Confidence Interval
114.4 < μ < 147.2
•
With 95% confidence, you can say that the population
mean number of friends is between 114.4 and 147.2.
Constructing Confidence Intervals for μ
Finding a Confidence Interval for a Population Mean
(n ≥ 30 or σ known with a normally distributed population)
In Words In Symbols
1. Find the sample statistics n and
.
2. Specify σ, if known.
Otherwise, if n ≥ 30, find the
sample standard deviation s and
use it as an estimate for σ.
xx
n
2( )1
x xs
n
x
Constructing Confidence Intervals for μ
3. Find the critical value zc that
corresponds to the given
level of confidence.
4. Find the margin of error E.
5. Find the left and right
endpoints and form the
confidence interval.
Use the Standard
Normal Table or
technology.
Left endpoint:
Right endpoint:
Interval:
cE zn
x E
x E
x E x E
In Words In Symbols
Chapter 6
Larson/Farber 5th ed 6
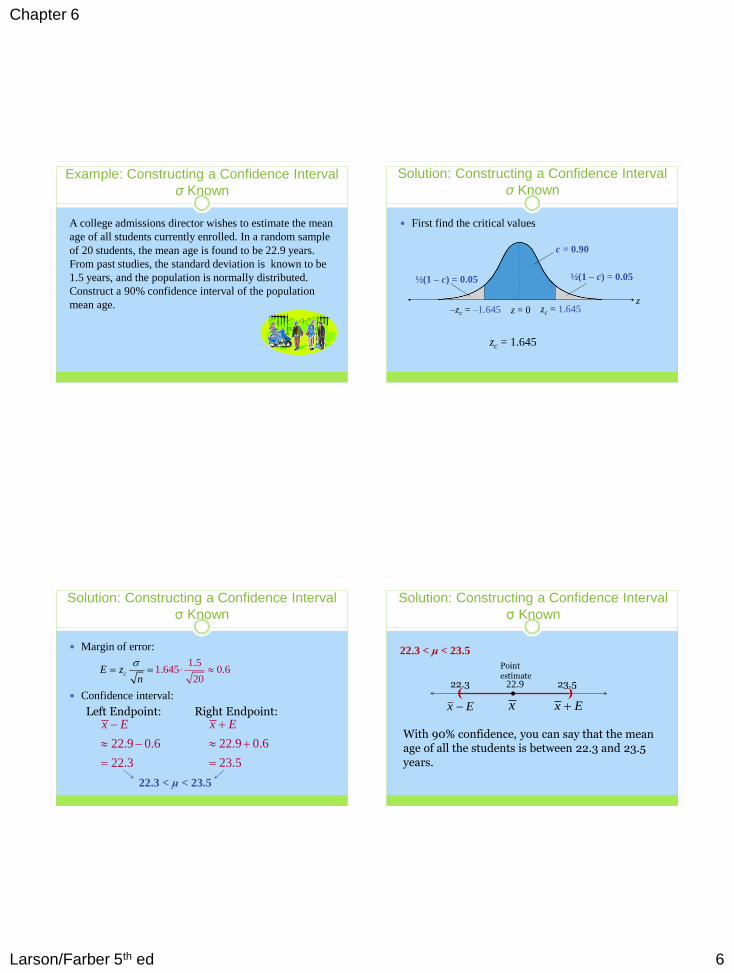
Example: Constructing a Confidence Interval
σ Known
A college admissions director wishes to estimate the mean
age of all students currently enrolled. In a random sample
of 20 students, the mean age is found to be 22.9 years.
From past studies, the standard deviation is known to be
1.5 years, and the population is normally distributed.
Construct a 90% confidence interval of the population
mean age.
zc
Solution: Constructing a Confidence Interval
σ Known
First find the critical values
z z = 0 zc
c = 0.90
½(1 – c) = 0.05 ½(1 – c) = 0.05
–zc = –1.645 zc = 1.645
zc = 1.645
Solution: Constructing a Confidence Interval
σ Known
Margin of error:
Confidence interval:
1.51.645 0.6
20cE z
n
22.9 0.6
22.3
x E
22.9 0.6
23.5
x E
Left Endpoint: Right Endpoint:
22.3 < μ < 23.5
Solution: Constructing a Confidence Interval
σ Known
22.3 < μ < 23.5
( ) •
22.9 22.3 23.5
With 90% confidence, you can say that the mean age of all the students is between 22.3 and 23.5
years.
Point estimate
xx E x E
Chapter 6
Larson/Farber 5th ed 7
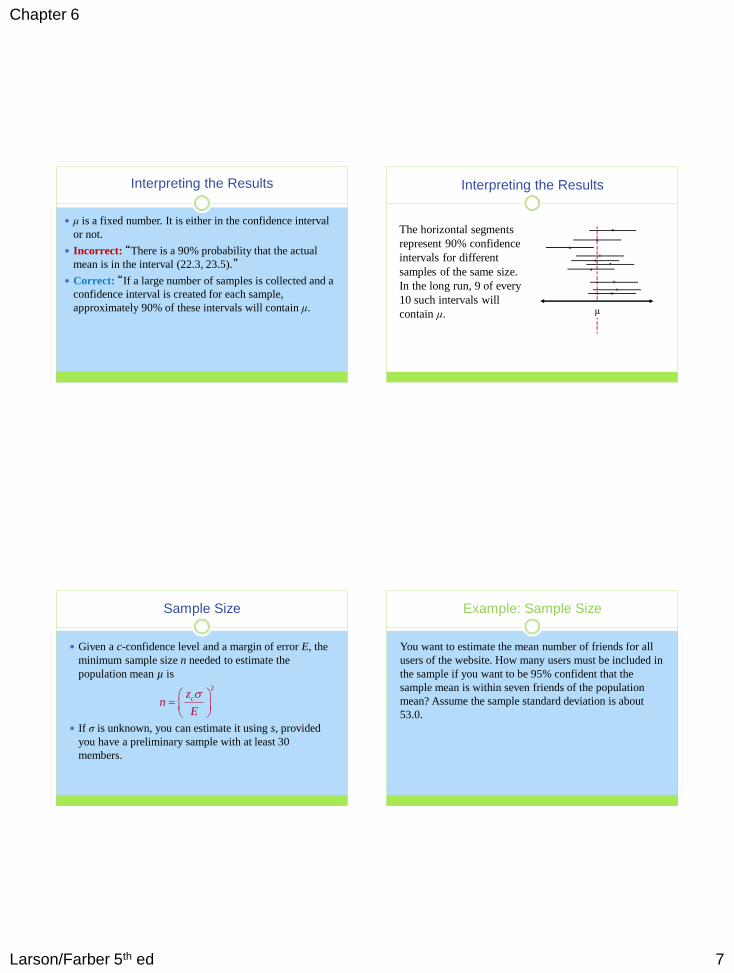
Interpreting the Results
μ is a fixed number. It is either in the confidence interval
or not.
Incorrect: “There is a 90% probability that the actual
mean is in the interval (22.3, 23.5).”
Correct: “If a large number of samples is collected and a
confidence interval is created for each sample,
approximately 90% of these intervals will contain μ.
Interpreting the Results
The horizontal segments
represent 90% confidence
intervals for different
samples of the same size.
In the long run, 9 of every
10 such intervals will
contain μ.
μ
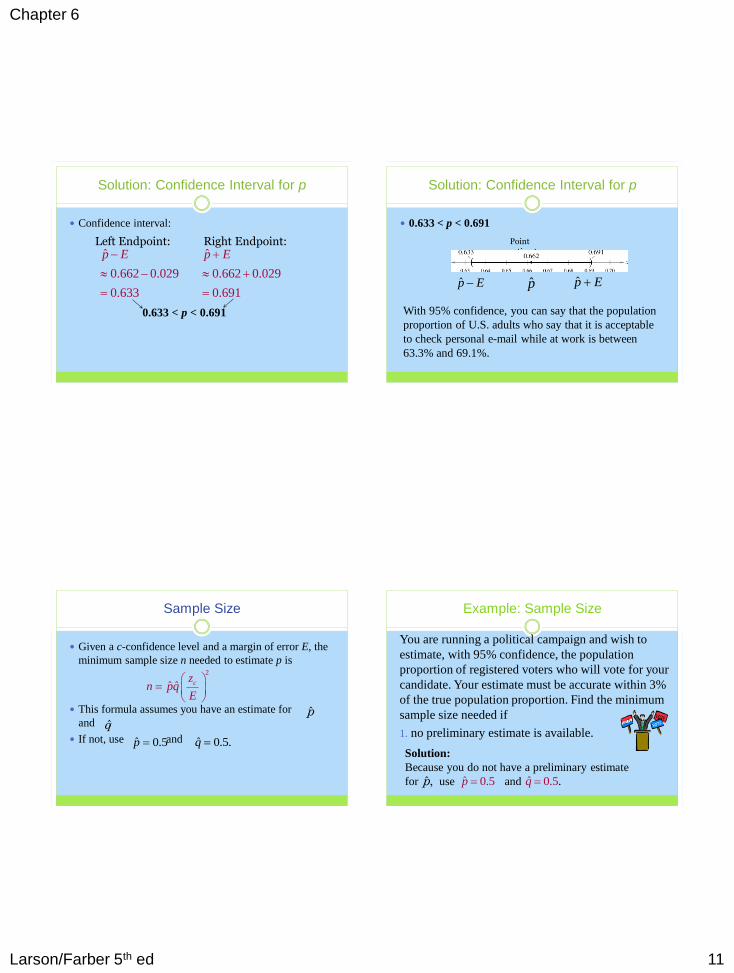
Sample Size
Given a c-confidence level and a margin of error E, the
minimum sample size n needed to estimate the
population mean µ is
If σ is unknown, you can estimate it using s, provided
you have a preliminary sample with at least 30
members.
2
czn
E
Example: Sample Size
You want to estimate the mean number of friends for all
users of the website. How many users must be included in
the sample if you want to be 95% confident that the
sample mean is within seven friends of the population
mean? Assume the sample standard deviation is about
53.0.
Chapter 6
Larson/Farber 5th ed 8
zc
Solution: Sample Size
First find the critical values
zc = 1.96
z z = 0 zc
0.95
0.025 0.025
–zc = –1.96 zc = 1.96
Solution: Sample Size
zc = 1.96 σ ≈ s ≈ 53.0 E = 7
2 21.96 53.0
220.237
czn
E
When necessary, round up to obtain a whole number.
You should include at least 221 users in your sample.
Section 6.1 Summary
Found a point estimate and a margin of error
Constructed and interpreted confidence intervals for the
population mean
Determined the minimum sample size required when
estimating μ
Section 6.3 Objectives
Find a point estimate for the population proportion
Construct a confidence interval for a population
proportion
Determine the minimum sample size required when
estimating a population proportion
Chapter 6
Larson/Farber 5th ed 9
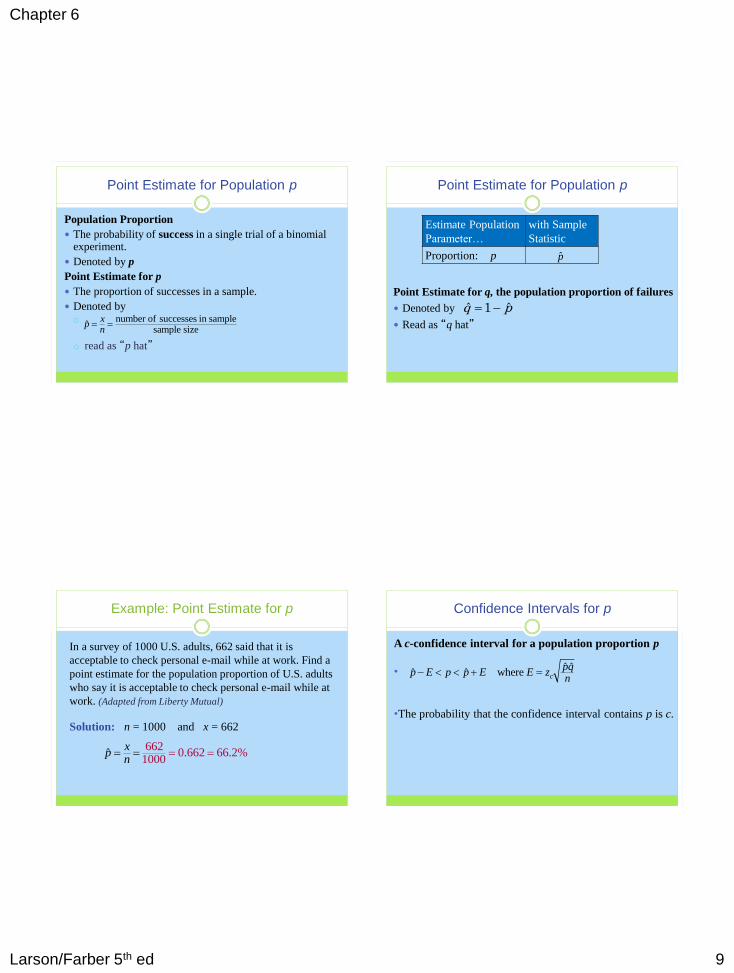
Point Estimate for Population p
Population Proportion
The probability of success in a single trial of a binomial experiment.
Denoted by p
Point Estimate for p
The proportion of successes in a sample.
Denoted by
read as “p hat”
number of successes in sampleˆ
sample sizex
pn
Point Estimate for Population p
Point Estimate for q, the population proportion of failures
Denoted by
Read as “q hat”
1ˆ ˆq p
Estimate Population
Parameter…
with Sample
Statistic
Proportion: p p̂
Example: Point Estimate for p
In a survey of 1000 U.S. adults, 662 said that it is
acceptable to check personal e-mail while at work. Find a
point estimate for the population proportion of U.S. adults
who say it is acceptable to check personal e-mail while at
work. (Adapted from Liberty Mutual)
Solution: n = 1000 and x = 662
6620.662 66.2%
1000ˆ
xp
n
Confidence Intervals for p
ˆ ˆwhereˆ ˆ c
pqp E p p E E z
n
A c-confidence interval for a population proportion p
•
•The probability that the confidence interval contains p is c.

Chapter 6
Larson/Farber 5th ed 10
Constructing Confidence Intervals for p
1. Identify the sample statistics n
and x.
2. Find the point estimate
3. Verify that the sampling
distribution of can be
approximated by a normal
distribution.
4. Find the critical value zc that
corresponds to the given level of
confidence c.
ˆx
pn
Use the Standard
Normal Table or
technology.
.p̂
5, 5ˆ ˆnp nq p̂
In Words In Symbols
Constructing Confidence Intervals for p
5. Find the margin of error E.
6. Find the left and right
endpoints and form the
confidence interval.
ˆ ˆc
pqE z
n
Left endpoint:
Right endpoint: Interval:
p̂ Ep̂ E
ˆ ˆp E p p E
In Words In Symbols
Example: Confidence Interval for p
In a survey of 1000 U.S. adults, 662 said that it is
acceptable to check personal e-mail while at work.
Construct a 95% confidence interval for the population
proportion of U.S. adults who say that it is acceptable to
check personal e-mail while at work.
Solution: Recall ̂ 0.662p
1 0.6ˆ ˆ1 62 0.338q p
Solution: Confidence Interval for p
Verify the sampling distribution of can be
approximated by the normal distribution
p̂
1000 0.662 2ˆ 66 5np
1000 0.338 8ˆ 33 5nq
• Margin of error:
(0.662) (0.ˆ ˆ 338)1.96 0.029
1000c
pqE z
n
Chapter 6
Larson/Farber 5th ed 11
Solution: Confidence Interval for p
Confidence interval:
ˆ
0.662 0.029
0.633
p E
Left Endpoint: Right Endpoint:
0.633 < p < 0.691
ˆ
0.662 0.029
0.691
p E
Solution: Confidence Interval for p
0.633 < p < 0.691
With 95% confidence, you can say that the population
proportion of U.S. adults who say that it is acceptable
to check personal e-mail while at work is between
63.3% and 69.1%.
Point estimate
p̂p̂ E p̂ E
Sample Size
Given a c-confidence level and a margin of error E, the
minimum sample size n needed to estimate p is
This formula assumes you have an estimate for
and .
If not, use and
2
ˆ ˆ czn pq
E
ˆ 0.5.qˆ 0.5p
p̂q̂
Example: Sample Size
You are running a political campaign and wish to
estimate, with 95% confidence, the population
proportion of registered voters who will vote for your
candidate. Your estimate must be accurate within 3%
of the true population proportion. Find the minimum
sample size needed if
1. no preliminary estimate is available.
Solution:
Because you do not have a preliminary estimate
for use and ˆ 5.0.q ˆ 0.5p p,ˆ
Chapter 6
Larson/Farber 5th ed 12
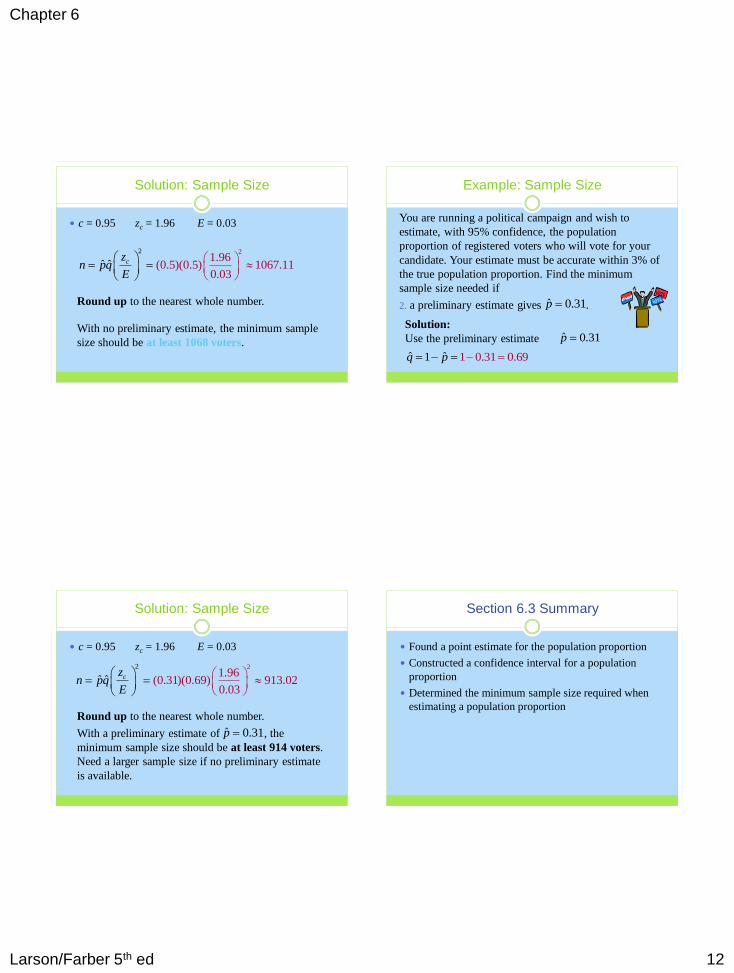
Solution: Sample Size
c = 0.95 zc = 1.96 E = 0.03
2 21.96
(0.5)(0.5) 1067.110.
ˆ03
ˆ czn pq
E
Round up to the nearest whole number.
With no preliminary estimate, the minimum sample
size should be at least 1068 voters.
Example: Sample Size
You are running a political campaign and wish to
estimate, with 95% confidence, the population
proportion of registered voters who will vote for your
candidate. Your estimate must be accurate within 3% of
the true population proportion. Find the minimum
sample size needed if
2. a preliminary estimate gives .
ˆ 0.31p
Solution:
Use the preliminary estimate
1 0.31 0. 9ˆ ˆ 61q p
ˆ 0.31p
Solution: Sample Size
c = 0.95 zc = 1.96 E = 0.03
2 21.96
(0.31)(0.69) 913.020.
ˆ ˆ03
czn pq
E
Round up to the nearest whole number.
With a preliminary estimate of , the
minimum sample size should be at least 914 voters.
Need a larger sample size if no preliminary estimate
is available.
ˆ 0.31p
Section 6.3 Summary
Found a point estimate for the population proportion
Constructed a confidence interval for a population
proportion
Determined the minimum sample size required when
estimating a population proportion