Great Circulation of the Heart Small Circulation of the Heart.
4.6 Transportation and Circulation
October 2012 4.6-1 Phillips Santa Maria Refinery Throughput Increase FEIR
4.6 Transportation and Circulation
This section discusses the road transportation system in the vicinity of the Proposed Project and the impacts of the Proposed Project and alternatives on the transportation system. The analysis in this section is based on available transportation studies, California Department of Transportation (Caltrans) and San Luis Obispo County traffic data, computer modeling of roadway and intersections, local and regional maps, and discussions with appropriate agencies.
4.6.1 Environmental Setting
4.6.1.1 Background
The Phillips Santa Maria Facility (SMF) has been a petroleum oil refinery since its construction in 1955. The SMF is linked to the San Francisco-area Rodeo Refinery by a 200-mile pipeline through which semi-refined liquid products are transferred for upgrading into finished petroleum products. The SMF also produces solid petroleum coke that leaves the Refinery by rail or haul truck and recovered sulfur that is transported by haul truck.
In recent years, the SMF has made significant upgrades to include the installation of emission control devices, a reverse osmosis system, a new water softener unit, changing the water effluent to a tankage system, and eliminating the petroleum coke calciner.
The SMF is currently surrounded by industrial, recreational, agricultural, residential, and open space land uses. Except when shut down for maintenance, the SMF operates 24 hours per day, 365 days per year.
4.6.1.2 Methods of Describing Traffic
Transportation conditions are often described in terms of levels of service (LOS). LOS describes the existing volume of traffic on a roadway compared to the design capacity of the roadway. The design capacity of a roadway or intersection is defined as the maximum rate of vehicle travel (e.g., vehicles per hour) that can reasonably be expected along a section of roadway or through an intersection. Capacity depends on several variables, including road classification and number of lanes, location and presence of turning lanes, signal timing, road condition, terrain, weather, and driver characteristics. LOS is generally a function of the ratio of traffic volume to the capacity of the roadway or intersection or the delays associated with an intersection. The LOS ratings also use qualitative measures that characterize operational conditions within a traffic stream and their perception by motorists. These measures include freedom of movement, speed and travel time, traffic interruptions, types of vehicles, comfort, and convenience.
Trucks and intersections also affect LOS classifications. Trucks and other large, heavy vehicles or slower moving vehicles affect LOS because they occupy more roadway space and have reduced operating qualities compared to passenger cars. Since heavy vehicles accelerate slower than passenger cars, gaps form in traffic flows that affect the efficiency of the roadway.
4.6 Transportation and Circulation
Phillips Santa Maria Refinery 4.6-2 October 2012 Throughput Increase FEIR
Intersections present a number of variables that can influence LOS, including curb parking, transit buses, turn lanes, signal spacing, pedestrians, stop sign arrangements, and signal timing.
The Highway Capacity Manual is widely used in traffic studies for predicting LOS for a range of roadways and intersections (TRB 2000). The Highway Capacity Manual establishes LOS classifications depending on roadway volume to capacity (V/C) ratios for different types of roadways and the volume to capacity ratio and delay at intersections. The Highway Capacity Manual is codified into software, the Highway Capacity Software by the Transportation Research Board. Highway Capacity Software was utilized in this analysis to assess project-related traffic inputs.
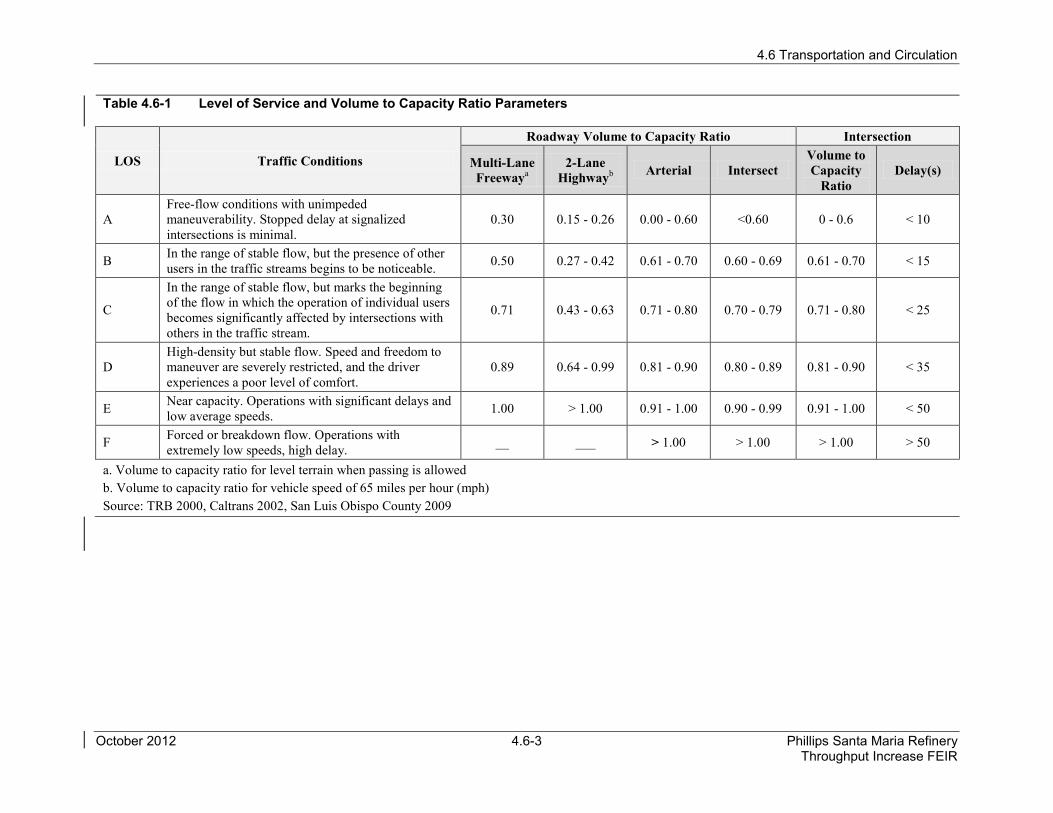
The LOS of a roadway or intersection is described on a scale from A to F, with A indicating excellent traffic flow quality and F indicating forced flow conditions and very slow speeds. Level E is normally the maximum design capacity that a roadway or intersection can accommodate. LOS A, B, and C are generally satisfactory. LOS D is tolerable in urban areas during peak hours due to the high cost of improving roadways to LOS C. Caltrans recommends providing a target LOS between LOS C and LOS D on state highway facilities (Caltrans 2002). San Luis Obispo County’s current California Environmental Quality Act (CEQA) traffic impact thresholds consider LOS C acceptable for County rural roads in the Proposed Project area. Table 4.6-1 identifies LOS definitions and roadway volume to capacity ratios for different road types.
Analyzing intersections is more complicated than analyzing roadways. Intersections with stop signs involve analysis of conflicting traffic, vehicle gaps, vehicle movement priorities, shared lane capacities, and pedestrian influences. The approach detailed in the Highway Capacity Manual and codified in the Highway Capacity Software utilizes a probability approach to determine when gaps are available in traffic. The result is a volume to capacity ratio and a delay, both of which are used to determine LOS. Delay is the amount of time, in seconds, between when a vehicle stops at the end of the intersection queue and when the vehicle first enters the intersection. The distance between intersections is a complicating factor, among others. When two intersections are close together, the Highway Capacity Manual analysis approach is more uncertain. Table 4.6-1 also shows intersection LOS, volume to capacity ratio, and delay.
Determining a roadway’s potential to present a traffic flow problem is a complicated process; therefore, a screening approach is often utilized. The screening approach involves comparing the roadway class with a traffic volume level for each LOS. The screening levels are developed by making generic assumptions for the data input in the Highway Capacity Manual calculations. The screening approach is only used for roadways and not for intersections.
4.6 Transportation and Circulation
October 2012 4.6-3 Phillips Santa Maria Refinery Throughput Increase FEIR
Table 4.6-1 Level of Service and Volume to Capacity Ratio Parameters
LOS Traffic Conditions
Roadway Volume to Capacity Ratio Intersection
Multi-Lane Freewaya
2-Lane Highwayb Arterial Intersect
Volume to Capacity
Ratio Delay(s)
A Free-flow conditions with unimpeded maneuverability. Stopped delay at signalized intersections is minimal.
0.30 0.15 - 0.26 0.00 - 0.60 <0.60 0 - 0.6 < 10
B In the range of stable flow, but the presence of other users in the traffic streams begins to be noticeable. 0.50 0.27 - 0.42 0.61 - 0.70 0.60 - 0.69 0.61 - 0.70 < 15
C
In the range of stable flow, but marks the beginning of the flow in which the operation of individual users becomes significantly affected by intersections with others in the traffic stream.
0.71 0.43 - 0.63 0.71 - 0.80 0.70 - 0.79 0.71 - 0.80 < 25
D High-density but stable flow. Speed and freedom to maneuver are severely restricted, and the driver experiences a poor level of comfort.
0.89 0.64 - 0.99 0.81 - 0.90 0.80 - 0.89 0.81 - 0.90 < 35
E Near capacity. Operations with significant delays and low average speeds. 1.00 > 1.00 0.91 - 1.00 0.90 - 0.99 0.91 - 1.00 < 50
F Forced or breakdown flow. Operations with extremely low speeds, high delay. __ ___ > 1.00 > 1.00 > 1.00 > 50
a. Volume to capacity ratio for level terrain when passing is allowed b. Volume to capacity ratio for vehicle speed of 65 miles per hour (mph) Source: TRB 2000, Caltrans 2002, San Luis Obispo County 2009
4.6 Transportation and Circulation
Phillips Santa Maria Refinery 4.6-4 October 2012 Throughput Increase FEIR
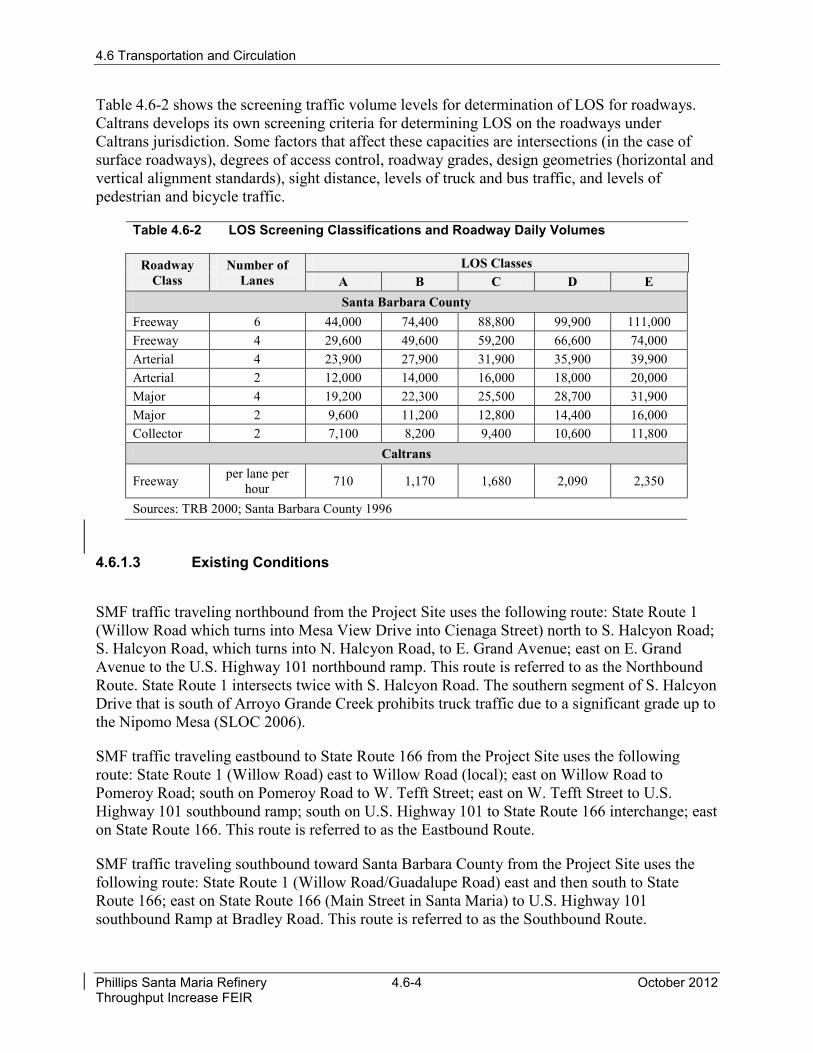
Table 4.6-2 shows the screening traffic volume levels for determination of LOS for roadways. Caltrans develops its own screening criteria for determining LOS on the roadways under Caltrans jurisdiction. Some factors that affect these capacities are intersections (in the case of surface roadways), degrees of access control, roadway grades, design geometries (horizontal and vertical alignment standards), sight distance, levels of truck and bus traffic, and levels of pedestrian and bicycle traffic.
Table 4.6-2 LOS Screening Classifications and Roadway Daily Volumes
Roadway Class
Number of Lanes
LOS Classes A B C D E Santa Barbara County
Freeway 6 44,000 74,400 88,800 99,900 111,000 Freeway 4 29,600 49,600 59,200 66,600 74,000 Arterial 4 23,900 27,900 31,900 35,900 39,900 Arterial 2 12,000 14,000 16,000 18,000 20,000 Major 4 19,200 22,300 25,500 28,700 31,900 Major 2 9,600 11,200 12,800 14,400 16,000 Collector 2 7,100 8,200 9,400 10,600 11,800
Caltrans
Freeway per lane per hour 710 1,170 1,680 2,090 2,350
Sources: TRB 2000; Santa Barbara County 1996
4.6.1.3 Existing Conditions
SMF traffic traveling northbound from the Project Site uses the following route: State Route 1 (Willow Road which turns into Mesa View Drive into Cienaga Street) north to S. Halcyon Road; S. Halcyon Road, which turns into N. Halcyon Road, to E. Grand Avenue; east on E. Grand Avenue to the U.S. Highway 101 northbound ramp. This route is referred to as the Northbound Route. State Route 1 intersects twice with S. Halcyon Road. The southern segment of S. Halcyon Drive that is south of Arroyo Grande Creek prohibits truck traffic due to a significant grade up to the Nipomo Mesa (SLOC 2006).
SMF traffic traveling eastbound to State Route 166 from the Project Site uses the following route: State Route 1 (Willow Road) east to Willow Road (local); east on Willow Road to Pomeroy Road; south on Pomeroy Road to W. Tefft Street; east on W. Tefft Street to U.S. Highway 101 southbound ramp; south on U.S. Highway 101 to State Route 166 interchange; east on State Route 166. This route is referred to as the Eastbound Route.
SMF traffic traveling southbound toward Santa Barbara County from the Project Site uses the following route: State Route 1 (Willow Road/Guadalupe Road) east and then south to State Route 166; east on State Route 166 (Main Street in Santa Maria) to U.S. Highway 101 southbound Ramp at Bradley Road. This route is referred to as the Southbound Route.
4.6 Transportation and Circulation
October 2012 4.6-5 Phillips Santa Maria Refinery Throughput Increase FEIR
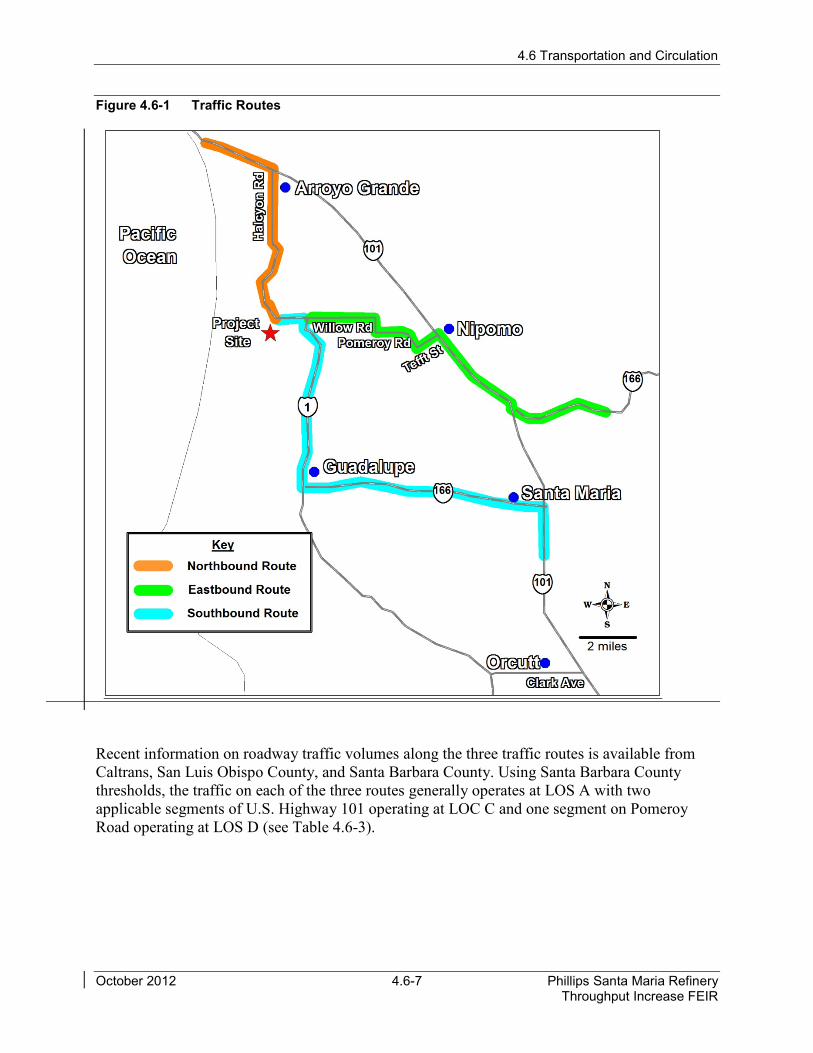
Figure 4.6-1 shows the three traffic routes for the Proposed Project. The following subsections discuss relevant roadways.
State Route 1 from the SMF entrance north to Halcyon Road is primarily a north-south, two-lane arterial; portions of the roadway have a median turning lane near certain intersections. State Route 1 from the SMF entrance east to Willow Road (local) is an east-west, two-lane arterial. State Route 1 south of Willow Road is a north-south, two-lane arterial. Stretching from Willow Road south to W. Clark Avenue, State Route 1 is locally known as Guadalupe Road. It becomes Cabrillo Highway south of the town of Guadalupe and Casmalia Road south of Black Road.
Halcyon Road is a county-managed, north-south, two-lane collector road with access from the Project Site via State Route 1 (Mesa View Drive). The intersection at S. Halcyon Road and State Route 1 is controlled by a four-way traffic signal.
Grand Avenue is an Arroyo Grande-managed, east-west, four-lane arterial with access from the Project Site via N. Halcyon Road. The intersection at Grand Avenue and N. Halcyon Road is controlled by a four-way traffic signal. The intersection at Grand Avenue and the U.S. Highway 101 northbound on-ramp is controlled by a four-way traffic signal.
El Camino Real is an east-west, four to five-lane arterial with access from the Project Site via N. Halcyon Road. The intersection at El Camino Road and N. Halcyon Road is controlled by a four-way traffic signal. El Camino Real provides access to U.S. Highway 101 southbound.
Brisco Road is a north-south, three-lane collector road with access from the Project Site via El Camino Real. The intersection at Brisco Road and El Camino Real is controlled by a four-way traffic signal. Brisco Road provides access to U.S. Highway 101 northbound.
Willow Road is a county-managed, east-west, two-lane minor arterial with access from the Project Site via State Route 1. The intersection at Willow Road and State Route 1 is controlled by a stop sign on Willow Road. Eastbound Willow Road ends at Pomeroy Road.
Pomeroy Road is a county-managed, north-south, two-lane collector road with access from the Project Site via Willow Road. The intersection at Pomeroy Road and Willow Road is controlled by a stop sign on Willow Road.
W. Tefft Street is a county-managed, east-west, five-lane (shared median) arterial with access from the Project Site via Pomeroy Road. The intersection at W. Tefft Street and Pomeroy Road is controlled by a three-way traffic signal. W. Tefft Street provides access to U.S. Highway 101.
State Route 166 is an east-west, two- to four-lane arterial that stretches between the towns of Guadalupe, Santa Barbara County, and Mettler, Kern County, where it connects with Interstate 5. State Route 1 and U.S. Highway 101 provide separate access from the Project Site to State Route 166.
Clark Avenue is an east-west arterial with access from the Project Site via State Route 1 (Casmalia Road). Clark Avenue is a two-lane road between State Route 1 (Casmalia Road) and N. Broadway Street. Clark Avenue is a four-lane road between N. Broadway Street and Stillwell Road. Clark Avenue is a three-lane road between Stillwell Road and U.S. Highway 101. The
4.6 Transportation and Circulation
Phillips Santa Maria Refinery 4.6-6 October 2012 Throughput Increase FEIR
intersection at State Route 1 (Casmalia Road) and Clark Avenue is controlled by a two-way stop sign on Clark Avenue. Clark Avenue provides access to U.S. Highway 101.
U.S. Highway 101 is a four- to six-lane highway that extends along the Pacific Coast between Los Angeles and San Francisco. The Brisco Road interchange (Exit 187) on Brisco Road provides access to U.S. Highway 101 from the Project Site for northbound traffic. The Tefft Street interchange (Exit 179) on W. Tefft Street provides access to U.S. Highway 101 from the Project Site for southbound traffic destined for State Route 166. The Exit 175 interchange on U.S. Highway 101 provides access to eastbound State Route 166. The Clark Avenue interchange (Exit 164) on E. Clark Avenue provides access to U.S. Highway 101 from the Project Site for southbound traffic into Santa Barbara County.
4.6.1.4 Project Area Overview
Existing Roadway Performance
Access to the SMF is via State Route 1, which is also called Mesa View Drive north of the SMF entrance and is called Willow Road east of the SMF entrance. Access to the freeway system from the SMF depends on whether the intended direction is north, east or south. Northbound traffic takes State Route 1 to Halcyon Road to E. Grand Avenue to U.S. Highway 101. Eastbound traffic takes State Route 1 to Willow Road (local) to Pomeroy Road to Tefft Street to U.S. Highway 101 to State Route 166. Southbound traffic takes State Route 1 to State Route 166 to U.S. Highway 101 at Bradley Road. Currently, the SMF personnel generate approximately 160 roundtrips (320 one-way trips) per day. The SMF normal operations generate approximately five truck roundtrips (10 one-way trips) per day, not including green coke and sulfur-related trips. In 2009, the SMF had approximately 15,009 truck trips (roundtrip) related to green coke and sulfur, which is approximately 41 trucks per day, or 82 one-way truck trips per day. In total, the SMF generates approximately 206 vehicle roundtrips per day or 412 one-way vehicle trips per day.
4.6 Transportation and Circulation
October 2012 4.6-7 Phillips Santa Maria Refinery Throughput Increase FEIR
Figure 4.6-1 Traffic Routes
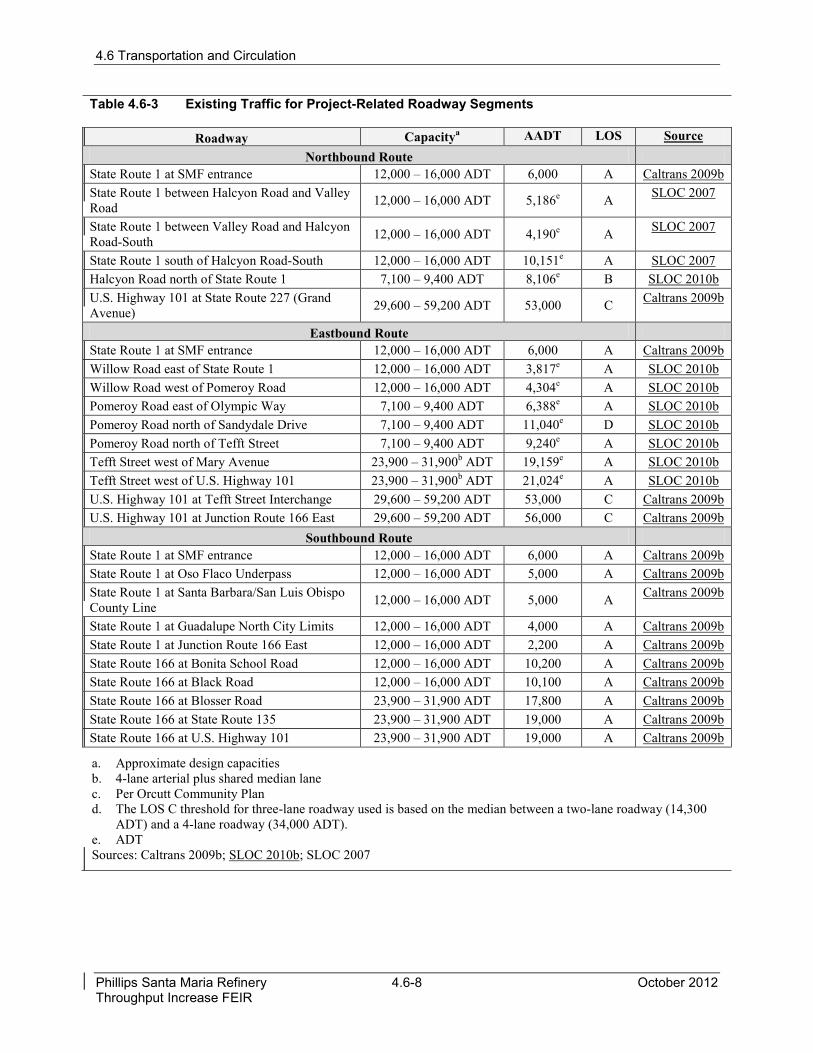
Recent information on roadway traffic volumes along the three traffic routes is available from Caltrans, San Luis Obispo County, and Santa Barbara County. Using Santa Barbara County thresholds, the traffic on each of the three routes generally operates at LOS A with two applicable segments of U.S. Highway 101 operating at LOC C and one segment on Pomeroy Road operating at LOS D (see Table 4.6-3).
4.6 Transportation and Circulation
Phillips Santa Maria Refinery 4.6-8 October 2012 Throughput Increase FEIR
Table 4.6-3 Existing Traffic for Project-Related Roadway Segments
Roadway Capacitya AADT LOS Source Northbound Route
State Route 1 at SMF entrance 12,000 – 16,000 ADT 6,000 A Caltrans 2009b State Route 1 between Halcyon Road and Valley Road 12,000 – 16,000 ADT 5,186e A SLOC 2007
State Route 1 between Valley Road and Halcyon Road-South 12,000 – 16,000 ADT 4,190e A SLOC 2007
State Route 1 south of Halcyon Road-South 12,000 – 16,000 ADT 10,151e A SLOC 2007 Halcyon Road north of State Route 1 7,100 – 9,400 ADT 8,106e B SLOC 2010b U.S. Highway 101 at State Route 227 (Grand Avenue) 29,600 – 59,200 ADT 53,000 C Caltrans 2009b
Eastbound Route State Route 1 at SMF entrance 12,000 – 16,000 ADT 6,000 A Caltrans 2009b Willow Road east of State Route 1 12,000 – 16,000 ADT 3,817e A SLOC 2010b Willow Road west of Pomeroy Road 12,000 – 16,000 ADT 4,304e A SLOC 2010b Pomeroy Road east of Olympic Way 7,100 – 9,400 ADT 6,388e A SLOC 2010b Pomeroy Road north of Sandydale Drive 7,100 – 9,400 ADT 11,040e D SLOC 2010b Pomeroy Road north of Tefft Street 7,100 – 9,400 ADT 9,240e A SLOC 2010b Tefft Street west of Mary Avenue 23,900 – 31,900b ADT 19,159e A SLOC 2010b Tefft Street west of U.S. Highway 101 23,900 – 31,900b ADT 21,024e A SLOC 2010b U.S. Highway 101 at Tefft Street Interchange 29,600 – 59,200 ADT 53,000 C Caltrans 2009b U.S. Highway 101 at Junction Route 166 East 29,600 – 59,200 ADT 56,000 C Caltrans 2009b
Southbound Route State Route 1 at SMF entrance 12,000 – 16,000 ADT 6,000 A Caltrans 2009b State Route 1 at Oso Flaco Underpass 12,000 – 16,000 ADT 5,000 A Caltrans 2009b State Route 1 at Santa Barbara/San Luis Obispo County Line 12,000 – 16,000 ADT 5,000 A Caltrans 2009b
State Route 1 at Guadalupe North City Limits 12,000 – 16,000 ADT 4,000 A Caltrans 2009b State Route 1 at Junction Route 166 East 12,000 – 16,000 ADT 2,200 A Caltrans 2009b State Route 166 at Bonita School Road 12,000 – 16,000 ADT 10,200 A Caltrans 2009b State Route 166 at Black Road 12,000 – 16,000 ADT 10,100 A Caltrans 2009b State Route 166 at Blosser Road 23,900 – 31,900 ADT 17,800 A Caltrans 2009b State Route 166 at State Route 135 23,900 – 31,900 ADT 19,000 A Caltrans 2009b State Route 166 at U.S. Highway 101 23,900 – 31,900 ADT 19,000 A Caltrans 2009b
a. Approximate design capacities b. 4-lane arterial plus shared median lane c. Per Orcutt Community Plan d. The LOS C threshold for three-lane roadway used is based on the median between a two-lane roadway (14,300
ADT) and a 4-lane roadway (34,000 ADT). e. ADT Sources: Caltrans 2009b; SLOC 2010b; SLOC 2007
4.6 Transportation and Circulation
October 2012 4.6-9 Phillips Santa Maria Refinery Throughput Increase FEIR
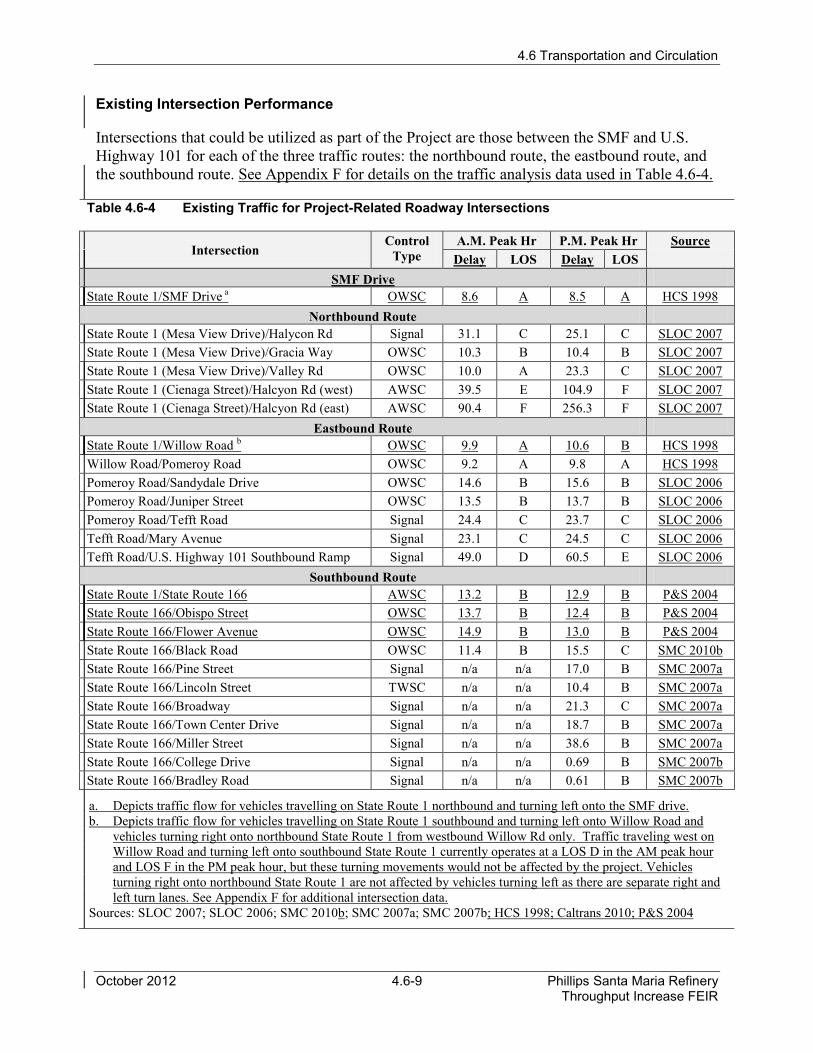
Existing Intersection Performance
Intersections that could be utilized as part of the Project are those between the SMF and U.S. Highway 101 for each of the three traffic routes: the northbound route, the eastbound route, and the southbound route. See Appendix F for details on the traffic analysis data used in Table 4.6-4.
Table 4.6-4 Existing Traffic for Project-Related Roadway Intersections
Intersection Control
Type A.M. Peak Hr P.M. Peak Hr Source
Delay LOS Delay LOS SMF Drive
State Route 1/SMF Drive a OWSC 8.6 A 8.5 A HCS 1998 Northbound Route
State Route 1 (Mesa View Drive)/Halycon Rd Signal 31.1 C 25.1 C SLOC 2007 State Route 1 (Mesa View Drive)/Gracia Way OWSC 10.3 B 10.4 B SLOC 2007 State Route 1 (Mesa View Drive)/Valley Rd OWSC 10.0 A 23.3 C SLOC 2007 State Route 1 (Cienaga Street)/Halcyon Rd (west) AWSC 39.5 E 104.9 F SLOC 2007 State Route 1 (Cienaga Street)/Halcyon Rd (east) AWSC 90.4 F 256.3 F SLOC 2007
Eastbound Route State Route 1/Willow Road b OWSC 9.9 A 10.6 B HCS 1998 Willow Road/Pomeroy Road OWSC 9.2 A 9.8 A HCS 1998 Pomeroy Road/Sandydale Drive OWSC 14.6 B 15.6 B SLOC 2006 Pomeroy Road/Juniper Street OWSC 13.5 B 13.7 B SLOC 2006 Pomeroy Road/Tefft Road Signal 24.4 C 23.7 C SLOC 2006 Tefft Road/Mary Avenue Signal 23.1 C 24.5 C SLOC 2006 Tefft Road/U.S. Highway 101 Southbound Ramp Signal 49.0 D 60.5 E SLOC 2006
Southbound Route State Route 1/State Route 166 AWSC 13.2 B 12.9 B P&S 2004 State Route 166/Obispo Street OWSC 13.7 B 12.4 B P&S 2004 State Route 166/Flower Avenue OWSC 14.9 B 13.0 B P&S 2004 State Route 166/Black Road OWSC 11.4 B 15.5 C SMC 2010b State Route 166/Pine Street Signal n/a n/a 17.0 B SMC 2007a State Route 166/Lincoln Street TWSC n/a n/a 10.4 B SMC 2007a State Route 166/Broadway Signal n/a n/a 21.3 C SMC 2007a State Route 166/Town Center Drive Signal n/a n/a 18.7 B SMC 2007a State Route 166/Miller Street Signal n/a n/a 38.6 B SMC 2007a State Route 166/College Drive Signal n/a n/a 0.69 B SMC 2007b State Route 166/Bradley Road Signal n/a n/a 0.61 B SMC 2007b
a. Depicts traffic flow for vehicles travelling on State Route 1 northbound and turning left onto the SMF drive. b. Depicts traffic flow for vehicles travelling on State Route 1 southbound and turning left onto Willow Road and
vehicles turning right onto northbound State Route 1 from westbound Willow Rd only. Traffic traveling west on Willow Road and turning left onto southbound State Route 1 currently operates at a LOS D in the AM peak hour and LOS F in the PM peak hour, but these turning movements would not be affected by the project. Vehicles turning right onto northbound State Route 1 are not affected by vehicles turning left as there are separate right and left turn lanes. See Appendix F for additional intersection data.
Sources: SLOC 2007; SLOC 2006; SMC 2010b; SMC 2007a; SMC 2007b; HCS 1998; Caltrans 2010; P&S 2004
4.6 Transportation and Circulation
Phillips Santa Maria Refinery 4.6-10 October 2012 Throughput Increase FEIR
4.6.2 Regulatory Setting
4.6.2.1 Federal
The federal government delegates the responsibilities of the maintenance and regulation of roadways to state and local governments.
4.6.2.2 State
Caltrans maintains the state highway system, including U.S. Highway 101, State Route 166, and State Route 1, which provide access to collector, access, and local roads in the Proposed Project area. Caltrans generally regulates maximum load limits for trucks and safety requirements for oversized vehicles for operation on highways.
4.6.2.3 Local
San Luis Obispo Council of Governments
The San Luis Obispo Council of Governments (SLOCOG) is a joint powers authority with a goal of facilitating cooperative regional and subregional planning, coordination, and technical assistance on issues of mutual concern. SLOCOG is the designated Regional Transportation Planning Agency and thereby responsible for all regional transportation planning and programming activities, including developing the Regional Transportation Plan. The Regional Transportation Plan guides transportation policy and is updated every 5 years. SLOCOG plans to address greenhouse-gas emission reductions in the 2010 Regional Transportation Plan update to meet the requirements of Senate Bill 375 (SLOCOG 2010).
San Luis Obispo County General Plan
The 1979 Transportation Plan within the San Luis Obispo County General Plan incorporates the countywide Circulation Element and provides the following goals related to transportation:
• Goal 1: In developing the County Transportation Plan, the betterment of the quality of life shall be the yardstick against which all plans and programs are measured.
• Goal 2: The County Transportation Plan is patterned after the Regional Transportation Plan and, as such, should be compatible with plans of the several cities within the county.
• Goal 3: The transportation system should be a well-coordinated multimodal system that is sensitive to the needs and desires of its citizens. Similarly, transportation programs should serve to reinforce federal, state, regional, and local agency goals including land use, population, employment, urban development, and environment.

4.6 Transportation and Circulation
October 2012 4.6-11 Phillips Santa Maria Refinery Throughput Increase FEIR
• Goal 4: The transportation system should be compatible with the environment, avoid the despoliation of irreplaceable resources, use available resources wisely, promote the aesthetic quality of the county, and minimize environmental changes.
• Goal 5: In developing the County transportation system, all proposals should be financially and politically feasible and have broad public support.
• Goal 6: Proposed transportation system should be designed to maximize safety and ensure a high quality of facilities using all economically and technically feasible means available.
• Goal 7: Transportation systems should minimize social, environmental, and economic disruption and be designed to meet the needs of all social groups (SLOC 1979).
The Land Use and Circulation Element of the San Luis Obispo County General Plan is currently being updated and is scheduled for Board of Supervisors consideration in August of 2012.
San Luis Obispo County Area Plan
The 1989 South County Coastal Area Plan discusses potential improvements to the roadway system in the coastal area. Specific goals and objectives are not identified.
San Luis Obispo County Municipal Code
The San Luis Obispo County Municipal Code implements the General Plan and provides more specific criteria for development. Traffic regulations, including traffic control devices and turning movements, are articulated in the San Luis Obispo County Municipal Code, Title 15, Vehicles and Traffic (SLOC 2009c). Title 23, Coastal Zone Land Use Ordinance, provides standards for proposed developments and new land uses to include parking, street, and frontage requirements. Title 13, Roads and Bridges – Streets and Sidewalks, establishes a road improvement fee to pay for road facilities and improvements related to new development. The County can offer a reimbursement agreement to a developer who constructs a road facility or improvement that exceeds the impact mitigation needs of the new development (SLOC 2009d).
4.6.3 Significance Criteria
According to Appendix G of the State CEQA Guidelines, traffic impacts would be considered significant if they:
• Cause an increase in traffic that is substantial in relation to the existing traffic load and capacity of the street system (i.e., result in a substantial increase in either the number of vehicle trips, the volume-to-capacity ratio on roads, or congestion at intersections);
• Exceed, either individually or cumulatively, a level of service standard established by the County congestion management agency for designated roads or highways;
• Result in a change in air traffic patterns, including either an increase in traffic levels or a change in location that result in substantial safety risks;
4.6 Transportation and Circulation
Phillips Santa Maria Refinery 4.6-12 October 2012 Throughput Increase FEIR
• Substantially increase hazards due to a design feature (e.g., sharp curves or dangerous intersections) or incompatible uses (e.g., farm equipment);
• Result in inadequate emergency access;
• Result in inadequate parking capacity; or
• Conflict with adopted policies, plans, or programs supporting alternative transportation (e.g., bus turnouts, bicycle racks).
The County’s General Plan and Coastal Zone Land Use Ordinance identify specific criteria for determining whether the potential traffic impacts of a project are significant. The criteria include LOS standards for intersections and roadways in the study area and parking requirements. As listed in Table 4.6-1, a total of six LOS designations, A through F, identify the point where volumes exceed the capacity of the roadway system. According to the county, the Proposed Project would result in a significant impact if it causes an intersection operating at satisfactory LOS C to operate at LOS D or worse, or contributes any traffic to a location already operating at LOS D, E, or F. Caltrans considers LOS C to be the worst acceptable LOS for a Caltrans roadway or intersection.
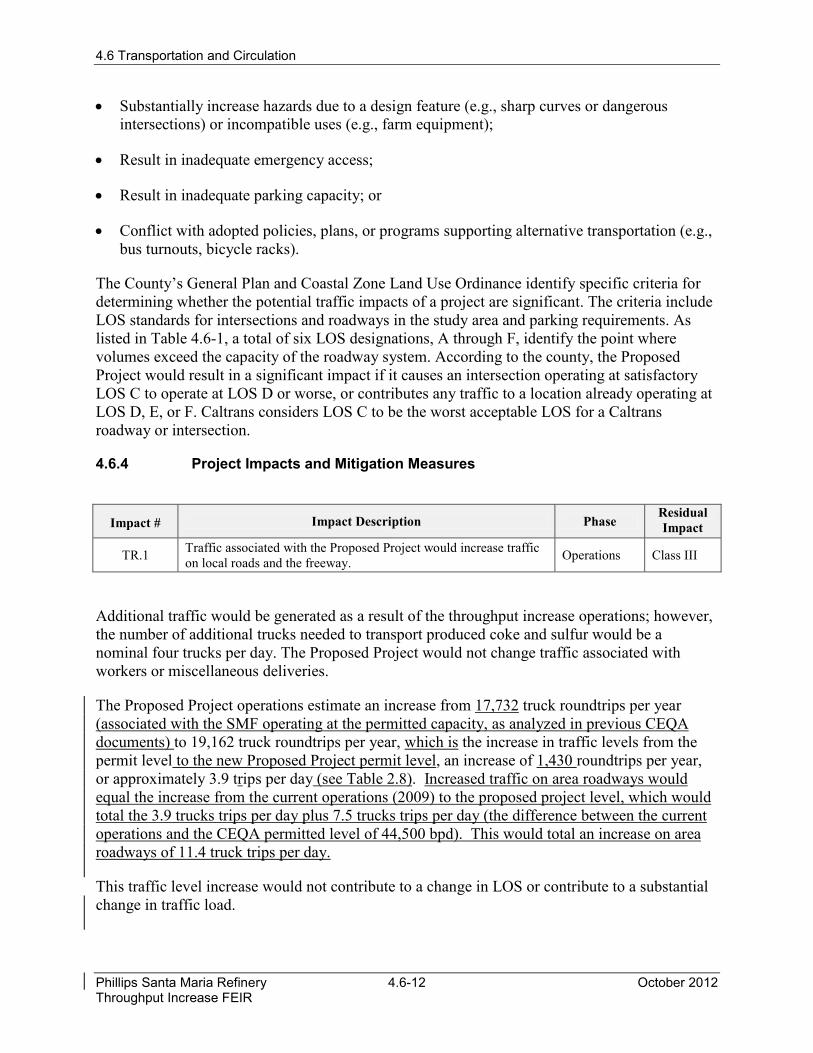
4.6.4 Project Impacts and Mitigation Measures
Impact # Impact Description Phase Residual Impact
TR.1 Traffic associated with the Proposed Project would increase traffic on local roads and the freeway. Operations Class III
Additional traffic would be generated as a result of the throughput increase operations; however, the number of additional trucks needed to transport produced coke and sulfur would be a nominal four trucks per day. The Proposed Project would not change traffic associated with workers or miscellaneous deliveries.
The Proposed Project operations estimate an increase from 17,732 truck roundtrips per year (associated with the SMF operating at the permitted capacity, as analyzed in previous CEQA documents) to 19,162 truck roundtrips per year, which is the increase in traffic levels from the permit level to the new Proposed Project permit level, an increase of 1,430 roundtrips per year, or approximately 3.9 trips per day (see Table 2.8). Increased traffic on area roadways would equal the increase from the current operations (2009) to the proposed project level, which would total the 3.9 trucks trips per day plus 7.5 trucks trips per day (the difference between the current operations and the CEQA permitted level of 44,500 bpd). This would total an increase on area roadways of 11.4 truck trips per day.
This traffic level increase would not contribute to a change in LOS or contribute to a substantial change in traffic load.
4.6 Transportation and Circulation
October 2012 4.6-13 Phillips Santa Maria Refinery Throughput Increase FEIR
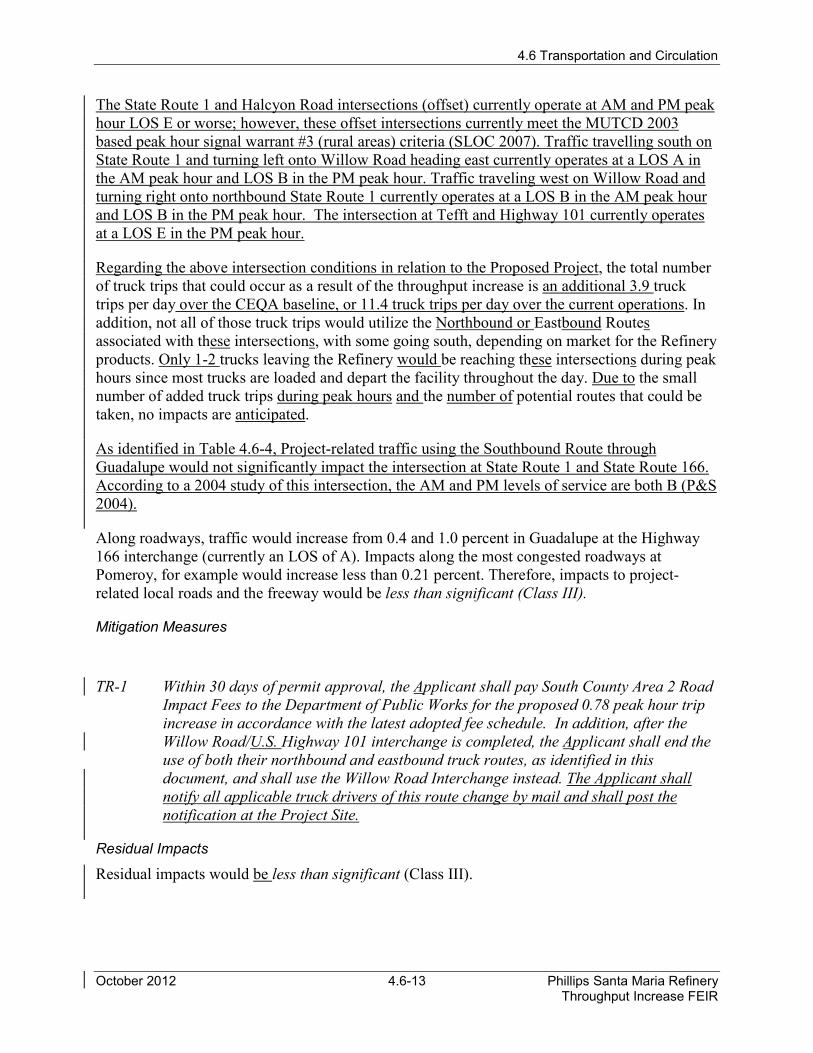
The State Route 1 and Halcyon Road intersections (offset) currently operate at AM and PM peak hour LOS E or worse; however, these offset intersections currently meet the MUTCD 2003 based peak hour signal warrant #3 (rural areas) criteria (SLOC 2007). Traffic travelling south on State Route 1 and turning left onto Willow Road heading east currently operates at a LOS A in the AM peak hour and LOS B in the PM peak hour. Traffic traveling west on Willow Road and turning right onto northbound State Route 1 currently operates at a LOS B in the AM peak hour and LOS B in the PM peak hour. The intersection at Tefft and Highway 101 currently operates at a LOS E in the PM peak hour.
Regarding the above intersection conditions in relation to the Proposed Project, the total number of truck trips that could occur as a result of the throughput increase is an additional 3.9 truck trips per day over the CEQA baseline, or 11.4 truck trips per day over the current operations. In addition, not all of those truck trips would utilize the Northbound or Eastbound Routes associated with these intersections, with some going south, depending on market for the Refinery products. Only 1-2 trucks leaving the Refinery would be reaching these intersections during peak hours since most trucks are loaded and depart the facility throughout the day. Due to the small number of added truck trips during peak hours and the number of potential routes that could be taken, no impacts are anticipated.
As identified in Table 4.6-4, Project-related traffic using the Southbound Route through Guadalupe would not significantly impact the intersection at State Route 1 and State Route 166. According to a 2004 study of this intersection, the AM and PM levels of service are both B (P&S 2004).
Along roadways, traffic would increase from 0.4 and 1.0 percent in Guadalupe at the Highway 166 interchange (currently an LOS of A). Impacts along the most congested roadways at Pomeroy, for example would increase less than 0.21 percent. Therefore, impacts to project-related local roads and the freeway would be less than significant (Class III).
Mitigation Measures
TR-1 Within 30 days of permit approval, the Applicant shall pay South County Area 2 Road Impact Fees to the Department of Public Works for the proposed 0.78 peak hour trip increase in accordance with the latest adopted fee schedule. In addition, after the Willow Road/U.S. Highway 101 interchange is completed, the Applicant shall end the use of both their northbound and eastbound truck routes, as identified in this document, and shall use the Willow Road Interchange instead. The Applicant shall notify all applicable truck drivers of this route change by mail and shall post the notification at the Project Site.
Residual Impacts
Residual impacts would be less than significant (Class III).
4.6 Transportation and Circulation
Phillips Santa Maria Refinery 4.6-14 October 2012 Throughput Increase FEIR
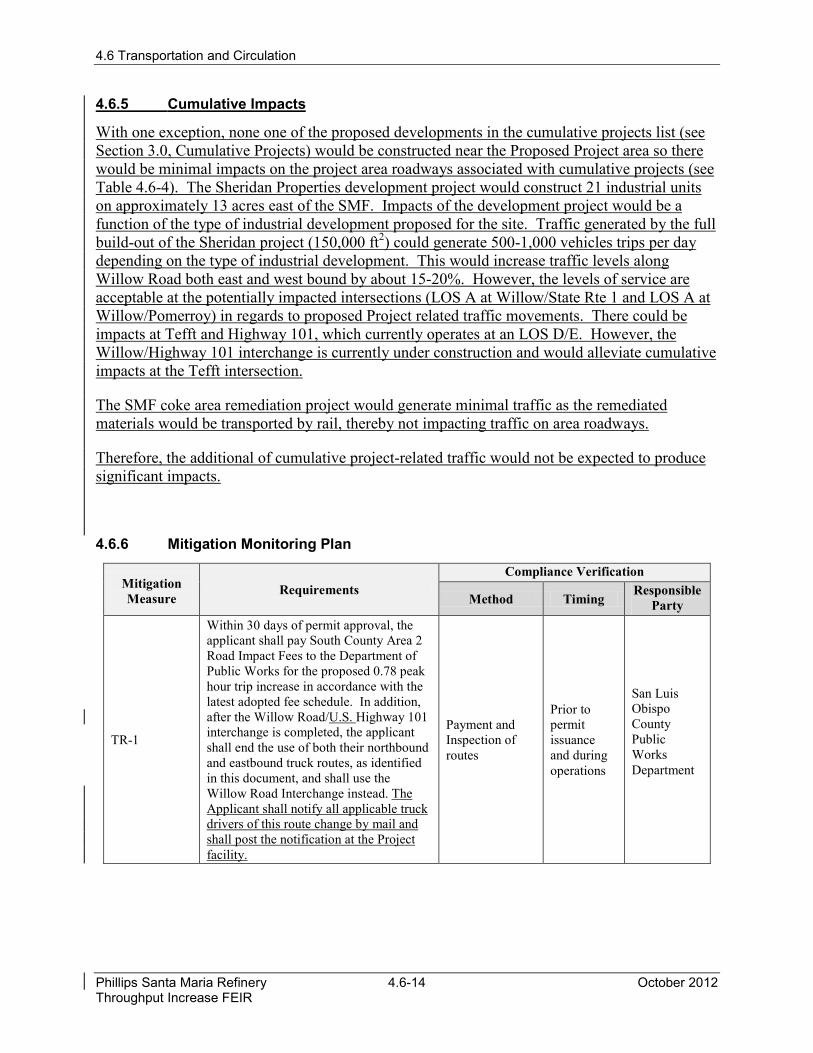
4.6.5 Cumulative Impacts
With one exception, none one of the proposed developments in the cumulative projects list (see Section 3.0, Cumulative Projects) would be constructed near the Proposed Project area so there would be minimal impacts on the project area roadways associated with cumulative projects (see Table 4.6-4). The Sheridan Properties development project would construct 21 industrial units on approximately 13 acres east of the SMF. Impacts of the development project would be a function of the type of industrial development proposed for the site. Traffic generated by the full build-out of the Sheridan project (150,000 ft2) could generate 500-1,000 vehicles trips per day depending on the type of industrial development. This would increase traffic levels along Willow Road both east and west bound by about 15-20%. However, the levels of service are acceptable at the potentially impacted intersections (LOS A at Willow/State Rte 1 and LOS A at Willow/Pomerroy) in regards to proposed Project related traffic movements. There could be impacts at Tefft and Highway 101, which currently operates at an LOS D/E. However, the Willow/Highway 101 interchange is currently under construction and would alleviate cumulative impacts at the Tefft intersection.
The SMF coke area remediation project would generate minimal traffic as the remediated materials would be transported by rail, thereby not impacting traffic on area roadways.
Therefore, the additional of cumulative project-related traffic would not be expected to produce significant impacts.
4.6.6 Mitigation Monitoring Plan
Mitigation Measure
Requirements Compliance Verification
Method Timing Responsible
Party
TR-1
Within 30 days of permit approval, the applicant shall pay South County Area 2 Road Impact Fees to the Department of Public Works for the proposed 0.78 peak hour trip increase in accordance with the latest adopted fee schedule. In addition, after the Willow Road/U.S. Highway 101 interchange is completed, the applicant shall end the use of both their northbound and eastbound truck routes, as identified in this document, and shall use the Willow Road Interchange instead. The Applicant shall notify all applicable truck drivers of this route change by mail and shall post the notification at the Project facility.
Payment and Inspection of routes
Prior to permit issuance and during operations
San Luis Obispo County Public Works Department