3/2012 | PUBLIC - Aalto
37
3/2012 www.ruukki.com | PUBLIC 1
Transcript of 3/2012 | PUBLIC - Aalto

3/2012 www.ruukki.com | PUBLIC1

3/2012 www.ruukki.com | PUBLIC2

3/2012 www.ruukki.com | PUBLIC3
Ruukki’s general presentation

3/2012 www.ruukki.com | PUBLIC4
Content
1. Ruukki in brief2. Business areas3. Corporate responsibility4. Key figures

3/2012 www.ruukki.com | PUBLIC5
Ruukki in brief
• Ruukki provides its customers with energy-efficient steel solutions for better living, working and moving.
• Ruukki operates in some 30 countries and employs around 11,800 people.

3/2012 www.ruukki.com | PUBLIC6
Ruukki’s business areas
ConstructionNet sales €757m*
EngineeringNet sales €257m
MetalsNet sales €1 783m
*) 2011
3/2012 www.ruukki.com | PUBLIC7
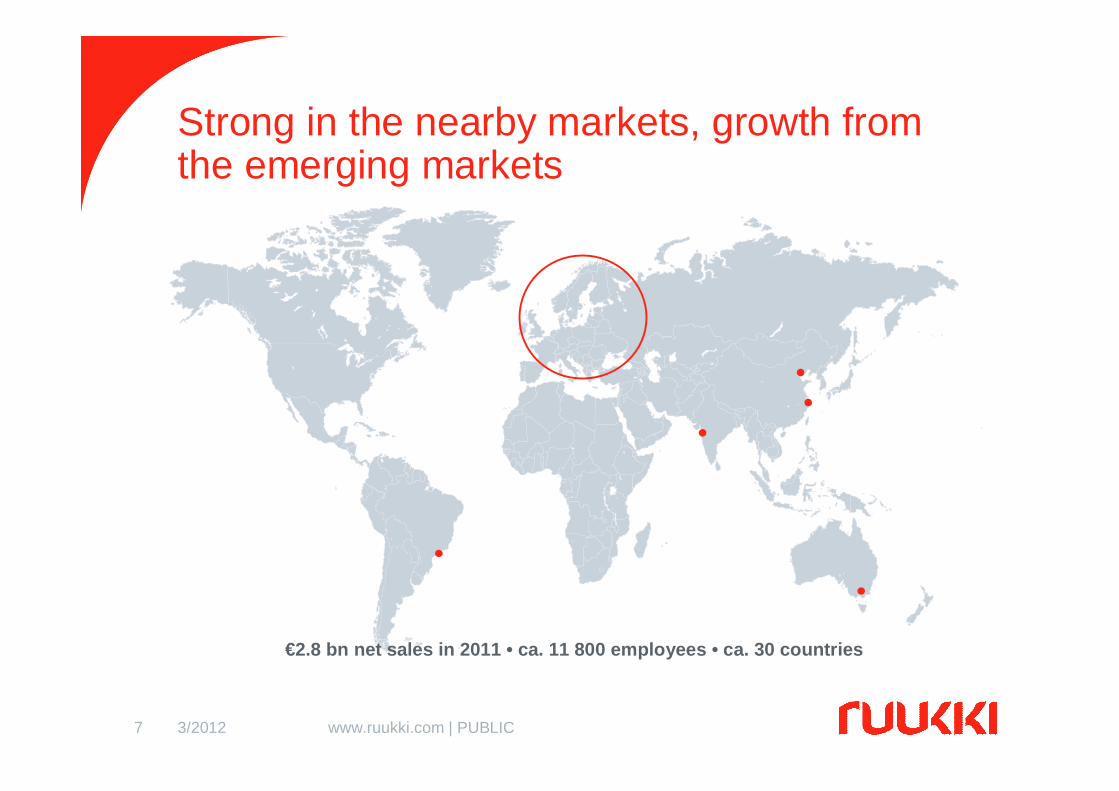
Strong in the nearby markets, growth from the emerging markets
€2.8 bn net sales in 2011 • ca. 11 800 employees • ca. 30 countries

3/2012 www.ruukki.com | PUBLIC8 1 February 2012 | www.ruukki.com | Sakari Tamminen8
Strategic targets for the current strategic period
Emerging markets to account for 50% of consolidated net sales
Construction and engineering businesses
to account for 60% of consolidated net sales
Special steel productsto account for 60% of the
steel business
Achieving strategic targets progressed
Aim is to achieve #1, #2 or otherwise strong market position in chosen segments
27%
50%
31%
(2010: 23%)
60%
36%
(2010: 34%) (2010: 27 %)
60%

3/2012 www.ruukki.com | PUBLIC9
Net sales and personnel by region 2011- emerging markets account for 27% of net sales
Finland6,369(6,150)
Other Nordic countries622 (659)
CEE2,130(2,020)
Rest of Europe70 (69)
Other countries346 (326)
Personnel 2011: 11,382 (2010: 11,286)
*) Personnel at end of period
Russia and Ukraine1,845 (2,062)
Other Nordic countries33% (31%)
Finland27% (27%)
Central Eastern Europe13% (12%)
Rest of Europe14% (15%)
Other countries5% (7%)
Russia and Ukraine8% (8%)
Net sales by market area 2011 (2010) *)
100% = 2,797 m€ (2,403 m€)
*) Comparable

3/2012 www.ruukki.com | PUBLIC10
Our Values• We take responsibility
• We succeed together
• We challenge tomorrow

3/2012 www.ruukki.com | PUBLIC11
Research and development – focus on energy efficiency
• Focus areas of our R&D
– Construction efficiency, especially energy efficient solutions
– Cabins, booms and equipment for the energy industry
– Special steel products i.e. high-strength, wear-resistant and coated steels for the engineering and automotive industry and construction
• In 2011 we invested €29m in R&D
Ruukki’s fully-integratedsolar panel façade converts
sun rays into energy.

3/2012 www.ruukki.com | PUBLIC12
Ruukki in the construction business

3/2012 www.ruukki.com | PUBLIC13
Construction business is international, yet local
• Emerging markets account for around 45% of net sales in the business area
• Strong market position in roofing products in Central Eastern Europe and the Nordic countries
• Personnel around 3,500• Net sales in 2011 €757m (27% of
consolidated net sales)• Main market areas: Nordic
countries, Baltic states, Central Eastern Europe, Russia and Ukraine
Net sales by market area 2011 (2010) *)
Other Nordic countries25% (26%)
Central Eastern Europe28% (26%)
Russia and Ukraine18% (20%)
Other countries2% (2%)
Finland27% (26%)
*) Comparable

3/2012 www.ruukki.com | PUBLIC14
Examples of Ruukki’s constructionsolutions• Commercial & industrial
– Foundations, frames and envelopes
• Residential– Roofing, rainwater and safety
systems• Infrastructure
– Steel structures for bridges and foundations
– Piling for quay and pier structures

3/2012 www.ruukki.com | PUBLIC15
Breakthrough in energy-efficient products in 2011
In 2011, Ruukki launched several energy-efficient products for construction:
• Energy panels
• Energy piles
• Solar panel façade

3/2012 www.ruukki.com | PUBLIC16
Ruukki in theengineering business

3/2012 www.ruukki.com | PUBLIC17
In the engineering business we are where our customers are
• Target is to strengthen own material and product development expertise e.g. in cabins
• Personnel around 1,900• Net sales in 2011: €257m (9% of
consolidated net sales)• Typical customers include leading
globally-operating companies in the lifting, handling and transportation equipment industry, equipment manufacturers in the energy industry.
Energy equipment industry14% (18%)
Paper and wood5% (7%)
Lifting, handling and transportation equipment industry 64% (59%)
Shipbuilding11% (14%)
Offshore6% (2%)
Net sales by customer segment 2011 (2010) *)
*) Comparable

3/2012 www.ruukki.com | PUBLIC18
Fully-assembled systems and components for the engineering industry
• Ruukki’s delivery– Cabins, booms, telescopic booms, frames, oil sumps
• End-products
• An ability to efficiently relocate, replicate and increase production in an international manufacturing network

3/2012 www.ruukki.com | PUBLIC19
Building competitive advantage in cabin design
Ruukki uses digital 3D visualisation in cabin design. This enables a
systematic analysis of ergonomics before making of expensive
prototypes.
• Major design projects typically relate to introduction of new cabin families
Cabin family lifetime usually 4-5 yearsClose customer cooperation from design to supply chain planningSuppliers rarely changed during the cabin family lifetime
• Example projectOver 5,000 design hoursCabin and interior designElectric engineeringPrototype and pre-series building
• In 2010, some 27,000 design hours will be used in projects

3/2012 www.ruukki.com | PUBLIC20
Global cabin and component manufacturing network
• Finland, Kurikka• Centre of excellence:
product development• Deliveries to Nordic
countries
• Slovakia, Holic• Deliveries to
Central and Eastern Europe
• China, Shanghai• Deliveries to Asia
Ruukki Engineering – cabin manufactureRuukki Engineering – other unit
Example of cabin production network

3/2012 www.ruukki.com | PUBLIC21
Ruukki in the steel business

3/2012 www.ruukki.com | PUBLIC22
Strong in nearby areas in the steel business
• Steel production in 2011 approximately 2.2 million tonnes
• Net sales in 2011: €1 783m (64% of consolidated net sales)
• Around 5,400 employees • Forerunner in special steel
products globally• Strong market position in the
Nordic countries• Extensive services in steel service
centres in Finland, Sweden, Norway, Russia and Poland
Finland27% (27%)
Other Nordic countries34% (33%)
CEE, Russia and Ukraine13% (11%)
Rest of Europe19% (20%)
Other countries7% (9%)
Net sales by market area 2011 (2010) *)
*) Comparable

3/2012 www.ruukki.com | PUBLIC23
• High-strength, wear-resistant and coated steels
– Design new and improved end-products• High-strength steels
– Reach higher, lower weight• Wear-resistant and high-strength
steels– Increase productivity and payloads,
extend service life • Parts processing, prefabrication
– Optimise processing and lead times
Examples of end-uses of Ruukki’s special steel products

3/2012 www.ruukki.com | PUBLIC24
Corporate responsibility

3/2012 www.ruukki.com | PUBLIC25
Corporate responsibility improvescompetitiveness
• Achievement of financial targets through best business practices
• Ensuring a safe, continuously improving work environment
• Fair, just treatment of the personnel
• Minimisation of a product’s environmental impacts during its lifecycle
• Promotion of energy efficiency
Financial responsibilityEnvironmentalresponsibility
Safeguarding long-term business conditions
Social responsibility

3/2012 www.ruukki.com | PUBLIC2626
Ruukki’s commitment and corporate responsibility is recognised
Ruukki is the leading company in steel sector in Dow Jones Sustainability Index World and received Gold Class and Sector Leader 2012 distinctions by SAM, Sustainability Asset Management .
Ruukki was awarded Prime status and was the best steel company in oekom's detailed rating.
Ruukki joins the NASDAQ OMX new sustainability index
Ruukki has been selected for inclusion in the EthibelEXCELLENCE Investment Register
Ruukki is listed in Vigeo’s Aspi Eurozone® index
World Steel Association has awarded Ruukki with Climate Action membership certificate for 2010-2011
Ruukki has taken part in the Carbon Disclosure Project (CDP) ranking since 2007

3/2012 www.ruukki.com | PUBLIC27
Energy efficiency • Energy efficiency is managed as part of ISO 14001
environmental management systems• Target is energy savings
of 9%, compared to 2005 levels, by 2016
• Energy efficiency is taken into account also in– Sourcing and logistics, product and process plannings
and real estate and property repair plans• We reuse a significant share of secondary energy
flows in the steel-making process

3/2012 www.ruukki.com | PUBLIC28
Top environmental performance is important to Ruukki
• Ruukki’s energy efficiency in production ranks among the best in the steel industry
• Coking coal consumption in production is at the minimal possible using current technology
– compared to the European average, Ruukki’s steel production generates around 300,000 tonnes less carbon dioxide emissions a year
0
20
40
60
80
100
120
140
160
180
Ruu
kki
EU a
vera
ge
NAF
TA
Rus
sia*
*
Chi
na**
Indi
a**
Source: Stahl-Zentrum. *The indexed carbon efficiency in iron-making based on coal consumed 2009. ** 2007 data.
Blast furnace carbon dioxide efficiency *
3/2012 www.ruukki.com | PUBLIC29
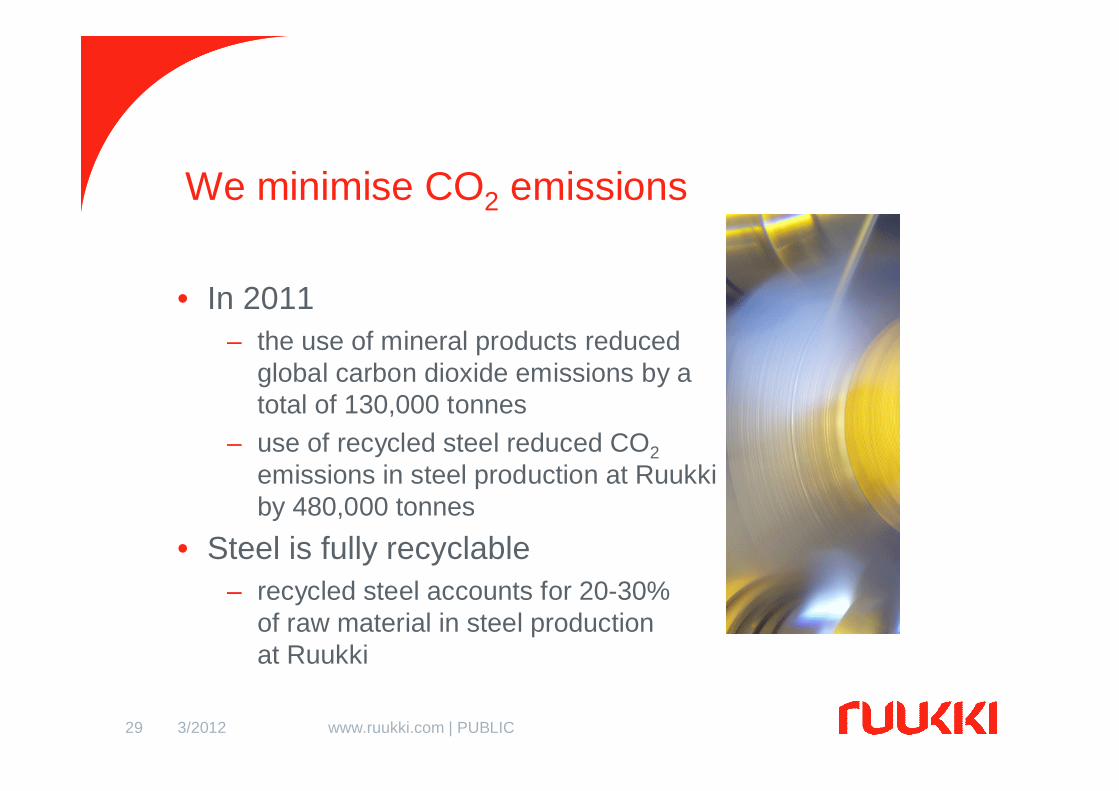
• In 2011 – the use of mineral products reduced
global carbon dioxide emissions by a total of 130,000 tonnes
– use of recycled steel reduced CO2emissions in steel production at Ruukki by 480,000 tonnes
• Steel is fully recyclable– recycled steel accounts for 20-30%
of raw material in steel production at Ruukki
We minimise CO2 emissions

3/2012 www.ruukki.com | PUBLIC30
Key figures

3/2012 www.ruukki.com | PUBLIC31
Key figures€m 10-12/11 10-12/10 2011 2010
Net sales *) 718 641 2 797 2 403
Operating profit *) -40 -5 56 38
as % of net sales *) -5.6 -0.7 2.0 1.6
Profit before income tax *) -50 -12 22 8
Result for the period -41 -30 -10 -79
Earnings per share, diluted, € -0.30 -0.21 -0.07 -0.57
Return on capital employed, % 1.3 -0.3
Gearing ratio, % 60.4 44.7
Gross capital expenditure **) 179 173
Net cash from operating activities 163 23 114 -64
Net cash before financing activities 126 -19 -57 -226
Personnel (average) 11 493 11 384 11 821 11 693
*) Comparable **) In tangible and intangible assets

3/2012 www.ruukki.com | PUBLIC32
Ownership structure
Source: Euroclear Finland*) Solidium Oy is fully owned by the Finnish State
As at 31 December 2011
Solidium Oy *)
39.7%Non-Finnish and nominee registered owners16.9%
Other Finnish owners 23.1%
Finnish households 20.4%

3/2012 www.ruukki.com | PUBLIC33
Order intake
Engineering business Steel businessConstruction business
Order intake 2010-2011 (€m) Quarterly order intake (€m)
545
426449
414451
651678672674647576
1 133
596
958
772
507
0
200
400
600
800
1 000
1 200
Q1/
08Q
2/08
Q3/
08Q
4/08
Q1/
09Q
2/09
Q3/
09Q
4/09
Q1/
10Q
2/10
Q3/
10Q
4/10
Q1/
11Q
2/11
Q3/
11Q
4/11
+1%
0
500
1 000
1 500
2 000
2 500
3 00020
09
2010
2011
+15%
+14%
+16%
+15%
2 675
2 326
1 740

3/2012 www.ruukki.com | PUBLIC34
Change in operating profit by business area (€m) 2010 v. 2011 *)
Net sales and operating profit
*) Comparable
Change in net sales by business area (€m) 2010 v. 2011 *)
2 000
2 200
2 400
2 600
2 800
3 000
2010
Con
stru
ctio
nbu
sine
ss
Eng
inee
ring
busi
ness
Ste
el b
usin
ess
2011
0
20
40
60
80
100
120
2010
Con
stru
ctio
nbu
sine
ss
Eng
inee
ring
busi
ness
Ste
el b
usin
ess
2011
+16%
+129+64
+202
2 403
2 797
38
56
+42
+21
-46

3/2012 www.ruukki.com | PUBLIC35
Residential construction Commercial and industrial constructionInfrastructure construction
Net sales by product group (€m) and operating profit %, rolling 12 mth *)
Construction business:Relatively strongest growth in residential construction in 2011
Operating profit %
*) Comparable
1042 1067975
835
691
589 566 584 603 628 653 691 726 757
-15 %
-10 %
-5 %
0 %
5 %
10 %
15 %
20 %
0
200
400
600
800
1 000
1 200
2007
2008
Q1/
09
Q2/
09
Q3/
09
Q4/
09
Q1/
10
Q2/
10
Q3/
10
Q4/
10
Q1/
11
Q2/
11
Q3/
11
Q4/
11

3/2012 www.ruukki.com | PUBLIC36
537
617
564
470
380
263
205
188
180
193 213
225
239 257
-20%
-15%
-10%
-5%
0%
5%
10%
15%
20%
0
100
200
300
400
500
600
700
2007
2008
Q1/
09Q
2/09
Q3/
09Q
4/09
Q1/
10Q
2/10
Q3/
10Q
4/10
Q1/
11Q
2/11
Q3/
11Q
4/11
Net sales by customer segment (€m) and operating profit %, rolling 12 mth *)
Engineering business:Strongest growth in deliveries to materials handling and mining industry equipment manufacturers
Energy equipment industryLifting, handling and transportation equipment industry
Shipbuilding Offshore Paper and wood
Energy equipment industry14% (18%)
Paper and wood5% (7%)
Lifting, handling and transportation equipment industry 64% (59%)
Shipbuilding11% (14%)
Offshore6% (2%)
Net sales by customer segment 2011 (2010) *)
Operating profit %*) Comparable

3/2012 www.ruukki.com | PUBLIC37
2 035 1 997
1 735
1 381
1 136 1 0501 149
1 3651 493
1 5811 711 1 745 1 755 1 783
-25%
-20%
-15%
-10%
-5%
0%
5%
10%
15%
20%
25%
0
500
1 000
1 500
2 000
2 50020
07
2008
Q1/
09
Q2/
09
Q3/
09
Q4/
09
Q1/
10
Q2/
10
Q3/
10
Q4/
10
Q1/
11
Q2/
11
Q3/
11
Q4/
11
Net sales by product group (€m) and operating profit %, rolling 12 mth *)
Steel business:Share of special steel products increased to 31% in 2011, capacity utilisation rate in fourth quarter at approx. 80%
Stainless steel and aluminiumSpecial steel products Price-sensitive steel products Customised steel products
Operating profit %
*) Comparable


![Pageflex Server [document: D-Aalto-2A28D96F 00001]lib.tkk.fi/Diss/2012/isbn9789526049106/isbn9789526049106.pdf · Aalto University publication series DOCTORAL DISSERTATIONS 168/2012](https://static.fdocuments.in/doc/165x107/5a725dd47f8b9ac0538d81b5/pageflex-server-document-d-aalto-2a28d96f-00001libtkkfidiss2012isbn9789526049106isbn9789526049106pdfpdf.jpg)