3.2 Present Situation of Railway Sub-sector · † Promoting railway safety and environmental...
83
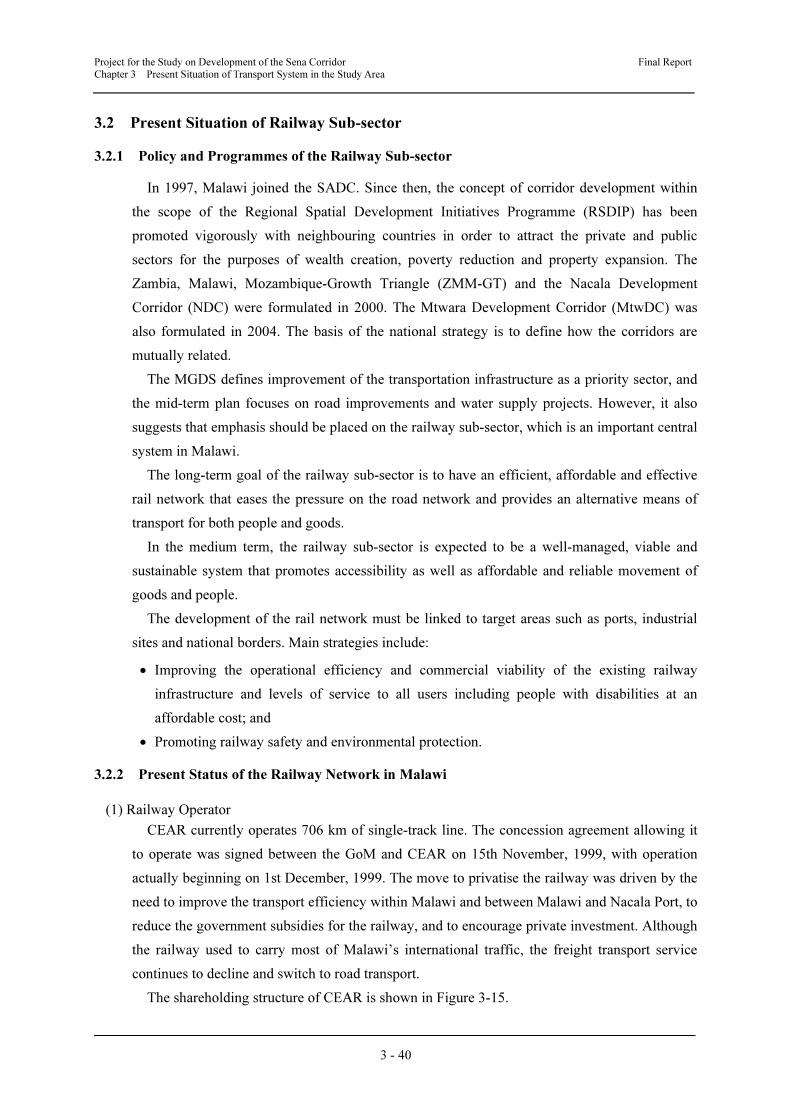
Project for the Study on Development of the Sena Corridor Final Report Chapter 3 Present Situation of Transport System in the Study Area 3 - 40 3.2 Present Situation of Railway Sub-sector 3.2.1 Policy and Programmes of the Railway Sub-sector In 1997, Malawi joined the SADC. Since then, the concept of corridor development within the scope of the Regional Spatial Development Initiatives Programme (RSDIP) has been promoted vigorously with neighbouring countries in order to attract the private and public sectors for the purposes of wealth creation, poverty reduction and property expansion. The Zambia, Malawi, Mozambique-Growth Triangle (ZMM-GT) and the Nacala Development Corridor (NDC) were formulated in 2000. The Mtwara Development Corridor (MtwDC) was also formulated in 2004. The basis of the national strategy is to define how the corridors are mutually related. The MGDS defines improvement of the transportation infrastructure as a priority sector, and the mid-term plan focuses on road improvements and water supply projects. However, it also suggests that emphasis should be placed on the railway sub-sector, which is an important central system in Malawi. The long-term goal of the railway sub-sector is to have an efficient, affordable and effective rail network that eases the pressure on the road network and provides an alternative means of transport for both people and goods. In the medium term, the railway sub-sector is expected to be a well-managed, viable and sustainable system that promotes accessibility as well as affordable and reliable movement of goods and people. The development of the rail network must be linked to target areas such as ports, industrial sites and national borders. Main strategies include: • Improving the operational efficiency and commercial viability of the existing railway infrastructure and levels of service to all users including people with disabilities at an affordable cost; and • Promoting railway safety and environmental protection. 3.2.2 Present Status of the Railway Network in Malawi (1) Railway Operator CEAR currently operates 706 km of single-track line. The concession agreement allowing it to operate was signed between the GoM and CEAR on 15th November, 1999, with operation actually beginning on 1st December, 1999. The move to privatise the railway was driven by the need to improve the transport efficiency within Malawi and between Malawi and Nacala Port, to reduce the government subsidies for the railway, and to encourage private investment. Although the railway used to carry most of Malawi’s international traffic, the freight transport service continues to decline and switch to road transport. The shareholding structure of CEAR is shown in Figure 3-15.
Transcript of 3.2 Present Situation of Railway Sub-sector · † Promoting railway safety and environmental...
Project for the Study on Development of the Sena Corridor Final Report
Chapter 3 Present Situation of Transport System in the Study Area
3 - 40
3.2 Present Situation of Railway Sub-sector
3.2.1 Policy and Programmes of the Railway Sub-sector
In 1997, Malawi joined the SADC. Since then, the concept of corridor development within
the scope of the Regional Spatial Development Initiatives Programme (RSDIP) has been
promoted vigorously with neighbouring countries in order to attract the private and public
sectors for the purposes of wealth creation, poverty reduction and property expansion. The
Zambia, Malawi, Mozambique-Growth Triangle (ZMM-GT) and the Nacala Development
Corridor (NDC) were formulated in 2000. The Mtwara Development Corridor (MtwDC) was
also formulated in 2004. The basis of the national strategy is to define how the corridors are
mutually related.
The MGDS defines improvement of the transportation infrastructure as a priority sector, and
the mid-term plan focuses on road improvements and water supply projects. However, it also
suggests that emphasis should be placed on the railway sub-sector, which is an important central
system in Malawi.
The long-term goal of the railway sub-sector is to have an efficient, affordable and effective
rail network that eases the pressure on the road network and provides an alternative means of
transport for both people and goods.
In the medium term, the railway sub-sector is expected to be a well-managed, viable and
sustainable system that promotes accessibility as well as affordable and reliable movement of
goods and people.
The development of the rail network must be linked to target areas such as ports, industrial
sites and national borders. Main strategies include:
• Improving the operational efficiency and commercial viability of the existing railway
infrastructure and levels of service to all users including people with disabilities at an
affordable cost; and
• Promoting railway safety and environmental protection.
3.2.2 Present Status of the Railway Network in Malawi
(1) Railway Operator
CEAR currently operates 706 km of single-track line. The concession agreement allowing it
to operate was signed between the GoM and CEAR on 15th November, 1999, with operation
actually beginning on 1st December, 1999. The move to privatise the railway was driven by the
need to improve the transport efficiency within Malawi and between Malawi and Nacala Port, to
reduce the government subsidies for the railway, and to encourage private investment. Although
the railway used to carry most of Malawi’s international traffic, the freight transport service
continues to decline and switch to road transport.
The shareholding structure of CEAR is shown in Figure 3-15.
Project for the Study on Development of the Sena Corridor Final Report
Chapter 3 Present Situation of Transport System in the Study Area
3 - 41
Source: Vale
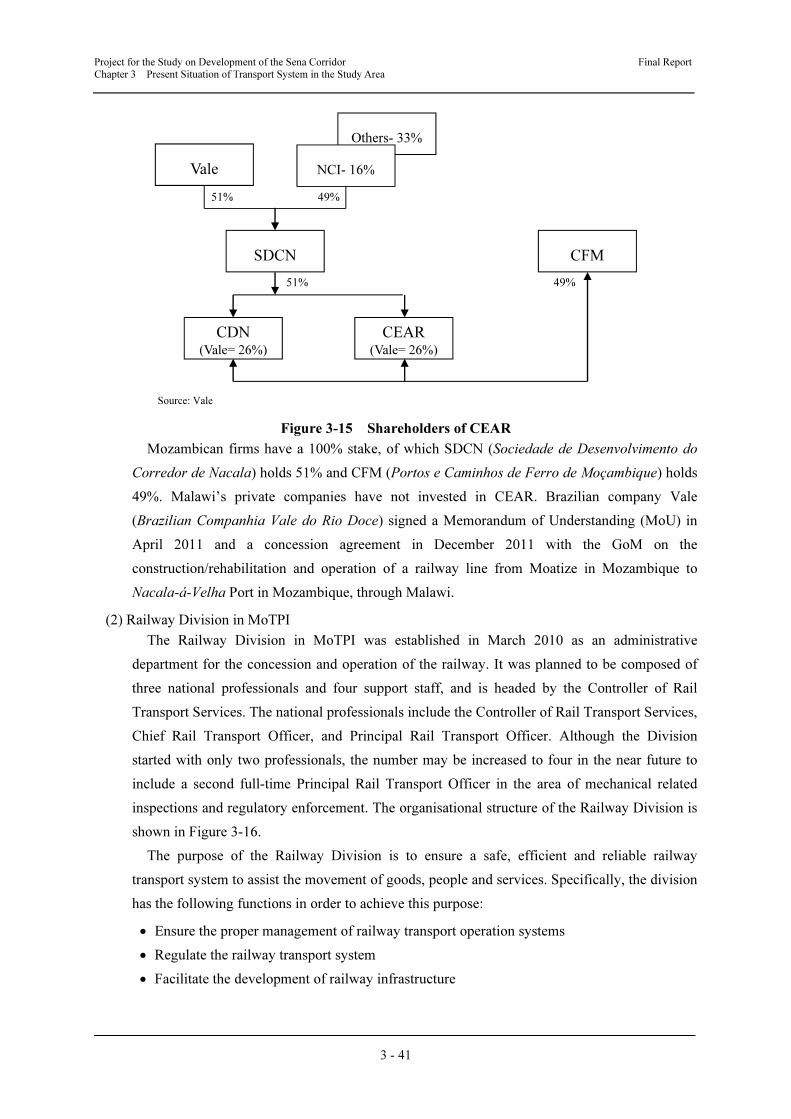
Figure 3-15 Shareholders of CEAR
Mozambican firms have a 100% stake, of which SDCN (Sociedade de Desenvolvimento do
Corredor de Nacala) holds 51% and CFM (Portos e Caminhos de Ferro de Moçambique) holds
49%. Malawi’s private companies have not invested in CEAR. Brazilian company Vale
(Brazilian Companhia Vale do Rio Doce) signed a Memorandum of Understanding (MoU) in
April 2011 and a concession agreement in December 2011 with the GoM on the
construction/rehabilitation and operation of a railway line from Moatize in Mozambique to
Nacala-á-Velha Port in Mozambique, through Malawi.
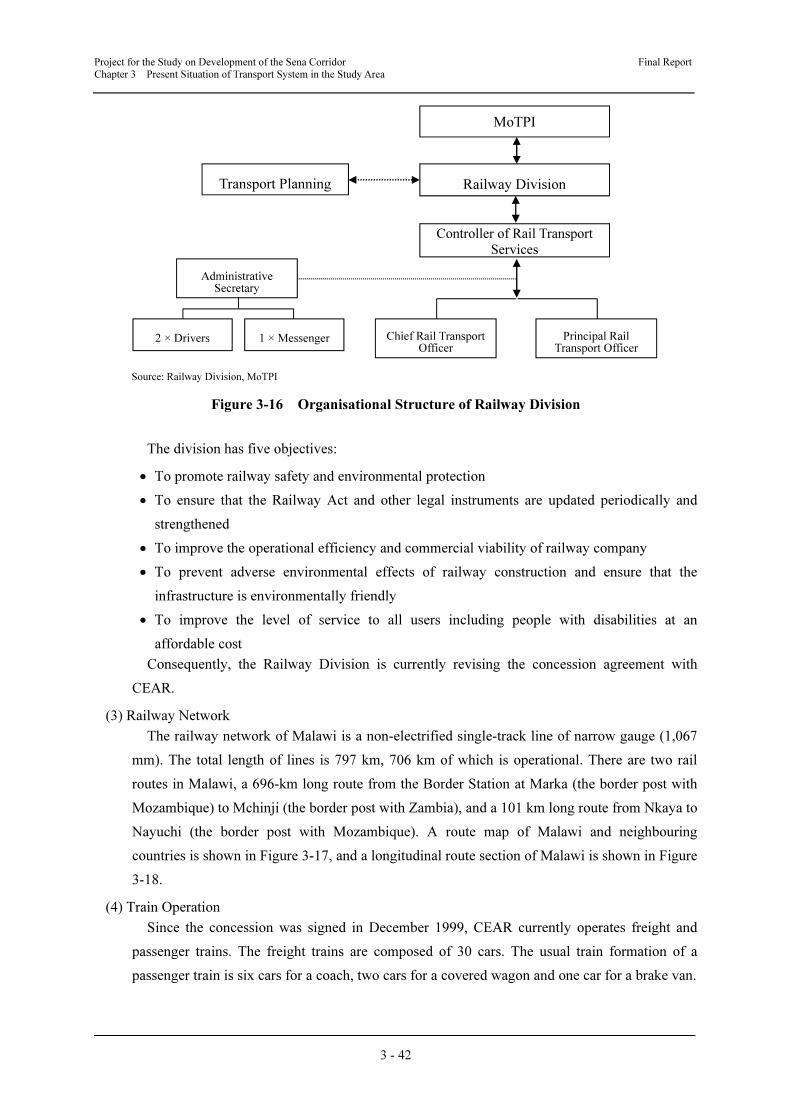
(2) Railway Division in MoTPI
The Railway Division in MoTPI was established in March 2010 as an administrative
department for the concession and operation of the railway. It was planned to be composed of
three national professionals and four support staff, and is headed by the Controller of Rail
Transport Services. The national professionals include the Controller of Rail Transport Services,
Chief Rail Transport Officer, and Principal Rail Transport Officer. Although the Division
started with only two professionals, the number may be increased to four in the near future to
include a second full-time Principal Rail Transport Officer in the area of mechanical related
inspections and regulatory enforcement. The organisational structure of the Railway Division is
shown in Figure 3-16.
The purpose of the Railway Division is to ensure a safe, efficient and reliable railway
transport system to assist the movement of goods, people and services. Specifically, the division
has the following functions in order to achieve this purpose:
• Ensure the proper management of railway transport operation systems
• Regulate the railway transport system
• Facilitate the development of railway infrastructure
Others- 33%
NCI- 16% Vale
SDCN
CDN (Vale= 26%)
CEAR (Vale= 26%)
CFM
51% 49%
49% 51%
Project for the Study on Development of the Sena Corridor Final Report
Chapter 3 Present Situation of Transport System in the Study Area
3 - 42
Source: Railway Division, MoTPI
Figure 3-16 Organisational Structure of Railway Division
The division has five objectives:
• To promote railway safety and environmental protection
• To ensure that the Railway Act and other legal instruments are updated periodically and
strengthened
• To improve the operational efficiency and commercial viability of railway company
• To prevent adverse environmental effects of railway construction and ensure that the
infrastructure is environmentally friendly
• To improve the level of service to all users including people with disabilities at an
affordable cost
Consequently, the Railway Division is currently revising the concession agreement with
CEAR.
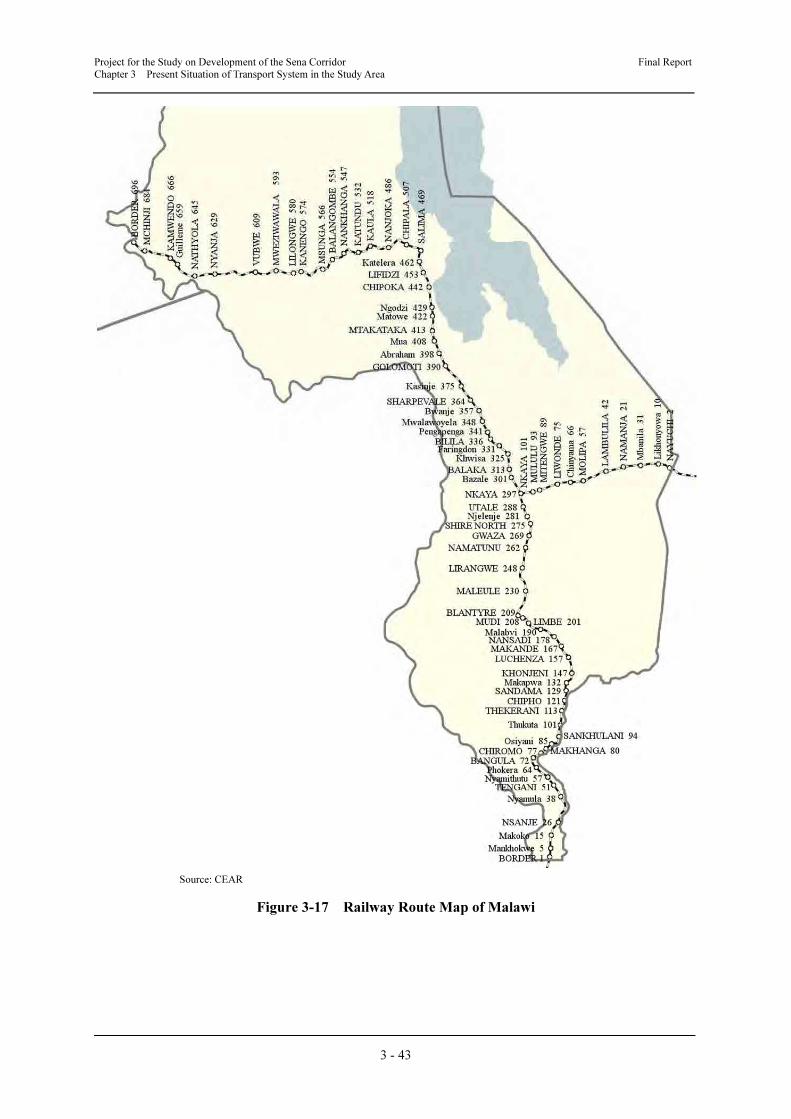
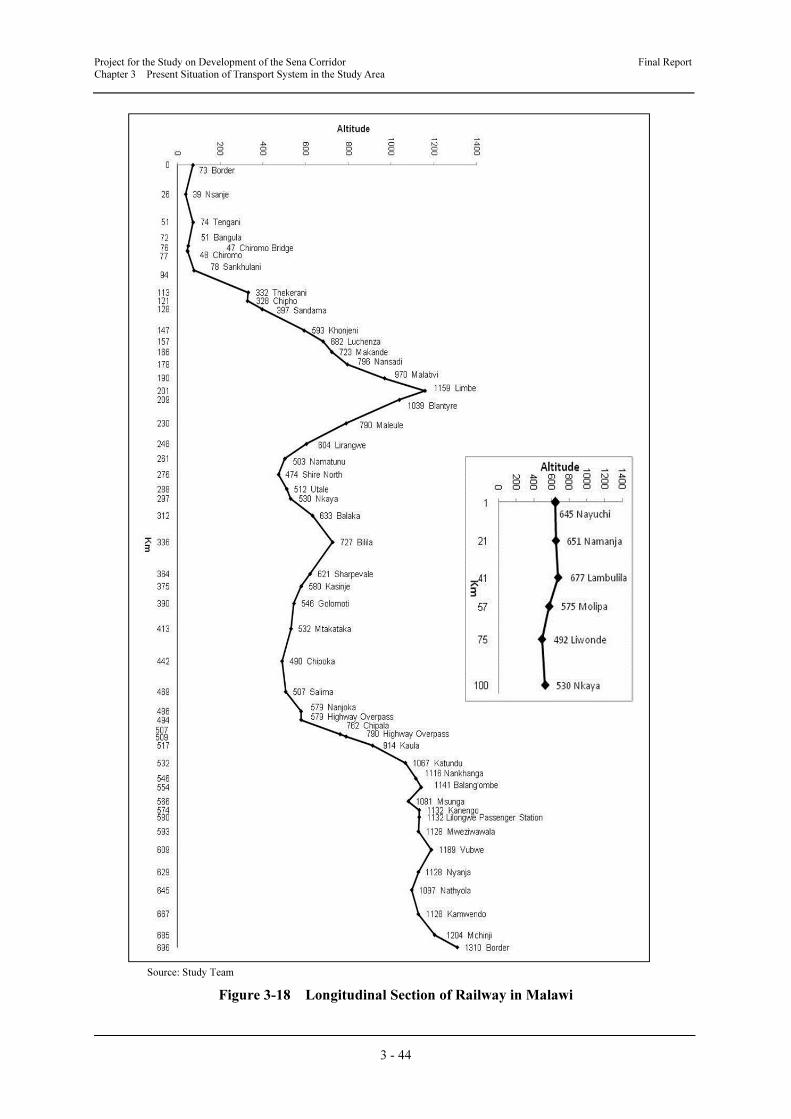
(3) Railway Network
The railway network of Malawi is a non-electrified single-track line of narrow gauge (1,067
mm). The total length of lines is 797 km, 706 km of which is operational. There are two rail
routes in Malawi, a 696-km long route from the Border Station at Marka (the border post with
Mozambique) to Mchinji (the border post with Zambia), and a 101 km long route from Nkaya to
Nayuchi (the border post with Mozambique). A route map of Malawi and neighbouring
countries is shown in Figure 3-17, and a longitudinal route section of Malawi is shown in Figure
3-18.
(4) Train Operation
Since the concession was signed in December 1999, CEAR currently operates freight and
passenger trains. The freight trains are composed of 30 cars. The usual train formation of a
passenger train is six cars for a coach, two cars for a covered wagon and one car for a brake van.
MoTPI
Railway Division Transport Planning
Controller of Rail Transport
Services
Principal Rail Transport Officer
Chief Rail Transport Officer
1 × Messenger
Administrative Secretary
2 × Drivers
Project for the Study on Development of the Sena Corridor Final Report
Chapter 3 Present Situation of Transport System in the Study Area
3 - 43
Source: CEAR
Figure 3-17 Railway Route Map of Malawi
Project for the Study on Development of the Sena Corridor Final Report
Chapter 3 Present Situation of Transport System in the Study Area
3 - 44
Source: Study Team
Figure 3-18 Longitudinal Section of Railway in Malawi

Project for the Study on Development of the Sena Corridor Final Report
Chapter 3 Present Situation of Transport System in the Study Area
3 - 45
Due to insufficient rolling stock, the freight trains operate depending on transportation
demand. These trains run from Blantyre to Nayuchi and from Lilongwe to Nayuchi on the
Malawi side. Corredor de Desenvolvimento do Norte (CDN) operates from Nayuchi to Nacala
Port on the Mozambique side. The train operators and locomotives change over at Nayuchi
Station, thus solving problems such as the regulation of train operation and language and also
ensuring interoperability of CEAR and CDN.
a) Freight Transport
After reaching a peak of 510,000 tonnes in 2000, the freight transport volume has gradually
decreased, falling to 250,000 tonnes by 2010. Freight volumes remain at around 100,000 tonnes
for exports and over 100,000 tonnes for imports. In contrast, the rail share decreased from 26%
in 2000 to 11% in 2006 due to the growth of truck transportation, as shown in Figure 3-19 and
Table 3-19. On the other hand, the volume of domestic freight transportation dropped
dramatically and decreased to 14,000 tonnes in 2010. This resulted in a shift from rail to road
due to poor transportation services such as the lack of operating locomotives.
The transit of international freight takes an average of 3 days, whereas the handling of freight
takes 24 hours, so most of the time is taken up in transit. On the other hand, the custom
clearance time at Nayuchi is officially given as one hour, which would satisfy forwarders, but it
currently takes one or two days due to lack of locomotives. If the handling of freight can be
rationalised by containerization, it will also be more attractive for forwarders.
Note: *The number of passengers in 2010 is estimated from actual data until October 2010.
Source: CEAR
Figure 3-19 Freight Transport
1995 1996 1997 1998 1999 2000 2001 2002 2003 2004 2005 2006 2007 2008 2009 2010
Exports 35,200 32,700 37,600 27,800 38,600 101,000 135,600 93,700 83,300 88,500 61,000 57,100 94,400 66,600 78,600 64,734
Imports 77,500 87,800 100,600 115,700 108,700 155,100 139,700 186,000 150,000 134,500 109,900 114,300 121,500 133,000 154,700 148,658
Local 226,400 131,600 145,100 167,100 196,800 249,700 172,500 183,500 39,700 17,100 23,300 19,600 15,000 14,400 12,200 14,097
Total 339,100 252,100 283,300 310,600 344,100 505,800 447,800 463,200 273,000 240,100 194,200 191,000 230,900 214,000 245,500 252,805
0
100,000
200,000
300,000
400,000
500,000
600,000
Fre
igh
t T
ran
spo
rt V
olu
me (
ton)
Project for the Study on Development of the Sena Corridor Final Report
Chapter 3 Present Situation of Transport System in the Study Area
3 - 46
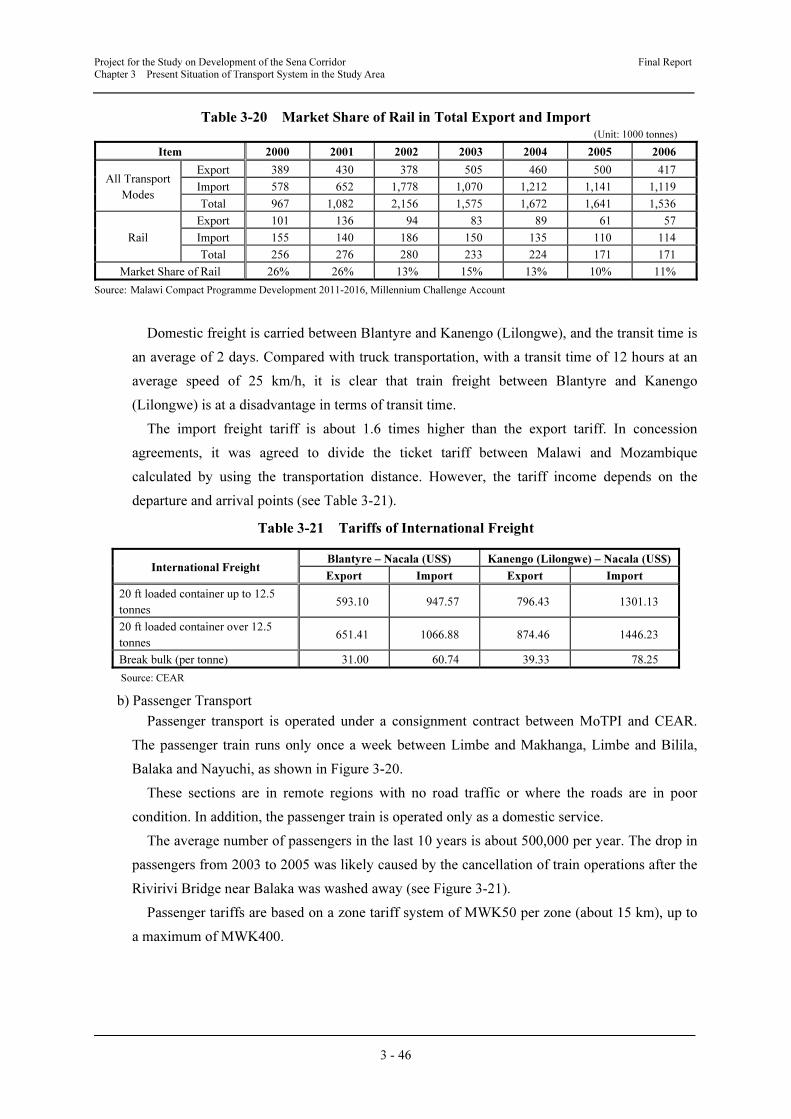
Table 3-20 Market Share of Rail in Total Export and Import (Unit: 1000 tonnes)
Item 2000 2001 2002 2003 2004 2005 2006
All Transport
Modes
Export 389 430 378 505 460 500 417
Import 578 652 1,778 1,070 1,212 1,141 1,119
Total 967 1,082 2,156 1,575 1,672 1,641 1,536
Rail
Export 101 136 94 83 89 61 57
Import 155 140 186 150 135 110 114
Total 256 276 280 233 224 171 171
Market Share of Rail 26% 26% 13% 15% 13% 10% 11%
Source: Malawi Compact Programme Development 2011-2016, Millennium Challenge Account
Domestic freight is carried between Blantyre and Kanengo (Lilongwe), and the transit time is
an average of 2 days. Compared with truck transportation, with a transit time of 12 hours at an
average speed of 25 km/h, it is clear that train freight between Blantyre and Kanengo
(Lilongwe) is at a disadvantage in terms of transit time.
The import freight tariff is about 1.6 times higher than the export tariff. In concession
agreements, it was agreed to divide the ticket tariff between Malawi and Mozambique
calculated by using the transportation distance. However, the tariff income depends on the
departure and arrival points (see Table 3-21).
Table 3-21 Tariffs of International Freight
International Freight Blantyre – Nacala (US$) Kanengo (Lilongwe) – Nacala (US$)
Export Import Export Import
20 ft loaded container up to 12.5
tonnes 593.10 947.57 796.43 1301.13
20 ft loaded container over 12.5
tonnes 651.41 1066.88 874.46 1446.23
Break bulk (per tonne) 31.00 60.74 39.33 78.25
Source: CEAR
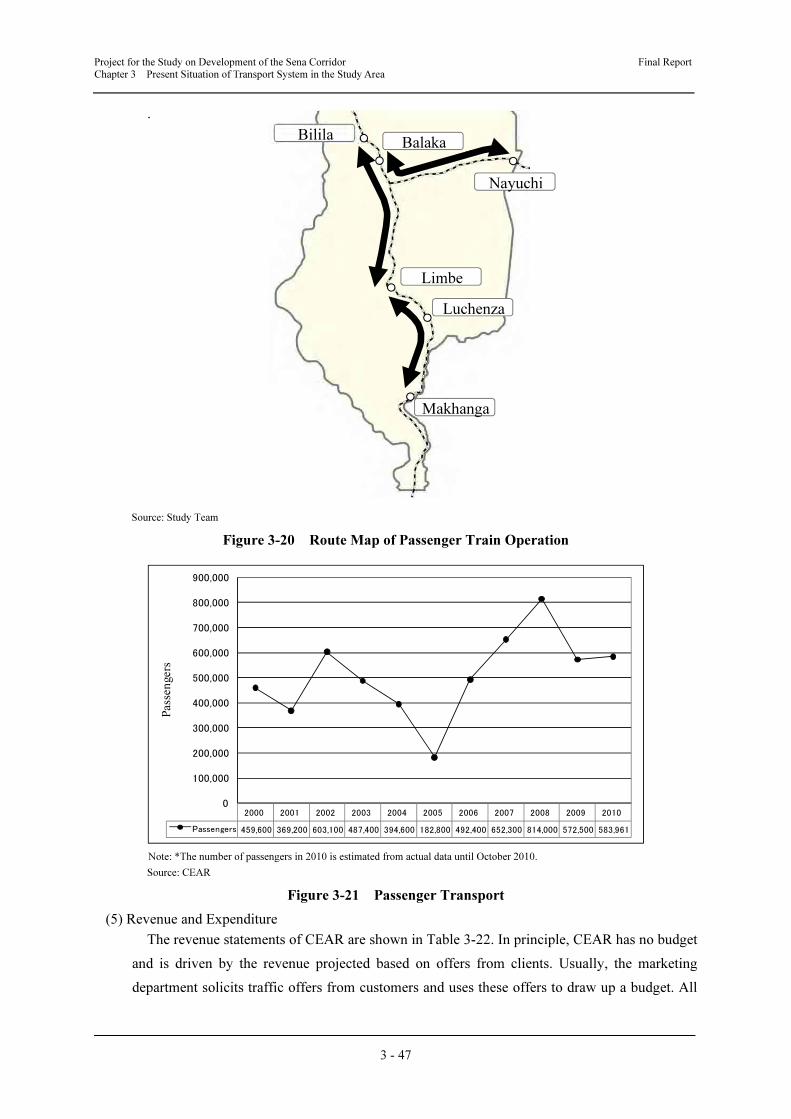
b) Passenger Transport
Passenger transport is operated under a consignment contract between MoTPI and CEAR.
The passenger train runs only once a week between Limbe and Makhanga, Limbe and Bilila,
Balaka and Nayuchi, as shown in Figure 3-20.
These sections are in remote regions with no road traffic or where the roads are in poor
condition. In addition, the passenger train is operated only as a domestic service.
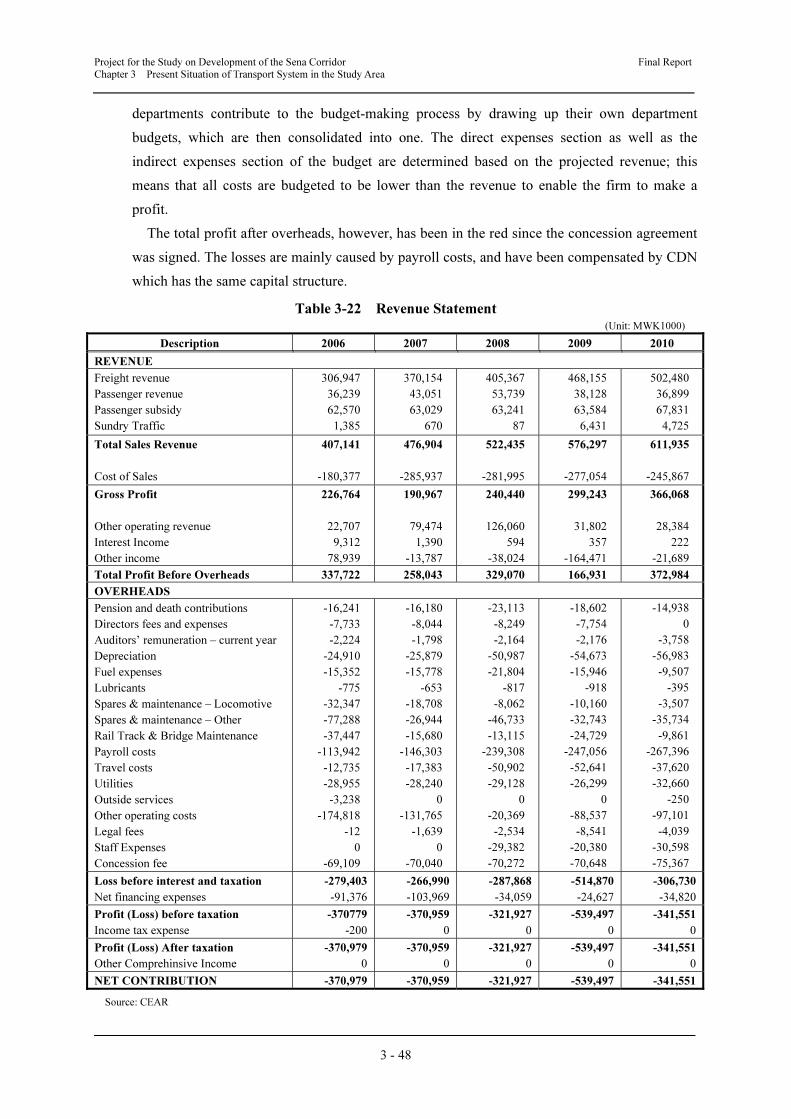
The average number of passengers in the last 10 years is about 500,000 per year. The drop in
passengers from 2003 to 2005 was likely caused by the cancellation of train operations after the
Rivirivi Bridge near Balaka was washed away (see Figure 3-21).
Passenger tariffs are based on a zone tariff system of MWK50 per zone (about 15 km), up to
a maximum of MWK400.
Project for the Study on Development of the Sena Corridor Final Report
Chapter 3 Present Situation of Transport System in the Study Area
3 - 47
.
Source: Study Team
Figure 3-20 Route Map of Passenger Train Operation
Note: *The number of passengers in 2010 is estimated from actual data until October 2010.
Source: CEAR
Figure 3-21 Passenger Transport
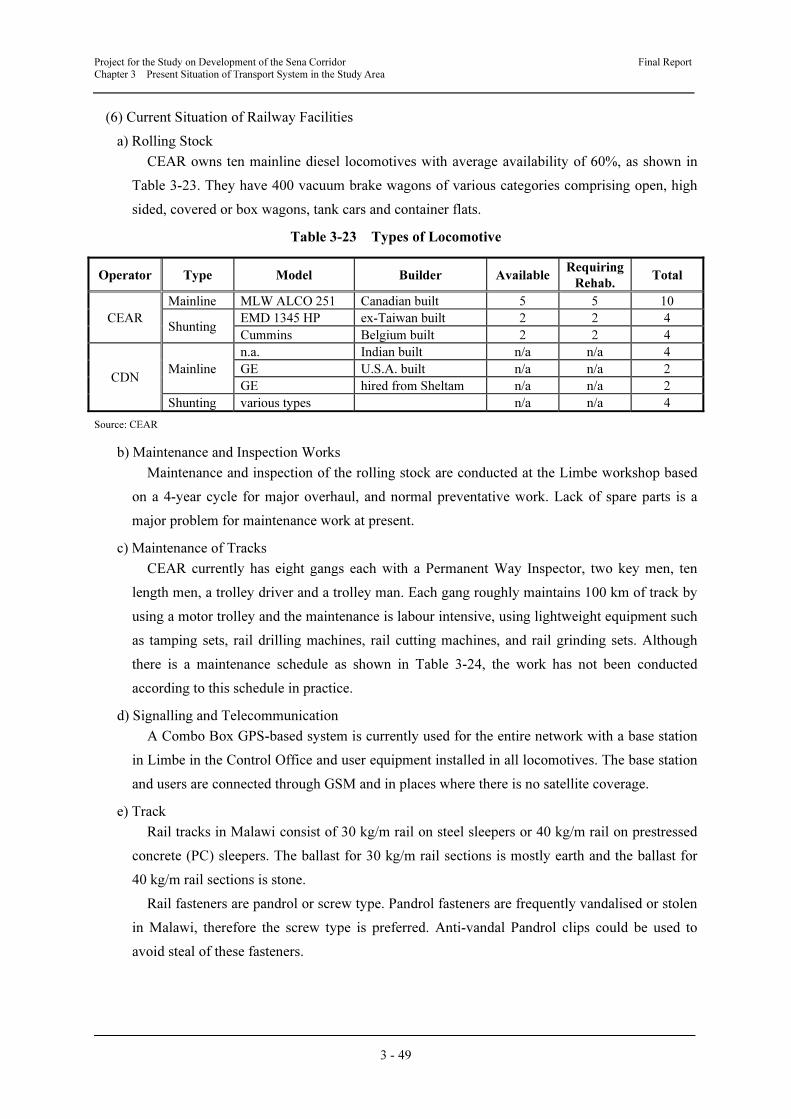
(5) Revenue and Expenditure
The revenue statements of CEAR are shown in Table 3-22. In principle, CEAR has no budget
and is driven by the revenue projected based on offers from clients. Usually, the marketing
department solicits traffic offers from customers and uses these offers to draw up a budget. All
2000 2001 2002 2003 2004 2005 2006 2007 2008 2009 2010
Passengers 459,600 369,200 603,100 487,400 394,600 182,800 492,400 652,300 814,000 572,500 583,961
0
100,000
200,000
300,000
400,000
500,000
600,000
700,000
800,000
900,000
Passengers
Luchenza
Limbe
BililaBalaka
Nayuchi
Makhanga
Project for the Study on Development of the Sena Corridor Final Report
Chapter 3 Present Situation of Transport System in the Study Area
3 - 48
departments contribute to the budget-making process by drawing up their own department
budgets, which are then consolidated into one. The direct expenses section as well as the
indirect expenses section of the budget are determined based on the projected revenue; this
means that all costs are budgeted to be lower than the revenue to enable the firm to make a
profit.
The total profit after overheads, however, has been in the red since the concession agreement
was signed. The losses are mainly caused by payroll costs, and have been compensated by CDN
which has the same capital structure.
Table 3-22 Revenue Statement (Unit: MWK1000)
Description 2006 2007 2008 2009 2010
REVENUE
Freight revenue
Passenger revenue
Passenger subsidy
Sundry Traffic
306,947
36,239
62,570
1,385
370,154
43,051
63,029
670
405,367
53,739
63,241
87
468,155
38,128
63,584
6,431
502,480
36,899
67,831
4,725
Total Sales Revenue
Cost of Sales
407,141
-180,377
476,904
-285,937
522,435
-281,995
576,297
-277,054
611,935
-245,867
Gross Profit
Other operating revenue
Interest Income
Other income
226,764
22,707
9,312
78,939
190,967
79,474
1,390
-13,787
240,440
126,060
594
-38,024
299,243
31,802
357
-164,471
366,068
28,384
222
-21,689
Total Profit Before Overheads 337,722 258,043 329,070 166,931 372,984
OVERHEADS
Pension and death contributions
Directors fees and expenses
Auditors’ remuneration – current year
Depreciation
Fuel expenses
Lubricants
Spares & maintenance – Locomotive
Spares & maintenance – Other
Rail Track & Bridge Maintenance
Payroll costs
Travel costs
Utilities
Outside services
Other operating costs
Legal fees
Staff Expenses
Concession fee
-16,241
-7,733
-2,224
-24,910
-15,352
-775
-32,347
-77,288
-37,447
-113,942
-12,735
-28,955
-3,238
-174,818
-12
0
-69,109
-16,180
-8,044
-1,798
-25,879
-15,778
-653
-18,708
-26,944
-15,680
-146,303
-17,383
-28,240
0
-131,765
-1,639
0
-70,040
-23,113
-8,249
-2,164
-50,987
-21,804
-817
-8,062
-46,733
-13,115
-239,308
-50,902
-29,128
0
-20,369
-2,534
-29,382
-70,272
-18,602
-7,754
-2,176
-54,673
-15,946
-918
-10,160
-32,743
-24,729
-247,056
-52,641
-26,299
0
-88,537
-8,541
-20,380
-70,648
-14,938
0
-3,758
-56,983
-9,507
-395
-3,507
-35,734
-9,861
-267,396
-37,620
-32,660
-250
-97,101
-4,039
-30,598
-75,367
Loss before interest and taxation
Net financing expenses
-279,403
-91,376
-266,990
-103,969
-287,868
-34,059
-514,870
-24,627
-306,730
-34,820
Profit (Loss) before taxation
Income tax expense
-370779
-200
-370,959
0
-321,927
0
-539,497
0
-341,551
0
Profit (Loss) After taxation
Other Comprehinsive Income
-370,979
0
-370,959
0
-321,927
0
-539,497
0
-341,551
0
NET CONTRIBUTION -370,979 -370,959 -321,927 -539,497 -341,551
Source: CEAR
Project for the Study on Development of the Sena Corridor Final Report
Chapter 3 Present Situation of Transport System in the Study Area
3 - 49
(6) Current Situation of Railway Facilities
a) Rolling Stock
CEAR owns ten mainline diesel locomotives with average availability of 60%, as shown in
Table 3-23. They have 400 vacuum brake wagons of various categories comprising open, high
sided, covered or box wagons, tank cars and container flats.
Table 3-23 Types of Locomotive
Operator Type Model Builder AvailableRequiring
Rehab. Total
CEAR
Mainline MLW ALCO 251 Canadian built 5 5 10
Shunting EMD 1345 HP ex-Taiwan built 2 2 4
Cummins Belgium built 2 2 4
CDN Mainline
n.a. Indian built n/a n/a 4
GE U.S.A. built n/a n/a 2
GE hired from Sheltam n/a n/a 2
Shunting various types n/a n/a 4
Source: CEAR
b) Maintenance and Inspection Works
Maintenance and inspection of the rolling stock are conducted at the Limbe workshop based
on a 4-year cycle for major overhaul, and normal preventative work. Lack of spare parts is a
major problem for maintenance work at present.
c) Maintenance of Tracks
CEAR currently has eight gangs each with a Permanent Way Inspector, two key men, ten
length men, a trolley driver and a trolley man. Each gang roughly maintains 100 km of track by
using a motor trolley and the maintenance is labour intensive, using lightweight equipment such
as tamping sets, rail drilling machines, rail cutting machines, and rail grinding sets. Although
there is a maintenance schedule as shown in Table 3-24, the work has not been conducted
according to this schedule in practice.
d) Signalling and Telecommunication
A Combo Box GPS-based system is currently used for the entire network with a base station
in Limbe in the Control Office and user equipment installed in all locomotives. The base station
and users are connected through GSM and in places where there is no satellite coverage.
e) Track
Rail tracks in Malawi consist of 30 kg/m rail on steel sleepers or 40 kg/m rail on prestressed
concrete (PC) sleepers. The ballast for 30 kg/m rail sections is mostly earth and the ballast for
40 kg/m rail sections is stone.
Rail fasteners are pandrol or screw type. Pandrol fasteners are frequently vandalised or stolen
in Malawi, therefore the screw type is preferred. Anti-vandal Pandrol clips could be used to
avoid steal of these fasteners.
Project for the Study on Development of the Sena Corridor Final Report
Chapter 3 Present Situation of Transport System in the Study Area
3 - 50
Table 3-24 Annual Maintenance Schedule
Source: CEAR
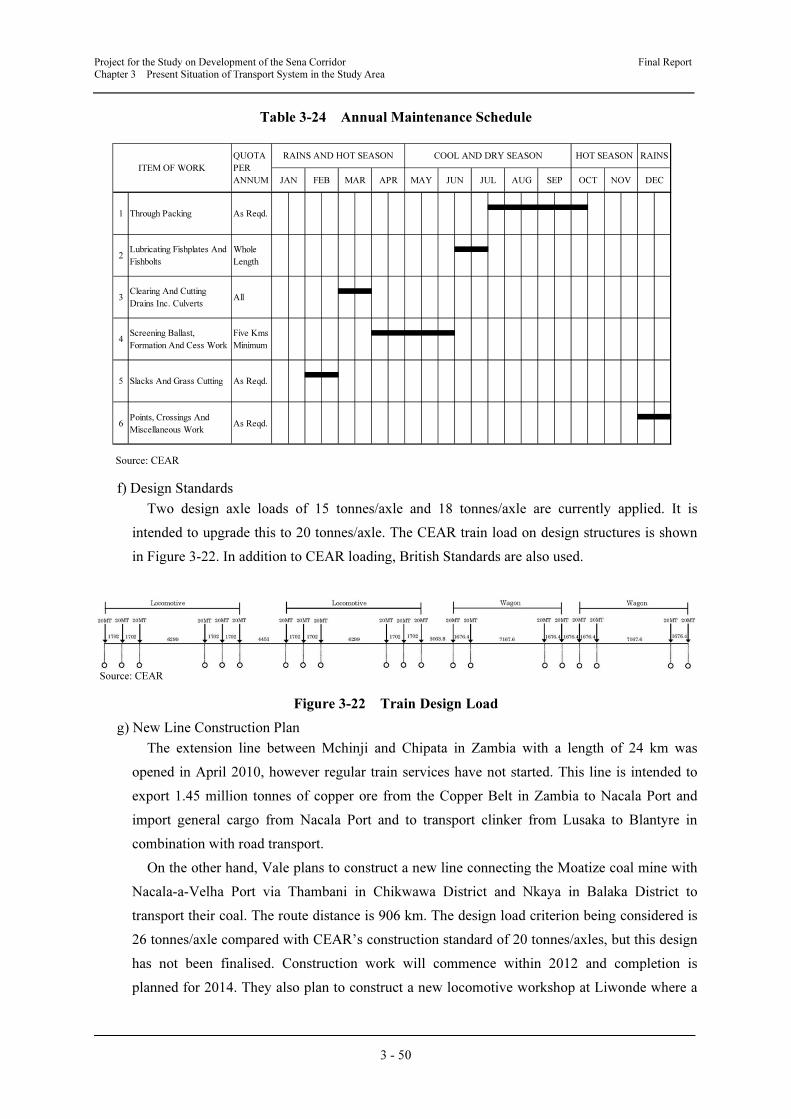
f) Design Standards
Two design axle loads of 15 tonnes/axle and 18 tonnes/axle are currently applied. It is
intended to upgrade this to 20 tonnes/axle. The CEAR train load on design structures is shown
in Figure 3-22. In addition to CEAR loading, British Standards are also used.
Source: CEAR
Figure 3-22 Train Design Load
g) New Line Construction Plan
The extension line between Mchinji and Chipata in Zambia with a length of 24 km was
opened in April 2010, however regular train services have not started. This line is intended to
export 1.45 million tonnes of copper ore from the Copper Belt in Zambia to Nacala Port and
import general cargo from Nacala Port and to transport clinker from Lusaka to Blantyre in
combination with road transport.
On the other hand, Vale plans to construct a new line connecting the Moatize coal mine with
Nacala-a-Velha Port via Thambani in Chikwawa District and Nkaya in Balaka District to
transport their coal. The route distance is 906 km. The design load criterion being considered is
26 tonnes/axle compared with CEAR’s construction standard of 20 tonnes/axles, but this design
has not been finalised. Construction work will commence within 2012 and completion is
planned for 2014. They also plan to construct a new locomotive workshop at Liwonde where a
As Reqd.
Whole
Length
All
Lubricating Fishplates And
Fishbolts
Clearing And Cutting
Drains Inc. Culverts
1 Through Packing
ITEM OF WORK
2
3
DEC
RAINSHOT SEASONCOOL AND DRY SEASON
Five Kms
Minimum
As Reqd.
As Reqd.
5
6
Screening Ballast,
Formation And Cess Work
Slacks And Grass Cutting
Points, Crossings And
Miscellaneous Work
4
NOV
QUOTA
PER
ANNUM JAN FEB MAR APR
RAINS AND HOT SEASON
SEP OCTMAY JUN JUL AUG

Project for the Study on Development of the Sena Corridor Final Report
Chapter 3 Present Situation of Transport System in the Study Area
3 - 51
small workshop is operated now, to maintain the locomotives.
The coal train will be composed of four locomotives and 120 hopper wagons (car length: 13
m, loading capacity: 60 tonnes, gross weight: 85 tonnes). The total traction capacity will be
10,200 tonnes. Twelve round trains per day will be operated on the line to transport 12 to 18
million tonnes of coking coal and fuel coal annually. Other than these trains, extra transport
capacity of one to three million tonnes per year will be secured to transport sugar and copper ore
for both Malawi and Zambia. As to passenger and domestic freight trains, a dedicated time
schedule for their operation will be drawn up.
These trains will be operated by CEAR within Malawi and by CDN between Nayuchi and
Nacala Port.
Source: Study Team
Figure 3-23 Future Extension Plan
3.2.3 Railway Operation in the Study Area
The railway network in the Study Area consists of the 120 km operational section between
Limbe and Makhanga and the 81 km non-operational section between Makhanga and Marka. As
described in previous sections, there are various problems related to transportation in Malawi as
well as in the Study Area. The identified problems are as follows.
(1) Present Condition of Facilities
Trains operate between Limbe and Makhanga, however, this section has not been maintained.
In embankment sections which account for 30% of the whole line, the shoulders have collapsed
in most places. There are a few cutting slope sections and the collapsed earth has been washed
away. There are 105 bridges with a total length of 1,047 m and almost all of them have
deteriorated and need to be replaced. In particular, almost all wooden sleepers on the bridges are
rotten and have lost their original capacity to support the weight of trains.
Legend
: New line planned by Vale
: Line to be reconstructed
Project for the Study on Development of the Sena Corridor Final Report
Chapter 3 Present Situation of Transport System in the Study Area
3 - 52
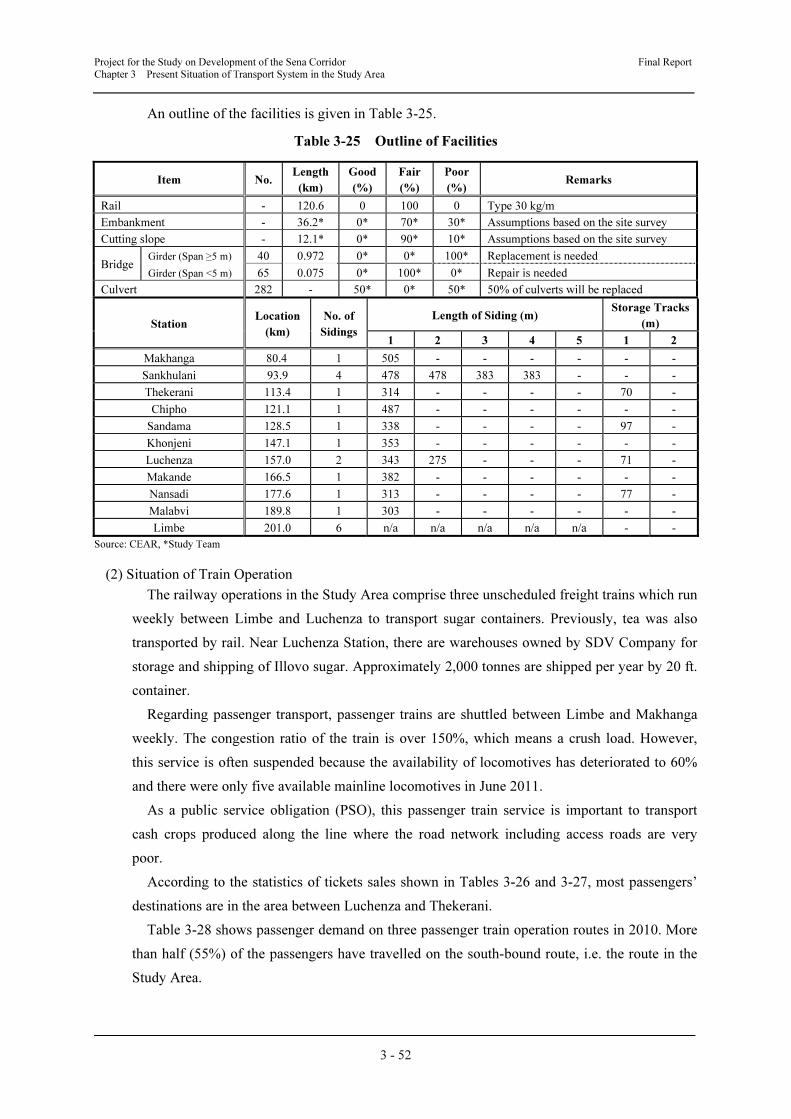
An outline of the facilities is given in Table 3-25.
Table 3-25 Outline of Facilities
Item No. Length
(km)
Good
(%)
Fair
(%)
Poor
(%) Remarks
Rail - 120.6 0 100 0 Type 30 kg/m
Embankment - 36.2* 0* 70* 30* Assumptions based on the site survey
Cutting slope - 12.1* 0* 90* 10* Assumptions based on the site survey
Bridge Girder (Span ≥5 m) 40 0.972 0* 0* 100* Replacement is needed
Girder (Span <5 m) 65 0.075 0* 100* 0* Repair is needed
Culvert 282 - 50* 0* 50* 50% of culverts will be replaced
Station Location
(km)
No. of
Sidings
Length of Siding (m) Storage Tracks
(m)
1 2 3 4 5 1 2
Makhanga 80.4 1 505 - - - - - -
Sankhulani 93.9 4 478 478 383 383 - - -
Thekerani 113.4 1 314 - - - - 70 -
Chipho 121.1 1 487 - - - - - -
Sandama 128.5 1 338 - - - - 97 -
Khonjeni 147.1 1 353 - - - - - -
Luchenza 157.0 2 343 275 - - - 71 -
Makande 166.5 1 382 - - - - - -
Nansadi 177.6 1 313 - - - - 77 -
Malabvi 189.8 1 303 - - - - - -
Limbe 201.0 6 n/a n/a n/a n/a n/a - -
Source: CEAR, *Study Team
(2) Situation of Train Operation
The railway operations in the Study Area comprise three unscheduled freight trains which run
weekly between Limbe and Luchenza to transport sugar containers. Previously, tea was also
transported by rail. Near Luchenza Station, there are warehouses owned by SDV Company for
storage and shipping of Illovo sugar. Approximately 2,000 tonnes are shipped per year by 20 ft.
container.
Regarding passenger transport, passenger trains are shuttled between Limbe and Makhanga
weekly. The congestion ratio of the train is over 150%, which means a crush load. However,
this service is often suspended because the availability of locomotives has deteriorated to 60%
and there were only five available mainline locomotives in June 2011.
As a public service obligation (PSO), this passenger train service is important to transport
cash crops produced along the line where the road network including access roads are very
poor.
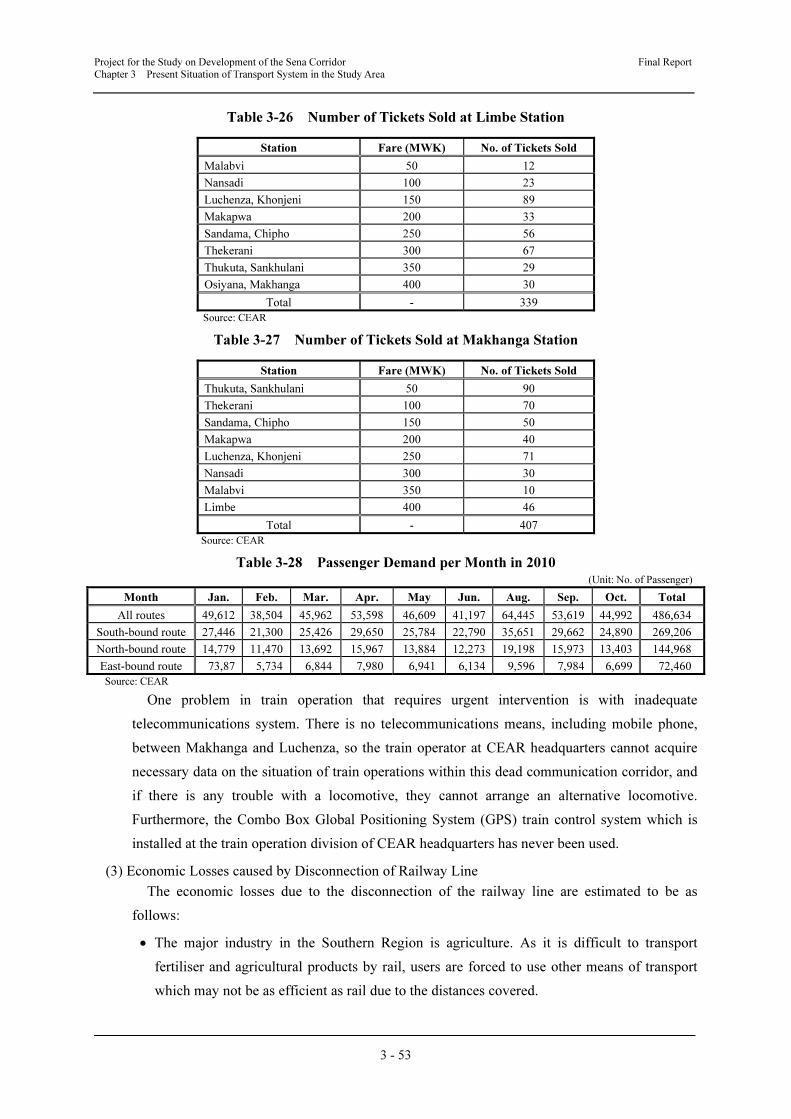
According to the statistics of tickets sales shown in Tables 3-26 and 3-27, most passengers’
destinations are in the area between Luchenza and Thekerani.
Table 3-28 shows passenger demand on three passenger train operation routes in 2010. More
than half (55%) of the passengers have travelled on the south-bound route, i.e. the route in the
Study Area.
Project for the Study on Development of the Sena Corridor Final Report
Chapter 3 Present Situation of Transport System in the Study Area
3 - 53
Table 3-26 Number of Tickets Sold at Limbe Station
Station Fare (MWK) No. of Tickets Sold
Malabvi 50 12
Nansadi 100 23
Luchenza, Khonjeni 150 89
Makapwa 200 33
Sandama, Chipho 250 56
Thekerani 300 67
Thukuta, Sankhulani 350 29
Osiyana, Makhanga 400 30
Total - 339
Source: CEAR
Table 3-27 Number of Tickets Sold at Makhanga Station
Station Fare (MWK) No. of Tickets Sold
Thukuta, Sankhulani 50 90
Thekerani 100 70
Sandama, Chipho 150 50
Makapwa 200 40
Luchenza, Khonjeni 250 71
Nansadi 300 30
Malabvi 350 10
Limbe 400 46
Total - 407
Source: CEAR
Table 3-28 Passenger Demand per Month in 2010 (Unit: No. of Passenger)
Month Jan. Feb. Mar. Apr. May Jun. Aug. Sep. Oct. Total
All routes 49,612 38,504 45,962 53,598 46,609 41,197 64,445 53,619 44,992 486,634
South-bound route 27,446 21,300 25,426 29,650 25,784 22,790 35,651 29,662 24,890 269,206
North-bound route 14,779 11,470 13,692 15,967 13,884 12,273 19,198 15,973 13,403 144,968
East-bound route 73,87 5,734 6,844 7,980 6,941 6,134 9,596 7,984 6,699 72,460
Source: CEAR
One problem in train operation that requires urgent intervention is with inadequate
telecommunications system. There is no telecommunications means, including mobile phone,
between Makhanga and Luchenza, so the train operator at CEAR headquarters cannot acquire
necessary data on the situation of train operations within this dead communication corridor, and
if there is any trouble with a locomotive, they cannot arrange an alternative locomotive.
Furthermore, the Combo Box Global Positioning System (GPS) train control system which is
installed at the train operation division of CEAR headquarters has never been used.
(3) Economic Losses caused by Disconnection of Railway Line
The economic losses due to the disconnection of the railway line are estimated to be as
follows:
• The major industry in the Southern Region is agriculture. As it is difficult to transport
fertiliser and agricultural products by rail, users are forced to use other means of transport
which may not be as efficient as rail due to the distances covered.
Project for the Study on Development of the Sena Corridor Final Report
Chapter 3 Present Situation of Transport System in the Study Area
3 - 54
• This has resulted in the loss of transport means for local residents who previously depended
on railway transportation along the Ruo River on the border between Malawi and
Mozambique. Combination trains were operated every day before 1997, but it has become a
weekly service after the disconnection. This has severely reduced the opportunities for local
residents to sell agricultural products at the markets in Limbe and Blantyre, etc. and caused
their income to decline, hindering efforts to reduce poverty.
• There has been a dramatic impact on transporting Illovo Sugar Ltd.’s products, which is the
biggest sugar growing and processing company in Malawi. Before 1997, the company used
to transport products from Bangula to Nacala Port directly, but now they have to transport
products to Blantyre and Limbe by truck via the M1 road which is inefficient due to steep
hills. From there, sugar is transferred to trains for transport to Nacala Port. Therefore, Illovo
Sugar is adversely affected by the inefficient transport system.
3.2.4 Results of Railway Inventory Survey
The study team conducted a railway inventory survey to assess the present condition of the
80.4-km non-operational section between Makhanga and Border (Marka). An outline of the
survey is as follows, while details of the railway inventory survey results are given in
Appendix-4.
The collected inventory data shows that the railway line was in reasonably good shape at the
time when the washaway caused the section from Bangula to Border (Marka) to be closed. This
is evident by the condition of the railway track itself which is still in fair condition as per
observations recorded in the database.
The main problem is the sleepers, most of which have been stolen. Wooden sleepers, which
were predominantly installed at structures, have either rotted or been vandalised, while the
metal ones have either decayed, disappeared, or been damaged by thieves.
The embankment is generally in fair condition in most places except where it has been
flooded and washed away. However, the ballast has been fouled in most places and needs to be
replaced along almost the whole length of the track. Structures are varied: some are still in good
condition but others require rehabilitation.
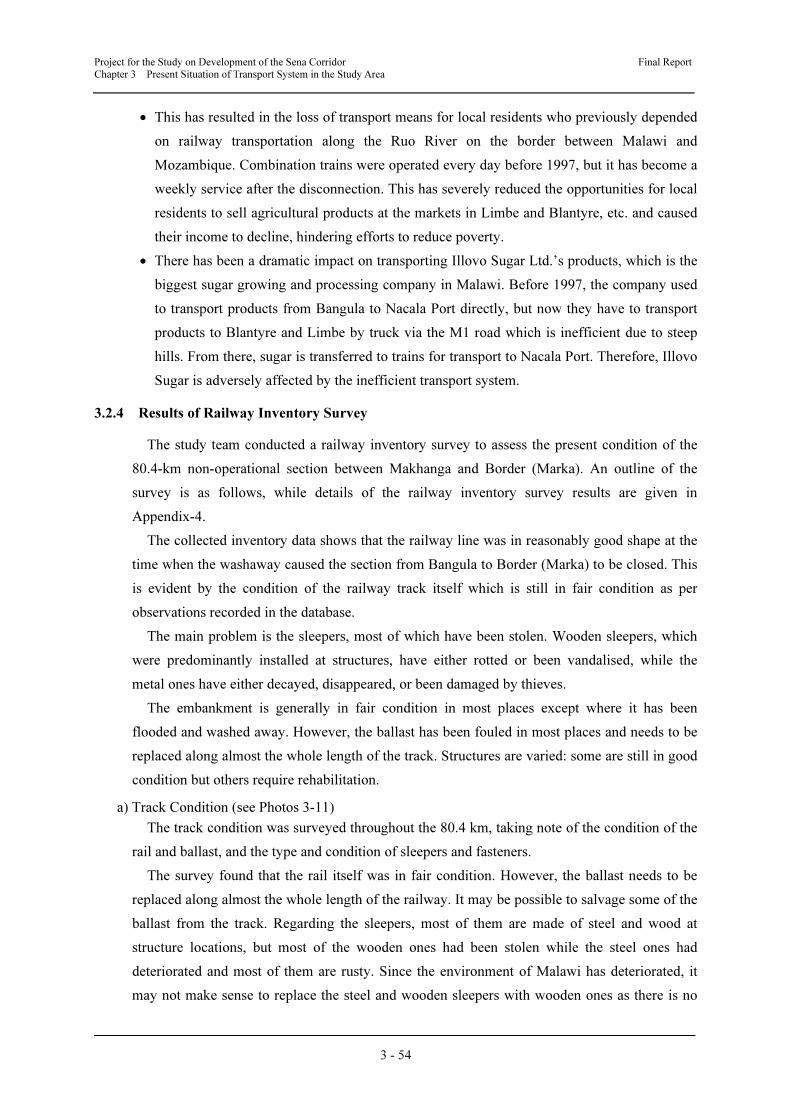
a) Track Condition (see Photos 3-11)
The track condition was surveyed throughout the 80.4 km, taking note of the condition of the
rail and ballast, and the type and condition of sleepers and fasteners.
The survey found that the rail itself was in fair condition. However, the ballast needs to be
replaced along almost the whole length of the railway. It may be possible to salvage some of the
ballast from the track. Regarding the sleepers, most of them are made of steel and wood at
structure locations, but most of the wooden ones had been stolen while the steel ones had
deteriorated and most of them are rusty. Since the environment of Malawi has deteriorated, it
may not make sense to replace the steel and wooden sleepers with wooden ones as there is no
Project for the Study on Development of the Sena Corridor Final Report
Chapter 3 Present Situation of Transport System in the Study Area
3 - 55
longer an ample supply of wood in Malawi. To upgrade the railway line, concrete sleepers
would be the logical choice as an alternative to the existing steel sleepers. Hence, it is necessary
to replace all the sleepers in the area of interest from Makhanga to Border (Marka). Fasteners
were generally in fair condition where they existed, but had suffered steal in most locations.
Track in Good Condition Track in Bad Condition
Photos by Study Team, November 2010
Photos 3-11 Track Conditions
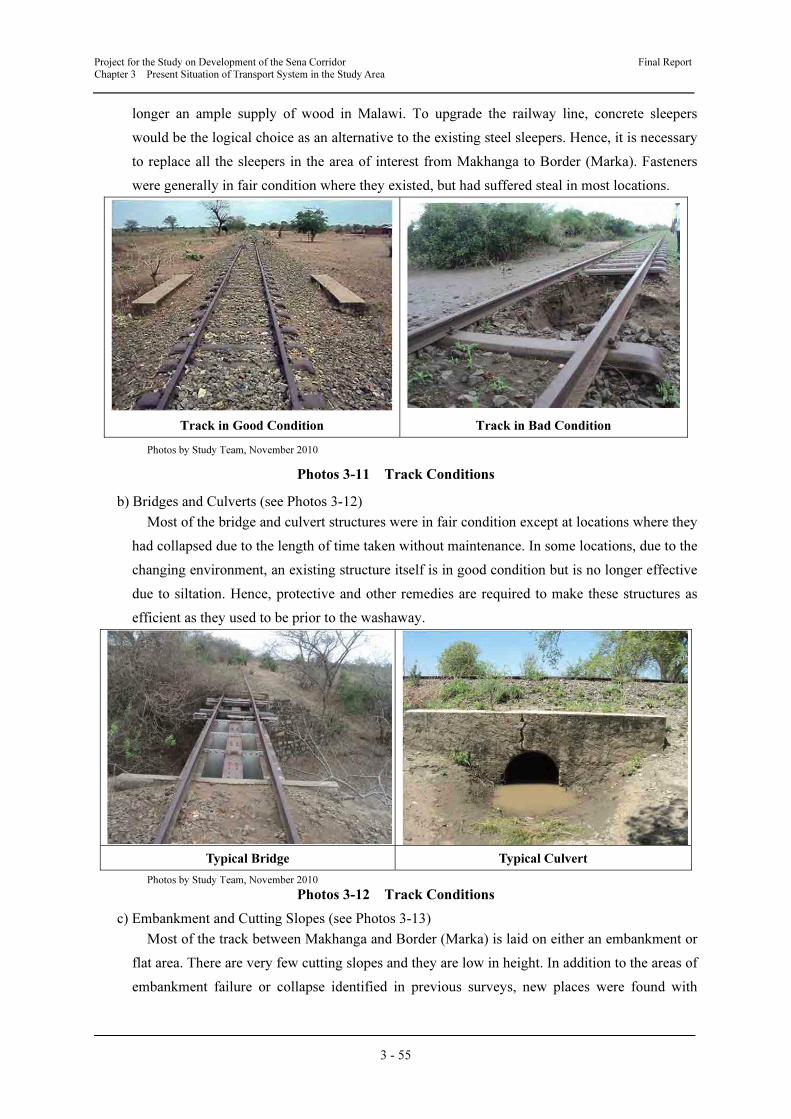
b) Bridges and Culverts (see Photos 3-12)
Most of the bridge and culvert structures were in fair condition except at locations where they
had collapsed due to the length of time taken without maintenance. In some locations, due to the
changing environment, an existing structure itself is in good condition but is no longer effective
due to siltation. Hence, protective and other remedies are required to make these structures as
efficient as they used to be prior to the washaway.
Typical Bridge Typical Culvert
Photos by Study Team, November 2010
Photos 3-12 Track Conditions
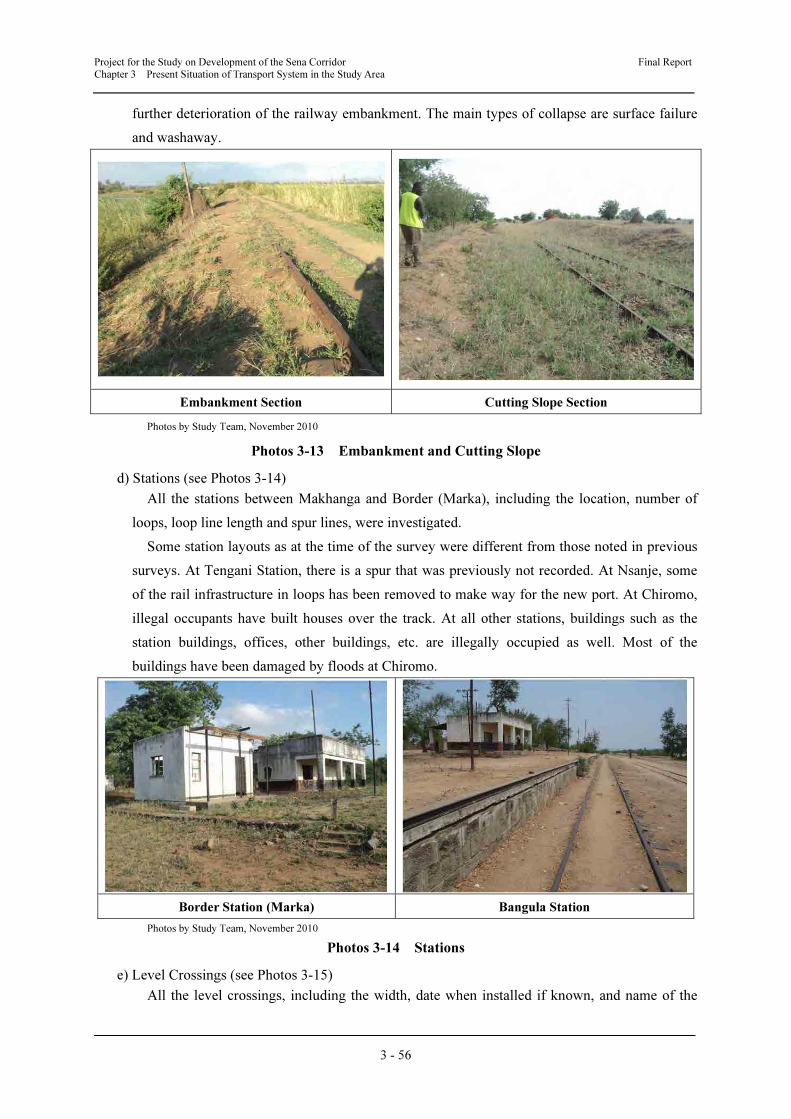
c) Embankment and Cutting Slopes (see Photos 3-13)
Most of the track between Makhanga and Border (Marka) is laid on either an embankment or
flat area. There are very few cutting slopes and they are low in height. In addition to the areas of
embankment failure or collapse identified in previous surveys, new places were found with
Project for the Study on Development of the Sena Corridor Final Report
Chapter 3 Present Situation of Transport System in the Study Area
3 - 56
further deterioration of the railway embankment. The main types of collapse are surface failure
and washaway.
Embankment Section Cutting Slope Section
Photos by Study Team, November 2010
Photos 3-13 Embankment and Cutting Slope
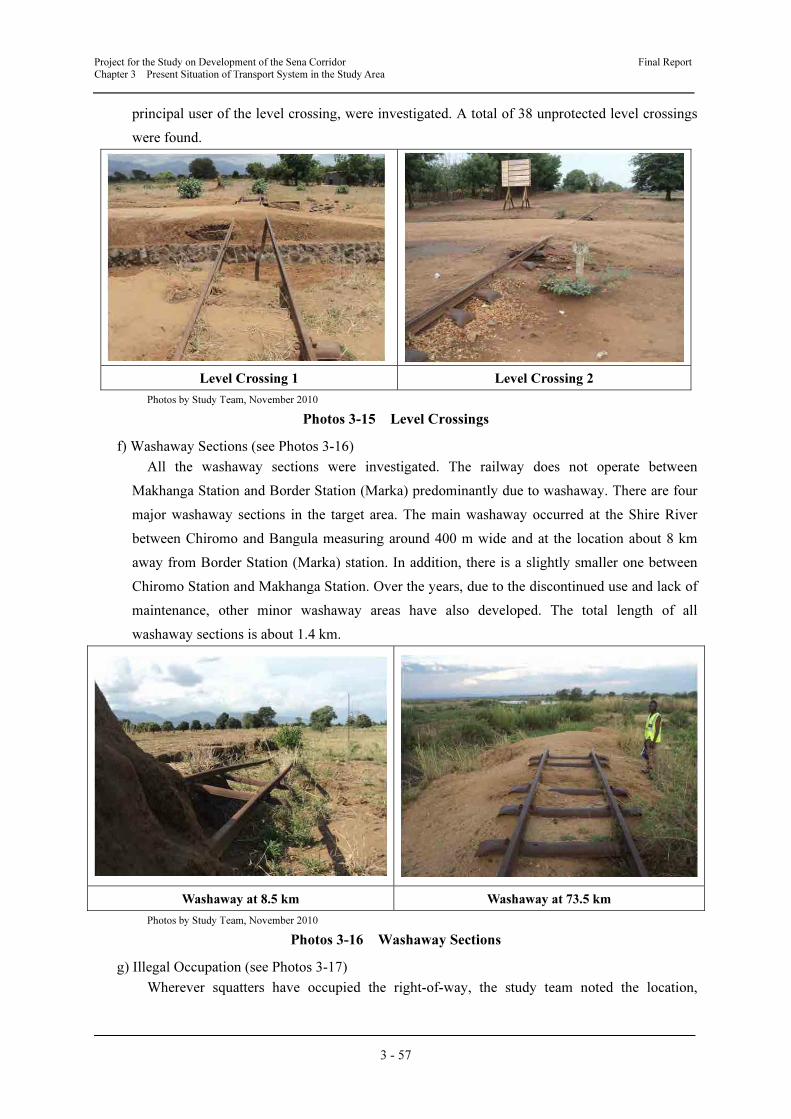
d) Stations (see Photos 3-14)
All the stations between Makhanga and Border (Marka), including the location, number of
loops, loop line length and spur lines, were investigated.
Some station layouts as at the time of the survey were different from those noted in previous
surveys. At Tengani Station, there is a spur that was previously not recorded. At Nsanje, some
of the rail infrastructure in loops has been removed to make way for the new port. At Chiromo,
illegal occupants have built houses over the track. At all other stations, buildings such as the
station buildings, offices, other buildings, etc. are illegally occupied as well. Most of the
buildings have been damaged by floods at Chiromo.
Border Station (Marka) Bangula Station
Photos by Study Team, November 2010
Photos 3-14 Stations
e) Level Crossings (see Photos 3-15)
All the level crossings, including the width, date when installed if known, and name of the
Project for the Study on Development of the Sena Corridor Final Report
Chapter 3 Present Situation of Transport System in the Study Area
3 - 57
principal user of the level crossing, were investigated. A total of 38 unprotected level crossings
were found.
Level Crossing 1 Level Crossing 2
Photos by Study Team, November 2010
Photos 3-15 Level Crossings
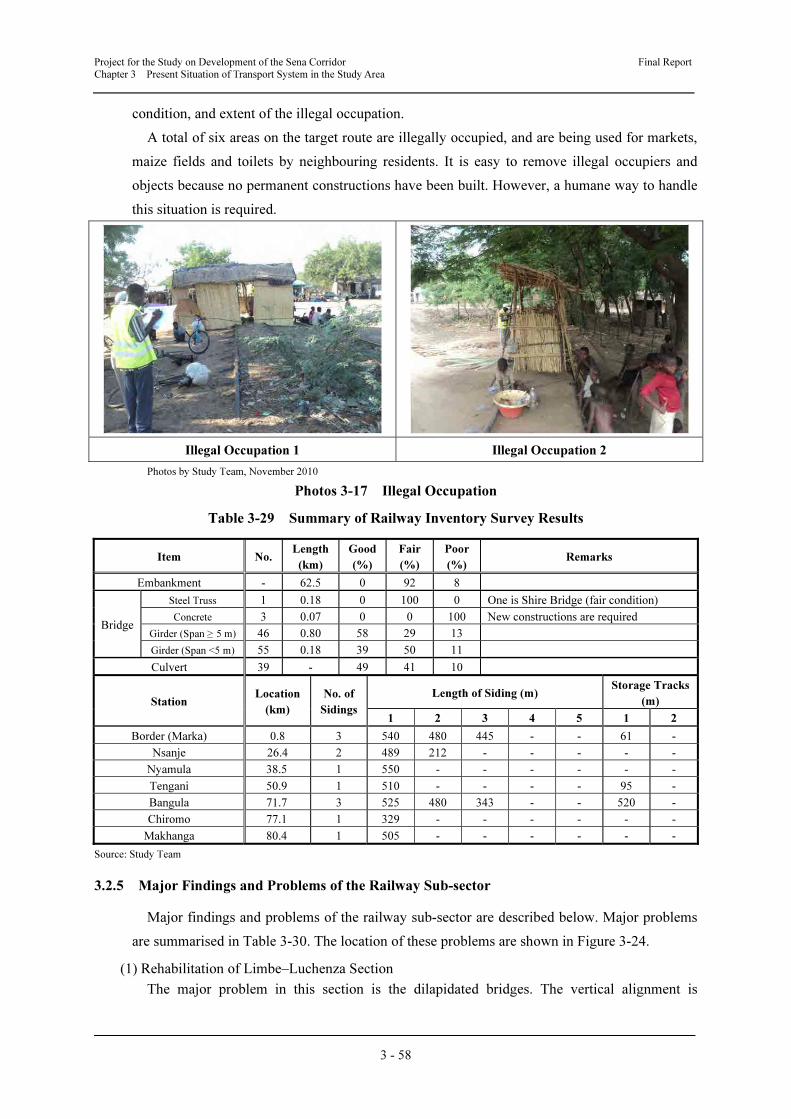
f) Washaway Sections (see Photos 3-16)
All the washaway sections were investigated. The railway does not operate between
Makhanga Station and Border Station (Marka) predominantly due to washaway. There are four
major washaway sections in the target area. The main washaway occurred at the Shire River
between Chiromo and Bangula measuring around 400 m wide and at the location about 8 km
away from Border Station (Marka) station. In addition, there is a slightly smaller one between
Chiromo Station and Makhanga Station. Over the years, due to the discontinued use and lack of
maintenance, other minor washaway areas have also developed. The total length of all
washaway sections is about 1.4 km.
Washaway at 8.5 km Washaway at 73.5 km
Photos by Study Team, November 2010
Photos 3-16 Washaway Sections
g) Illegal Occupation (see Photos 3-17)
Wherever squatters have occupied the right-of-way, the study team noted the location,
Project for the Study on Development of the Sena Corridor Final Report
Chapter 3 Present Situation of Transport System in the Study Area
3 - 58
condition, and extent of the illegal occupation.
A total of six areas on the target route are illegally occupied, and are being used for markets,
maize fields and toilets by neighbouring residents. It is easy to remove illegal occupiers and
objects because no permanent constructions have been built. However, a humane way to handle
this situation is required.
Illegal Occupation 1 Illegal Occupation 2
Photos by Study Team, November 2010
Photos 3-17 Illegal Occupation
Table 3-29 Summary of Railway Inventory Survey Results
Item No. Length
(km)
Good
(%)
Fair
(%)
Poor
(%) Remarks
Embankment - 62.5 0 92 8
Bridge
Steel Truss 1 0.18 0 100 0 One is Shire Bridge (fair condition)
Concrete 3 0.07 0 0 100 New constructions are required
Girder (Span ≥ 5 m) 46 0.80 58 29 13
Girder (Span <5 m) 55 0.18 39 50 11
Culvert 39 - 49 41 10
Station Location
(km)
No. of
Sidings
Length of Siding (m) Storage Tracks
(m)
1 2 3 4 5 1 2
Border (Marka) 0.8 3 540 480 445 - - 61 -
Nsanje 26.4 2 489 212 - - - - -
Nyamula 38.5 1 550 - - - - - -
Tengani 50.9 1 510 - - - - 95 -
Bangula 71.7 3 525 480 343 - - 520 -
Chiromo 77.1 1 329 - - - - - -
Makhanga 80.4 1 505 - - - - - -
Source: Study Team
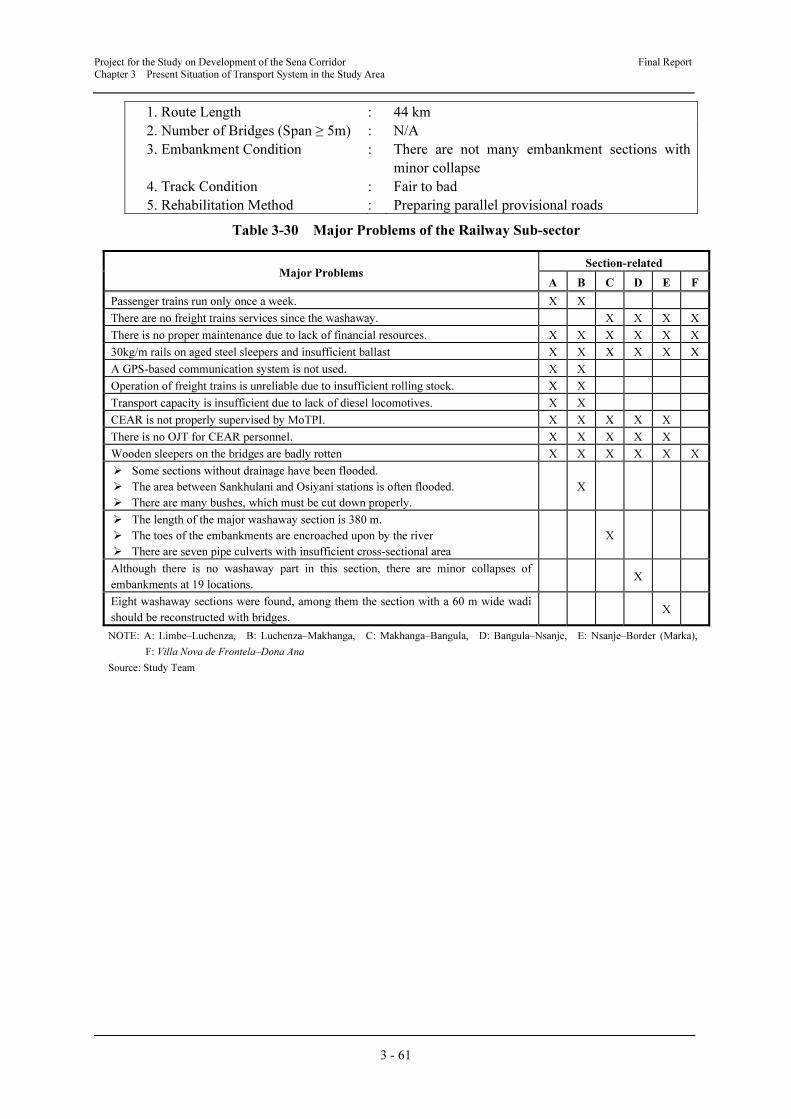
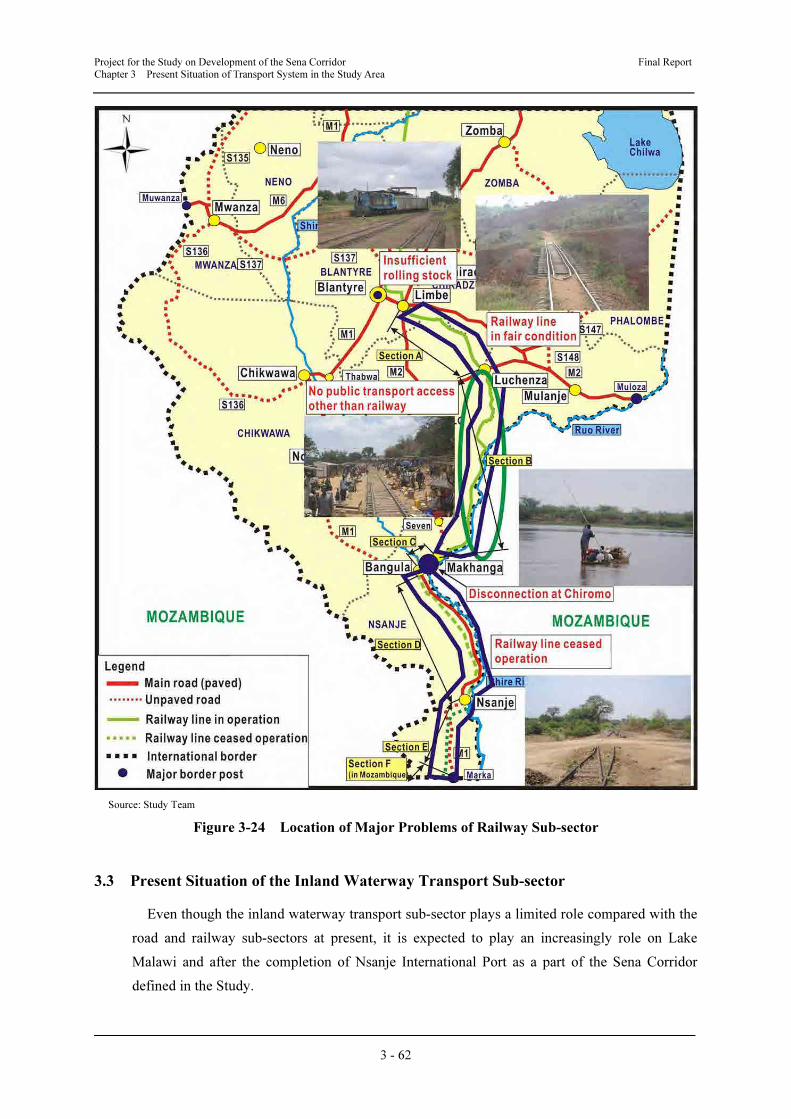
3.2.5 Major Findings and Problems of the Railway Sub-sector
Major findings and problems of the railway sub-sector are described below. Major problems
are summarised in Table 3-30. The location of these problems are shown in Figure 3-24.
(1) Rehabilitation of Limbe–Luchenza Section
The major problem in this section is the dilapidated bridges. The vertical alignment is

Project for the Study on Development of the Sena Corridor Final Report
Chapter 3 Present Situation of Transport System in the Study Area
3 - 59
steepest along the whole line. All steel bridges and tracks should be replaced. Provisional roads
for the rehabilitation works could be built.
1. Route Length : 44.0 km
2. Number of Bridges (Span ≥ 5m) : 16
3. Embankment Condition : No major embankment
4. Track Condition : Bad; must be replaced
5. Rehabilitation Method : Preparing parallel provisional roads
6. Major findings of the survey : - Wooden sleepers on the bridges are badly
rotten and must be replaced urgently.
- One bridge has been repaired with trough
girders; however, the piers do not seem to
have enough bearing capacity.
(2) Rehabilitation of Luchenza–Makhanga Section
The major problem in this section is the dilapidated bridges. The vertical alignment is
relatively steep, but the section between Makhanga and Sankhulani is flat. Half of the steel
bridges and tracks should be replaced. Provisional roads for the rehabilitation works cannot be
built.
1. Route Length : 76.6 km
2. Number of Bridges (Span ≥ 5m) : 24
3. Embankment Condition : The embankment has collapsed in parts.
4. Track Condition : Fair to bad
5. Rehabilitation Method : One-way construction method without provisional
road
6. Major findings of the survey : - Wooden sleepers on the bridges are badly
rotten and must be replaced urgently.
- Some sections without drainage have
flooded.
- The area between Sankhulani and Osiyani
stations is often flooded. The length of the
flooding area is 2.3 km from Km 86.7 to Km
89.0. This section must be improved by
constructing embankments or elevated
structures.
- There are many bushes, which must be cut
down properly.
(3) Reconstruction of Makhanga–Bangula Section
The major problem in this section is the disconnection by the washaway in 1997. There have
been some minor collapses on the 3 m high embankment. The alignment near Chiromo is very
close to the New Shire River. When the new Chiromo Bridge is constructed, it should be located
further from the river.
1. Route Length : 8.7 km
2. Number of Bridges (Span ≥ 5m) : 3
3. Embankment Condition : Minor landslides
4. Track Condition : Bad; must be replaced
5. Rehabilitation Method : Preparing parallel provisional roads
Project for the Study on Development of the Sena Corridor Final Report
Chapter 3 Present Situation of Transport System in the Study Area
3 - 60
6. Major findings of the survey
: - The length of the major washaway section is
380 m. It is not recommended to construct a
railway bridge on the existing alignment.
- The toes of the embankments are encroached
upon by the river at many sections.
- There are seven pipe culverts with insufficient
cross-sectional area to handle inundation.
(4) Reconstruction of Bangula–Nsanje Section
There are no major dilapidated structures. The vertical alignment is almost flat. Drainage is
insufficient. The embankment shoulder has collapsed in parts.
1. Route Length : 45.4 km
2. Number of Bridges (Span ≥ 5m) : 30
3. Embankment Condition : The shoulder has collapsed in parts, but the height
is only about 2 m.
4. Track Condition : Fair
5. Rehabilitation Method : Preparing parallel construction roads on the
adjacent cultivated land
6. Major findings of the survey : - Although there is no washaway part in this
section, there are minor collapses of
embankments at 19 locations.
- As almost all sections are installed parallel to
M1, the reconstruction work would be easy.
(5) Reconstruction of Nsanje–Border (Marka) Section
The major problem in this section is 60 m wide wadi at 4 km from the border. The vertical
alignment is almost flat. The track is thickly covered with trees. The embankment shoulder has
collapsed in parts. There are many trough girder bridges.
1. Route Length : 25.6 km
2. Number of Bridges (Span ≥ 5m) : 19
3. Embankment Condition : The shoulder has collapsed in parts, but the height
is only about 2 m.
4. Track Condition : Fair to bad
5. Rehabilitation Method : Preparing parallel construction roads
6. Major findings of the survey : - Eight washaway sections were found, the
longest of which is 260 m at Km 8.5. It must
be reconstructed by reinforced concrete (RC)
bridges or plate girders, and others by
embankments and culverts.
(6) Reconstruction of Villa Nova de Frontela-Dona Ana Section
The vertical alignment is almost flat. Some sections of track need rehabilitation due to
deformation of the rails, etc. However, a detailed survey has not been conducted by the Study
Team for this section, and so the rehabilitation cost will depend on whether bridges are
reconstructed and other conditions.
Project for the Study on Development of the Sena Corridor Final Report
Chapter 3 Present Situation of Transport System in the Study Area
3 - 61
1. Route Length : 44 km
2. Number of Bridges (Span ≥ 5m) : N/A
3. Embankment Condition : There are not many embankment sections with
minor collapse
4. Track Condition : Fair to bad
5. Rehabilitation Method : Preparing parallel provisional roads
Table 3-30 Major Problems of the Railway Sub-sector
Major Problems Section-related
A B C D E F
Passenger trains run only once a week. X X
There are no freight trains services since the washaway. X X X X
There is no proper maintenance due to lack of financial resources. X X X X X X
30kg/m rails on aged steel sleepers and insufficient ballast X X X X X X
A GPS-based communication system is not used. X X
Operation of freight trains is unreliable due to insufficient rolling stock. X X
Transport capacity is insufficient due to lack of diesel locomotives. X X
CEAR is not properly supervised by MoTPI. X X X X X
There is no OJT for CEAR personnel. X X X X X
Wooden sleepers on the bridges are badly rotten X X X X X X
� Some sections without drainage have been flooded.
� The area between Sankhulani and Osiyani stations is often flooded.
� There are many bushes, which must be cut down properly.
X
� The length of the major washaway section is 380 m.
� The toes of the embankments are encroached upon by the river
� There are seven pipe culverts with insufficient cross-sectional area
X
Although there is no washaway part in this section, there are minor collapses of
embankments at 19 locations. X
Eight washaway sections were found, among them the section with a 60 m wide wadi
should be reconstructed with bridges. X
NOTE: A: Limbe–Luchenza, B: Luchenza–Makhanga, C: Makhanga–Bangula, D: Bangula–Nsanje, E: Nsanje–Border (Marka),
F: Villa Nova de Frontela–Dona Ana
Source: Study Team
Project for the Study on Development of the Sena Corridor Final Report
Chapter 3 Present Situation of Transport System in the Study Area
3 - 62
Source: Study Team
Figure 3-24 Location of Major Problems of Railway Sub-sector
3.3 Present Situation of the Inland Waterway Transport Sub-sector
Even though the inland waterway transport sub-sector plays a limited role compared with the
road and railway sub-sectors at present, it is expected to play an increasingly role on Lake
Malawi and after the completion of Nsanje International Port as a part of the Sena Corridor
defined in the Study.
Project for the Study on Development of the Sena Corridor Final Report
Chapter 3 Present Situation of Transport System in the Study Area
3 - 63
3.3.1 Regulatory Body of the Inland Waterway Transport Sub-sector
The Marine Department under MoTPI is responsible for all matters relating to the inland
waterway transport sub-sector. The mandate of the Marine Department is prescribed in the
Inland Waters Shipping Act (1995), which provides a legal framework for the inland waterway
transport sub-sector. The responsibilities of the Marine Department are as follows:
• Registration, issuance of licences and securing the seaworthiness of all commercial vessels
• Supervision of management of all ports and harbours
• Supervision of the manning requirement of all vessels
3.3.2 Inland Waterway Transport on Lake Malawi
(1) Ports on Lake Malawi
The major ports on Lake Malawi are: Chipoka Port, Nkhata-Bay Port, Chilumba Port and
Monkey-Bay Port. Since Lake Malawi is an international lake also forming borders with
Mozambique and Tanzania, all these ports are used to handle domestic and international
passengers and cargoes. Table 3-31 summarises the major port facilities of Chipoka,
Nkhata-Bay and Chilumba Ports.
Table 3-31 Major Port Facilities of the Ports on Lake Malawi
Port Facility Dimensions/Area Condition
Chipoka Port Concrete block quay 150 m × 40 m Good condition
Steel sheet jetty 50 m × 50 m Not in use, acts as a breakwater
Port administration/customs office 65 m² Good condition
Goods shed 820 m² Good condition
Passenger waiting hall 260 m² Good condition
Nkhata-Bay Port Unifloat jetty with Bailey bridge n.a. Moderate condition
Port administration/customs office 40 m² Good condition
General cargo shed 385 m² Good condition
General cargo shed 275 m² Good condition
Passenger waiting shed 80 m² Good condition
Chilumba Port Concrete block quay 100 m × 25 m Good condition
Fixed concrete quay 70 m × 15 m Good condition
Port administration/customs offices 108 m² Good condition
Cargo shed 875 m² Good condition
Passenger waiting building 195 m² Good condition
Source: Final Report, EU Multimodal Transport Study, November 2010
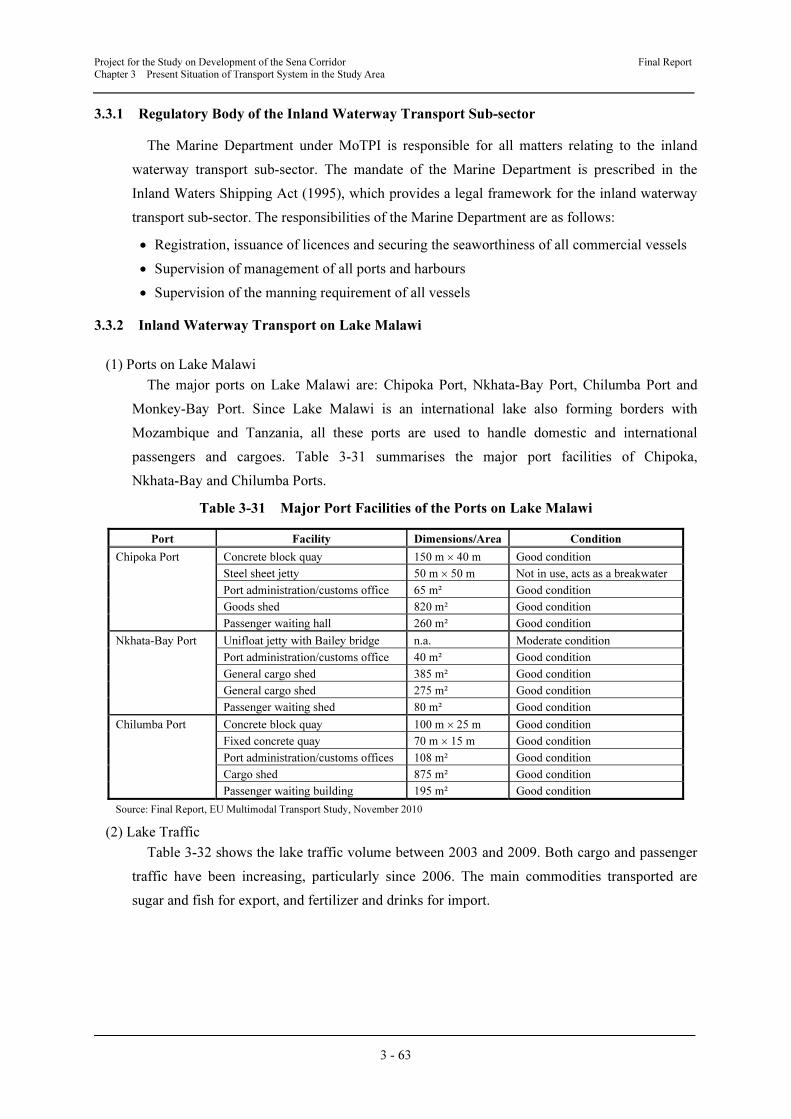
(2) Lake Traffic
Table 3-32 shows the lake traffic volume between 2003 and 2009. Both cargo and passenger
traffic have been increasing, particularly since 2006. The main commodities transported are
sugar and fish for export, and fertilizer and drinks for import.
Project for the Study on Development of the Sena Corridor Final Report
Chapter 3 Present Situation of Transport System in the Study Area
3 - 64
Table 3-32 Lake Traffic Volume
Year Cargo Volume (tonne) No. of Passengers
2003 6,690 66,902
2004 4,179 66,008
2005 14,380 62,037
2006 17,885 58,656
2007 21,214 68,309
2008 22,496 72,095
2009 23,140 71,545
Source: Final Report, EU Multimodal Transport Study, November 2010
3.3.3 Nsanje International Port
The first phase of the Nsanje port development programme was completed in October 2010.
The port facility of Nsanje International Port is a quay 200 m long, and can handle three barges
(each 64 m long) with capacity for handling 48 20-ft containers. The second phase of the
programme consists of constructing a storage area (9,000 m2) to store 230 containers.
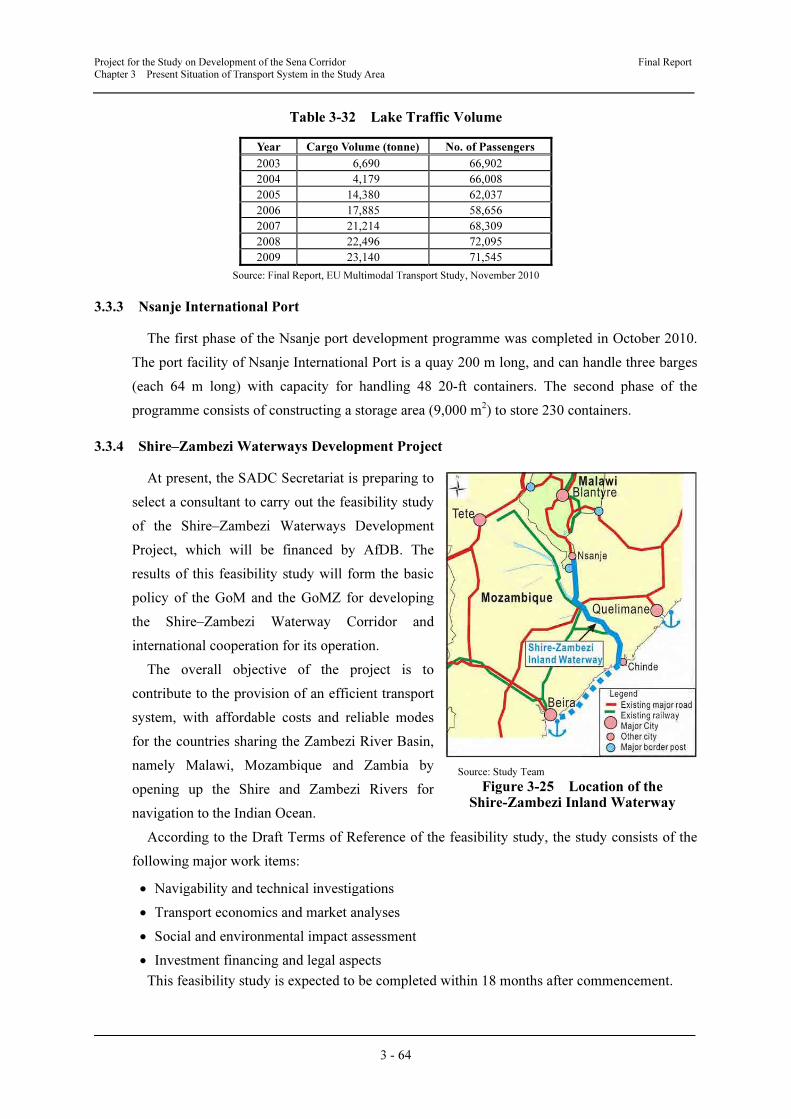
3.3.4 Shire–Zambezi Waterways Development Project
At present, the SADC Secretariat is preparing to
select a consultant to carry out the feasibility study
of the Shire–Zambezi Waterways Development
Project, which will be financed by AfDB. The
results of this feasibility study will form the basic
policy of the GoM and the GoMZ for developing
the Shire–Zambezi Waterway Corridor and
international cooperation for its operation.
The overall objective of the project is to
contribute to the provision of an efficient transport
system, with affordable costs and reliable modes
for the countries sharing the Zambezi River Basin,
namely Malawi, Mozambique and Zambia by
opening up the Shire and Zambezi Rivers for
navigation to the Indian Ocean.
According to the Draft Terms of Reference of the feasibility study, the study consists of the
following major work items:
• Navigability and technical investigations
• Transport economics and market analyses
• Social and environmental impact assessment
• Investment financing and legal aspects
This feasibility study is expected to be completed within 18 months after commencement.
Source: Study Team
Figure 3-25 Location of the Shire-Zambezi Inland Waterway
Project for the Study on Development of the Sena Corridor Final Report
Chapter 3 Present Situation of Transport System in the Study Area
3 - 65
3.4 Transport Corridor Development in Neighbouring Countries
3.4.1 Present Status of Beira, Durban, Nacala and Other Corridors
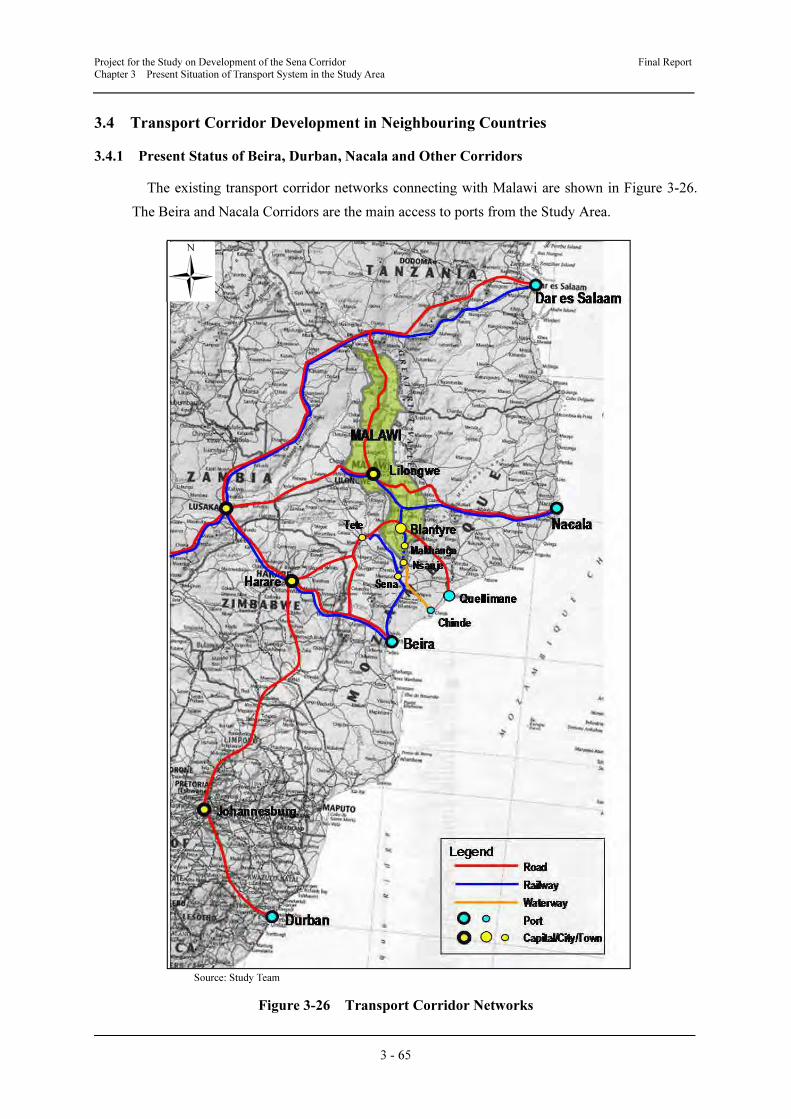
The existing transport corridor networks connecting with Malawi are shown in Figure 3-26.
The Beira and Nacala Corridors are the main access to ports from the Study Area.
Source: Study Team
Figure 3-26 Transport Corridor Networks

Project for the Study on Development of the Sena Corridor Final Report
Chapter 3 Present Situation of Transport System in the Study Area
3 - 66
(1) Beira Corridor
Figure 3-27 shows location of the Beira Corridor.
Source: Study Team
Figure 3-27 Location of Beira Corridor
Project for the Study on Development of the Sena Corridor Final Report
Chapter 3 Present Situation of Transport System in the Study Area
3 - 67
a) Port
Beira Port is the hub of the Beira Corridor, which was constructed by the Portuguese in 1890.
Before the economic crises, Zimbabwe was the main customer of Beira Port. However, after the
economic crises in Zimbabwe, cargoes related to Zimbabwe were drastically decreased and
Malawi has become the main customer. Because of the limited draft of the main approach
channel, size of vessels call Beira Port were limited and only feeder services mainly transhipped
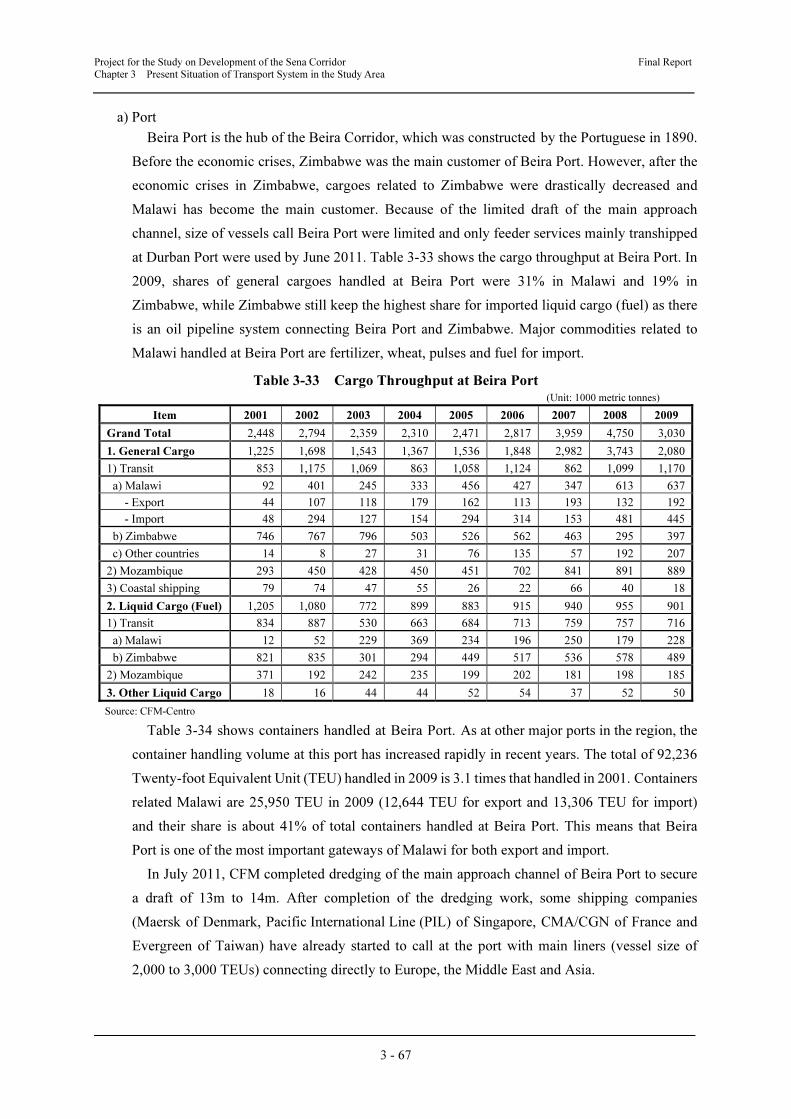
at Durban Port were used by June 2011. Table 3-33 shows the cargo throughput at Beira Port. In
2009, shares of general cargoes handled at Beira Port were 31% in Malawi and 19% in
Zimbabwe, while Zimbabwe still keep the highest share for imported liquid cargo (fuel) as there
is an oil pipeline system connecting Beira Port and Zimbabwe. Major commodities related to
Malawi handled at Beira Port are fertilizer, wheat, pulses and fuel for import.
Table 3-33 Cargo Throughput at Beira Port (Unit: 1000 metric tonnes)
Item 2001 2002 2003 2004 2005 2006 2007 2008 2009
Grand Total 2,448 2,794 2,359 2,310 2,471 2,817 3,959 4,750 3,030
1. General Cargo 1,225 1,698 1,543 1,367 1,536 1,848 2,982 3,743 2,080
1) Transit 853 1,175 1,069 863 1,058 1,124 862 1,099 1,170
a) Malawi 92 401 245 333 456 427 347 613 637
- Export 44 107 118 179 162 113 193 132 192
- Import 48 294 127 154 294 314 153 481 445
b) Zimbabwe 746 767 796 503 526 562 463 295 397
c) Other countries 14 8 27 31 76 135 57 192 207
2) Mozambique 293 450 428 450 451 702 841 891 889
3) Coastal shipping 79 74 47 55 26 22 66 40 18
2. Liquid Cargo (Fuel) 1,205 1,080 772 899 883 915 940 955 901
1) Transit 834 887 530 663 684 713 759 757 716
a) Malawi 12 52 229 369 234 196 250 179 228
b) Zimbabwe 821 835 301 294 449 517 536 578 489
2) Mozambique 371 192 242 235 199 202 181 198 185
3. Other Liquid Cargo 18 16 44 44 52 54 37 52 50
Source: CFM-Centro
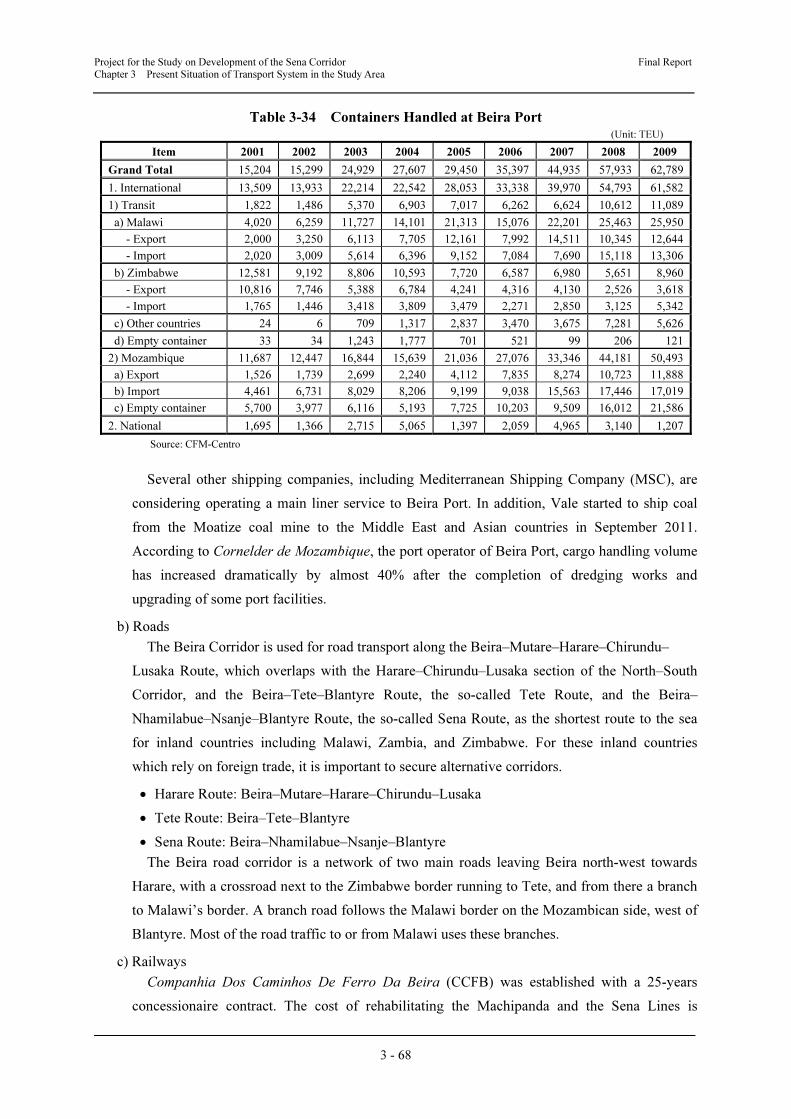
Table 3-34 shows containers handled at Beira Port. As at other major ports in the region, the
container handling volume at this port has increased rapidly in recent years. The total of 92,236
Twenty-foot Equivalent Unit (TEU) handled in 2009 is 3.1 times that handled in 2001. Containers
related Malawi are 25,950 TEU in 2009 (12,644 TEU for export and 13,306 TEU for import)
and their share is about 41% of total containers handled at Beira Port. This means that Beira
Port is one of the most important gateways of Malawi for both export and import.
In July 2011, CFM completed dredging of the main approach channel of Beira Port to secure
a draft of 13m to 14m. After completion of the dredging work, some shipping companies
(Maersk of Denmark, Pacific International Line (PIL) of Singapore, CMA/CGN of France and
Evergreen of Taiwan) have already started to call at the port with main liners (vessel size of
2,000 to 3,000 TEUs) connecting directly to Europe, the Middle East and Asia.
Project for the Study on Development of the Sena Corridor Final Report
Chapter 3 Present Situation of Transport System in the Study Area
3 - 68
Table 3-34 Containers Handled at Beira Port (Unit: TEU)
Item 2001 2002 2003 2004 2005 2006 2007 2008 2009
Grand Total 15,204 15,299 24,929 27,607 29,450 35,397 44,935 57,933 62,789
1. International 13,509 13,933 22,214 22,542 28,053 33,338 39,970 54,793 61,582
1) Transit 1,822 1,486 5,370 6,903 7,017 6,262 6,624 10,612 11,089
a) Malawi 4,020 6,259 11,727 14,101 21,313 15,076 22,201 25,463 25,950
- Export 2,000 3,250 6,113 7,705 12,161 7,992 14,511 10,345 12,644
- Import 2,020 3,009 5,614 6,396 9,152 7,084 7,690 15,118 13,306
b) Zimbabwe 12,581 9,192 8,806 10,593 7,720 6,587 6,980 5,651 8,960
- Export 10,816 7,746 5,388 6,784 4,241 4,316 4,130 2,526 3,618
- Import 1,765 1,446 3,418 3,809 3,479 2,271 2,850 3,125 5,342
c) Other countries 24 6 709 1,317 2,837 3,470 3,675 7,281 5,626
d) Empty container 33 34 1,243 1,777 701 521 99 206 121
2) Mozambique 11,687 12,447 16,844 15,639 21,036 27,076 33,346 44,181 50,493
a) Export 1,526 1,739 2,699 2,240 4,112 7,835 8,274 10,723 11,888
b) Import 4,461 6,731 8,029 8,206 9,199 9,038 15,563 17,446 17,019
c) Empty container 5,700 3,977 6,116 5,193 7,725 10,203 9,509 16,012 21,586
2. National 1,695 1,366 2,715 5,065 1,397 2,059 4,965 3,140 1,207
Source: CFM-Centro
Several other shipping companies, including Mediterranean Shipping Company (MSC), are
considering operating a main liner service to Beira Port. In addition, Vale started to ship coal
from the Moatize coal mine to the Middle East and Asian countries in September 2011.
According to Cornelder de Mozambique, the port operator of Beira Port, cargo handling volume
has increased dramatically by almost 40% after the completion of dredging works and
upgrading of some port facilities.
b) Roads
The Beira Corridor is used for road transport along the Beira–Mutare–Harare–Chirundu–
Lusaka Route, which overlaps with the Harare–Chirundu–Lusaka section of the North–South
Corridor, and the Beira–Tete–Blantyre Route, the so-called Tete Route, and the Beira–
Nhamilabue–Nsanje–Blantyre Route, the so-called Sena Route, as the shortest route to the sea
for inland countries including Malawi, Zambia, and Zimbabwe. For these inland countries
which rely on foreign trade, it is important to secure alternative corridors.
• Harare Route: Beira–Mutare–Harare–Chirundu–Lusaka
• Tete Route: Beira–Tete–Blantyre
• Sena Route: Beira–Nhamilabue–Nsanje–Blantyre
The Beira road corridor is a network of two main roads leaving Beira north-west towards
Harare, with a crossroad next to the Zimbabwe border running to Tete, and from there a branch
to Malawi’s border. A branch road follows the Malawi border on the Mozambican side, west of
Blantyre. Most of the road traffic to or from Malawi uses these branches.
c) Railways
Companhia Dos Caminhos De Ferro Da Beira (CCFB) was established with a 25-years
concessionaire contract. The cost of rehabilitating the Machipanda and the Sena Lines is

Project for the Study on Development of the Sena Corridor Final Report
Chapter 3 Present Situation of Transport System in the Study Area
3 - 69
US$230 million, financed by the International Development Association (IDA) of WB and the
European Investment Bank (EIB). The Beira Railway system comprises two railway lines:
• Machipanda Line (Beira Railway): 317 km linking Beira Port to the railway network in
Zimbabwe (along the Beira Corridor).
• Sena Line: 600 km linking Beira Port to the Moatize coal mines via Inhamitanga, Caija and
Vila de Sena.
The Sena Line separates from the Machipanda Line at Dondo (a station about 28 km from
Beira) and goes northward, crossing the Zambezi River between Vila de Sena and Dona Ana
(298 km from Dondo). The line again diverges at Dona Ana, from where a 254 km line runs on
the north bank of the Zambezi River to Moatize and a 44-km branch line extends northward to
Vila Nova de Frontela near the Malawi border.
However, the GoMZ was not satisfied with the management of CCFB and the results of
rehabilitation works, and has already decided to terminate the concession contract with CCFB.
After the termination, CFM Centro will take over the management and operation of the Beira
Railway system. However, even after the completion of rehabilitation of the Sena Line, its
transport capacity will be limited to 6 million tonnes per year (5 million tonnes for Vale’s coal
transportation and 1 million tonnes for other coal companies and general cargoes), mainly due
to the limited axle load of trains and insufficient facilities (such as loops and stations). Vale
started to transport coal from the Moatize coal mine to Beira Port in August 2011 using their
own locomotives and wagons, while another coal mining company, Riversdale, has already
brought their own locomotives to the Beira Station yard. Hence, CFM plans to upgrade the Sena
Line with 12 to 18 million tonnes of transport capacity and is going to carry out the F/S soon.
d) Issues and Bottlenecks
1) Port
The biggest problem of Beira Port, which was the limited draft of the approach channel, has
already been solved by the completion of dredging works in July 2011. CFM has already started
continuous maintenance dredging works of the approach channel. Moreover, some projects for
expanding and upgrading the port facility in line with future demand, such as the construction of
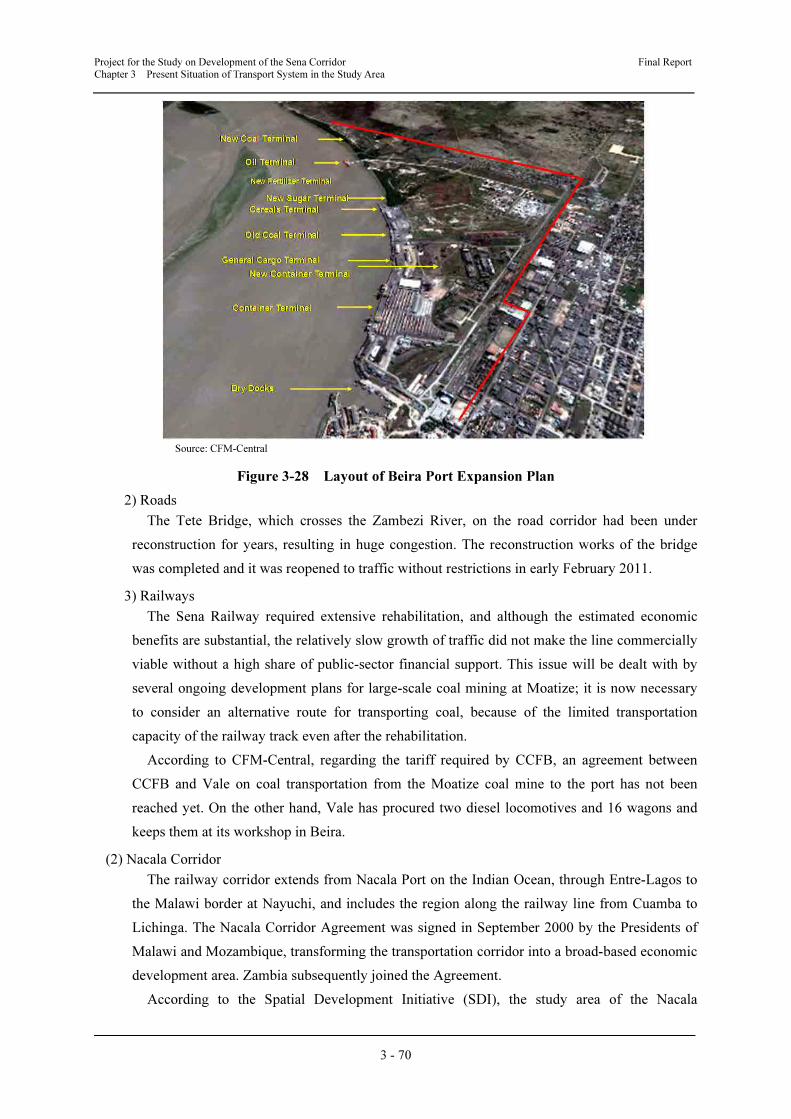
a new coal terminal and expansion of the container terminal, are ongoing. The layout map of the
expansion plan for Beira Port is shown in Figure 3-28.
One of the issues in Beira Port after the completion of improvement works is congestion in
the port area and traffic congestion around the port. Many activities, such as sacking bulk
cargoes and placing/displacing cargoes to/from containers, are carried out on the quay side or in
nearby warehouses, while trailers carrying cargoes are concentrated on one approach road to the
port. This problem may cause a bottleneck for port operations as cargo handling at Beira Port
rapidly increases.
Project for the Study on Development of the Sena Corridor Final Report
Chapter 3 Present Situation of Transport System in the Study Area
3 - 70
Source: CFM-Central
Figure 3-28 Layout of Beira Port Expansion Plan
2) Roads
The Tete Bridge, which crosses the Zambezi River, on the road corridor had been under
reconstruction for years, resulting in huge congestion. The reconstruction works of the bridge
was completed and it was reopened to traffic without restrictions in early February 2011.
3) Railways
The Sena Railway required extensive rehabilitation, and although the estimated economic
benefits are substantial, the relatively slow growth of traffic did not make the line commercially
viable without a high share of public-sector financial support. This issue will be dealt with by
several ongoing development plans for large-scale coal mining at Moatize; it is now necessary
to consider an alternative route for transporting coal, because of the limited transportation
capacity of the railway track even after the rehabilitation.
According to CFM-Central, regarding the tariff required by CCFB, an agreement between
CCFB and Vale on coal transportation from the Moatize coal mine to the port has not been
reached yet. On the other hand, Vale has procured two diesel locomotives and 16 wagons and
keeps them at its workshop in Beira.
(2) Nacala Corridor
The railway corridor extends from Nacala Port on the Indian Ocean, through Entre-Lagos to
the Malawi border at Nayuchi, and includes the region along the railway line from Cuamba to
Lichinga. The Nacala Corridor Agreement was signed in September 2000 by the Presidents of
Malawi and Mozambique, transforming the transportation corridor into a broad-based economic
development area. Zambia subsequently joined the Agreement.
According to the Spatial Development Initiative (SDI), the study area of the Nacala
Project for the Study on Development of the Sena Corridor Final Report
Chapter 3 Present Situation of Transport System in the Study Area
3 - 71
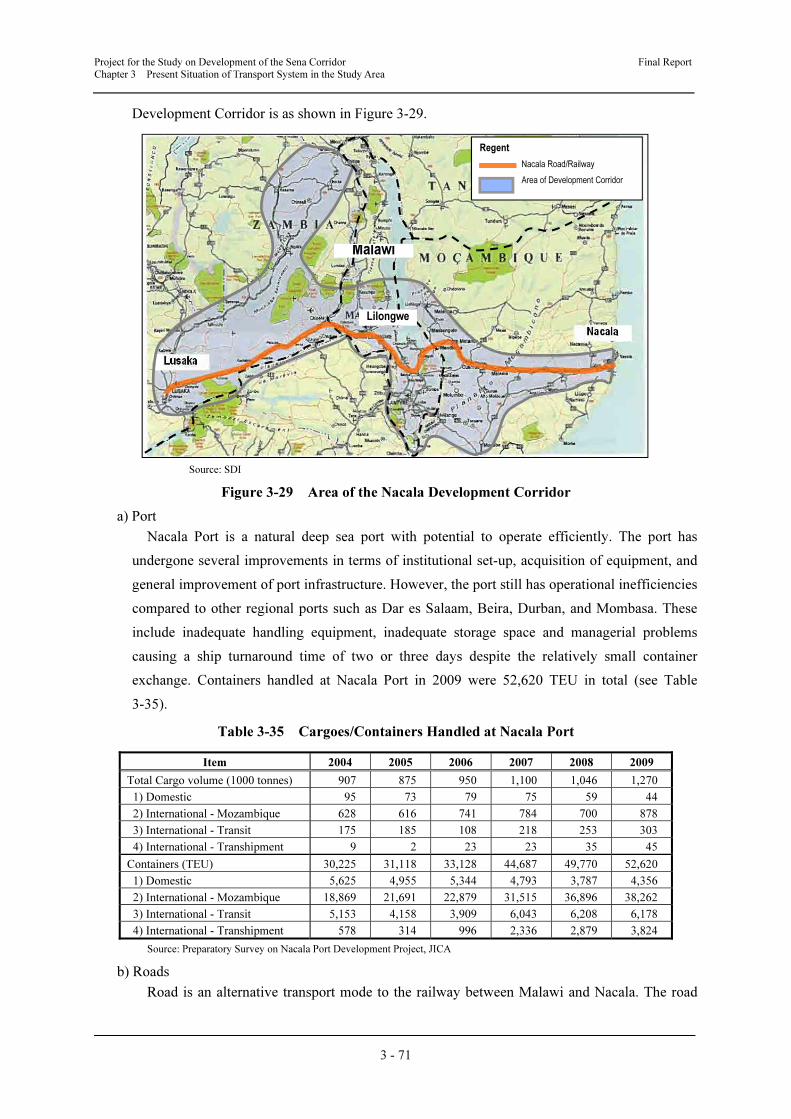
Development Corridor is as shown in Figure 3-29.
Source: SDI
Figure 3-29 Area of the Nacala Development Corridor
a) Port
Nacala Port is a natural deep sea port with potential to operate efficiently. The port has
undergone several improvements in terms of institutional set-up, acquisition of equipment, and
general improvement of port infrastructure. However, the port still has operational inefficiencies
compared to other regional ports such as Dar es Salaam, Beira, Durban, and Mombasa. These
include inadequate handling equipment, inadequate storage space and managerial problems
causing a ship turnaround time of two or three days despite the relatively small container
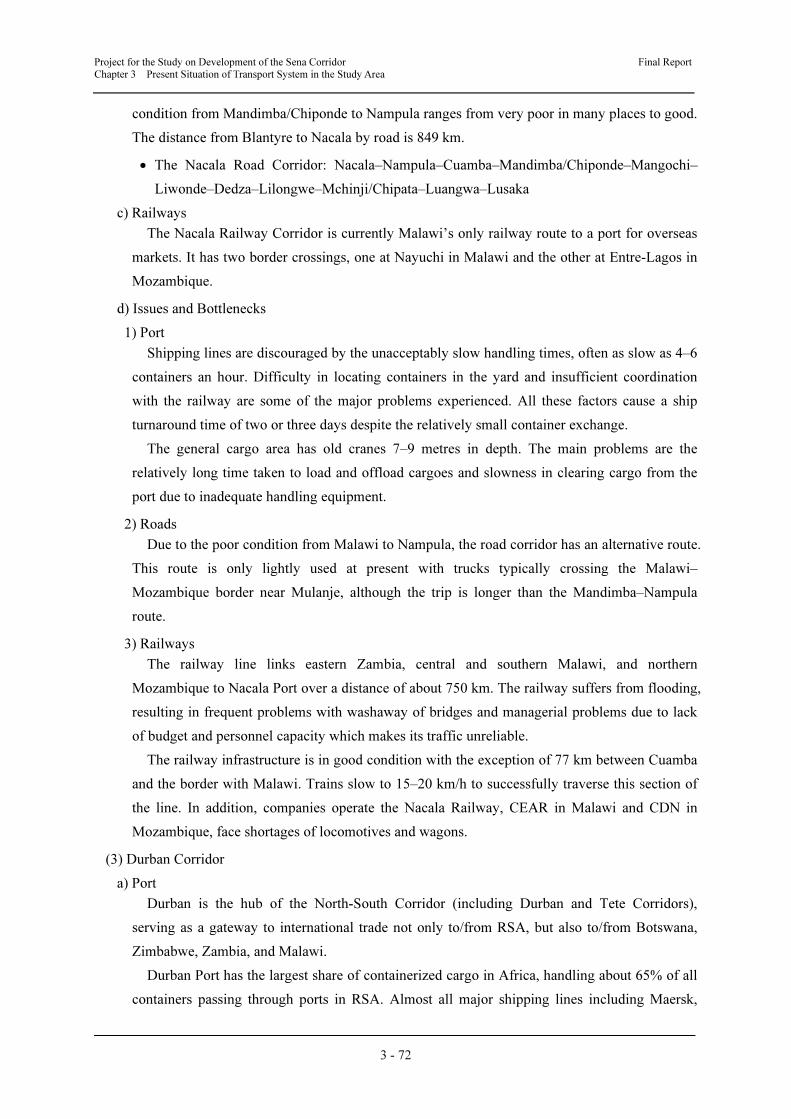
exchange. Containers handled at Nacala Port in 2009 were 52,620 TEU in total (see Table
3-35).
Table 3-35 Cargoes/Containers Handled at Nacala Port
Item 2004 2005 2006 2007 2008 2009
Total Cargo volume (1000 tonnes) 907 875 950 1,100 1,046 1,270
1) Domestic 95 73 79 75 59 44
2) International - Mozambique 628 616 741 784 700 878
3) International - Transit 175 185 108 218 253 303
4) International - Transhipment 9 2 23 23 35 45
Containers (TEU) 30,225 31,118 33,128 44,687 49,770 52,620
1) Domestic 5,625 4,955 5,344 4,793 3,787 4,356
2) International - Mozambique 18,869 21,691 22,879 31,515 36,896 38,262
3) International - Transit 5,153 4,158 3,909 6,043 6,208 6,178
4) International - Transhipment 578 314 996 2,336 2,879 3,824
Source: Preparatory Survey on Nacala Port Development Project, JICA
b) Roads
Road is an alternative transport mode to the railway between Malawi and Nacala. The road
Lusaka
Nacala
Malawi
Lilongwe
Regent
Nacala Road/Railway
Area of Development Corridor
Project for the Study on Development of the Sena Corridor Final Report
Chapter 3 Present Situation of Transport System in the Study Area
3 - 72
condition from Mandimba/Chiponde to Nampula ranges from very poor in many places to good.
The distance from Blantyre to Nacala by road is 849 km.
• The Nacala Road Corridor: Nacala–Nampula–Cuamba–Mandimba/Chiponde–Mangochi–
Liwonde–Dedza–Lilongwe–Mchinji/Chipata–Luangwa–Lusaka
c) Railways
The Nacala Railway Corridor is currently Malawi’s only railway route to a port for overseas
markets. It has two border crossings, one at Nayuchi in Malawi and the other at Entre-Lagos in
Mozambique.
d) Issues and Bottlenecks
1) Port
Shipping lines are discouraged by the unacceptably slow handling times, often as slow as 4–6
containers an hour. Difficulty in locating containers in the yard and insufficient coordination
with the railway are some of the major problems experienced. All these factors cause a ship
turnaround time of two or three days despite the relatively small container exchange.
The general cargo area has old cranes 7–9 metres in depth. The main problems are the
relatively long time taken to load and offload cargoes and slowness in clearing cargo from the
port due to inadequate handling equipment.
2) Roads
Due to the poor condition from Malawi to Nampula, the road corridor has an alternative route.
This route is only lightly used at present with trucks typically crossing the Malawi–
Mozambique border near Mulanje, although the trip is longer than the Mandimba–Nampula
route.
3) Railways
The railway line links eastern Zambia, central and southern Malawi, and northern
Mozambique to Nacala Port over a distance of about 750 km. The railway suffers from flooding,
resulting in frequent problems with washaway of bridges and managerial problems due to lack
of budget and personnel capacity which makes its traffic unreliable.
The railway infrastructure is in good condition with the exception of 77 km between Cuamba
and the border with Malawi. Trains slow to 15–20 km/h to successfully traverse this section of
the line. In addition, companies operate the Nacala Railway, CEAR in Malawi and CDN in
Mozambique, face shortages of locomotives and wagons.
(3) Durban Corridor
a) Port
Durban is the hub of the North-South Corridor (including Durban and Tete Corridors),
serving as a gateway to international trade not only to/from RSA, but also to/from Botswana,
Zimbabwe, Zambia, and Malawi.
Durban Port has the largest share of containerized cargo in Africa, handling about 65% of all
containers passing through ports in RSA. Almost all major shipping lines including Maersk,
Project for the Study on Development of the Sena Corridor Final Report
Chapter 3 Present Situation of Transport System in the Study Area
3 - 73
MSC, OOCL, COSCO, EMC, PIL, NYK, Mitsui OSK, and K Line, make calls at this port,
many of which use transhipment via feeder services from the Port of Cape Town.
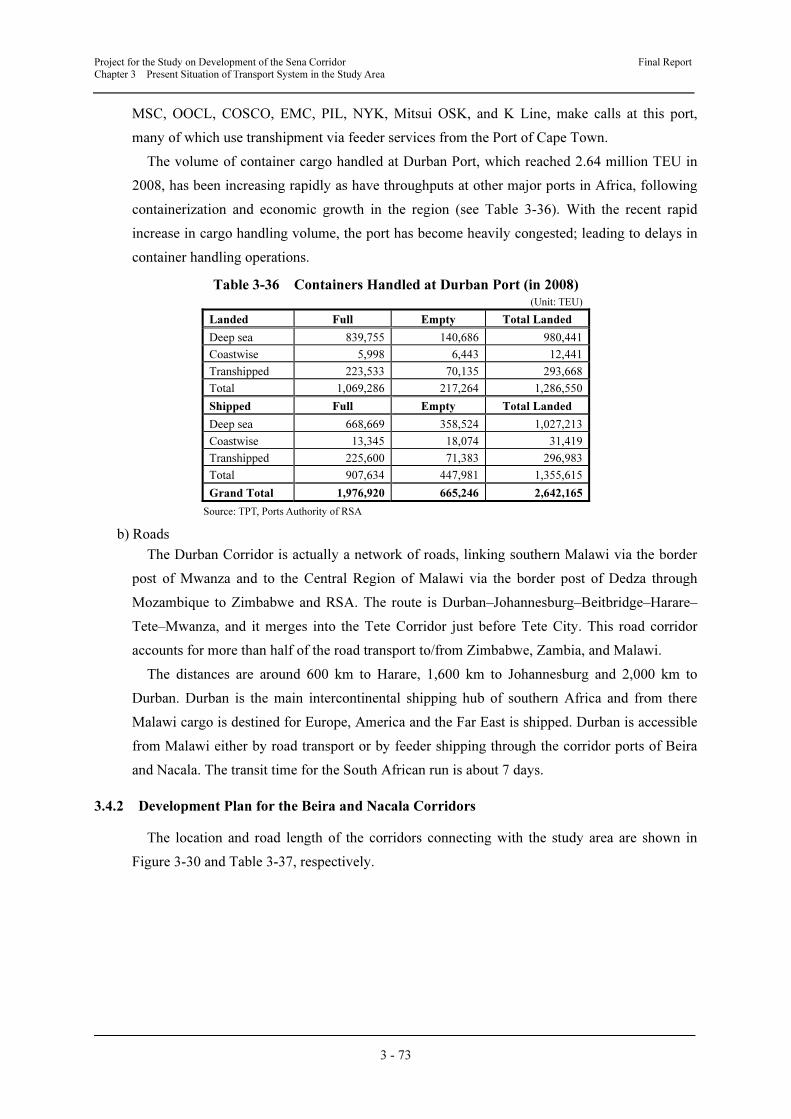
The volume of container cargo handled at Durban Port, which reached 2.64 million TEU in
2008, has been increasing rapidly as have throughputs at other major ports in Africa, following
containerization and economic growth in the region (see Table 3-36). With the recent rapid
increase in cargo handling volume, the port has become heavily congested; leading to delays in
container handling operations.
Table 3-36 Containers Handled at Durban Port (in 2008) (Unit: TEU)
Landed Full Empty Total Landed
Deep sea 839,755 140,686 980,441
Coastwise 5,998 6,443 12,441
Transhipped 223,533 70,135 293,668
Total 1,069,286 217,264 1,286,550
Shipped Full Empty Total Landed
Deep sea 668,669 358,524 1,027,213
Coastwise 13,345 18,074 31,419
Transhipped 225,600 71,383 296,983
Total 907,634 447,981 1,355,615
Grand Total 1,976,920 665,246 2,642,165
Source: TPT, Ports Authority of RSA
b) Roads
The Durban Corridor is actually a network of roads, linking southern Malawi via the border
post of Mwanza and to the Central Region of Malawi via the border post of Dedza through
Mozambique to Zimbabwe and RSA. The route is Durban–Johannesburg–Beitbridge–Harare–
Tete–Mwanza, and it merges into the Tete Corridor just before Tete City. This road corridor
accounts for more than half of the road transport to/from Zimbabwe, Zambia, and Malawi.
The distances are around 600 km to Harare, 1,600 km to Johannesburg and 2,000 km to
Durban. Durban is the main intercontinental shipping hub of southern Africa and from there
Malawi cargo is destined for Europe, America and the Far East is shipped. Durban is accessible
from Malawi either by road transport or by feeder shipping through the corridor ports of Beira
and Nacala. The transit time for the South African run is about 7 days.
3.4.2 Development Plan for the Beira and Nacala Corridors
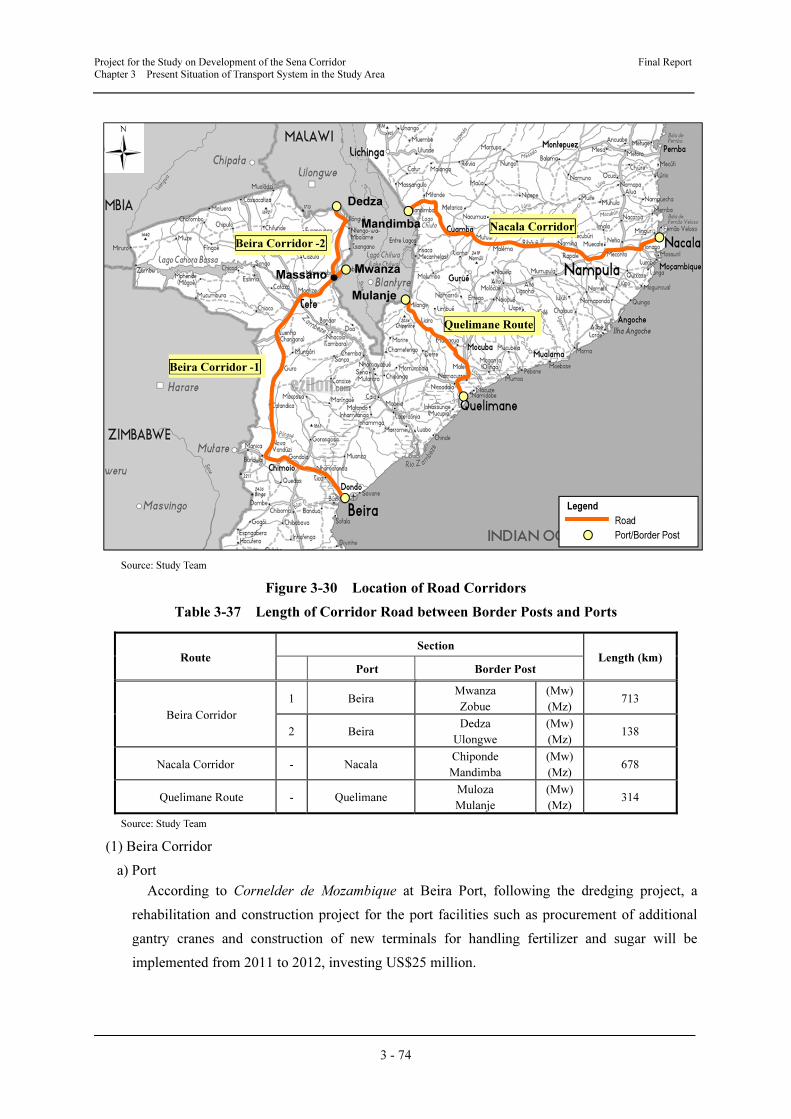
The location and road length of the corridors connecting with the study area are shown in
Figure 3-30 and Table 3-37, respectively.
Project for the Study on Development of the Sena Corridor Final Report
Chapter 3 Present Situation of Transport System in the Study Area
3 - 74
Source: Study Team
Figure 3-30 Location of Road Corridors
Table 3-37 Length of Corridor Road between Border Posts and Ports
Route Section
Length (km) Port Border Post
Beira Corridor
1 Beira Mwanza
Zobue
(Mw)
(Mz) 713
2 Beira Dedza
Ulongwe
(Mw)
(Mz) 138
Nacala Corridor - Nacala Chiponde
Mandimba
(Mw)
(Mz) 678
Quelimane Route - Quelimane Muloza
Mulanje
(Mw)
(Mz) 314
Source: Study Team
(1) Beira Corridor
a) Port
According to Cornelder de Mozambique at Beira Port, following the dredging project, a
rehabilitation and construction project for the port facilities such as procurement of additional
gantry cranes and construction of new terminals for handling fertilizer and sugar will be
implemented from 2011 to 2012, investing US$25 million.
Quelimane Route
Beira Corridor -1
Beira Corridor -2
Nacala Corridor
Dedza
Mwanza
Mulanje
Mandimba
Massano
Legend
Road
Port/Border Post

Project for the Study on Development of the Sena Corridor Final Report
Chapter 3 Present Situation of Transport System in the Study Area
3 - 75
b) Roads
1) Tete Route
According to Administracao Nacional
de Estradas (ANE: National Road
Administration) of Mozambique,
construction of the New Tete Bridge
(1,500 m) has already commenced and
will take 36 months to complete by 2013
(see Figure 3-31). When the New Tete
Bridge is completed, it will be possible to
bypass Tete City to avoid congestion in
the city centre. After completion of the
New Tete Bridge, the GoMZ will sign a
concession contract with Mota-Engil
Engenharia e Construcao SA for
operation and maintenance of the road section to Mwanza, Dedza, and border posts with
Zimbabwe.
2) Sena Route
The Sena Road route defined in the Study in Mozambique is partly composed of the National
Highway N1 (primary road), N322 (Mutarara road: secondary road), and N300 (secondary road).
These roads pass through the Mutarara District of Tete Province (see Figure 3-32).
ANE has no plan to improve the road section between Vila Nova de Frontela (border with
Malawi) and the junction where N322 connects with N1, including N300 because of the missing
bridge linkage over the Shire River on N322. ANE also has no intention of constructing a road
bridge across the Zambezi River connecting Vila de Sena and Dona Ana.
c) Railways
1) Sena Line (Dondo to Moatize)
The Moatize coal mine will start operations in July 2011. The transportation demand is
estimated at 12 million tonnes after completion of the Moatize Phase II Project. Although the
transportation capacity of the Sena Line is 1.2 million tonnes per year, it could be expanded to
5–6 million tonnes after completion of the rehabilitation works. It would also be possible to
increase the capacity by up to 6 million tonnes.
According to CFM-Central, when coal transportation starts, 8 to 12 trains per day will run on
the Sena Line. Trains hauling 45 wagons of coal are planned.
2) Branch line from Dona Ana to Vila Nova de Frontela
According to the Ministry of Transport and Communication of Mozambique, they are
interested in developing a dry port in Mutarara linking to Beira Port by railway to expand trade.
The initial survey on this development plan was carried out by CCFB.
Source: Study Team
Figure 3-31 Approximate Location of New Tete Bridge
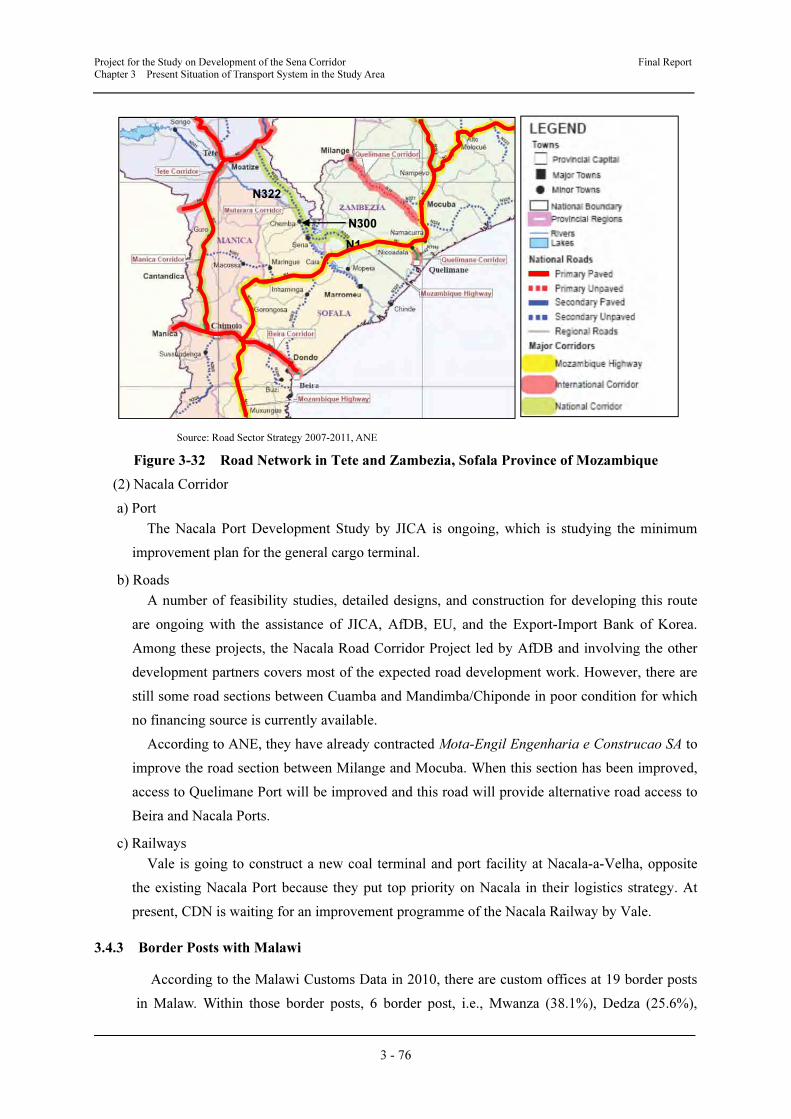
Project for the Study on Development of the Sena Corridor Final Report
Chapter 3 Present Situation of Transport System in the Study Area
3 - 76
Source: Road Sector Strategy 2007-2011, ANE
Figure 3-32 Road Network in Tete and Zambezia, Sofala Province of Mozambique
(2) Nacala Corridor
a) Port
The Nacala Port Development Study by JICA is ongoing, which is studying the minimum
improvement plan for the general cargo terminal.
b) Roads
A number of feasibility studies, detailed designs, and construction for developing this route
are ongoing with the assistance of JICA, AfDB, EU, and the Export-Import Bank of Korea.
Among these projects, the Nacala Road Corridor Project led by AfDB and involving the other
development partners covers most of the expected road development work. However, there are
still some road sections between Cuamba and Mandimba/Chiponde in poor condition for which
no financing source is currently available.
According to ANE, they have already contracted Mota-Engil Engenharia e Construcao SA to
improve the road section between Milange and Mocuba. When this section has been improved,
access to Quelimane Port will be improved and this road will provide alternative road access to
Beira and Nacala Ports.
c) Railways
Vale is going to construct a new coal terminal and port facility at Nacala-a-Velha, opposite
the existing Nacala Port because they put top priority on Nacala in their logistics strategy. At
present, CDN is waiting for an improvement programme of the Nacala Railway by Vale.
3.4.3 Border Posts with Malawi
According to the Malawi Customs Data in 2010, there are custom offices at 19 border posts
in Malaw. Within those border posts, 6 border post, i.e., Mwanza (38.1%), Dedza (25.6%),
N322
N300
N1
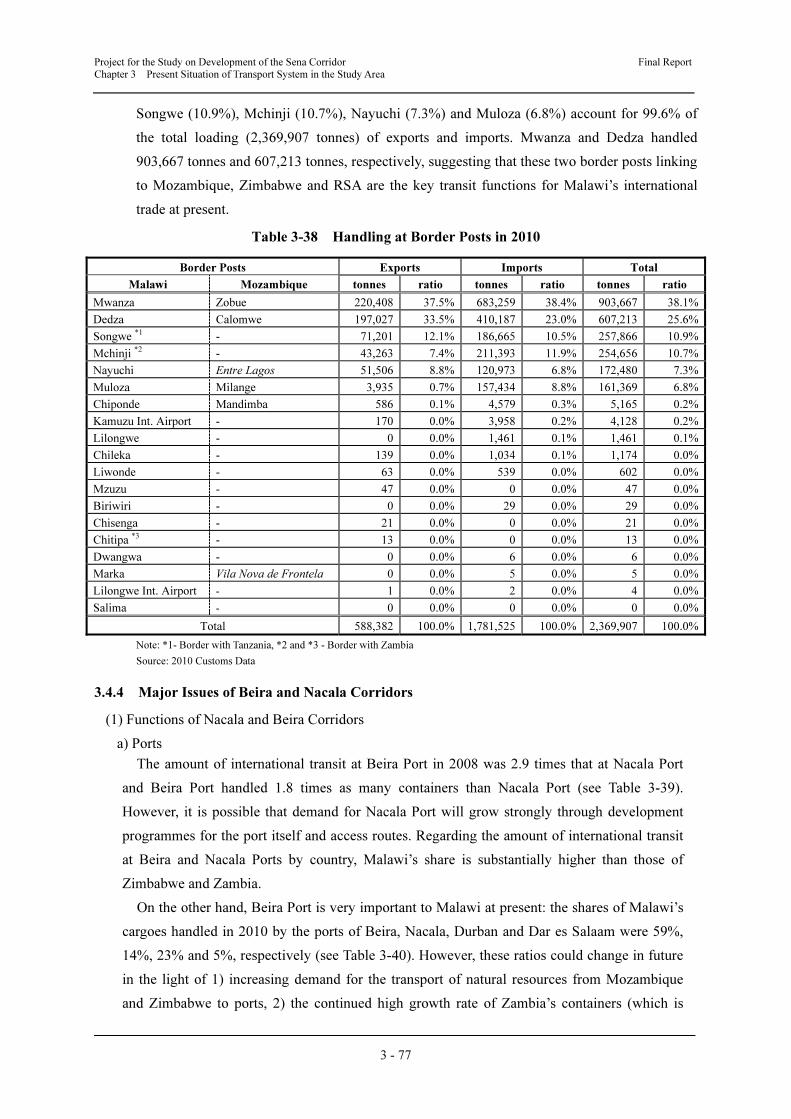
Project for the Study on Development of the Sena Corridor Final Report
Chapter 3 Present Situation of Transport System in the Study Area
3 - 77
Songwe (10.9%), Mchinji (10.7%), Nayuchi (7.3%) and Muloza (6.8%) account for 99.6% of
the total loading (2,369,907 tonnes) of exports and imports. Mwanza and Dedza handled
903,667 tonnes and 607,213 tonnes, respectively, suggesting that these two border posts linking
to Mozambique, Zimbabwe and RSA are the key transit functions for Malawi’s international
trade at present.
Table 3-38 Handling at Border Posts in 2010
Border Posts Exports Imports Total
Malawi Mozambique tonnes ratio tonnes ratio tonnes ratio
Mwanza Zobue 220,408 37.5% 683,259 38.4% 903,667 38.1%
Dedza Calomwe 197,027 33.5% 410,187 23.0% 607,213 25.6%
Songwe *1 - 71,201 12.1% 186,665 10.5% 257,866 10.9%
Mchinji *2 - 43,263 7.4% 211,393 11.9% 254,656 10.7%
Nayuchi Entre Lagos 51,506 8.8% 120,973 6.8% 172,480 7.3%
Muloza Milange 3,935 0.7% 157,434 8.8% 161,369 6.8%
Chiponde Mandimba 586 0.1% 4,579 0.3% 5,165 0.2%
Kamuzu Int. Airport - 170 0.0% 3,958 0.2% 4,128 0.2%
Lilongwe - 0 0.0% 1,461 0.1% 1,461 0.1%
Chileka - 139 0.0% 1,034 0.1% 1,174 0.0%
Liwonde - 63 0.0% 539 0.0% 602 0.0%
Mzuzu - 47 0.0% 0 0.0% 47 0.0%
Biriwiri - 0 0.0% 29 0.0% 29 0.0%
Chisenga - 21 0.0% 0 0.0% 21 0.0%
Chitipa *3 - 13 0.0% 0 0.0% 13 0.0%
Dwangwa - 0 0.0% 6 0.0% 6 0.0%
Marka Vila Nova de Frontela 0 0.0% 5 0.0% 5 0.0%
Lilongwe Int. Airport - 1 0.0% 2 0.0% 4 0.0%
Salima - 0 0.0% 0 0.0% 0 0.0%
Total 588,382 100.0% 1,781,525 100.0% 2,369,907 100.0%
Note: *1- Border with Tanzania, *2 and *3 - Border with Zambia
Source: 2010 Customs Data
3.4.4 Major Issues of Beira and Nacala Corridors
(1) Functions of Nacala and Beira Corridors
a) Ports
The amount of international transit at Beira Port in 2008 was 2.9 times that at Nacala Port
and Beira Port handled 1.8 times as many containers than Nacala Port (see Table 3-39).
However, it is possible that demand for Nacala Port will grow strongly through development
programmes for the port itself and access routes. Regarding the amount of international transit
at Beira and Nacala Ports by country, Malawi’s share is substantially higher than those of
Zimbabwe and Zambia.
On the other hand, Beira Port is very important to Malawi at present: the shares of Malawi’s
cargoes handled in 2010 by the ports of Beira, Nacala, Durban and Dar es Salaam were 59%,
14%, 23% and 5%, respectively (see Table 3-40). However, these ratios could change in future
in the light of 1) increasing demand for the transport of natural resources from Mozambique
and Zimbabwe to ports, 2) the continued high growth rate of Zambia’s containers (which is
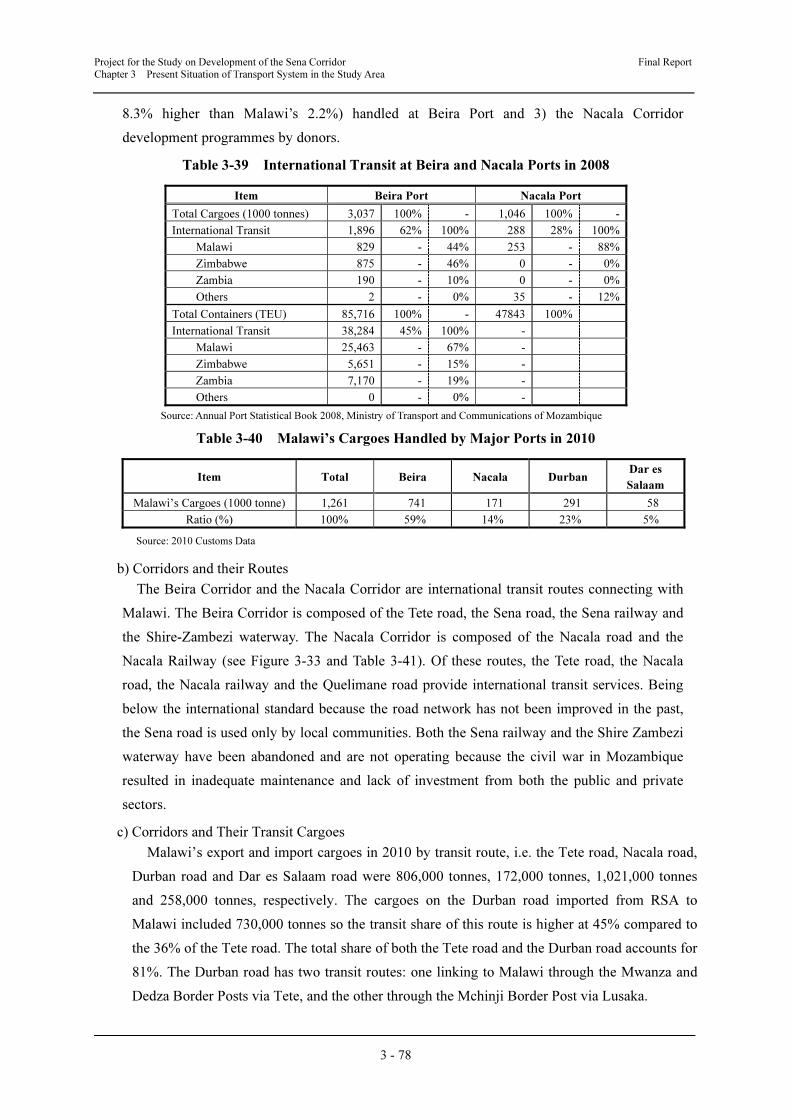
Project for the Study on Development of the Sena Corridor Final Report
Chapter 3 Present Situation of Transport System in the Study Area
3 - 78
8.3% higher than Malawi’s 2.2%) handled at Beira Port and 3) the Nacala Corridor
development programmes by donors.
Table 3-39 International Transit at Beira and Nacala Ports in 2008
Item Beira Port Nacala Port
Total Cargoes (1000 tonnes) 3,037 100% - 1,046 100% -
International Transit 1,896 62% 100% 288 28% 100%
Malawi 829 - 44% 253 - 88%
Zimbabwe 875 - 46% 0 - 0%
Zambia 190 - 10% 0 - 0%
Others 2 - 0% 35 - 12%
Total Containers (TEU) 85,716 100% - 47843 100%
International Transit 38,284 45% 100% -
Malawi 25,463 - 67% -
Zimbabwe 5,651 - 15% -
Zambia 7,170 - 19% -
Others 0 - 0% -
Source: Annual Port Statistical Book 2008, Ministry of Transport and Communications of Mozambique
Table 3-40 Malawi’s Cargoes Handled by Major Ports in 2010
Item Total Beira Nacala Durban Dar es
Salaam
Malawi’s Cargoes (1000 tonne) 1,261 741 171 291 58
Ratio (%) 100% 59% 14% 23% 5%
Source: 2010 Customs Data
b) Corridors and their Routes
The Beira Corridor and the Nacala Corridor are international transit routes connecting with
Malawi. The Beira Corridor is composed of the Tete road, the Sena road, the Sena railway and
the Shire-Zambezi waterway. The Nacala Corridor is composed of the Nacala road and the
Nacala Railway (see Figure 3-33 and Table 3-41). Of these routes, the Tete road, the Nacala
road, the Nacala railway and the Quelimane road provide international transit services. Being
below the international standard because the road network has not been improved in the past,
the Sena road is used only by local communities. Both the Sena railway and the Shire Zambezi
waterway have been abandoned and are not operating because the civil war in Mozambique
resulted in inadequate maintenance and lack of investment from both the public and private
sectors.
c) Corridors and Their Transit Cargoes
Malawi’s export and import cargoes in 2010 by transit route, i.e. the Tete road, Nacala road,
Durban road and Dar es Salaam road were 806,000 tonnes, 172,000 tonnes, 1,021,000 tonnes
and 258,000 tonnes, respectively. The cargoes on the Durban road imported from RSA to
Malawi included 730,000 tonnes so the transit share of this route is higher at 45% compared to
the 36% of the Tete road. The total share of both the Tete road and the Durban road accounts for
81%. The Durban road has two transit routes: one linking to Malawi through the Mwanza and
Dedza Border Posts via Tete, and the other through the Mchinji Border Post via Lusaka.
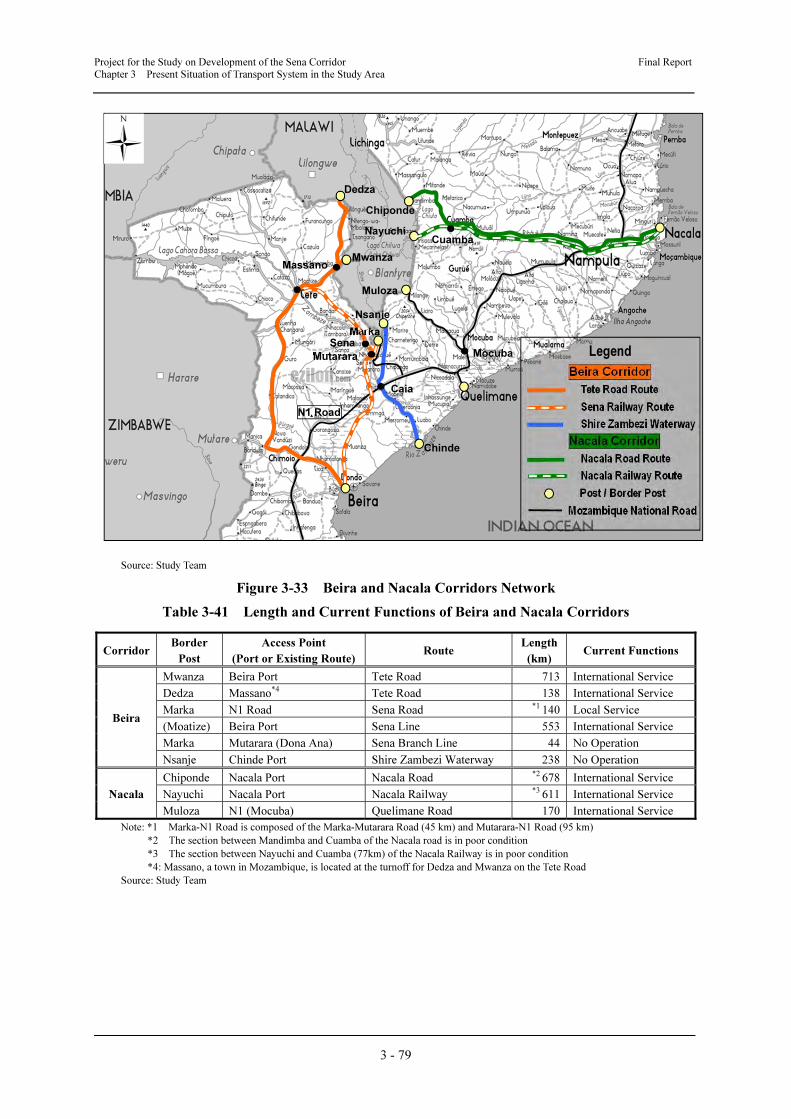
Project for the Study on Development of the Sena Corridor Final Report
Chapter 3 Present Situation of Transport System in the Study Area
3 - 79
Source: Study Team
Figure 3-33 Beira and Nacala Corridors Network
Table 3-41 Length and Current Functions of Beira and Nacala Corridors
Corridor Border
Post
Access Point
(Port or Existing Route)Route
Length
(km) Current Functions
Beira
Mwanza Beira Port Tete Road 713 International Service
Dedza Massano*4 Tete Road 138 International Service
Marka N1 Road Sena Road *1 140 Local Service
(Moatize) Beira Port Sena Line 553 International Service
Marka Mutarara (Dona Ana) Sena Branch Line 44 No Operation
Nsanje Chinde Port Shire Zambezi Waterway 238 No Operation
Nacala
Chiponde Nacala Port Nacala Road *2 678 International Service
Nayuchi Nacala Port Nacala Railway *3 611 International Service
Muloza N1 (Mocuba) Quelimane Road 170 International Service
Note: *1 Marka-N1 Road is composed of the Marka-Mutarara Road (45 km) and Mutarara-N1 Road (95 km)
*2 The section between Mandimba and Cuamba of the Nacala road is in poor condition
*3 The section between Nayuchi and Cuamba (77km) of the Nacala Railway is in poor condition
*4: Massano, a town in Mozambique, is located at the turnoff for Dedza and Mwanza on the Tete Road
Source: Study Team
Dedza
Mwanza
Nsanje
Chiponde
Massano
Nayuchi
Mocuba
Muloza
Chinde
Mutarara
Caia
MarkaSena
Beira Corridor
Tete Road Route
Sena Railway Route
Shire Zambezi Waterway
Nacala Corridor
Nacala Road Route
Nacala Railway Route
Post / Border Post
Mozambique National Road
N1 Road
Cuamba
Legend
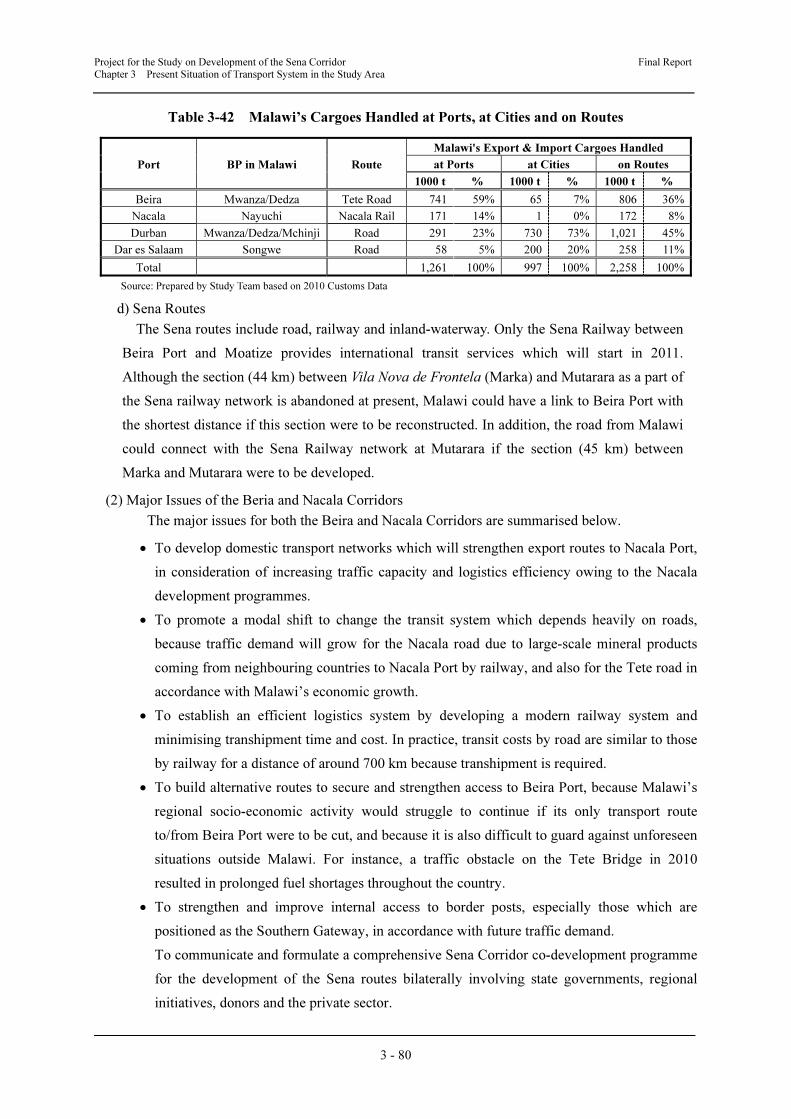
Project for the Study on Development of the Sena Corridor Final Report
Chapter 3 Present Situation of Transport System in the Study Area
3 - 80
Table 3-42 Malawi’s Cargoes Handled at Ports, at Cities and on Routes
Port BP in Malawi Route
Malawi's Export & Import Cargoes Handled
at Ports at Cities on Routes
1000 t % 1000 t % 1000 t %
Beira Mwanza/Dedza Tete Road 741 59% 65 7% 806 36%
Nacala Nayuchi Nacala Rail 171 14% 1 0% 172 8%
Durban Mwanza/Dedza/Mchinji Road 291 23% 730 73% 1,021 45%
Dar es Salaam Songwe Road 58 5% 200 20% 258 11%
Total 1,261 100% 997 100% 2,258 100%
Source: Prepared by Study Team based on 2010 Customs Data
d) Sena Routes
The Sena routes include road, railway and inland-waterway. Only the Sena Railway between
Beira Port and Moatize provides international transit services which will start in 2011.
Although the section (44 km) between Vila Nova de Frontela (Marka) and Mutarara as a part of
the Sena railway network is abandoned at present, Malawi could have a link to Beira Port with
the shortest distance if this section were to be reconstructed. In addition, the road from Malawi
could connect with the Sena Railway network at Mutarara if the section (45 km) between
Marka and Mutarara were to be developed.
(2) Major Issues of the Beria and Nacala Corridors
The major issues for both the Beira and Nacala Corridors are summarised below.
• To develop domestic transport networks which will strengthen export routes to Nacala Port,
in consideration of increasing traffic capacity and logistics efficiency owing to the Nacala
development programmes.
• To promote a modal shift to change the transit system which depends heavily on roads,
because traffic demand will grow for the Nacala road due to large-scale mineral products
coming from neighbouring countries to Nacala Port by railway, and also for the Tete road in
accordance with Malawi’s economic growth.
• To establish an efficient logistics system by developing a modern railway system and
minimising transhipment time and cost. In practice, transit costs by road are similar to those
by railway for a distance of around 700 km because transhipment is required.
• To build alternative routes to secure and strengthen access to Beira Port, because Malawi’s
regional socio-economic activity would struggle to continue if its only transport route
to/from Beira Port were to be cut, and because it is also difficult to guard against unforeseen
situations outside Malawi. For instance, a traffic obstacle on the Tete Bridge in 2010
resulted in prolonged fuel shortages throughout the country.
• To strengthen and improve internal access to border posts, especially those which are
positioned as the Southern Gateway, in accordance with future traffic demand.
To communicate and formulate a comprehensive Sena Corridor co-development programme
for the development of the Sena routes bilaterally involving state governments, regional
initiatives, donors and the private sector.
CHAPTER 4
FUTURE TRAFFIC
DEMAND FORECAST
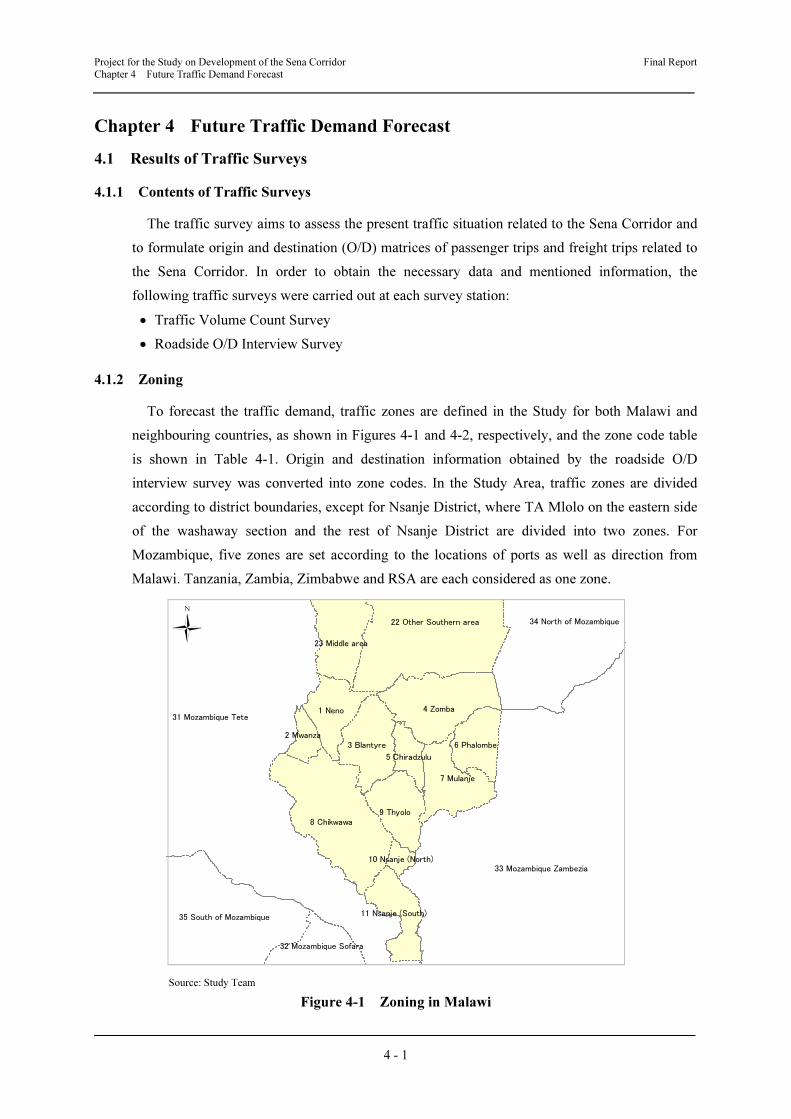
Project for the Study on Development of the Sena Corridor Final Report
Chapter 4 Future Traffic Demand Forecast
4 - 1
Chapter 4 Future Traffic Demand Forecast
4.1 Results of Traffic Surveys
4.1.1 Contents of Traffic Surveys
The traffic survey aims to assess the present traffic situation related to the Sena Corridor and
to formulate origin and destination (O/D) matrices of passenger trips and freight trips related to
the Sena Corridor. In order to obtain the necessary data and mentioned information, the
following traffic surveys were carried out at each survey station:
• Traffic Volume Count Survey
• Roadside O/D Interview Survey
4.1.2 Zoning
To forecast the traffic demand, traffic zones are defined in the Study for both Malawi and
neighbouring countries, as shown in Figures 4-1 and 4-2, respectively, and the zone code table
is shown in Table 4-1. Origin and destination information obtained by the roadside O/D
interview survey was converted into zone codes. In the Study Area, traffic zones are divided
according to district boundaries, except for Nsanje District, where TA Mlolo on the eastern side
of the washaway section and the rest of Nsanje District are divided into two zones. For
Mozambique, five zones are set according to the locations of ports as well as direction from
Malawi. Tanzania, Zambia, Zimbabwe and RSA are each considered as one zone.
Source: Study Team
Figure 4-1 Zoning in Malawi
34 North of Mozambique
35 South of Mozambique
31 Mozambique Tete
32 Mozambique Sofara
33 Mozambique Zambezia
1 Neno
22 Other Southern area
2 Mwanza3 Blantyre
4 Zomba
5 Chiradzulu
6 Phalombe
7 Mulanje
8 Chikwawa9 Thyolo
10 Nsanje (North)
11 Nsanje (South)
23 Middle area

Project for the Study on Development of the Sena Corridor Final Report
Chapter 4 Future Traffic Demand Forecast
4 - 2
Source: Study Team
Figure 4-2 Zoning outside of Malawi (Southeastern Africa)
Table 4-1 Zone Code Table
Zone Zone Name Zone Zone Name
01 Neno District 31 Mozambique, Tete Province
02 Mwanza District 32 Mozambique, Sofara Province (except Beira Port
area)
03 Blantyre District 33 Mozambique Zambezia Province (except Nacala
Port area)
04 Zomba District 34 North of Mozambique
(Cabo Dulgado, Nampula and Niassa Provinces)
05 Chiradzulu District 35 South of Mozambique
(Manica, Inhanbane, Gaza and Maputo Provinces)
06 Phalombe District 41 Tanzania, except Dar el Salaam Port area
07 Mulanje District 42 Zambia
08 Chikhwawa District 43 Zimbabwe
09 Thyolo District 44 South Africa, except Durban Port area
10 Nsanje District (TA Mlolo) 51 Nacala Port Area
11 Nsanje District (Except TA Mlolo) 52 Beira Port Area
21 Lilongwe District 53 Durban Port Area
22 Other Southern Region
(Balaka, Machinga and Mangochi Districts)
54 Dar-es Salam Port Area
23 Central Region except Lilongwe District
(Dedza, Dowa, Kasungu, Mchinji, Nkhotakota,
Ntcheu, Ntchisi and Salima Districts)
55 Other Ocean Sea Ports
24 Northern Region
(Chitipa, Karonga, Likoma, Mzimba, Nkhatabay
and Rumphi District)
99 Overseas
Source: Study Team
53 Durban Port
54 Dar es Salaam Port
41 Tanzania
34 North of Mozambique
52 Beira Port
21 Lilongwe
23 Middle region
22 Middle region42 Zambia51 Nacala Port
32 Mozambique
Sofara
31 Mozambique
Tete
43 Zimbabwe
35 South of Mozambique
44 South Africa
33 Mozambique
Zambezia
24 Northern region
55 Other Sea Port
99 Overseas
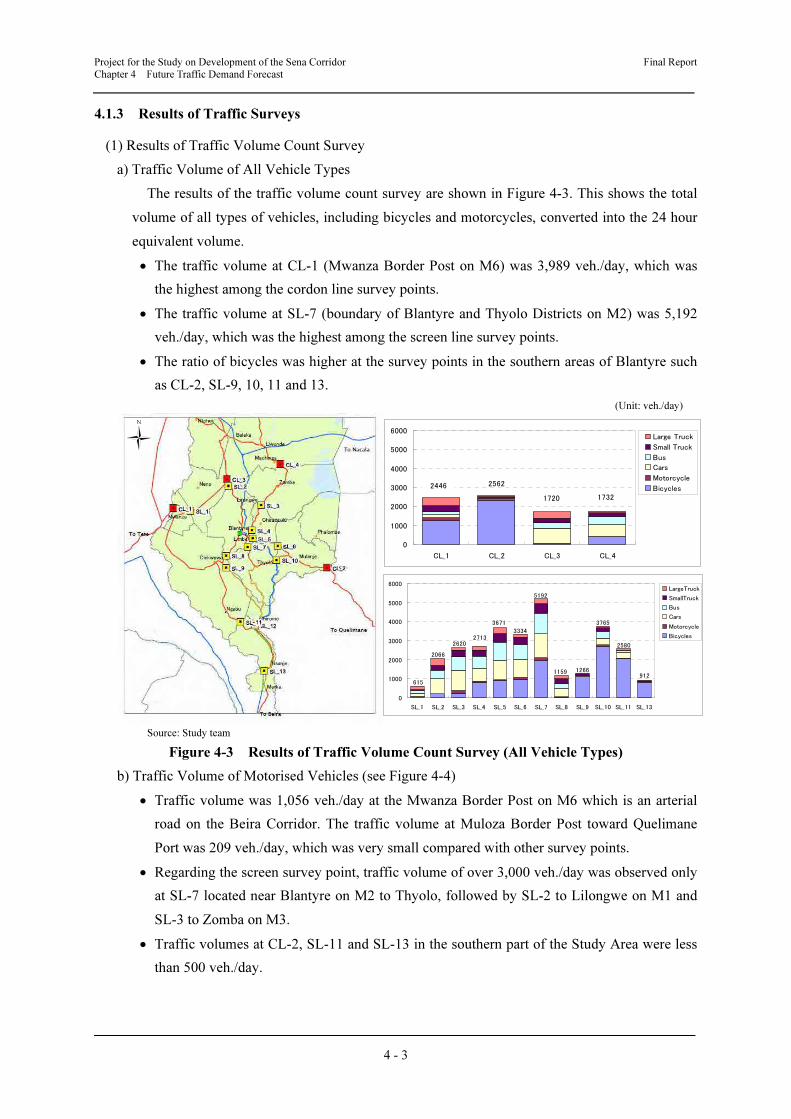
Project for the Study on Development of the Sena Corridor Final Report
Chapter 4 Future Traffic Demand Forecast
4 - 3
4.1.3 Results of Traffic Surveys
(1) Results of Traffic Volume Count Survey
a) Traffic Volume of All Vehicle Types
The results of the traffic volume count survey are shown in Figure 4-3. This shows the total
volume of all types of vehicles, including bicycles and motorcycles, converted into the 24 hour
equivalent volume.
• The traffic volume at CL-1 (Mwanza Border Post on M6) was 3,989 veh./day, which was
the highest among the cordon line survey points.
• The traffic volume at SL-7 (boundary of Blantyre and Thyolo Districts on M2) was 5,192
veh./day, which was the highest among the screen line survey points.
• The ratio of bicycles was higher at the survey points in the southern areas of Blantyre such
as CL-2, SL-9, 10, 11 and 13.
(Unit: veh./day)
Source: Study team
Source: Study team
Figure 4-3 Results of Traffic Volume Count Survey (All Vehicle Types)
b) Traffic Volume of Motorised Vehicles (see Figure 4-4)
• Traffic volume was 1,056 veh./day at the Mwanza Border Post on M6 which is an arterial
road on the Beira Corridor. The traffic volume at Muloza Border Post toward Quelimane
Port was 209 veh./day, which was very small compared with other survey points.
• Regarding the screen survey point, traffic volume of over 3,000 veh./day was observed only
at SL-7 located near Blantyre on M2 to Thyolo, followed by SL-2 to Lilongwe on M1 and
SL-3 to Zomba on M3.
• Traffic volumes at CL-2, SL-11 and SL-13 in the southern part of the Study Area were less
than 500 veh./day.
0
1000
2000
3000
4000
5000
6000
CL_1 CL_2 CL_3 CL_4
Large Truck
Small Truck
Bus
Cars
Motorcycle
Bicycles
0
1000
2000
3000
4000
5000
6000
SL_1 SL_2 SL_3 SL_4 SL_5 SL_6 SL_7 SL_8 SL_9 SL_10 SL_11 SL_13
LargeTruck
SmallTruck
Bus
Cars
Motorcycle
Bicycles
615
2066
26202713
3671
3334
5192
1266
3765
2580
9121159
2446 2562
1720 1732

Project for the Study on Development of the Sena Corridor Final Report
Chapter 4 Future Traffic Demand Forecast
4 - 4
(Unit: veh./day)
Source: Study team
Figure 4-4 Results of Traffic Volume Count Survey (Motorised Vehicles)
c) Hourly Fluctuation of Traffic Volume
Figure 4-5 shows the hourly fluctuation of traffic volume at the cordon line survey stations.
At CL-1, CL-3 and CL-4, traffic volume was higher in the afternoon.

Project for the Study on Development of the Sena Corridor Final Report Chapter 4 Future Traffic Demand Forecast
4 - 5
Source: Study team
Figure 4-5 Hourly Fluctuation of Traffic Volume at Cordon Line Stations
0
50
100
150
200
6:00 7:00 8:00 9:00 10:00 11:00 12:00 13:00 14:00 15:00 16:00 17:00 18:00 19:00 20:00 21:00 22:00 23:00 0:00 1:00 2:00 3:00 4:00 5:00
LargeTruck
SmallTruck
Bus
Cars
0
50
100
150
200
6:00 7:00 8:00 9:00 10:00 11:00 12:00 13:00 14:00 15:00 16:00 17:00 18:00 19:00 20:00 21:00 22:00 23:00 0:00 1:00 2:00 3:00 4:00 5:00
LargeTruck
SmallTruck
Bus
Cars
0
50
100
150
200
6:00 7:00 8:00 9:00 10:00 11:00 12:00 13:00 14:00 15:00 16:00 17:00 18:00 19:00 20:00 21:00 22:00 23:00 0:00 1:00 2:00 3:00 4:00 5:00
LargeTruck
SmallTruck
Bus
Cars
0
50
100
150
200
6:00 7:00 8:00 9:00 10:0011:00 12:00 13:0014:0015:0016:0017:0018:0019:0020:0021:0022:0023:00 0:00 1:00 2:00 3:00 4:00 5:00
LargeTruck
SmallTruck
Bus
Cars
Vehicle
CL-2
CL-1
CL-4
CL-3
Vehicle
Vehicle
Vehicle
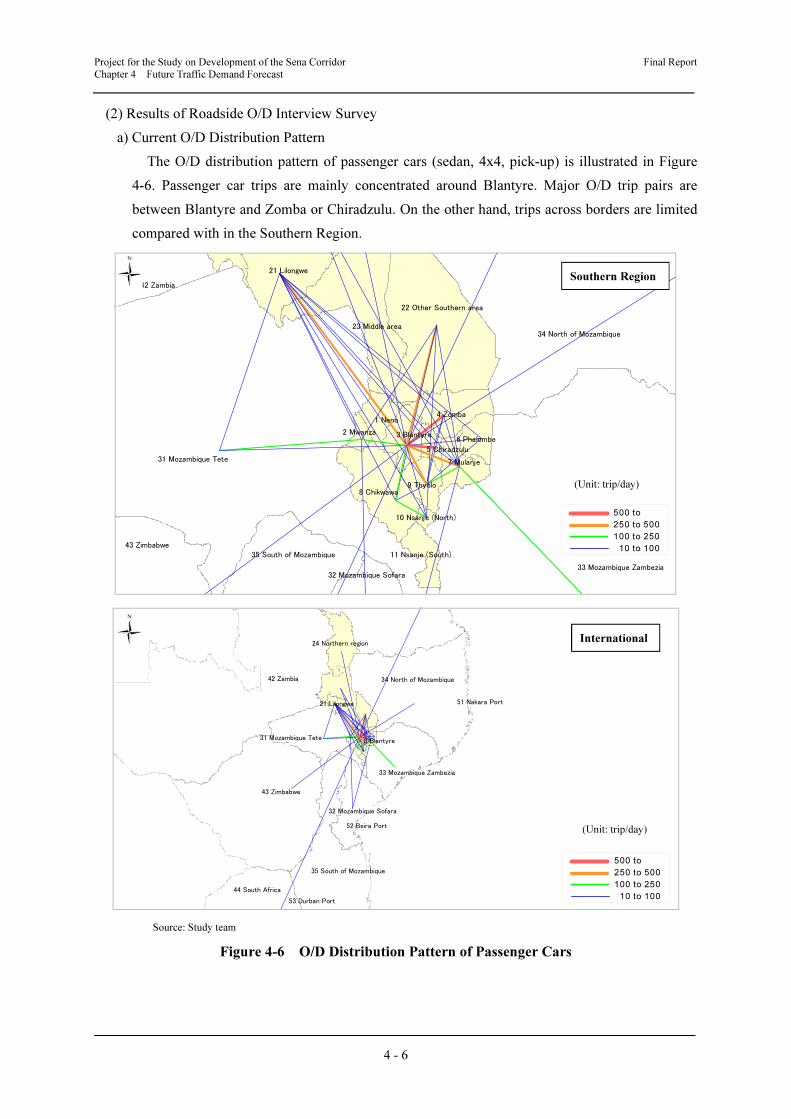
Project for the Study on Development of the Sena Corridor Final Report
Chapter 4 Future Traffic Demand Forecast
4 - 6
(2) Results of Roadside O/D Interview Survey
a) Current O/D Distribution Pattern
The O/D distribution pattern of passenger cars (sedan, 4x4, pick-up) is illustrated in Figure
4-6. Passenger car trips are mainly concentrated around Blantyre. Major O/D trip pairs are
between Blantyre and Zomba or Chiradzulu. On the other hand, trips across borders are limited
compared with in the Southern Region.
Source: Study team
Figure 4-6 O/D Distribution Pattern of Passenger Cars
3 Blantyre
5 Chiradzulu
1 Neno
2 Mwanza
4 Zomba
6 Phalombe
7 Mulanje
8 Chikwawa9 Thyolo
10 Nsanje (North)
11 Nsanje (South)
21 Lilongwe
22 Other Southern area
23 Middle area
31 Mozambique Tete
32 Mozambique Sofara33 Mozambique Zambezia
34 North of Mozambique
35 South of Mozambique
42 Zambia
43 Zimbabwe
3 Blantyre31 Mozambique Tete
42 Zambia
43 Zimbabwe
32 Mozambique Sofara
52 Beira Port
33 Mozambique Zambezia
51 Nakara Port
34 North of Mozambique
35 South of Mozambique
44 South Africa
53 Durban Port
21 Lilongwe
24 Northern regionInternational
Southern Region
500 to
250 to 500
100 to 250
10 to 100
500 to
250 to 500
100 to 250
10 to 100
(Unit: trip/day)
(Unit: trip/day)

Project for the Study on Development of the Sena Corridor Final Report
Chapter 4 Future Traffic Demand Forecast
4 - 7
The O/D distribution pattern of freight traffic is shown in Figure 4-7. Freight traffic trips are
spread over a wide area. Especially, trips to Nacala and Beira Ports as well as to RSA are
predominant. This means that freight traffic in the Southern Region extended over a wide area.
Source: Study team
Figure 4-7 O/D Distribution Pattern of Freight Traffic
The O/D distribution pattern of bus traffic is shown in Figure 4-8. Almost all of the bus trips
are made within Malawi, except for a few buses travelling to/from Mozambique and RSA.
3 Blantyre
5 Chiradzulu
1 Neno
2 Mwanza
4 Zomba
6 Phalombe
7 Mulanje
8 Chikwawa9 Thyolo
10 Nsanje (North)
11 Nsanje (South)
21 Lilongwe
22 Other Southern area
23 Middle area
31 Mozambique Tete
32 Mozambique Sofara33 Mozambique Zambezia
34 North of Mozambique
35 South of Mozambique
42 Zambia
43 Zimbabwe
3 Blantyre31 Mozambique Tete
42 Zambia
43 Zimbabwe
32 Mozambique Sofara
52 Beira Port
33 Mozambique Zambezia
51 Nakara Port
34 North of Mozambique
35 South of Mozambique
44 South Africa
53 Durban Port
21 Lilongwe
24 Northern region
Southern Region
International
500 to
250 to 500
100 to 250
10 to 100
500 to
250 to 500
100 to 250
10 to 100
(Unit: trip/day)
(Unit: trip/day)
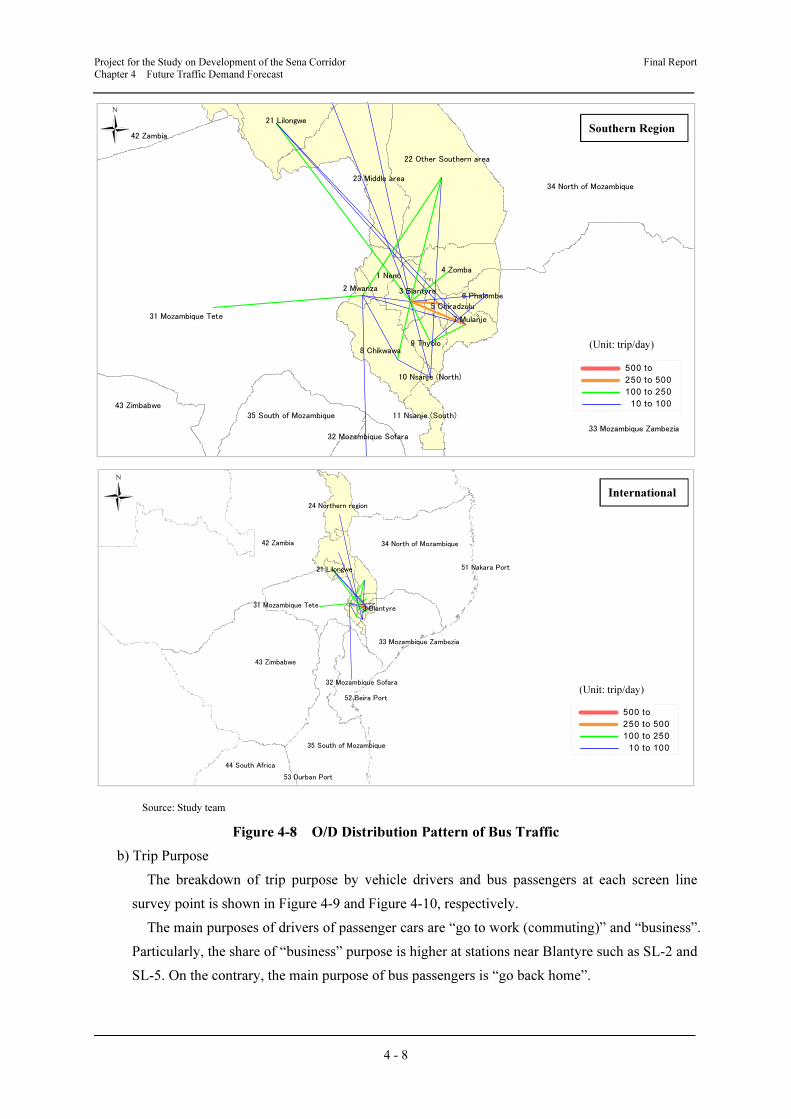
Project for the Study on Development of the Sena Corridor Final Report
Chapter 4 Future Traffic Demand Forecast
4 - 8
Source: Study team
Figure 4-8 O/D Distribution Pattern of Bus Traffic
b) Trip Purpose
The breakdown of trip purpose by vehicle drivers and bus passengers at each screen line
survey point is shown in Figure 4-9 and Figure 4-10, respectively.
The main purposes of drivers of passenger cars are “go to work (commuting)” and “business”.
Particularly, the share of “business” purpose is higher at stations near Blantyre such as SL-2 and
SL-5. On the contrary, the main purpose of bus passengers is “go back home”.
3 Blantyre
5 Chiradzulu
1 Neno
2 Mwanza
4 Zomba
6 Phalombe
7 Mulanje
8 Chikwawa9 Thyolo
10 Nsanje (North)
11 Nsanje (South)
21 Lilongwe
22 Other Southern area
23 Middle area
31 Mozambique Tete
32 Mozambique Sofara33 Mozambique Zambezia
34 North of Mozambique
35 South of Mozambique
42 Zambia
43 Zimbabwe
3 Blantyre31 Mozambique Tete
42 Zambia
43 Zimbabwe
32 Mozambique Sofara
52 Beira Port
33 Mozambique Zambezia
51 Nakara Port
34 North of Mozambique
35 South of Mozambique
44 South Africa
53 Durban Port
21 Lilongwe
24 Northern region
Southern Region
International
500 to
250 to 500
100 to 250
10 to 100
500 to
250 to 500
100 to 250
10 to 100
(Unit: trip/day)
(Unit: trip/day)

Project for the Study on Development of the Sena Corridor Final Report Chapter 4 Future Traffic Demand Forecast
4 - 9
Source: Study team
Figure 4-9 Trip Purpose of Passenger Car Drivers
Source: Study team
Figure 4-10 Trip Purpose of Bus Passengers
c) Vehicle Occupancy Ratio
Occupancy ratios of passenger cars, minibuses and conventional buses are summarised in
Table 4-2.
• The occupancy ratio of passenger cars was 52% and the average number of passengers was
2.5 persons/veh.
• The occupancy ratio of minibuses was 79% and the average number of passengers was 12.3
persons/veh.
• The occupancy ratio of conventional buses was 76% and the average number of passengers
was 52.1 persons/veh.
37% 39%34%
25%32%
28%33%
38%34%
52%
0%2%
3%
4%
4%5%
5%2% 6%
0%
39%
20%
16%29%
29%
16%
17% 15% 16%
17%
8%
13%
10%
18% 2%
16%8% 8%
25%7%
13%
18%
26%
25%
33%30%
16%
32%
13%
12%
3%8% 10%
0% 0%5%
20%
5% 6%12%
0%
10%
20%
30%
40%
50%
60%
70%
80%
90%
100%
SL_1 SL_2 SL_3 SL_4 SL_5 SL_6 SL_7 SL_8 SL_10 SL_11
Screen Line Survey Station
Ratio
6. Others
5. Go back home
4. Private
3. Business
2. Go to school
1. Go to work
9%15%
19%23%
17% 16%9% 7%
22%
13%3%
3%
4%2%
3% 4%
5%6%
0%
4%
36%20%
15%
29%
23% 27%34%
26%
25%
17%
17%
23%18%
11%
9%
14%
1%13%
16%
9%
33%32%
34%
34%
48%35%
46% 43%
31%
45%
3%8% 10%
2% 0%4% 4% 5% 6%
13%
0%
10%
20%
30%
40%
50%
60%
70%
80%
90%
100%
SL_1 SL_2 SL_3 SL_4 SL_5 SL_6 SL_7 SL_8 SL_10 SL_11
Screen Line Survey Station
Ratio
6. Others
5. Go back home
4. Private
3. Business
2. Go to school
1. Go to work

Project for the Study on Development of the Sena Corridor Final Report Chapter 4 Future Traffic Demand Forecast
4 - 10
Table 4-2 Occupancy Ratio
Vehicle Type Average No.
of Passengers
(A)
Capacity
(B)
Occupancy
Ratio
(A/B)
No. of
Sample
Passenger car 2.5 4.8 52% 648
Minibus 12.3 15.5 79% 659
Conventional bus 52.1 68.9 76% 104
Source: Study Team
The load factors of freight vehicles are summarised in Table 4-3. These load factors include
empty vehicles and so are between 33% and 74%.
Table 4-3 Load Factors of Freight Vehicles
Vehicle Type Average
Volume of
Goods (tonne)
(A)
Loading
Capacity
(tonne)
(B)
Load Factor
(A/B)
No. of
Samples
Pick-up 0.5 1.6 33% 126
Light goods vehicle 1.3 2.7 48% 366
Medium goods vehicle 5.4 10.6 51% 1,173
Heavy goods vehicle 18.1 31.9 57% 1,199
Tanker lorry 24.2 32.9 74% 178
Source: Study Team
d) Average Volume of Goods by Commodity
Table 4-4 summarises the average volume of cargo by commodity carried by goods vehicles.
Table 4-4 Average Volume of Goods by Commodity
Commodity Volume (tonne) Commodity Volume (tonne)
Tobacco 18.9 Animals 12.1
Sugar 22.6 Clothes 9.5
Tea 21.2 Other agricultural
products
12.9
Maize 13.0 Fertilizer 24.8
Cotton 17.0 Petrol, diesel 26.3
Rice 4.6 Daily goods 15.6
Coffee 11.0 Construction material 15.7
Source: Study Team
4.1.4 Present Characteristics of Traffic and Logistics
• The result of the traffic volume survey indicates that bicycle traffic is quite high, while
many pedestrians also walk along roadside. The primary means of transportation for local
residents is by foot or by bicycle: carriages or carts towed by livestock such as cows are
rare.
• The flow of passengers across district borders is concentrated in Blantyre regarded as the
central city of the Southern Region as shown in Figure 4-11. The bus usage rate by
passengers crossing district boundaries is nearly 80% except for Zomba District, showing
that bus is a vital mode for local residents.

Project for the Study on Development of the Sena Corridor Final Report Chapter 4 Future Traffic Demand Forecast
4 - 11
Source: Study Team
Figure 4-11 Trip Generation Rate and Ratio of Using Bus among Inter-District Passengers
4.2 Results of Logistics Survey
4.2.1 Summary of Export/Import
(1) Trend of Export/Import
Figure 4-12 shows the value of exports and imports for Malawi from 1994 to 2010. The value
has been increasing for both import and export.
Source: Reserve Bank of Malawi
Figure 4-12 Export and Import Value
Figure 4-13 shows the export and import volume of Malawi for the last 6 years based on the
custom data from the Malawi Revenue Authority (MRA). Exports have not increased by
volume as much as by value, while the import volume has soared, especially from 2005 to 2008.
-
10,000
20,000
30,000
40,000
50,000
Mwanza
Blantyre
Zomba
Chiradzulu
Phalombe
Mulamje
Chikwawa
Thyolo
Nsanje
District
Person
0%
20%
40%
60%
80%
100%
Passenger
Total
Ratio to use bus
0
50,000
100,000
150,000
200,000
250,000
300,000
1994 1995 1996 1997 1998 1999 2000 2001 2002 2003 2004 2005 2006 2007 2008 2009 2010
Year
Value
(MWK million)
Export Value
Import Value
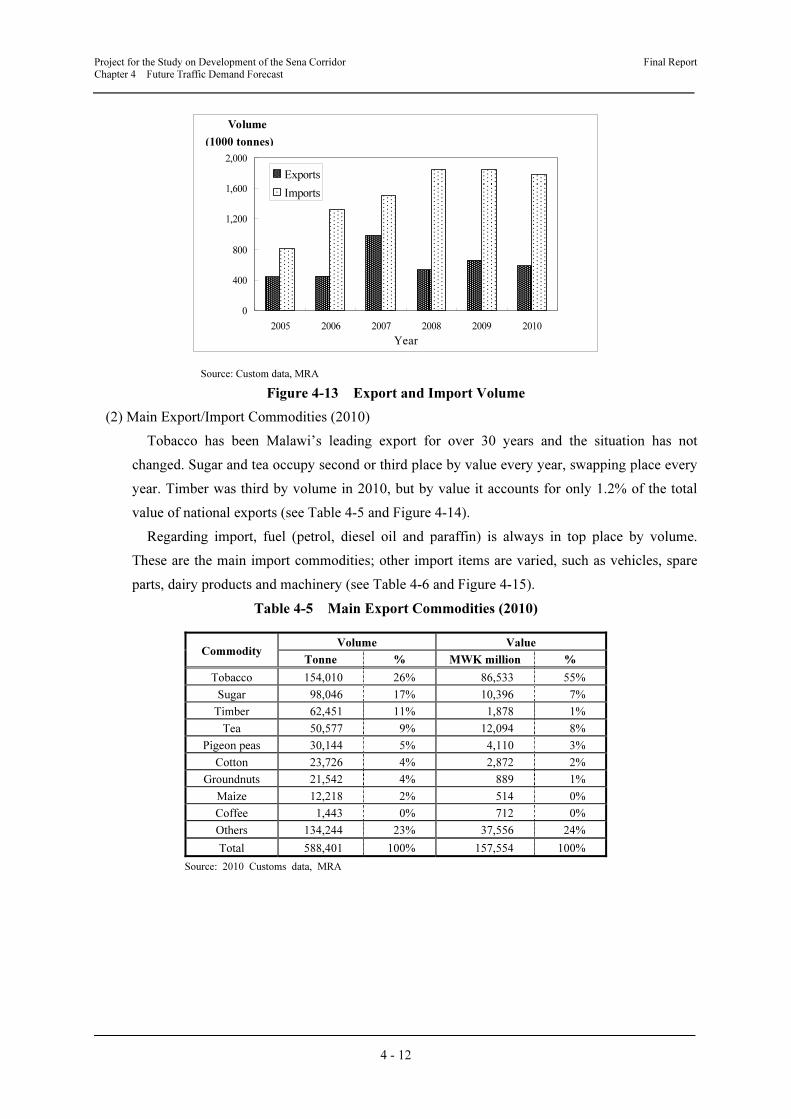
Project for the Study on Development of the Sena Corridor Final Report Chapter 4 Future Traffic Demand Forecast
4 - 12
Source: Custom data, MRA
Figure 4-13 Export and Import Volume
(2) Main Export/Import Commodities (2010)
Tobacco has been Malawi’s leading export for over 30 years and the situation has not
changed. Sugar and tea occupy second or third place by value every year, swapping place every
year. Timber was third by volume in 2010, but by value it accounts for only 1.2% of the total
value of national exports (see Table 4-5 and Figure 4-14).
Regarding import, fuel (petrol, diesel oil and paraffin) is always in top place by volume.
These are the main import commodities; other import items are varied, such as vehicles, spare
parts, dairy products and machinery (see Table 4-6 and Figure 4-15).
Table 4-5 Main Export Commodities (2010)
Commodity Volume Value
Tonne % MWK million %
Tobacco 154,010 26% 86,533 55%
Sugar 98,046 17% 10,396 7%
Timber 62,451 11% 1,878 1%
Tea 50,577 9% 12,094 8%
Pigeon peas 30,144 5% 4,110 3%
Cotton 23,726 4% 2,872 2%
Groundnuts 21,542 4% 889 1%
Maize 12,218 2% 514 0%
Coffee 1,443 0% 712 0%
Others 134,244 23% 37,556 24%
Total 588,401 100% 157,554 100%
Source: 2010 Customs data, MRA
0
400
800
1,200
1,600
2,000
2005 2006 2007 2008 2009 2010
Year
Volume
(1000 tons)
Exports
Imports
(1000 tonnes)
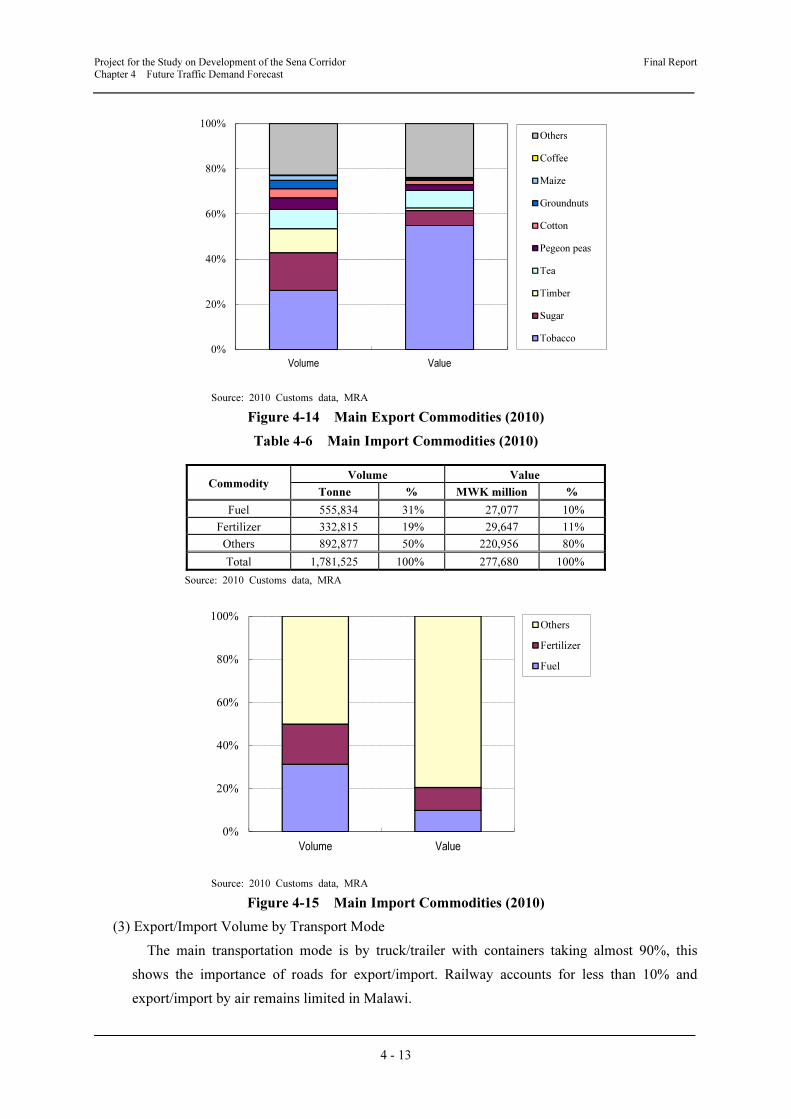
Project for the Study on Development of the Sena Corridor Final Report Chapter 4 Future Traffic Demand Forecast
4 - 13
Source: 2010 Customs data, MRA
Figure 4-14 Main Export Commodities (2010)
Table 4-6 Main Import Commodities (2010)
Commodity Volume Value
Tonne % MWK million %
Fuel 555,834 31% 27,077 10%
Fertilizer 332,815 19% 29,647 11%
Others 892,877 50% 220,956 80%
Total 1,781,525 100% 277,680 100%
Source: 2010 Customs data, MRA
Source: 2010 Customs data, MRA
Figure 4-15 Main Import Commodities (2010)
(3) Export/Import Volume by Transport Mode
The main transportation mode is by truck/trailer with containers taking almost 90%, this
shows the importance of roads for export/import. Railway accounts for less than 10% and
export/import by air remains limited in Malawi.
0%
20%
40%
60%
80%
100%
Volume Value
Others
Coffee
Maize
Groundnuts
Cotton
Pegeon peas
Tea
Timber
Sugar
Tobacco
0%
20%
40%
60%
80%
100%
Volume Value
Others
Fertilizer
Fuel
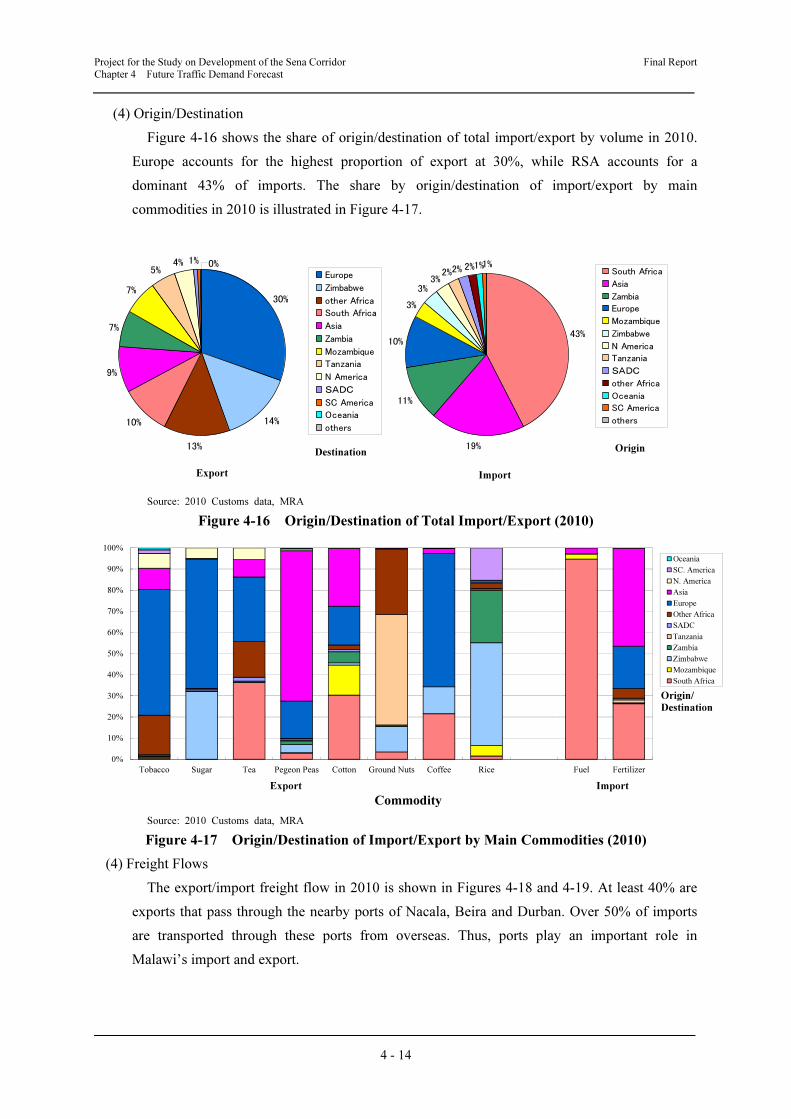
Project for the Study on Development of the Sena Corridor Final Report Chapter 4 Future Traffic Demand Forecast
4 - 14
(4) Origin/Destination
Figure 4-16 shows the share of origin/destination of total import/export by volume in 2010.
Europe accounts for the highest proportion of export at 30%, while RSA accounts for a
dominant 43% of imports. The share by origin/destination of import/export by main
commodities in 2010 is illustrated in Figure 4-17.
Source: 2010 Customs data, MRA
Figure 4-16 Origin/Destination of Total Import/Export (2010)
Source: 2010 Customs data, MRA
Figure 4-17 Origin/Destination of Import/Export by Main Commodities (2010)
(4) Freight Flows
The export/import freight flow in 2010 is shown in Figures 4-18 and 4-19. At least 40% are
exports that pass through the nearby ports of Nacala, Beira and Durban. Over 50% of imports
are transported through these ports from overseas. Thus, ports play an important role in
Malawi’s import and export.
30%
14%
13%
10%
9%
7%
7%
5%4% 1% 0%
Europe
Zimbabwe
other Africa
South Africa
Asia
Zambia
Mozambique
Tanzania
N America
SADC
SC America
Oceania
others
43%
19%
11%
10%
3%
3%
3%2%2%
2%1%1%South Africa
Asia
Zambia
Europe
Mozambique
Zimbabwe
N America
Tanzania
SADC
other Africa
Oceania
SC America
others
0%
10%
20%
30%
40%
50%
60%
70%
80%
90%
100%
Tobacco Sugar Tea Pegeon Peas Cotton Ground Nuts Coffee Rice Fuel Fertilizer
Oceania
SC. America
N. America
Asia
Europe
Other Africa
SADC
Tanzania
Zambia
Zimbabwe
Mozambique
South Africa
Export Import
Export Import
Destination Origin
Commodity
Origin/
Destination
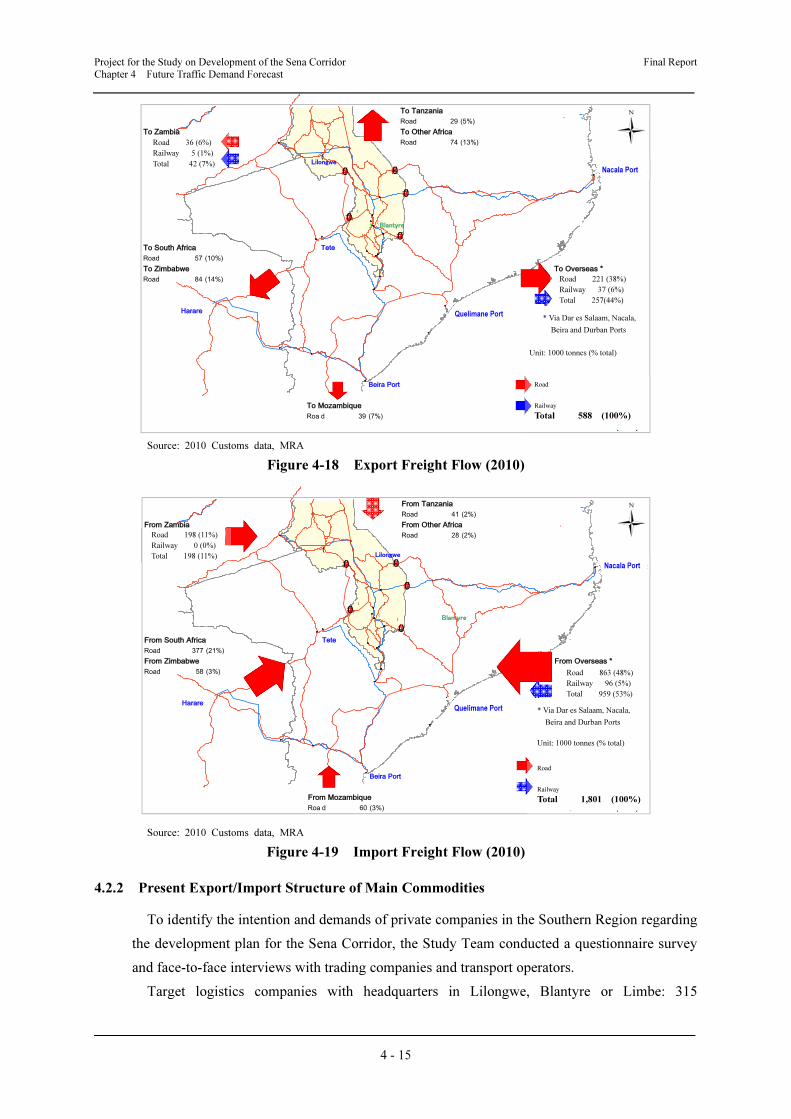
Project for the Study on Development of the Sena Corridor Final Report
Chapter 4 Future Traffic Demand Forecast
4 - 15
Source: 2010 Customs data, MRA
Figure 4-18 Export Freight Flow (2010)
Source: 2010 Customs data, MRA
Figure 4-19 Import Freight Flow (2010)
4.2.2 Present Export/Import Structure of Main Commodities
To identify the intention and demands of private companies in the Southern Region regarding
the development plan for the Sena Corridor, the Study Team conducted a questionnaire survey
and face-to-face interviews with trading companies and transport operators.
Target logistics companies with headquarters in Lilongwe, Blantyre or Limbe: 315
To Tanzania
Road 29 (5%)
To Zambia To Other Africa
Road 36 (6%) Road 74 (13%)
Rail 5 (1%)
Total 42 (7%)
Nakala Port
To South Africa Tete
Road 57 (10%)
To Zimbabwe To Overseas *
Road 84 (14%) Road 221 (38%)
Rail 37 (6%)
Total 257 (44%)
Harare Quilimane Port
Beira Port Road Volume(t'000) (%/total)
To Mozambique Rail Volume(t'000) (%/total)
Road 39 (7%)
Total 588 t'000 (100%)
*Via Der es Salam, Nakala,
Beira and Durban port
!(
!.
!(
!(
!(
!(
!(
!(
!(
!(
!(
!(
!(
!(
!(
!(
!(
!(
!(!(
!(
!(
!(
#0
#0
#0 #0
#0
Blantyre
Lilongwe
From Tanzania
Road 41 (2%)
From Zambia From Other Africa
Road 198 (11%) Road 28 (2%)
Rail 0 (%)
Total 198 (11%)
Nakala Port
From South Africa Tete
Road 377 (21%)
From Zimbabwe From Overseas *
Road 58 (3%) Road 863 (48%)
Rail 96 (5%)
Total 959 (53%)
Harare Quilimane Port
Road Volume(t'000) (%/total)
Beira Port
Rail Volume(t'000) (%/total)
From Mozambique
Road 60 (3%) Total 1,801 t'000 (100%)
*Via Der es Salam, Nakala,
Beira and Durban port
!(
!.
!(
!(
!(
!(
!(
!(
!(
!(
!(
!(
!(
!(
!(
!(
!(
!(
!(!(
!(
!(
!(
#0
#0
#0 #0
#0
Blantyre
Lilongwe
Nacala Port
Quelimane Port
Nacala Port
Quelimane Port
* Via Dar es Salaam, Nacala,
Beira and Durban Ports
Road
Railway
Total 588 (100%)
Unit: 1000 tonnes (% total)
Road 221 (38%)
Railway 37 (6%)
Total 257(44%)
Road 36 (6%)
Railway 5 (1%)
Total 42 (7%)
* Via Dar es Salaam, Nacala,
Beira and Durban Ports
Road 198 (11%)
Railway 0 (0%)
Total 198 (11%)
Road 863 (48%)
Railway 96 (5%)
Total 959 (53%)
Road
Railway
Total 1,801 (100%)
Unit: 1000 tonnes (% total)
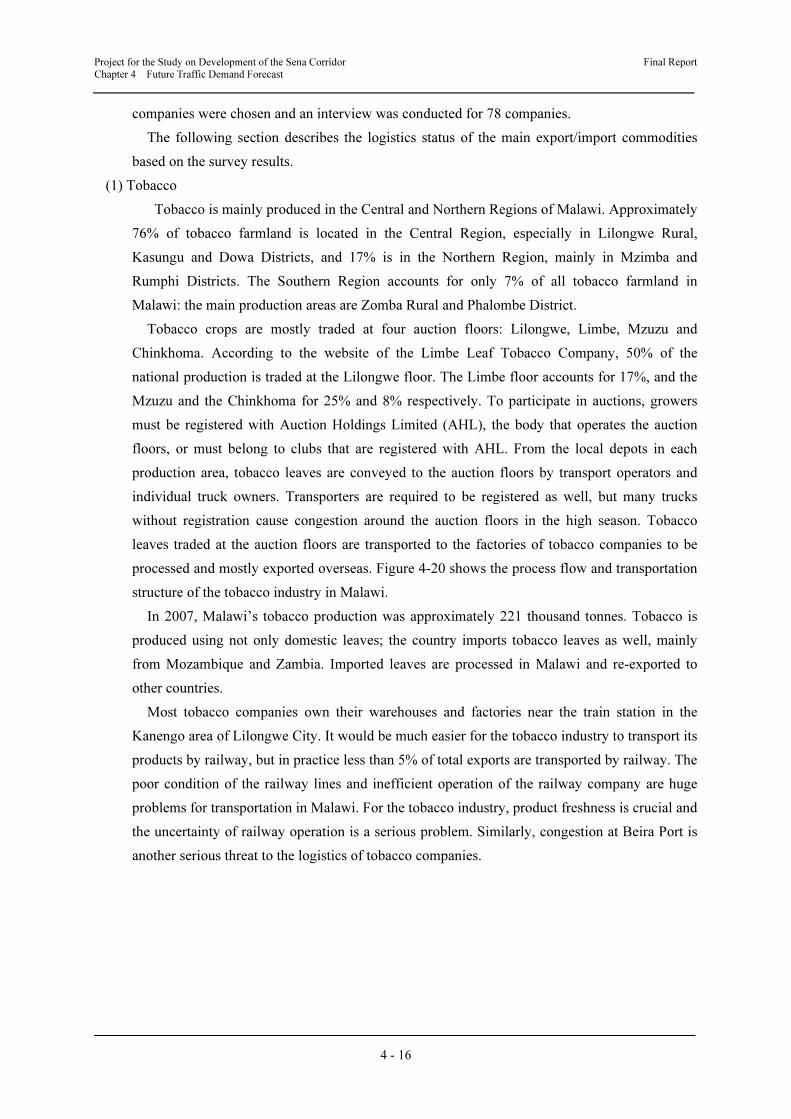
Project for the Study on Development of the Sena Corridor Final Report Chapter 4 Future Traffic Demand Forecast
4 - 16
companies were chosen and an interview was conducted for 78 companies.
The following section describes the logistics status of the main export/import commodities
based on the survey results.
(1) Tobacco
Tobacco is mainly produced in the Central and Northern Regions of Malawi. Approximately
76% of tobacco farmland is located in the Central Region, especially in Lilongwe Rural,
Kasungu and Dowa Districts, and 17% is in the Northern Region, mainly in Mzimba and
Rumphi Districts. The Southern Region accounts for only 7% of all tobacco farmland in
Malawi: the main production areas are Zomba Rural and Phalombe District.
Tobacco crops are mostly traded at four auction floors: Lilongwe, Limbe, Mzuzu and
Chinkhoma. According to the website of the Limbe Leaf Tobacco Company, 50% of the
national production is traded at the Lilongwe floor. The Limbe floor accounts for 17%, and the
Mzuzu and the Chinkhoma for 25% and 8% respectively. To participate in auctions, growers
must be registered with Auction Holdings Limited (AHL), the body that operates the auction
floors, or must belong to clubs that are registered with AHL. From the local depots in each
production area, tobacco leaves are conveyed to the auction floors by transport operators and
individual truck owners. Transporters are required to be registered as well, but many trucks
without registration cause congestion around the auction floors in the high season. Tobacco
leaves traded at the auction floors are transported to the factories of tobacco companies to be
processed and mostly exported overseas. Figure 4-20 shows the process flow and transportation
structure of the tobacco industry in Malawi.
In 2007, Malawi’s tobacco production was approximately 221 thousand tonnes. Tobacco is
produced using not only domestic leaves; the country imports tobacco leaves as well, mainly
from Mozambique and Zambia. Imported leaves are processed in Malawi and re-exported to
other countries.
Most tobacco companies own their warehouses and factories near the train station in the
Kanengo area of Lilongwe City. It would be much easier for the tobacco industry to transport its
products by railway, but in practice less than 5% of total exports are transported by railway. The
poor condition of the railway lines and inefficient operation of the railway company are huge
problems for transportation in Malawi. For the tobacco industry, product freshness is crucial and
the uncertainty of railway operation is a serious problem. Similarly, congestion at Beira Port is
another serious threat to the logistics of tobacco companies.

Project for the Study on Development of the Sena Corridor Final Report
Chapter 4 Future Traffic Demand Forecast
4 - 17
Source: Study Team
Figure 4-20 Process Flow of the Tobacco Industry
The main logistics routes of tobacco production are illustrated in Figure 4-21. Red Purple
arrows indicate domestic transportation from production area to the base of export, or the origin
of export.
Source: Study Team
Figure 4-21 Main Routes of Tobacco Exports, and Exports in 2010
Estate
221.38
A nnual A mounts(2007)
Unit: '000 tonnes
Production Area
Supply
Process
Trade
Local Depot
Auction Floor
Factory
Export
Warehouse
153.1
Estate
221.38
Annual Amount(2007)
Unit: 1000 tonnes
Import

Project for the Study on Development of the Sena Corridor Final Report Chapter 4 Future Traffic Demand Forecast
4 - 18
For reasons mentioned above, tobacco is mainly exported through Durban Port recently
despite it taking twice as long compared to Beira Port which is the second port for tobacco
export. Some tobacco companies prefer the ease of communicating with port facility operators
at Durban Port. Regarding Nacala Port, it used to be one of the important ports for the tobacco
industry before the bridge over the Rivi Rivi River in Balaka was washed away by flood in 2002.
The transportation volume by railway has not yet recovered because of the inefficiency and
uncertainness of its operation.
The Study Area in the Southern Region is insignificant in terms of production of tobacco
leaves, processing and logistics, and is not playing the leading role in Malawi. Limbe Leaf
Tobacco Company, the biggest tobacco company in Malawi, has been the leader in tobacco
processing as well as exporting. Most of the tobacco companies in Malawi have their main
facilities in Lilongwe but they outsource some processing (removing veins) to the Limbe Leaf
Tobacco Company which has factories both in Limbe and Lilongwe. Tobacco leaves processed
at the Limbe Leaf Tobacco Company are packed in Namadzi which is located between Limbe
and Zomba, and then exported to countries all over the world. The main export destinations
have been the USA, EU and Egypt, and recently the volume and a share exported to China has
been growing rapidly. Table 4-7 shows the main export destinations in 2010.
Table 4-7 Major Destinations of Tobacco Exports (2010)
(Unit: 1000 tonnes)
Destination Export Volume
1 Belgium 32.52
2 Egypt 27.07
3 Germany 14.93
4 Netherlands 10.84
5 USA 10.25
6 Russia 5.23
7 China 4.89
8 Poland 4.57
9 Philippines 3.65
10 South Korea 3.14
Total Export Volume 154.01
Source: 2010 Custom data, MRA
(2) Tea
Since the 1980s, tea has been one of the most important export industries for Malawi as
shown in Table 4-8. The annual export volume has remained relatively stable at 30-50 thousand
tonnes for the last thirty years and in 2010 it was MWK12,069 million in value and 50 thousand
tonnes in volume, putting it second and fourth in overall national export by value and volume,
respectively.
Tea estates are mainly located in the southern part of Malawi, especially in Thyolo, a suburb
of Blantyre, and Mulanje, the submontane area of Mount Mulanje. Over 80% of all tea estates
are situated in the Study Area. Another major tea production area of Malawi is Nkhata Bay
District near Mzuzu, the major city in the Northern Region of Malawi. Major tea companies
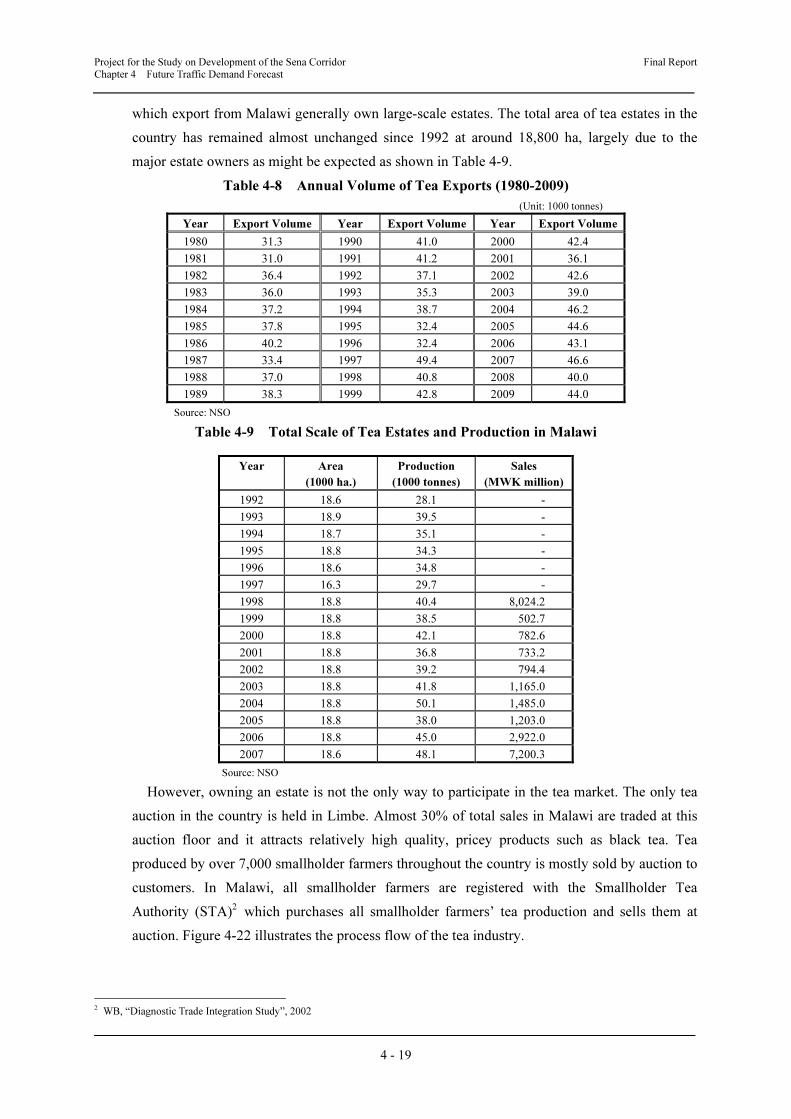
Project for the Study on Development of the Sena Corridor Final Report Chapter 4 Future Traffic Demand Forecast
4 - 19
which export from Malawi generally own large-scale estates. The total area of tea estates in the
country has remained almost unchanged since 1992 at around 18,800 ha, largely due to the
major estate owners as might be expected as shown in Table 4-9.
Table 4-8 Annual Volume of Tea Exports (1980-2009)
(Unit: 1000 tonnes)
Year Export Volume Year Export Volume Year Export Volume
1980 31.3 1990 41.0 2000 42.4
1981 31.0 1991 41.2 2001 36.1
1982 36.4 1992 37.1 2002 42.6
1983 36.0 1993 35.3 2003 39.0
1984 37.2 1994 38.7 2004 46.2
1985 37.8 1995 32.4 2005 44.6
1986 40.2 1996 32.4 2006 43.1
1987 33.4 1997 49.4 2007 46.6
1988 37.0 1998 40.8 2008 40.0
1989 38.3 1999 42.8 2009 44.0
Source: NSO
Table 4-9 Total Scale of Tea Estates and Production in Malawi
Year Area
(1000 ha.)
Production
(1000 tonnes)
Sales
(MWK million)
1992 18.6 28.1 -
1993 18.9 39.5 -
1994 18.7 35.1 -
1995 18.8 34.3 -
1996 18.6 34.8 -
1997 16.3 29.7 -
1998 18.8 40.4 8,024.2
1999 18.8 38.5 502.7
2000 18.8 42.1 782.6
2001 18.8 36.8 733.2
2002 18.8 39.2 794.4
2003 18.8 41.8 1,165.0
2004 18.8 50.1 1,485.0
2005 18.8 38.0 1,203.0
2006 18.8 45.0 2,922.0
2007 18.6 48.1 7,200.3
Source: NSO
However, owning an estate is not the only way to participate in the tea market. The only tea
auction in the country is held in Limbe. Almost 30% of total sales in Malawi are traded at this
auction floor and it attracts relatively high quality, pricey products such as black tea. Tea
produced by over 7,000 smallholder farmers throughout the country is mostly sold by auction to
customers. In Malawi, all smallholder farmers are registered with the Smallholder Tea
Authority (STA)2 which purchases all smallholder farmers’ tea production and sells them at
auction. Figure 4-22 illustrates the process flow of the tea industry.
2 WB, “Diagnostic Trade Integration Study”, 2002
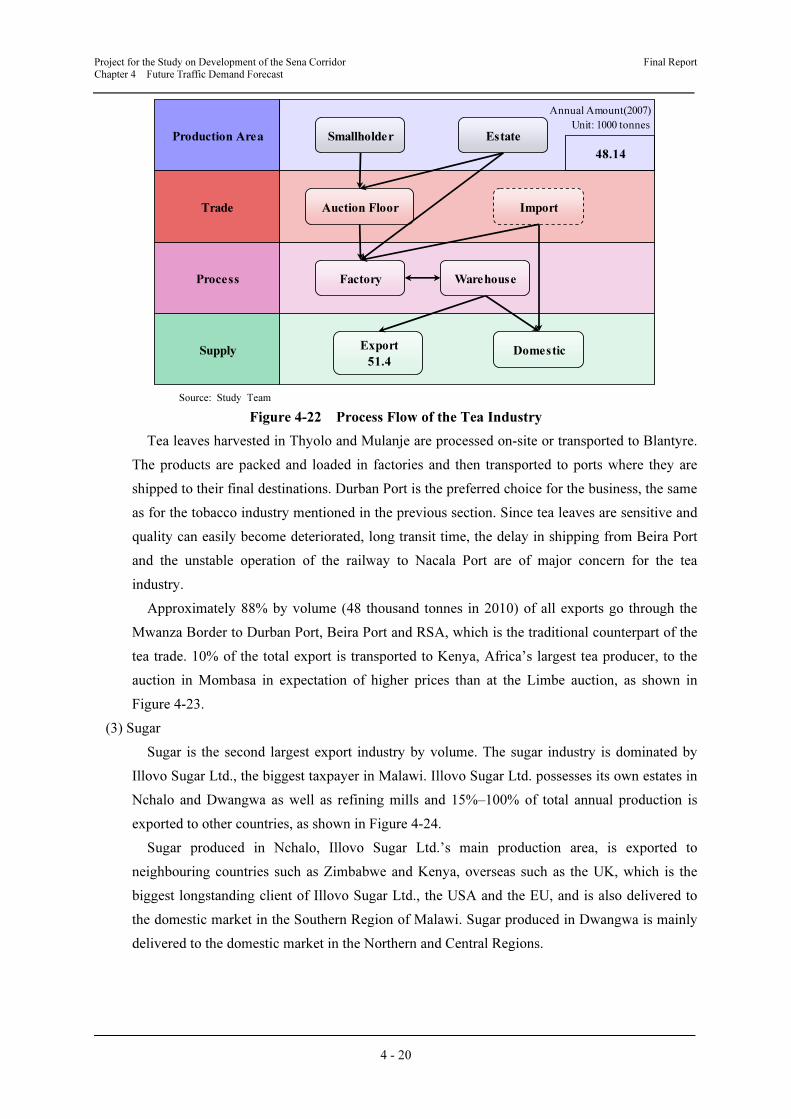
Project for the Study on Development of the Sena Corridor Final Report Chapter 4 Future Traffic Demand Forecast
4 - 20
Source: Study Team
Figure 4-22 Process Flow of the Tea Industry
Tea leaves harvested in Thyolo and Mulanje are processed on-site or transported to Blantyre.
The products are packed and loaded in factories and then transported to ports where they are
shipped to their final destinations. Durban Port is the preferred choice for the business, the same
as for the tobacco industry mentioned in the previous section. Since tea leaves are sensitive and
quality can easily become deteriorated, long transit time, the delay in shipping from Beira Port
and the unstable operation of the railway to Nacala Port are of major concern for the tea
industry.
Approximately 88% by volume (48 thousand tonnes in 2010) of all exports go through the
Mwanza Border to Durban Port, Beira Port and RSA, which is the traditional counterpart of the
tea trade. 10% of the total export is transported to Kenya, Africa’s largest tea producer, to the
auction in Mombasa in expectation of higher prices than at the Limbe auction, as shown in
Figure 4-23.
(3) Sugar
Sugar is the second largest export industry by volume. The sugar industry is dominated by
Illovo Sugar Ltd., the biggest taxpayer in Malawi. Illovo Sugar Ltd. possesses its own estates in
Nchalo and Dwangwa as well as refining mills and 15%–100% of total annual production is
exported to other countries, as shown in Figure 4-24.
Sugar produced in Nchalo, Illovo Sugar Ltd.’s main production area, is exported to
neighbouring countries such as Zimbabwe and Kenya, overseas such as the UK, which is the
biggest longstanding client of Illovo Sugar Ltd., the USA and the EU, and is also delivered to
the domestic market in the Southern Region of Malawi. Sugar produced in Dwangwa is mainly
delivered to the domestic market in the Northern and Central Regions.
Production Area
Supply
Process
Trade
Smallholder
Auction Floor
Factory
Export
51.4
Warehouse
Estate
48.14
Annual Amount(2007)
Unit: 1000 tonnes
Domestic
Import
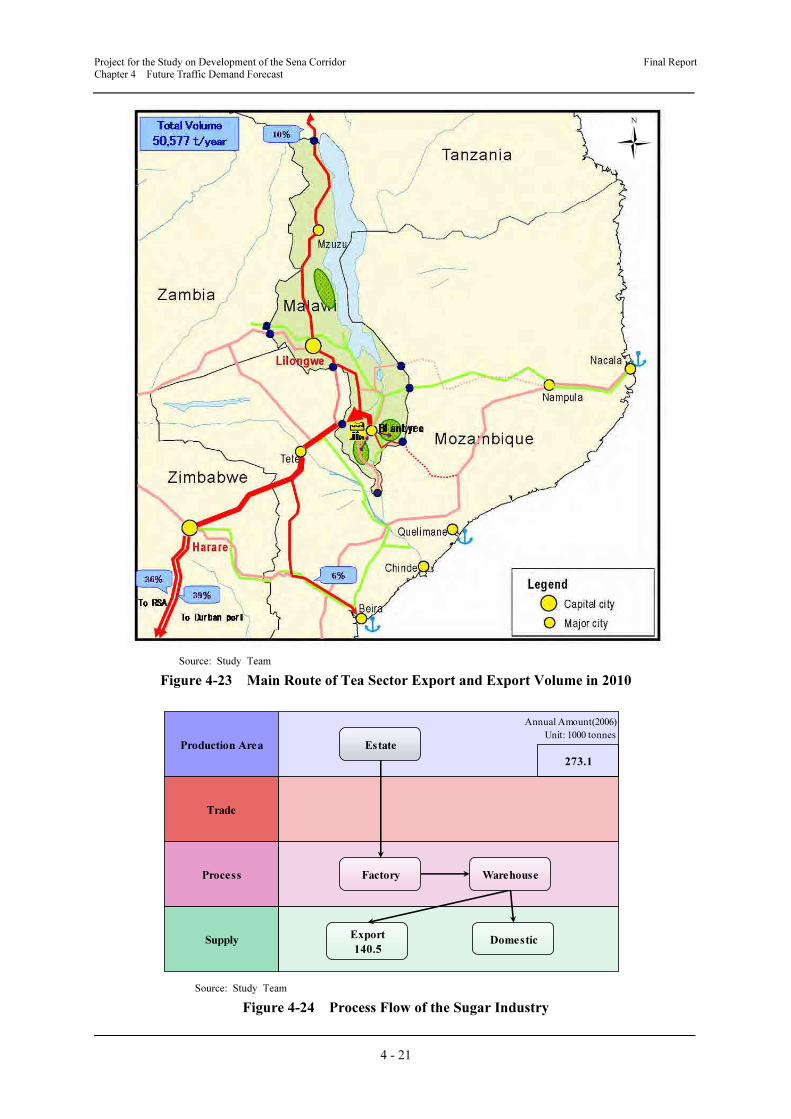
Project for the Study on Development of the Sena Corridor Final Report
Chapter 4 Future Traffic Demand Forecast
4 - 21
Source: Study Team
Figure 4-23 Main Route of Tea Sector Export and Export Volume in 2010
Source: Study Team
Figure 4-24 Process Flow of the Sugar Industry
Production Area
Supply
Process
Trade
Factory
Export
140.5
Warehouse
Estate
273.1
Annual Amount(2006)
Unit: 1000 tonnes
Domestic
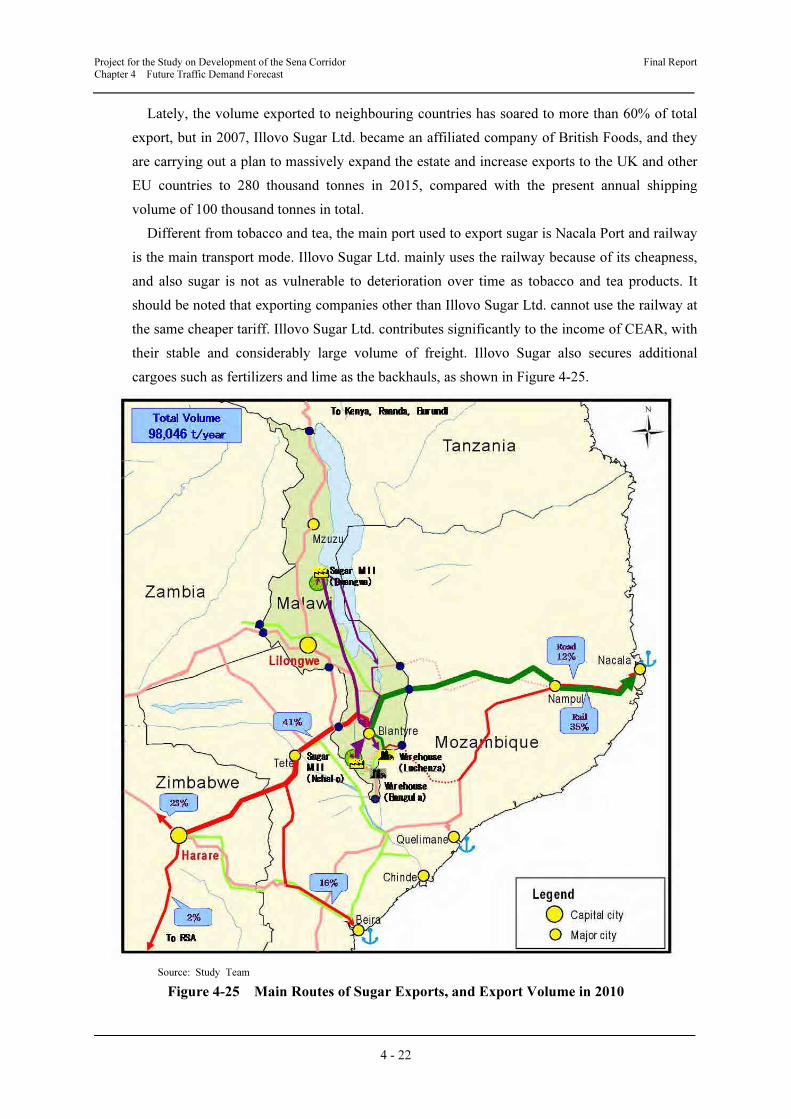
Project for the Study on Development of the Sena Corridor Final Report
Chapter 4 Future Traffic Demand Forecast
4 - 22
Lately, the volume exported to neighbouring countries has soared to more than 60% of total
export, but in 2007, Illovo Sugar Ltd. became an affiliated company of British Foods, and they
are carrying out a plan to massively expand the estate and increase exports to the UK and other
EU countries to 280 thousand tonnes in 2015, compared with the present annual shipping
volume of 100 thousand tonnes in total.
Different from tobacco and tea, the main port used to export sugar is Nacala Port and railway
is the main transport mode. Illovo Sugar Ltd. mainly uses the railway because of its cheapness,
and also sugar is not as vulnerable to deterioration over time as tobacco and tea products. It
should be noted that exporting companies other than Illovo Sugar Ltd. cannot use the railway at
the same cheaper tariff. Illovo Sugar Ltd. contributes significantly to the income of CEAR, with
their stable and considerably large volume of freight. Illovo Sugar also secures additional
cargoes such as fertilizers and lime as the backhauls, as shown in Figure 4-25.
Source: Study Team
Figure 4-25 Main Routes of Sugar Exports, and Export Volume in 2010
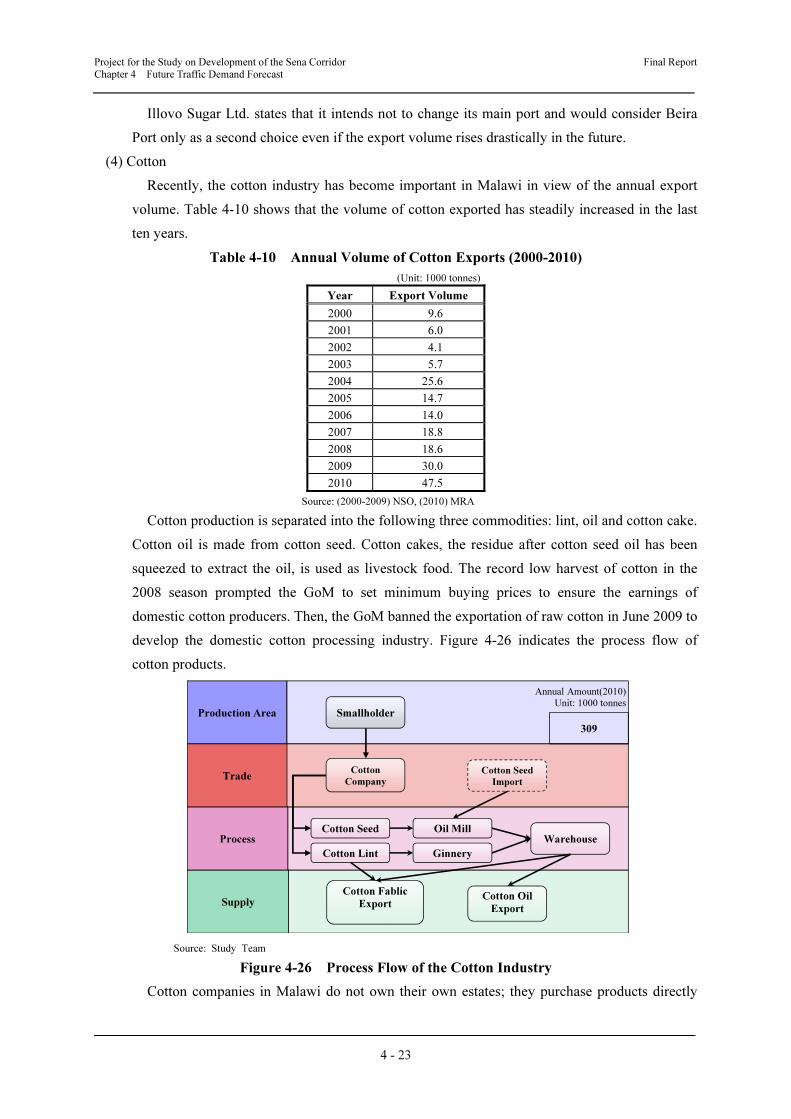
Project for the Study on Development of the Sena Corridor Final Report Chapter 4 Future Traffic Demand Forecast
4 - 23
Illovo Sugar Ltd. states that it intends not to change its main port and would consider Beira
Port only as a second choice even if the export volume rises drastically in the future.
(4) Cotton
Recently, the cotton industry has become important in Malawi in view of the annual export
volume. Table 4-10 shows that the volume of cotton exported has steadily increased in the last
ten years.
Table 4-10 Annual Volume of Cotton Exports (2000-2010)
(Unit: 1000 tonnes)
Year Export Volume
2000 9.6
2001 6.0
2002 4.1
2003 5.7
2004 25.6
2005 14.7
2006 14.0
2007 18.8
2008 18.6
2009 30.0
2010 47.5
Source: (2000-2009) NSO, (2010) MRA
Cotton production is separated into the following three commodities: lint, oil and cotton cake.
Cotton oil is made from cotton seed. Cotton cakes, the residue after cotton seed oil has been
squeezed to extract the oil, is used as livestock food. The record low harvest of cotton in the
2008 season prompted the GoM to set minimum buying prices to ensure the earnings of
domestic cotton producers. Then, the GoM banned the exportation of raw cotton in June 2009 to
develop the domestic cotton processing industry. Figure 4-26 indicates the process flow of
cotton products.
Source: Study Team
Figure 4-26 Process Flow of the Cotton Industry
Cotton companies in Malawi do not own their own estates; they purchase products directly
Production Area
Supply
Process
Trade
Smallholder
Cotton Fablic
Export
Warehouse
Annual Amount(2010)
Unit: 1000 tonnes
Cotton Seed
Import
Cotton Lint
Cotton Seed Oil Mill
Ginnery
Cotton Oil
Export
Cotton
Company
309
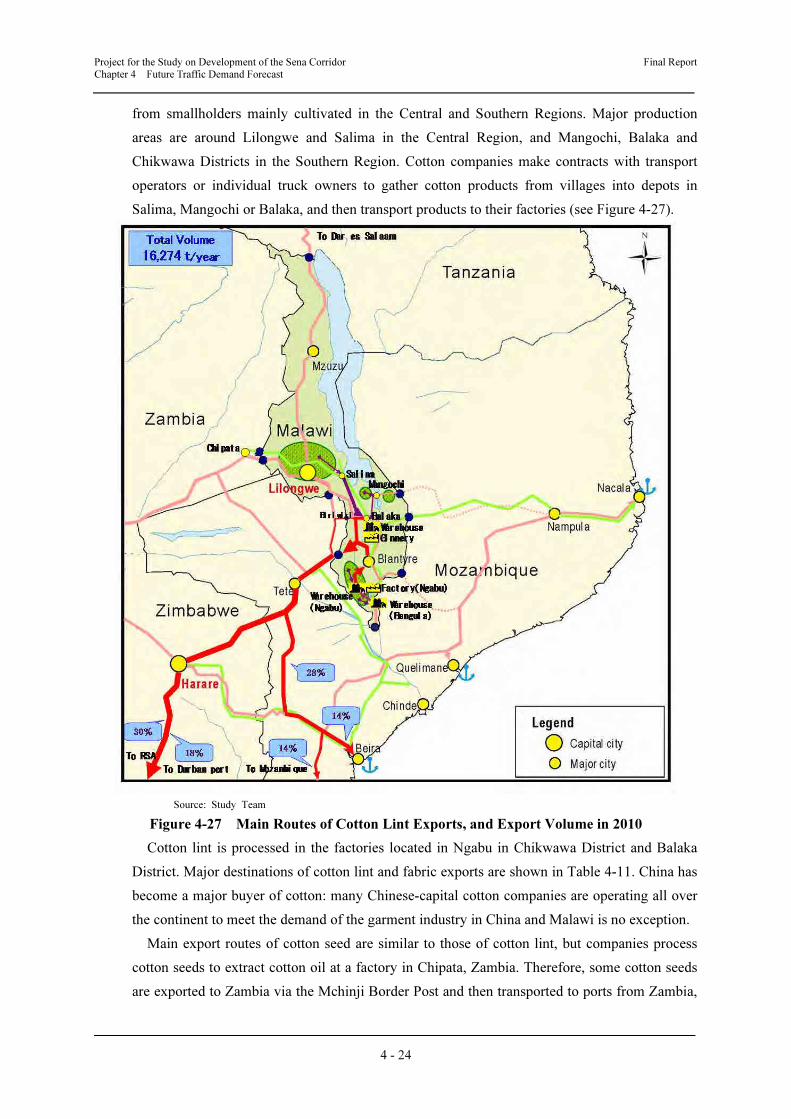
Project for the Study on Development of the Sena Corridor Final Report
Chapter 4 Future Traffic Demand Forecast
4 - 24
from smallholders mainly cultivated in the Central and Southern Regions. Major production
areas are around Lilongwe and Salima in the Central Region, and Mangochi, Balaka and
Chikwawa Districts in the Southern Region. Cotton companies make contracts with transport
operators or individual truck owners to gather cotton products from villages into depots in
Salima, Mangochi or Balaka, and then transport products to their factories (see Figure 4-27).
Source: Study Team
Figure 4-27 Main Routes of Cotton Lint Exports, and Export Volume in 2010
Cotton lint is processed in the factories located in Ngabu in Chikwawa District and Balaka
District. Major destinations of cotton lint and fabric exports are shown in Table 4-11. China has
become a major buyer of cotton: many Chinese-capital cotton companies are operating all over
the continent to meet the demand of the garment industry in China and Malawi is no exception.
Main export routes of cotton seed are similar to those of cotton lint, but companies process
cotton seeds to extract cotton oil at a factory in Chipata, Zambia. Therefore, some cotton seeds
are exported to Zambia via the Mchinji Border Post and then transported to ports from Zambia,

Project for the Study on Development of the Sena Corridor Final Report
Chapter 4 Future Traffic Demand Forecast
4 - 25
as shown in Figure 4-28.
Table 4-11 Major Destinations of Cotton Lint and Fabric Exports (2010)
(Unit: tonne)
Destination Export Volume
1 Asia 5,865.2
2 EU 4,358.5
3 Mozambique 3,345.2
4 South Africa 1,359.2
5 Other Africa 505.3
6 Zimbabwe 263.5
7 SADC 257.4
8 Zambia 168.9
9 North America 50.5
Total Export Volume 16,173.8
Source: 2010 Custom data, MRA
Source: Study Team
Figure 4-28 Main Routes of Cotton Seed Exports, and Export Volume in 2010
Great Lakes, Malawi’s leading cotton-exporting company rents warehouses from other
companies in Bangula through which the branch line of the Sena Railway ran and where a
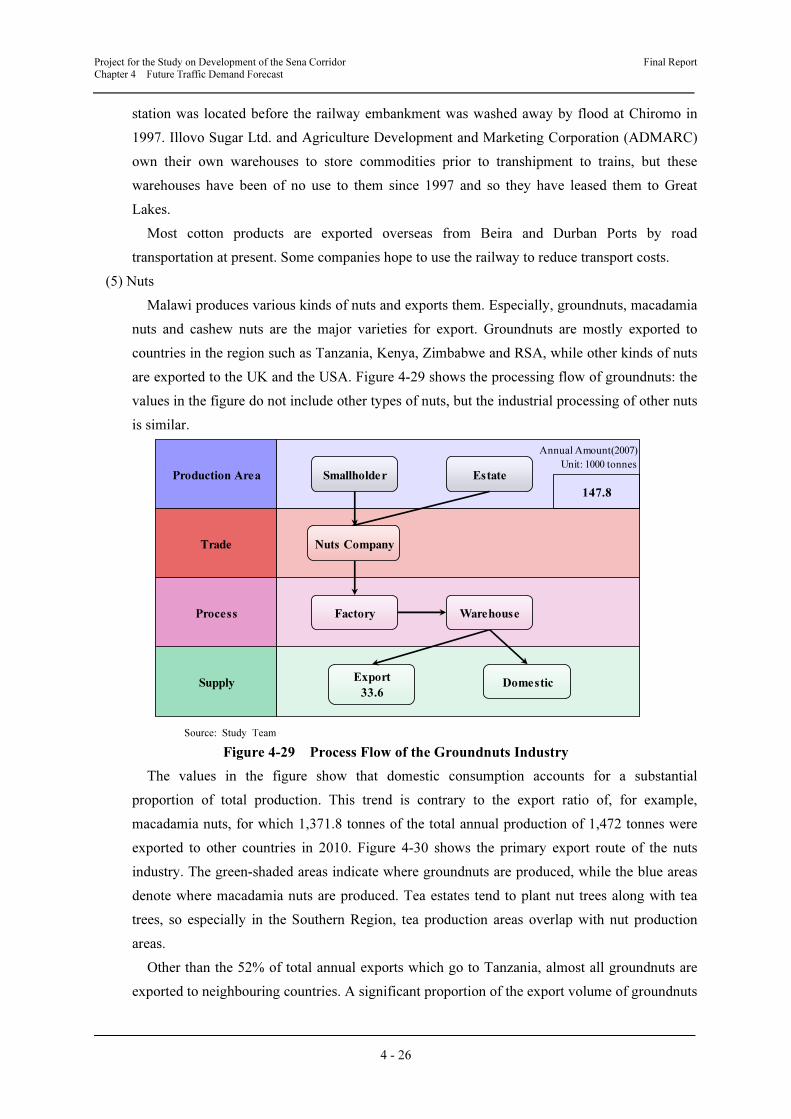
Project for the Study on Development of the Sena Corridor Final Report Chapter 4 Future Traffic Demand Forecast
4 - 26
station was located before the railway embankment was washed away by flood at Chiromo in
1997. Illovo Sugar Ltd. and Agriculture Development and Marketing Corporation (ADMARC)
own their own warehouses to store commodities prior to transhipment to trains, but these
warehouses have been of no use to them since 1997 and so they have leased them to Great
Lakes.
Most cotton products are exported overseas from Beira and Durban Ports by road
transportation at present. Some companies hope to use the railway to reduce transport costs.
(5) Nuts
Malawi produces various kinds of nuts and exports them. Especially, groundnuts, macadamia
nuts and cashew nuts are the major varieties for export. Groundnuts are mostly exported to
countries in the region such as Tanzania, Kenya, Zimbabwe and RSA, while other kinds of nuts
are exported to the UK and the USA. Figure 4-29 shows the processing flow of groundnuts: the
values in the figure do not include other types of nuts, but the industrial processing of other nuts
is similar.
Source: Study Team
Figure 4-29 Process Flow of the Groundnuts Industry
The values in the figure show that domestic consumption accounts for a substantial
proportion of total production. This trend is contrary to the export ratio of, for example,
macadamia nuts, for which 1,371.8 tonnes of the total annual production of 1,472 tonnes were
exported to other countries in 2010. Figure 4-30 shows the primary export route of the nuts
industry. The green-shaded areas indicate where groundnuts are produced, while the blue areas
denote where macadamia nuts are produced. Tea estates tend to plant nut trees along with tea
trees, so especially in the Southern Region, tea production areas overlap with nut production
areas.
Other than the 52% of total annual exports which go to Tanzania, almost all groundnuts are
exported to neighbouring countries. A significant proportion of the export volume of groundnuts
Production Area
Supply
Process
Trade
Smallholder
Factory
Export
33.6
Warehouse
Estate
147.8
Annual Amount(2007)
Unit: 1000 tonnes
Domestic
Nuts Company

Project for the Study on Development of the Sena Corridor Final Report
Chapter 4 Future Traffic Demand Forecast
4 - 27
(81.5% in 2010) is transported outside of the country across the Songwe Border. Moreover, the
major production areas of groundnuts are clustered in the Central Region, such as Lilongwe
Rural, Mchinji, Dowa, Kasungu and other districts neighbouring Lilongwe. Hence,
transportation of groundnuts does not seem to influence logistics in the Study Area. On the
contrary, the major production areas of macadamia nuts are located in the Study Area and the
nuts are exported to countries on other continents. However, the total export volume of
macadamia nuts is only around 1.5 thousand tonnes, which is a mere 1% of tobacco exports and
1.5% of sugar exports, and even is not more than 7% of groundnut exports. This means that the
transportation of macadamia nuts can have little impact on the logistics of the Study Area.
Durban and Beira Ports are the main ports used for exporting nuts.
Source: Study Team
Figure 4-30 Main Routes of Nut Export, and Export Volume in 2010
(6) Pulses
Pulses are an important agricultural product of Malawi with typical ones being ordinary
beans, ground beans, soya beans, pigeon peas and cow peas. Figure 4-31 shows the process flow
of the pulses industry. Among them, soya beans and pigeon peas are major exports, whereas
others are mainly consumed within the country. The main production areas of soya beans are
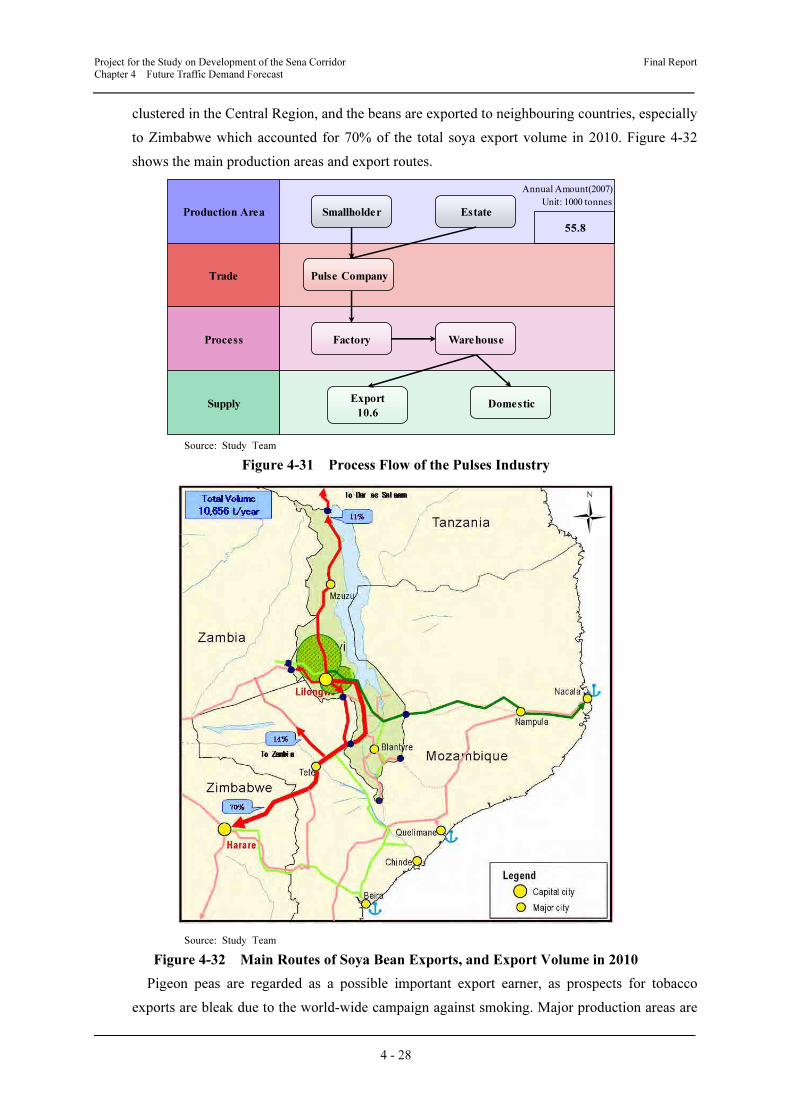
Project for the Study on Development of the Sena Corridor Final Report
Chapter 4 Future Traffic Demand Forecast
4 - 28
clustered in the Central Region, and the beans are exported to neighbouring countries, especially
to Zimbabwe which accounted for 70% of the total soya export volume in 2010. Figure 4-32
shows the main production areas and export routes.
Source: Study Team
Figure 4-31 Process Flow of the Pulses Industry
Source: Study Team
Figure 4-32 Main Routes of Soya Bean Exports, and Export Volume in 2010
Pigeon peas are regarded as a possible important export earner, as prospects for tobacco
exports are bleak due to the world-wide campaign against smoking. Major production areas are
Production Area
Supply
Process
Trade
Smallholder
Factory
Export
10.6
Warehouse
Estate
55.8
Annual Amount(2007)
Unit: 1000 tonnes
Domestic
Pulse Company
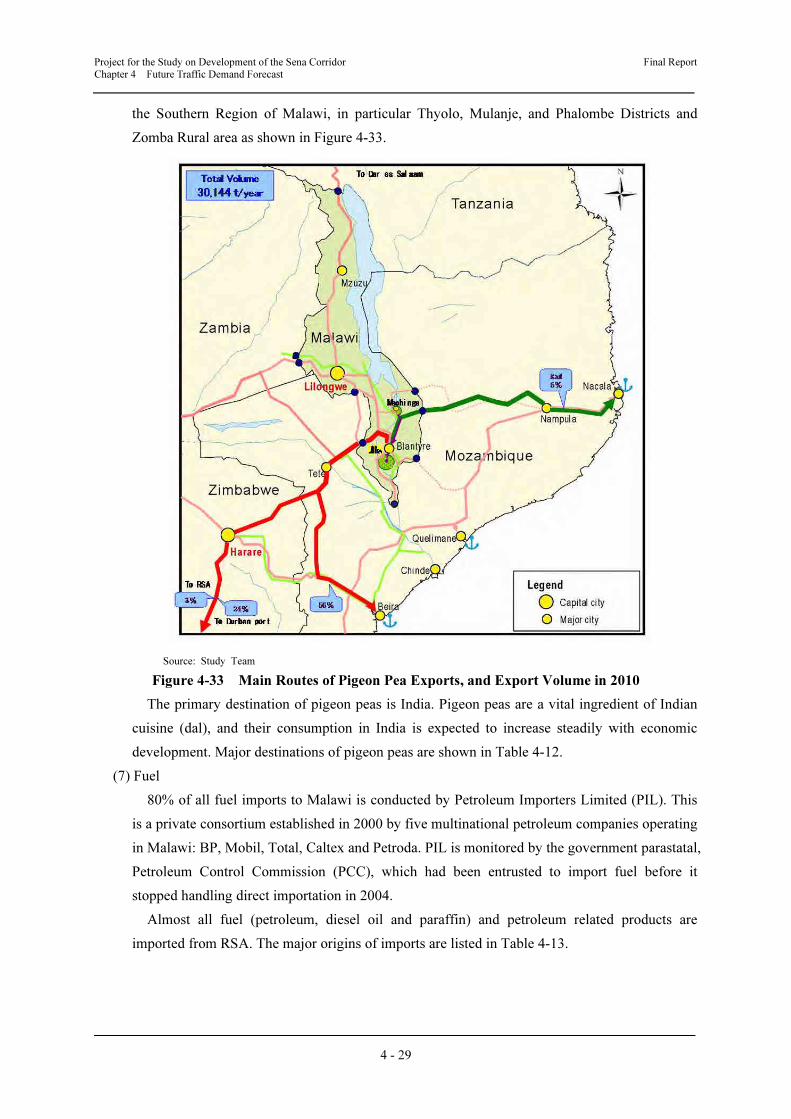
Project for the Study on Development of the Sena Corridor Final Report
Chapter 4 Future Traffic Demand Forecast
4 - 29
the Southern Region of Malawi, in particular Thyolo, Mulanje, and Phalombe Districts and
Zomba Rural area as shown in Figure 4-33.
Source: Study Team
Figure 4-33 Main Routes of Pigeon Pea Exports, and Export Volume in 2010
The primary destination of pigeon peas is India. Pigeon peas are a vital ingredient of Indian
cuisine (dal), and their consumption in India is expected to increase steadily with economic
development. Major destinations of pigeon peas are shown in Table 4-12.
(7) Fuel
80% of all fuel imports to Malawi is conducted by Petroleum Importers Limited (PIL). This
is a private consortium established in 2000 by five multinational petroleum companies operating
in Malawi: BP, Mobil, Total, Caltex and Petroda. PIL is monitored by the government parastatal,
Petroleum Control Commission (PCC), which had been entrusted to import fuel before it
stopped handling direct importation in 2004.
Almost all fuel (petroleum, diesel oil and paraffin) and petroleum related products are
imported from RSA. The major origins of imports are listed in Table 4-13.
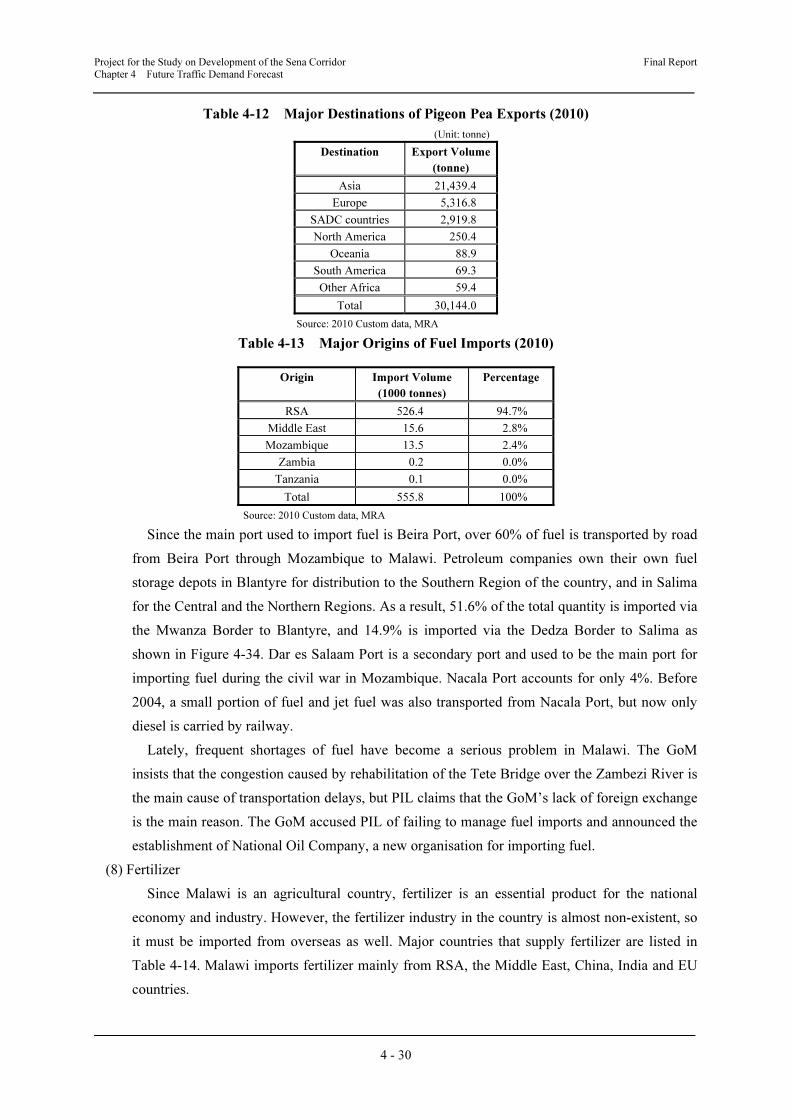
Project for the Study on Development of the Sena Corridor Final Report Chapter 4 Future Traffic Demand Forecast
4 - 30
Table 4-12 Major Destinations of Pigeon Pea Exports (2010)
(Unit: tonne)
Destination Export Volume
(tonne)
Asia 21,439.4
Europe 5,316.8
SADC countries 2,919.8
North America 250.4
Oceania 88.9
South America 69.3
Other Africa 59.4
Total 30,144.0
Source: 2010 Custom data, MRA
Table 4-13 Major Origins of Fuel Imports (2010)
Origin Import Volume
(1000 tonnes)
Percentage
RSA 526.4 94.7%
Middle East 15.6 2.8%
Mozambique 13.5 2.4%
Zambia 0.2 0.0%
Tanzania 0.1 0.0%
Total 555.8 100%
Source: 2010 Custom data, MRA
Since the main port used to import fuel is Beira Port, over 60% of fuel is transported by road
from Beira Port through Mozambique to Malawi. Petroleum companies own their own fuel
storage depots in Blantyre for distribution to the Southern Region of the country, and in Salima
for the Central and the Northern Regions. As a result, 51.6% of the total quantity is imported via
the Mwanza Border to Blantyre, and 14.9% is imported via the Dedza Border to Salima as
shown in Figure 4-34. Dar es Salaam Port is a secondary port and used to be the main port for
importing fuel during the civil war in Mozambique. Nacala Port accounts for only 4%. Before
2004, a small portion of fuel and jet fuel was also transported from Nacala Port, but now only
diesel is carried by railway.
Lately, frequent shortages of fuel have become a serious problem in Malawi. The GoM
insists that the congestion caused by rehabilitation of the Tete Bridge over the Zambezi River is
the main cause of transportation delays, but PIL claims that the GoM’s lack of foreign exchange
is the main reason. The GoM accused PIL of failing to manage fuel imports and announced the
establishment of National Oil Company, a new organisation for importing fuel.
(8) Fertilizer
Since Malawi is an agricultural country, fertilizer is an essential product for the national
economy and industry. However, the fertilizer industry in the country is almost non-existent, so
it must be imported from overseas as well. Major countries that supply fertilizer are listed in
Table 4-14. Malawi imports fertilizer mainly from RSA, the Middle East, China, India and EU
countries.

Project for the Study on Development of the Sena Corridor Final Report
Chapter 4 Future Traffic Demand Forecast
4 - 31
Source: Study Team
Figure 4-34 Main Routes of Fuel Imports, and Import Volume in 2010
Table 4-14 Major Origins of Fertilizer Imports (2010)
Origin Import Volume
(1000 tonnes)
Percentage
South Africa 87.4 26%
UAE 49.5 15%
China 46.9 14%
India 30.7 9%
Switzerland 25.7 8%
Egypt 13.1 4%
Belgium 9.9 3%
Netherlands 9.4 3%
Norway 9.0 3%
Bahrain 8.1 2%
Others 43.1 13%
Total 332.8 100%
Source: 2010 Custom data, MRA
Domestic demand for fertilizer has been increasing steadily, and the annual import volume in
2010 was 5.7 times that of a decade ago: 58.2 thousand tonnes in 2000.
The largest customer in this sector is the GoM, which supports poor farmers (most of the
farmers living in the countryside) by providing coupons to purchase fertilizer at a government
subsidized price.
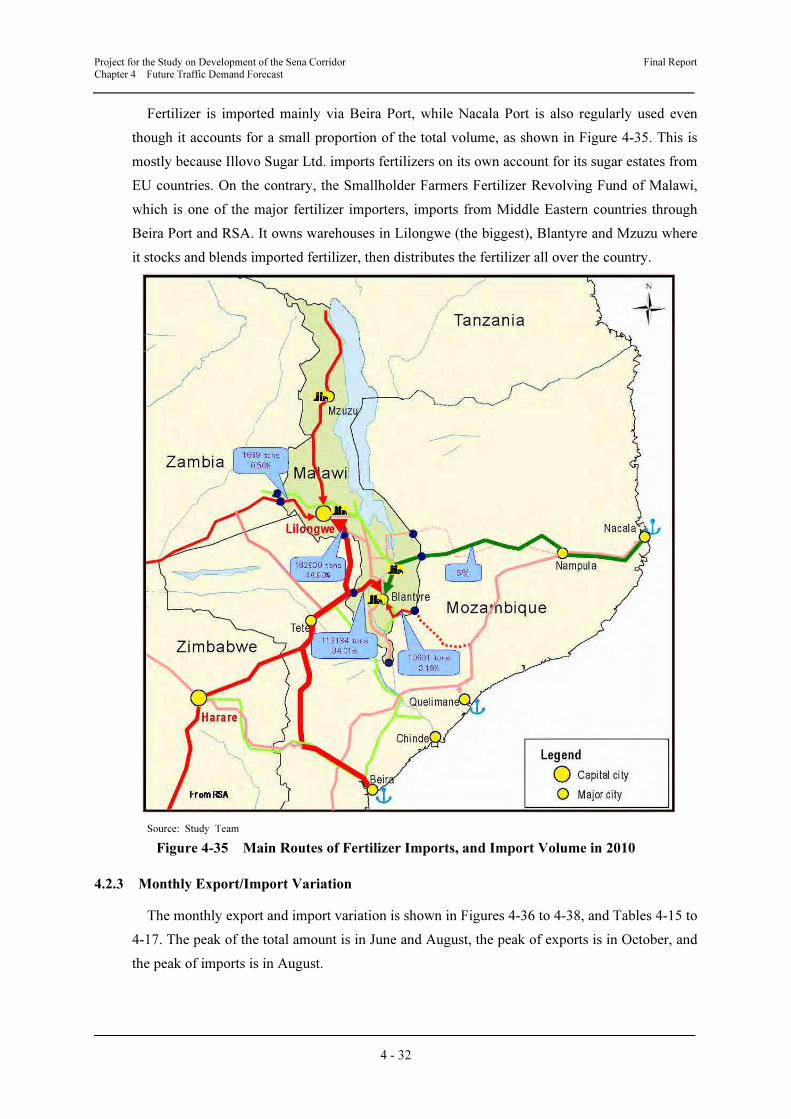
Project for the Study on Development of the Sena Corridor Final Report
Chapter 4 Future Traffic Demand Forecast
4 - 32
Fertilizer is imported mainly via Beira Port, while Nacala Port is also regularly used even
though it accounts for a small proportion of the total volume, as shown in Figure 4-35. This is
mostly because Illovo Sugar Ltd. imports fertilizers on its own account for its sugar estates from
EU countries. On the contrary, the Smallholder Farmers Fertilizer Revolving Fund of Malawi,
which is one of the major fertilizer importers, imports from Middle Eastern countries through
Beira Port and RSA. It owns warehouses in Lilongwe (the biggest), Blantyre and Mzuzu where
it stocks and blends imported fertilizer, then distributes the fertilizer all over the country.
Source: Study Team
Figure 4-35 Main Routes of Fertilizer Imports, and Import Volume in 2010
4.2.3 Monthly Export/Import Variation
The monthly export and import variation is shown in Figures 4-36 to 4-38, and Tables 4-15 to
4-17. The peak of the total amount is in June and August, the peak of exports is in October, and
the peak of imports is in August.

Project for the Study on Development of the Sena Corridor Final Report Chapter 4 Future Traffic Demand Forecast
4 - 33
Source: 2010 Customs data, MRA
Figure 4-36 Monthly Export/Import Variation
Table 4-15 Monthly Export/Import Index
Month Export Import Total
January 7.7% 6.6% 6.8%
February 8.7% 8.5% 8.5%
March 6.3% 6.2% 6.2%
April 6.3% 6.2% 6.2%
May 6.5% 6.8% 6.7%
June 9.0% 12.2% 11.4%
July 7.7% 7.7% 7.7%
August 8.0% 12.5% 11.4%
September 10.0% 8.5% 8.9%
October 10.9% 9.4% 9.7%
November 9.1% 10.0% 9.8%
December 9.8% 5.5% 6.6%
Total 100% 100% 100%
Source: 2010 Customs data, MRA
Source: 2010 Customs data, MRA
Figure 4-37 Monthly Export Variation by Main Commodity
0
50
100
150
200
250
300
Jan Feb Mar Apr May Jun Jul Aug Sep Oct Nov Dec
tonne(' 000)
Import
Export
0
10
20
30
40
50
60
70
Jan Feb Mar Apr May Jun Jul Aug Sep Oct Nov Dec
Month
Volume (1000 tonnes)
Others
Rice
Coffee
Groundnuts
Cotton
Pegeon peas
Tea
Sugar
Tobacco
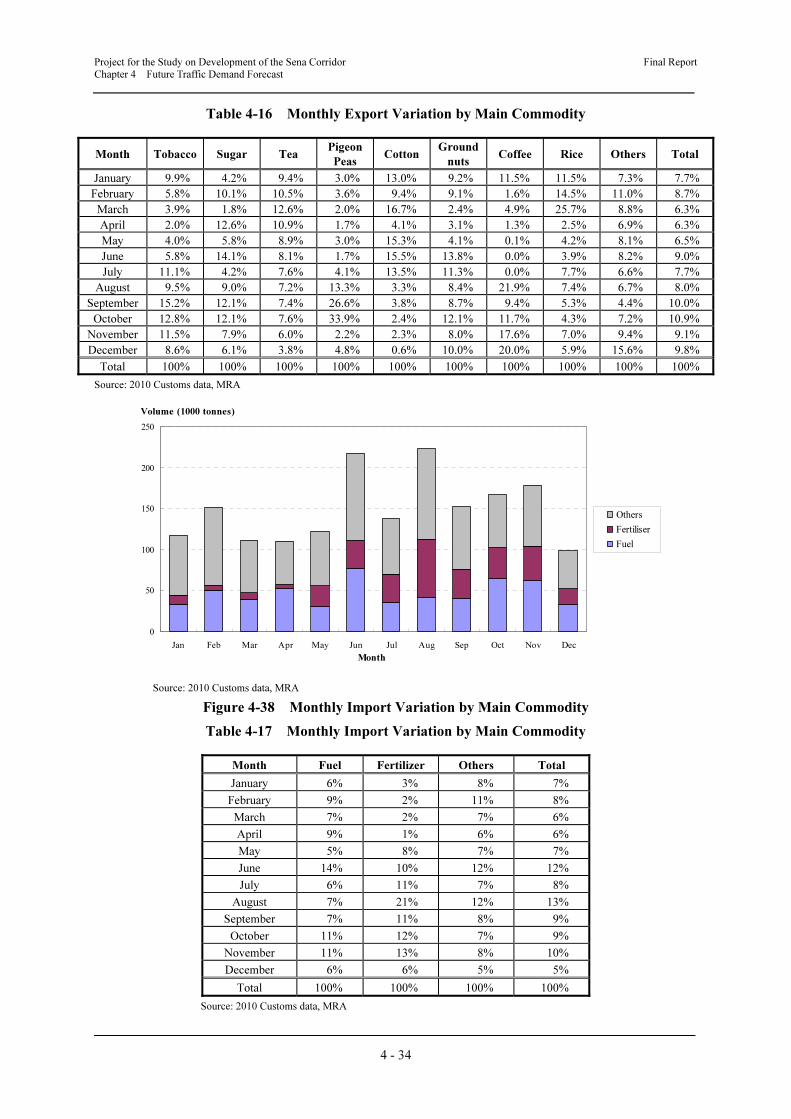
Project for the Study on Development of the Sena Corridor Final Report Chapter 4 Future Traffic Demand Forecast
4 - 34
Table 4-16 Monthly Export Variation by Main Commodity
Month Tobacco Sugar Tea Pigeon
Peas Cotton
Ground
nuts Coffee Rice Others Total
January 9.9% 4.2% 9.4% 3.0% 13.0% 9.2% 11.5% 11.5% 7.3% 7.7%
February 5.8% 10.1% 10.5% 3.6% 9.4% 9.1% 1.6% 14.5% 11.0% 8.7%
March 3.9% 1.8% 12.6% 2.0% 16.7% 2.4% 4.9% 25.7% 8.8% 6.3%
April 2.0% 12.6% 10.9% 1.7% 4.1% 3.1% 1.3% 2.5% 6.9% 6.3%
May 4.0% 5.8% 8.9% 3.0% 15.3% 4.1% 0.1% 4.2% 8.1% 6.5%
June 5.8% 14.1% 8.1% 1.7% 15.5% 13.8% 0.0% 3.9% 8.2% 9.0%
July 11.1% 4.2% 7.6% 4.1% 13.5% 11.3% 0.0% 7.7% 6.6% 7.7%
August 9.5% 9.0% 7.2% 13.3% 3.3% 8.4% 21.9% 7.4% 6.7% 8.0%
September 15.2% 12.1% 7.4% 26.6% 3.8% 8.7% 9.4% 5.3% 4.4% 10.0%
October 12.8% 12.1% 7.6% 33.9% 2.4% 12.1% 11.7% 4.3% 7.2% 10.9%
November 11.5% 7.9% 6.0% 2.2% 2.3% 8.0% 17.6% 7.0% 9.4% 9.1%
December 8.6% 6.1% 3.8% 4.8% 0.6% 10.0% 20.0% 5.9% 15.6% 9.8%
Total 100% 100% 100% 100% 100% 100% 100% 100% 100% 100%
Source: 2010 Customs data, MRA
Source: 2010 Customs data, MRA
Figure 4-38 Monthly Import Variation by Main Commodity
Table 4-17 Monthly Import Variation by Main Commodity
Month Fuel Fertilizer Others Total
January 6% 3% 8% 7%
February 9% 2% 11% 8%
March 7% 2% 7% 6%
April 9% 1% 6% 6%
May 5% 8% 7% 7%
June 14% 10% 12% 12%
July 6% 11% 7% 8%
August 7% 21% 12% 13%
September 7% 11% 8% 9%
October 11% 12% 7% 9%
November 11% 13% 8% 10%
December 6% 6% 5% 5%
Total 100% 100% 100% 100%
Source: 2010 Customs data, MRA
0
50
100
150
200
250
Jan Feb Mar Apr May Jun Jul Aug Sep Oct Nov Dec
Month
Volume (1000 tonnes)
Others
Fertiliser
Fuel
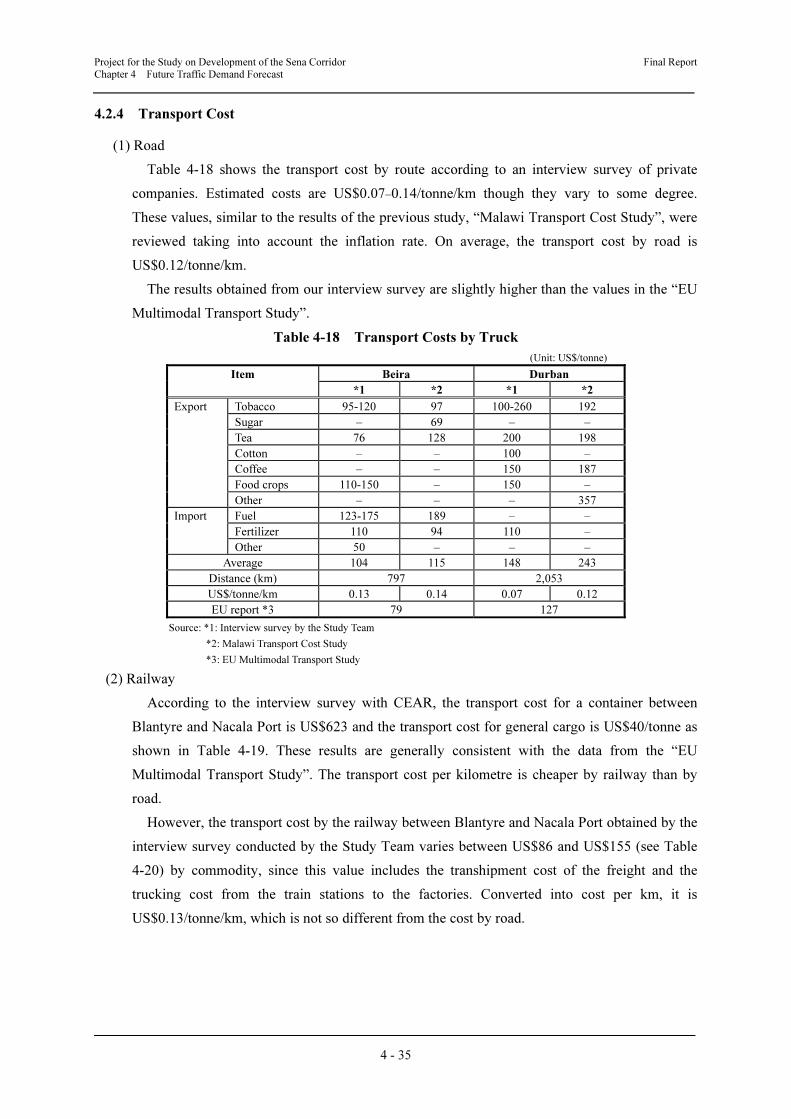
Project for the Study on Development of the Sena Corridor Final Report Chapter 4 Future Traffic Demand Forecast
4 - 35
4.2.4 Transport Cost
(1) Road
Table 4-18 shows the transport cost by route according to an interview survey of private
companies. Estimated costs are US$0.07–0.14/tonne/km though they vary to some degree.
These values, similar to the results of the previous study, “Malawi Transport Cost Study”, were
reviewed taking into account the inflation rate. On average, the transport cost by road is
US$0.12/tonne/km.
The results obtained from our interview survey are slightly higher than the values in the “EU
Multimodal Transport Study”.
Table 4-18 Transport Costs by Truck
(Unit: US$/tonne)
Item Beira Durban
*1 *2 *1 *2
Export Tobacco 95-120 97 100-260 192
Sugar – 69 – –
Tea 76 128 200 198
Cotton – – 100 –
Coffee – – 150 187
Food crops 110-150 – 150 –
Other – – – 357
Import Fuel 123-175 189 – –
Fertilizer 110 94 110 –
Other 50 – – –
Average 104 115 148 243
Distance (km) 797 2,053
US$/tonne/km 0.13 0.14 0.07 0.12
EU report *3 79 127
Source: *1: Interview survey by the Study Team
*2: Malawi Transport Cost Study
*3: EU Multimodal Transport Study
(2) Railway
According to the interview survey with CEAR, the transport cost for a container between
Blantyre and Nacala Port is US$623 and the transport cost for general cargo is US$40/tonne as
shown in Table 4-19. These results are generally consistent with the data from the “EU
Multimodal Transport Study”. The transport cost per kilometre is cheaper by railway than by
road.
However, the transport cost by the railway between Blantyre and Nacala Port obtained by the
interview survey conducted by the Study Team varies between US$86 and US$155 (see Table
4-20) by commodity, since this value includes the transhipment cost of the freight and the
trucking cost from the train stations to the factories. Converted into cost per km, it is
US$0.13/tonne/km, which is not so different from the cost by road.
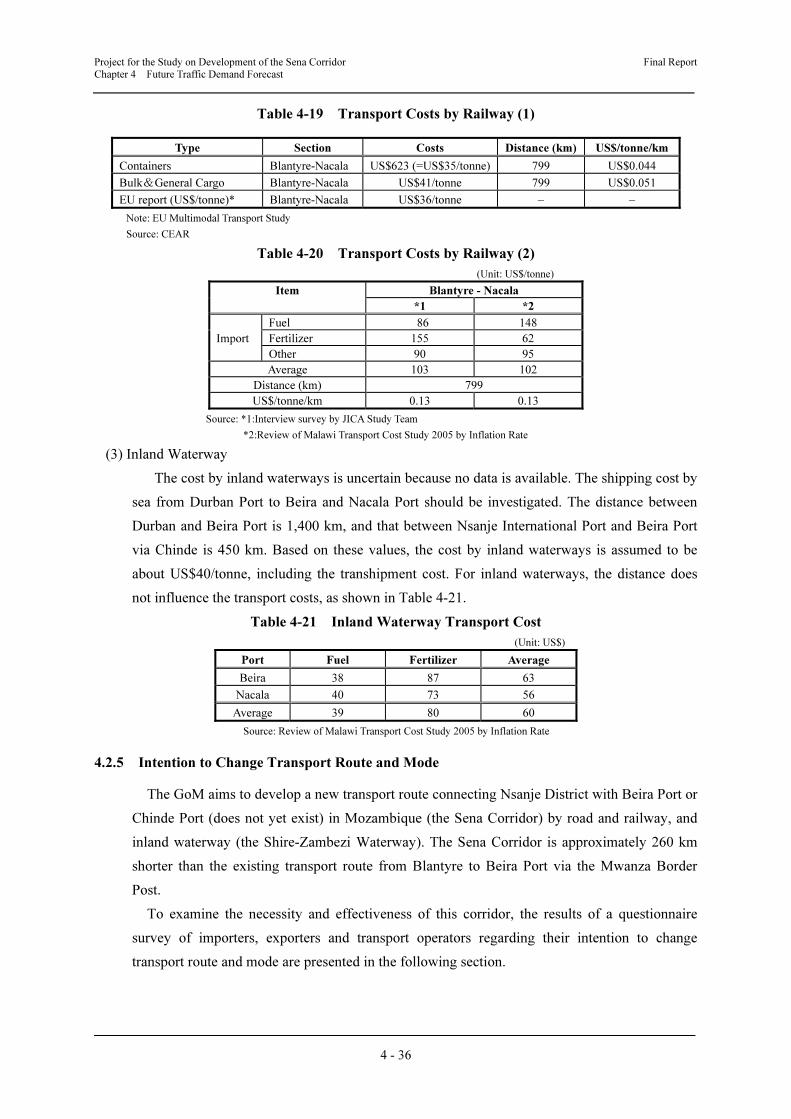
Project for the Study on Development of the Sena Corridor Final Report Chapter 4 Future Traffic Demand Forecast
4 - 36
Table 4-19 Transport Costs by Railway (1)
Type Section Costs Distance (km) US$/tonne/km
Containers Blantyre-Nacala US$623 (=US$35/tonne) 799 US$0.044
Bulk&General Cargo Blantyre-Nacala US$41/tonne 799 US$0.051
EU report (US$/tonne)* Blantyre-Nacala US$36/tonne – –
Note: EU Multimodal Transport Study
Source: CEAR
Table 4-20 Transport Costs by Railway (2)
(Unit: US$/tonne)
Item Blantyre - Nacala
*1 *2
Import
Fuel 86 148
Fertilizer 155 62
Other 90 95
Average 103 102
Distance (km) 799
US$/tonne/km 0.13 0.13
Source: *1:Interview survey by JICA Study Team
*2:Review of Malawi Transport Cost Study 2005 by Inflation Rate
(3) Inland Waterway
The cost by inland waterways is uncertain because no data is available. The shipping cost by
sea from Durban Port to Beira and Nacala Port should be investigated. The distance between
Durban and Beira Port is 1,400 km, and that between Nsanje International Port and Beira Port
via Chinde is 450 km. Based on these values, the cost by inland waterways is assumed to be
about US$40/tonne, including the transhipment cost. For inland waterways, the distance does
not influence the transport costs, as shown in Table 4-21.
Table 4-21 Inland Waterway Transport Cost
(Unit: US$)
Port Fuel Fertilizer Average
Beira 38 87 63
Nacala 40 73 56
Average 39 80 60
Source: Review of Malawi Transport Cost Study 2005 by Inflation Rate
4.2.5 Intention to Change Transport Route and Mode
The GoM aims to develop a new transport route connecting Nsanje District with Beira Port or
Chinde Port (does not yet exist) in Mozambique (the Sena Corridor) by road and railway, and
inland waterway (the Shire-Zambezi Waterway). The Sena Corridor is approximately 260 km
shorter than the existing transport route from Blantyre to Beira Port via the Mwanza Border
Post.
To examine the necessity and effectiveness of this corridor, the results of a questionnaire
survey of importers, exporters and transport operators regarding their intention to change
transport route and mode are presented in the following section.
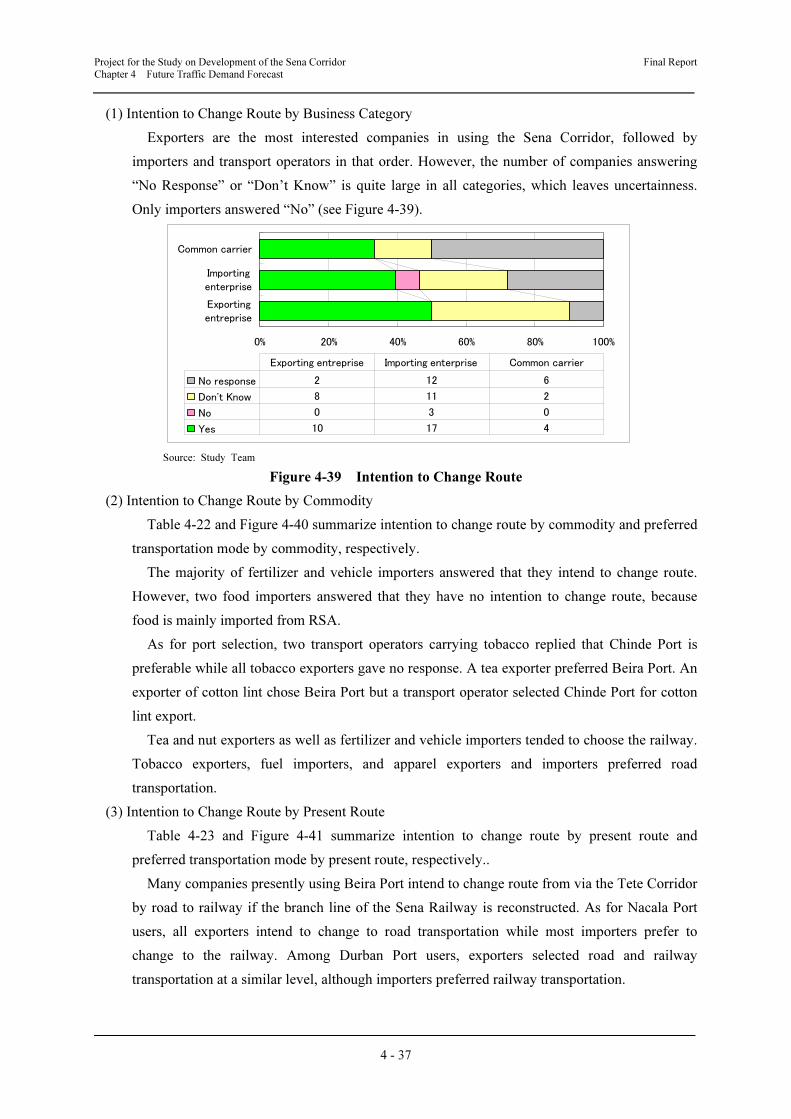
Project for the Study on Development of the Sena Corridor Final Report Chapter 4 Future Traffic Demand Forecast
4 - 37
(1) Intention to Change Route by Business Category
Exporters are the most interested companies in using the Sena Corridor, followed by
importers and transport operators in that order. However, the number of companies answering
“No Response” or “Don’t Know” is quite large in all categories, which leaves uncertainness.
Only importers answered “No” (see Figure 4-39).
Source: Study Team
Figure 4-39 Intention to Change Route
(2) Intention to Change Route by Commodity
Table 4-22 and Figure 4-40 summarize intention to change route by commodity and preferred
transportation mode by commodity, respectively.
The majority of fertilizer and vehicle importers answered that they intend to change route.
However, two food importers answered that they have no intention to change route, because
food is mainly imported from RSA.
As for port selection, two transport operators carrying tobacco replied that Chinde Port is
preferable while all tobacco exporters gave no response. A tea exporter preferred Beira Port. An
exporter of cotton lint chose Beira Port but a transport operator selected Chinde Port for cotton
lint export.
Tea and nut exporters as well as fertilizer and vehicle importers tended to choose the railway.
Tobacco exporters, fuel importers, and apparel exporters and importers preferred road
transportation.
(3) Intention to Change Route by Present Route
Table 4-23 and Figure 4-41 summarize intention to change route by present route and
preferred transportation mode by present route, respectively..
Many companies presently using Beira Port intend to change route from via the Tete Corridor
by road to railway if the branch line of the Sena Railway is reconstructed. As for Nacala Port
users, all exporters intend to change to road transportation while most importers prefer to
change to the railway. Among Durban Port users, exporters selected road and railway
transportation at a similar level, although importers preferred railway transportation.
0% 20% 40% 60% 80% 100%
Exporting
entreprise
Importing
enterprise
Common carrier
No response 2 12 6
Don't Know 8 11 2
No 0 3 0
Yes 10 17 4
Exporting entreprise Importing enterprise Common carrier
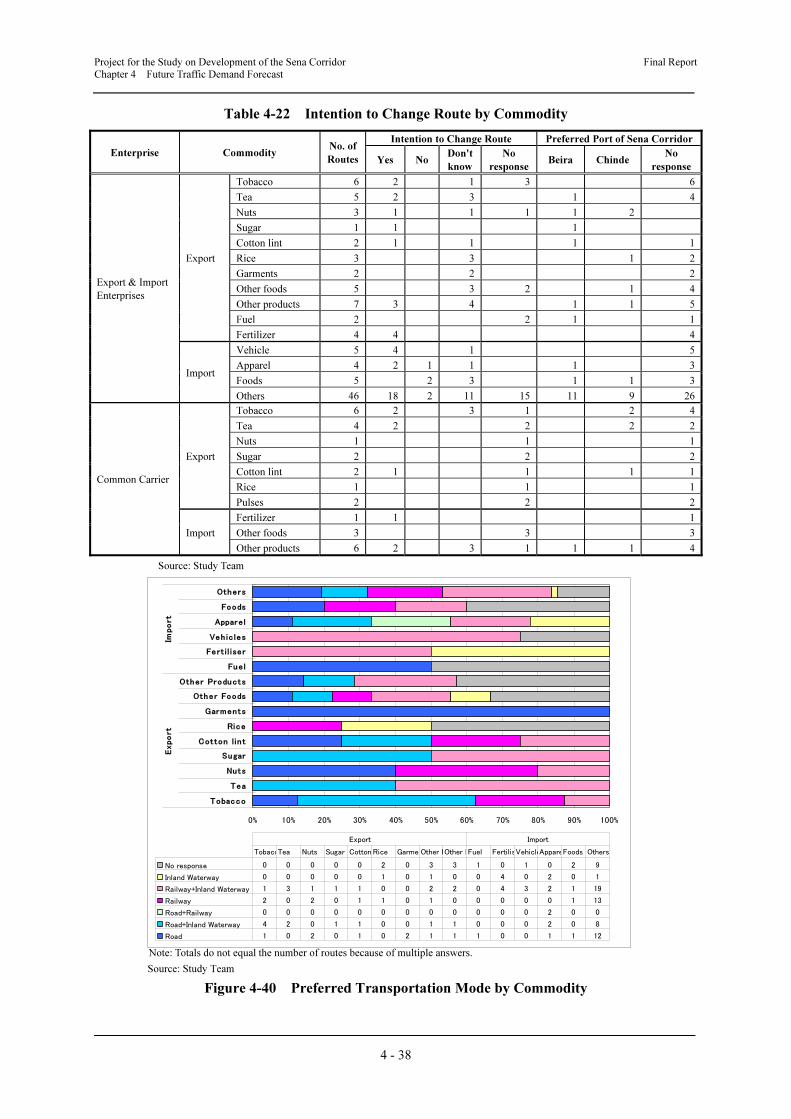
Project for the Study on Development of the Sena Corridor Final Report Chapter 4 Future Traffic Demand Forecast
4 - 38
Table 4-22 Intention to Change Route by Commodity
Enterprise Commodity No. of
Routes
Intention to Change Route Preferred Port of Sena Corridor
Yes NoDon't
know
No
responseBeira Chinde
No
response
Export & Import
Enterprises
Export
Tobacco 6 2 1 3 6
Tea 5 2 3 1 4
Nuts 3 1 1 1 1 2
Sugar 1 1 1
Cotton lint 2 1 1 1 1
Rice 3 3 1 2
Garments 2 2 2
Other foods 5 3 2 1 4
Other products 7 3 4 1 1 5
Fuel 2 2 1 1
Fertilizer 4 4 4
Import
Vehicle 5 4 1 5
Apparel 4 2 1 1 1 3
Foods 5 2 3 1 1 3
Others 46 18 2 11 15 11 9 26
Common Carrier
Export
Tobacco 6 2 3 1 2 4
Tea 4 2 2 2 2
Nuts 1 1 1
Sugar 2 2 2
Cotton lint 2 1 1 1 1
Rice 1 1 1
Pulses 2 2 2
Import
Fertilizer 1 1 1
Other foods 3 3 3
Other products 6 2 3 1 1 1 4
Source: Study Team
Note: Totals do not equal the number of routes because of multiple answers.
Source: Study Team
Figure 4-40 Preferred Transportation Mode by Commodity
0% 10% 20% 30% 40% 50% 60% 70% 80% 90% 100%
Tobacco
Tea
Nuts
Sugar
Cotton lin t
Rice
Garments
Other Foods
Other Products
Fuel
Ferti l iser
Veh ic les
Appare l
Foods
Others
Export
Import
No response 0 0 0 0 0 2 0 3 3 1 0 1 0 2 9
Inland Waterway 0 0 0 0 0 1 0 1 0 0 4 0 2 0 1
Railway+Inland Waterway 1 3 1 1 1 0 0 2 2 0 4 3 2 1 19
Railway 2 0 2 0 1 1 0 1 0 0 0 0 0 1 13
Road+Railway 0 0 0 0 0 0 0 0 0 0 0 0 2 0 0
Road+Inland Waterway 4 2 0 1 1 0 0 1 1 0 0 0 2 0 8
Road 1 0 2 0 1 0 2 1 1 1 0 0 1 1 12
TobaccTea Nuts Sugar Cotton Rice GarmenOther FOther PFuel FertilisVehicleAppareFoods Others
Export Import
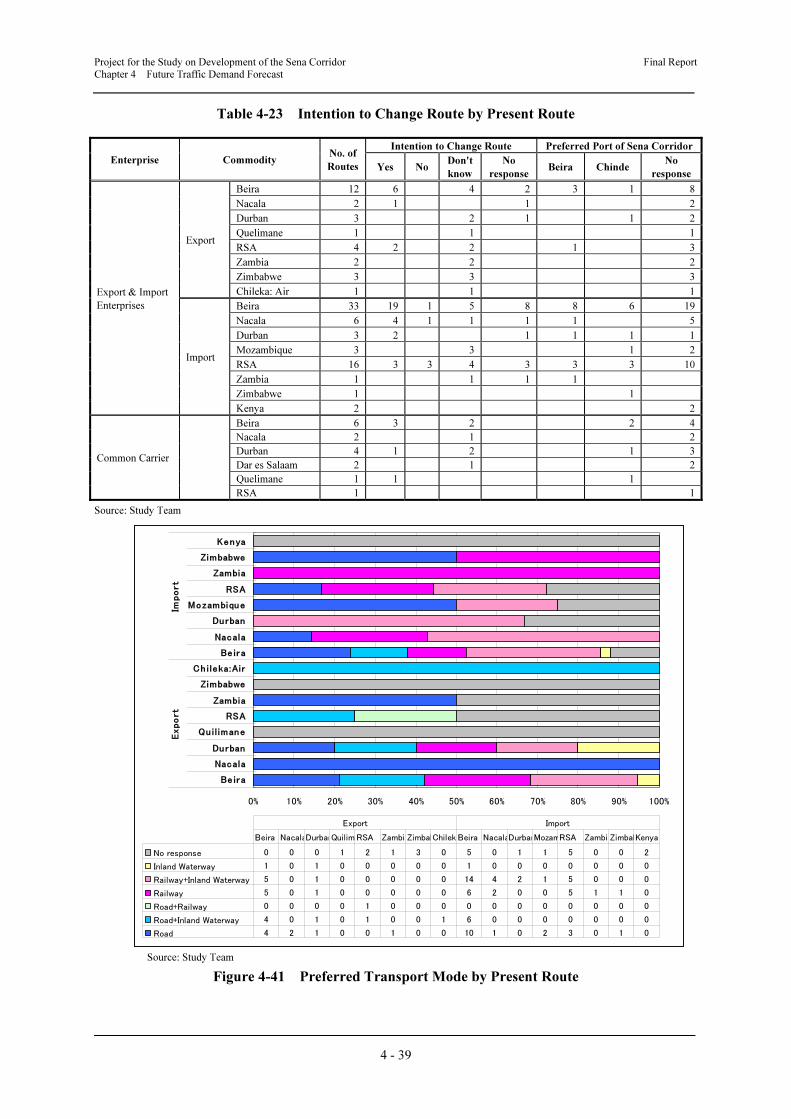
Project for the Study on Development of the Sena Corridor Final Report Chapter 4 Future Traffic Demand Forecast
4 - 39
Table 4-23 Intention to Change Route by Present Route
Enterprise Commodity No. of
Routes
Intention to Change Route Preferred Port of Sena Corridor
Yes NoDon't
know
No
responseBeira Chinde
No
response
Export & Import
Enterprises
Export
Beira 12 6 4 2 3 1 8
Nacala 2 1 1 2
Durban 3 2 1 1 2
Quelimane 1 1 1
RSA 4 2 2 1 3
Zambia 2 2 2
Zimbabwe 3 3 3
Chileka: Air 1 1 1
Import
Beira 33 19 1 5 8 8 6 19
Nacala 6 4 1 1 1 1 5
Durban 3 2 1 1 1 1
Mozambique 3 3 1 2
RSA 16 3 3 4 3 3 3 10
Zambia 1 1 1 1
Zimbabwe 1 1
Kenya 2 2
Common Carrier
Beira 6 3 2 2 4
Nacala 2 1 2
Durban 4 1 2 1 3
Dar es Salaam 2 1 2
Quelimane 1 1 1
RSA 1 1
Source: Study Team
Source: Study Team
Figure 4-41 Preferred Transport Mode by Present Route
0% 10% 20% 30% 40% 50% 60% 70% 80% 90% 100%
Beira
Nacala
Durban
Quil imane
RSA
Zambia
Zimbabwe
Chileka:Air
Beira
Nacala
Durban
Mozambique
RSA
Zambia
Zimbabwe
Kenya
Export
Import
No response 0 0 0 1 2 1 3 0 5 0 1 1 5 0 0 2
Inland Waterway 1 0 1 0 0 0 0 0 1 0 0 0 0 0 0 0
Railway+Inland Waterway 5 0 1 0 0 0 0 0 14 4 2 1 5 0 0 0
Railway 5 0 1 0 0 0 0 0 6 2 0 0 5 1 1 0
Road+Railway 0 0 0 0 1 0 0 0 0 0 0 0 0 0 0 0
Road+Inland Waterway 4 0 1 0 1 0 0 1 6 0 0 0 0 0 0 0
Road 4 2 1 0 0 1 0 0 10 1 0 2 3 0 1 0
Beira NacalaDurbanQuilim RSA ZambiaZimbabChilek Beira NacalaDurbanMozamRSA ZambiaZimbabKenya
Export Import

Project for the Study on Development of the Sena Corridor Final Report Chapter 4 Future Traffic Demand Forecast
4 - 40
4.2.6 Present Characteristics of Logistics
Based on the results of the logistics survey, the present characteristics of logistics are
summarized as follows:
• The volume of import freight is more than that of export freight.
• Fuel and fertilizer dominate imports by volume, mostly from RSA. Both commodities are
mainly transported to Beira Port and Nacala Port by feeder ship and then by road or railway
from the ports.
• The main exports are mostly agricultural products and processed agricultural products, such
as tobacco, sugar and tea.
• The largest freight volume is to/from RSA and Beira Port through the Durban and Beira
Corridors, respectively, followed by the Nacala Corridor to Nacala Port.
• The time taken to Beira Port through the Beira Corridor is 3 to 5 days, and that to Nacala
Port by railway is around 5 days.
• Some companies transport commodities to the distant Durban Port to avoid shipping delays
at Beira Port due to heavy congestion. Some choose road transportation to avoid the
unreliability and uncertainness of the Nacala Railway.
• Many companies interviewed answered that they expected the Sena Corridor to be
developed as it would shorten the distance to Beira Port.
• Development of the Sena Corridor is expected to reduce costs by 20-30%, compared to the
current transport cost to Beira Port, as shown in Table 4-24.
Table 4-24 Transport Cost by Corridor
Corridor Port Mode Distance from
Blantyre (km)
Inland Transport Cost Cost
Comparison US$/tonne/km US$/tonne
Nacala Nacala Railway 80 0.13 103.9 109
Road 850 0.12 109.8 115
Tete Beira Road 825 0.12 95.6 100
Durban Road 2,340 0.12 246.2 257
Sena Beira Railway 575 0.13 75.4 79
Railway+
Inland waterway
732
(182+450)
0.12 63.7 67
Source: Study Team
4.2.7 Cash Crop and Import Commodity Transport Routes
Cash crops cultivated in the Study Area are transported to ocean ports and major import
commodities are transported from ocean ports by the following routes as shown in Figure 4-42:
• Products are mainly placed in containers at Blantyre or Limbe (Logistics centre).
• Sugar is mainly transported to Nacala Port by railway, except exports to Zimbabwe by truck
(bulk).
• Pigeon peas are transported to Nacala (railway), Beira and Durban Ports (road).
• Longer transport routes to Durban and Beira Ports (Tea, Tobacco, Cotton, Pigeon Peas).
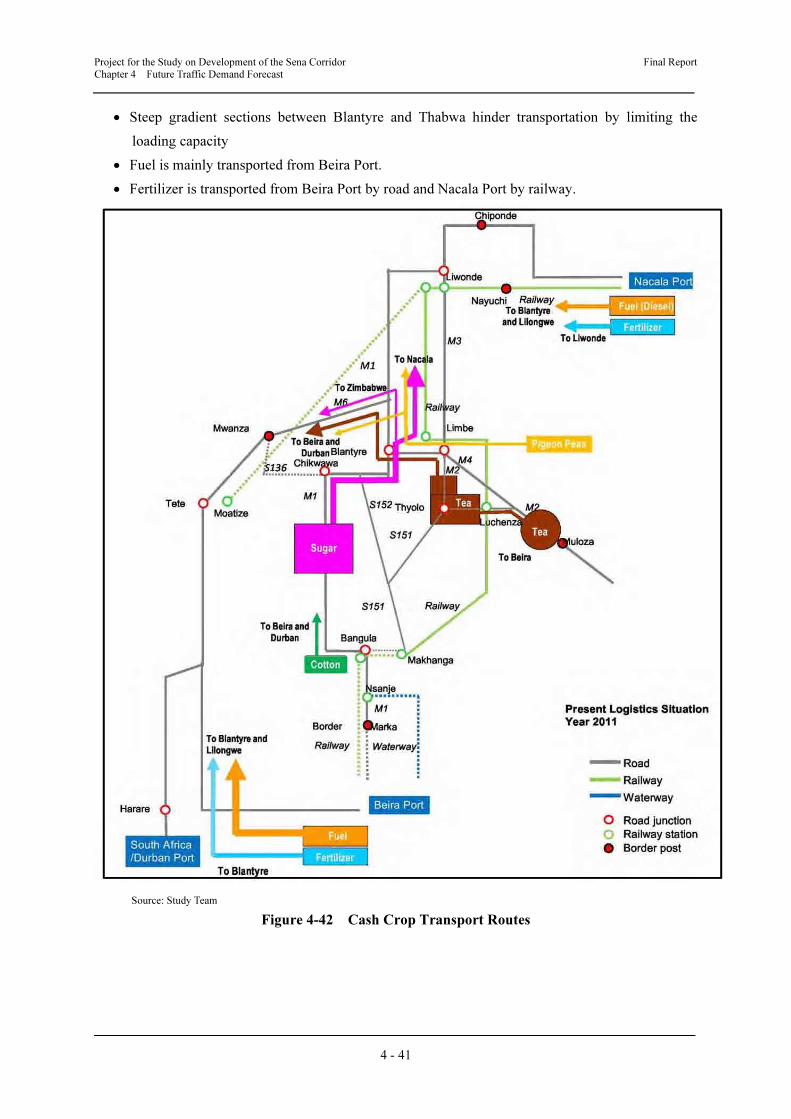
Project for the Study on Development of the Sena Corridor Final Report
Chapter 4 Future Traffic Demand Forecast
4 - 41
• Steep gradient sections between Blantyre and Thabwa hinder transportation by limiting the
loading capacity
• Fuel is mainly transported from Beira Port.
• Fertilizer is transported from Beira Port by road and Nacala Port by railway.
Source: Study Team
Figure 4-42 Cash Crop Transport Routes