![Heat and Thermal Energy Notes.ppt [Read-Only] - Yolasteeverphysics.yolasite.com/resources/Heat and Thermal Energy Note… · Title: Heat and Thermal Energy Notes.ppt [Read-Only] Author:](https://static.fdocuments.in/doc/165x107/5a8dcaa87f8b9abb068cbdb8/heat-and-thermal-energy-notesppt-read-only-and-thermal-energy-notetitle.jpg)
314F21 19 ShearBending Notes.ppt
14
University of Michigan, TCAUP Structures I Slide 1 of 28 ARCHITECTURE 314 STRUCTURES I Bending and Shear in Simple Beams • Free Body Diagrams of Shear and Moment in Beams • Sign Conventions for Plotting V & M Diagrams • Diagrams by Equilibrium (FBD) • Diagrams by Integration • Diagrams by Areas (Semi-graphical) • Diagrams by Equations • Examples in Form (catenary curves) University of Michigan, TCAUP Structures I Slide 2 of 28 Beam Types • Cantilever • Simple • Simple with Cantilever • Continuous (multi-span)
Transcript of 314F21 19 ShearBending Notes.ppt
University of Michigan, TCAUP Structures I Slide 1 of 28
ARCHITECTURE 314
STRUCTURES I
Bending and Shearin Simple Beams
• Free Body Diagrams of Shear and Moment in Beams
• Sign Conventions for Plotting V & M Diagrams
• Diagrams by Equilibrium (FBD)
• Diagrams by Integration
• Diagrams by Areas (Semi-graphical)
• Diagrams by Equations
• Examples in Form (catenary curves)
University of Michigan, TCAUP Structures I Slide 2 of 28
Beam Types
• Cantilever
• Simple
• Simple with Cantilever
• Continuous (multi-span)
University of Michigan, TCAUP Structures I Slide 3 of 28
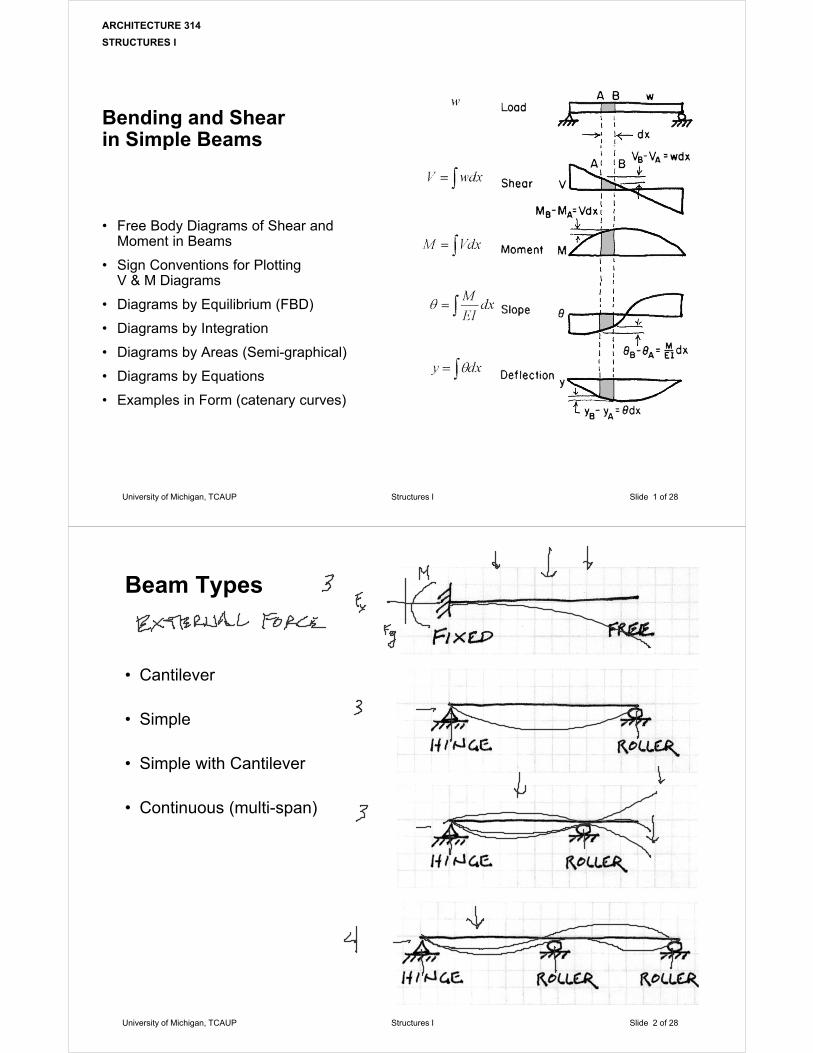
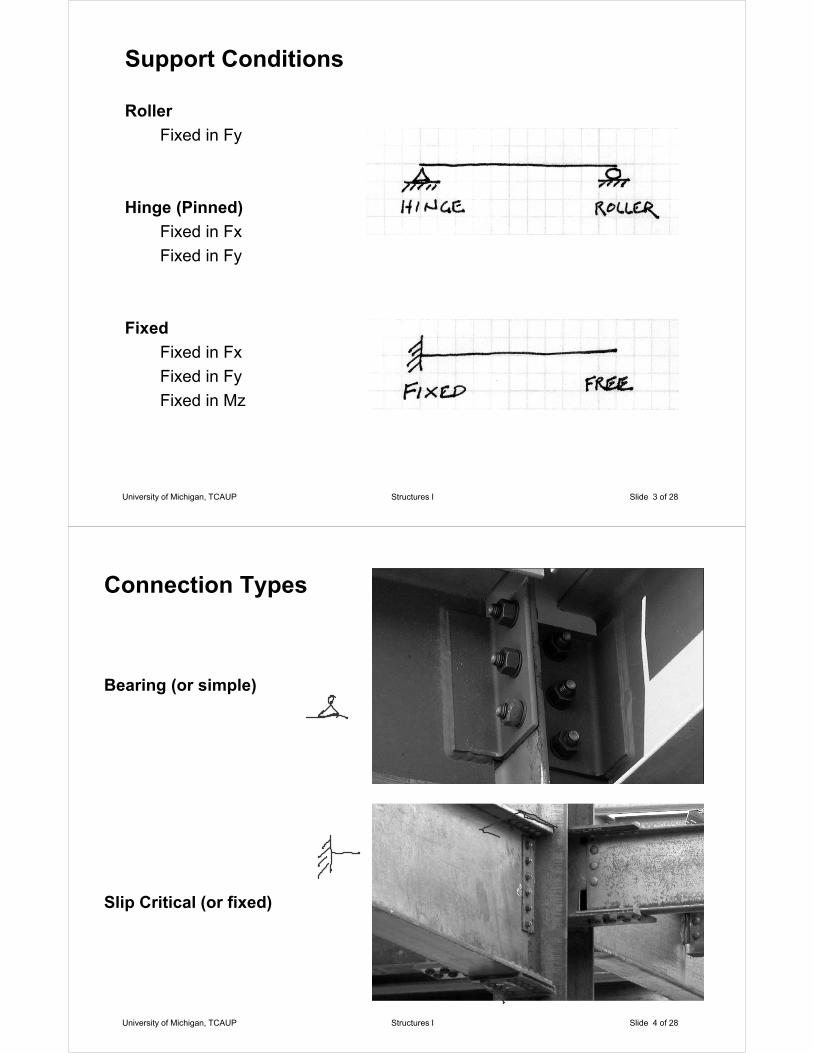
Support Conditions
Roller
Fixed in Fy
Hinge (Pinned)
Fixed in Fx
Fixed in Fy
Fixed
Fixed in Fx
Fixed in Fy
Fixed in Mz
University of Michigan, TCAUP Structures I Slide 4 of 28
Connection Types
Bearing (or simple)
Slip Critical (or fixed)
University of Michigan, TCAUP Structures I Slide 5 of 28
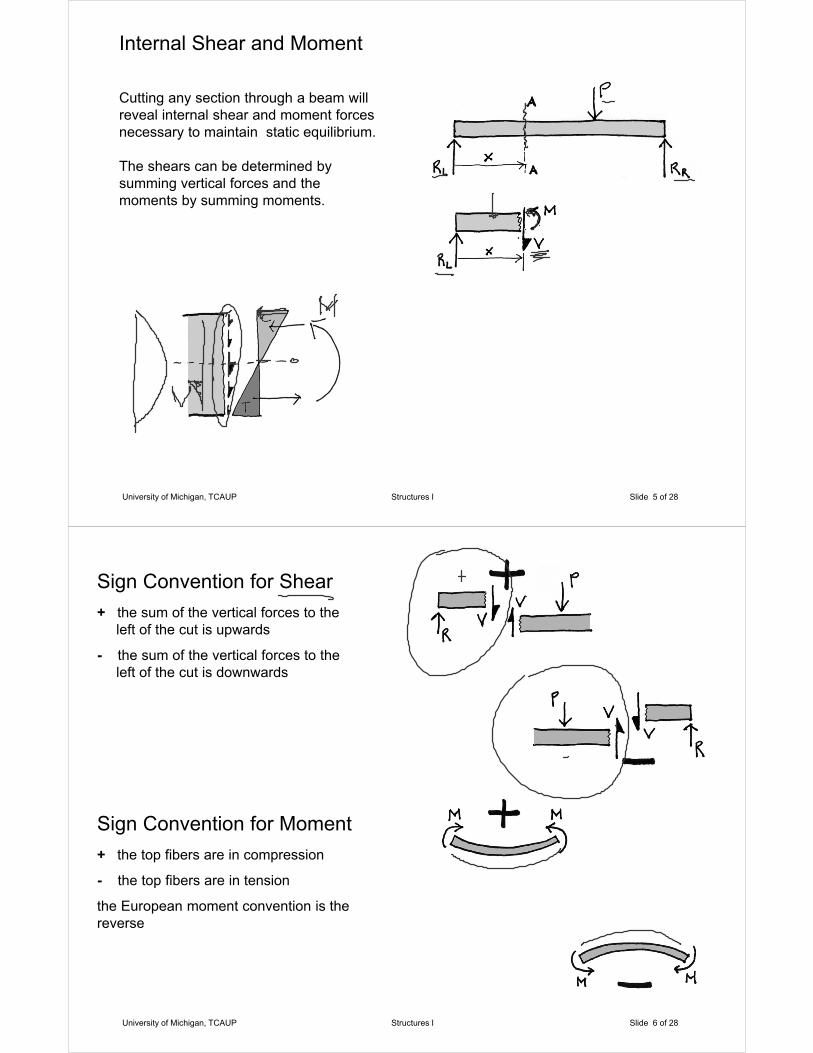
Internal Shear and Moment
Cutting any section through a beam will reveal internal shear and moment forces necessary to maintain static equilibrium.
The shears can be determined by summing vertical forces and the moments by summing moments.
University of Michigan, TCAUP Structures I Slide 6 of 28
Sign Convention for Shear
+ the sum of the vertical forces to the left of the cut is upwards
- the sum of the vertical forces to the left of the cut is downwards
Sign Convention for Moment
+ the top fibers are in compression
- the top fibers are in tension
the European moment convention is the reverse

University of Michigan, TCAUP Structures I Slide 7 of 28
Sign Convention for Moment
+ positive curvature (holds water)
- negative curvature (spills water)
the European moment convention is the reverse
University of Michigan, TCAUP Structures I Slide 8 of 28
Relationships of Forces and Deformations
There are a series of relationships among forces and deformations in a beam, which can be useful in analysis. Using either the deflection or load as a starting point, the following characteristics can be discovered by taking successive derivatives or integrals of the beam equations.
University of Michigan, TCAUP Structures I Slide 9 of 28
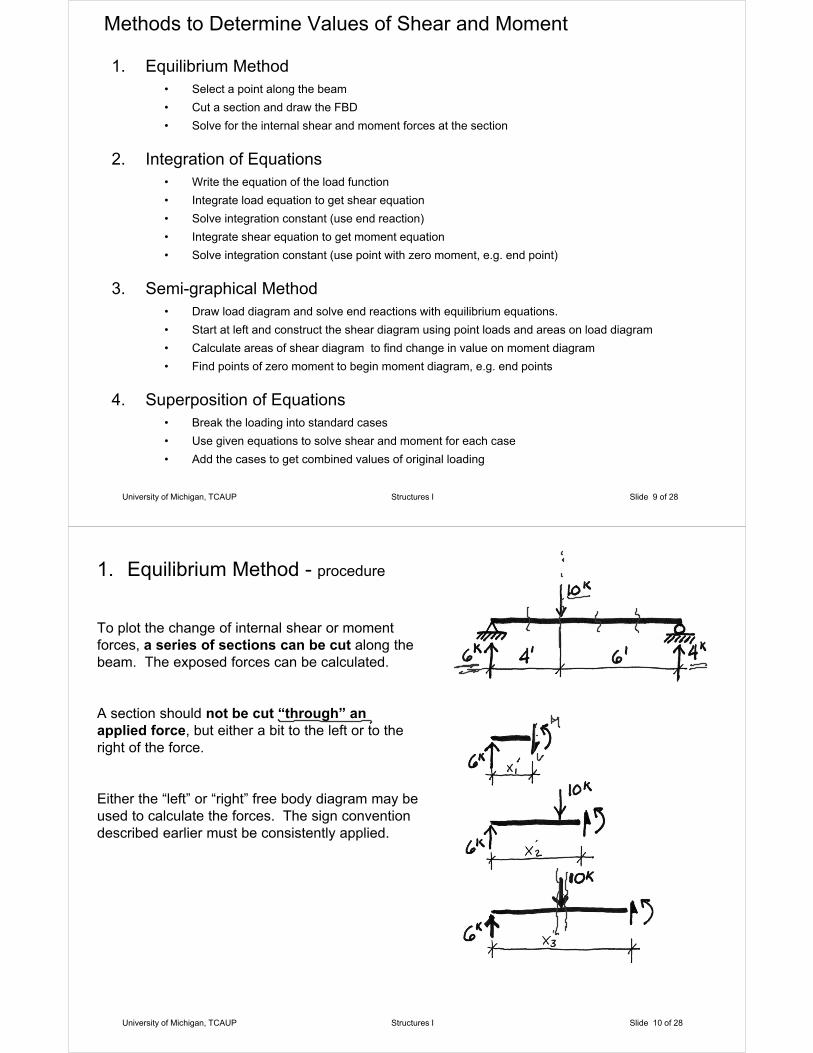
Methods to Determine Values of Shear and Moment
1. Equilibrium Method• Select a point along the beam
• Cut a section and draw the FBD
• Solve for the internal shear and moment forces at the section
2. Integration of Equations• Write the equation of the load function
• Integrate load equation to get shear equation
• Solve integration constant (use end reaction)
• Integrate shear equation to get moment equation
• Solve integration constant (use point with zero moment, e.g. end point)
3. Semi-graphical Method• Draw load diagram and solve end reactions with equilibrium equations.
• Start at left and construct the shear diagram using point loads and areas on load diagram
• Calculate areas of shear diagram to find change in value on moment diagram
• Find points of zero moment to begin moment diagram, e.g. end points
4. Superposition of Equations• Break the loading into standard cases
• Use given equations to solve shear and moment for each case
• Add the cases to get combined values of original loading
University of Michigan, TCAUP Structures I Slide 10 of 28
1. Equilibrium Method - procedure
To plot the change of internal shear or moment forces, a series of sections can be cut along the beam. The exposed forces can be calculated.
A section should not be cut “through” an applied force, but either a bit to the left or to the right of the force.
Either the “left” or “right” free body diagram may be used to calculate the forces. The sign convention described earlier must be consistently applied.
University of Michigan, TCAUP Structures I Slide 11 of 28
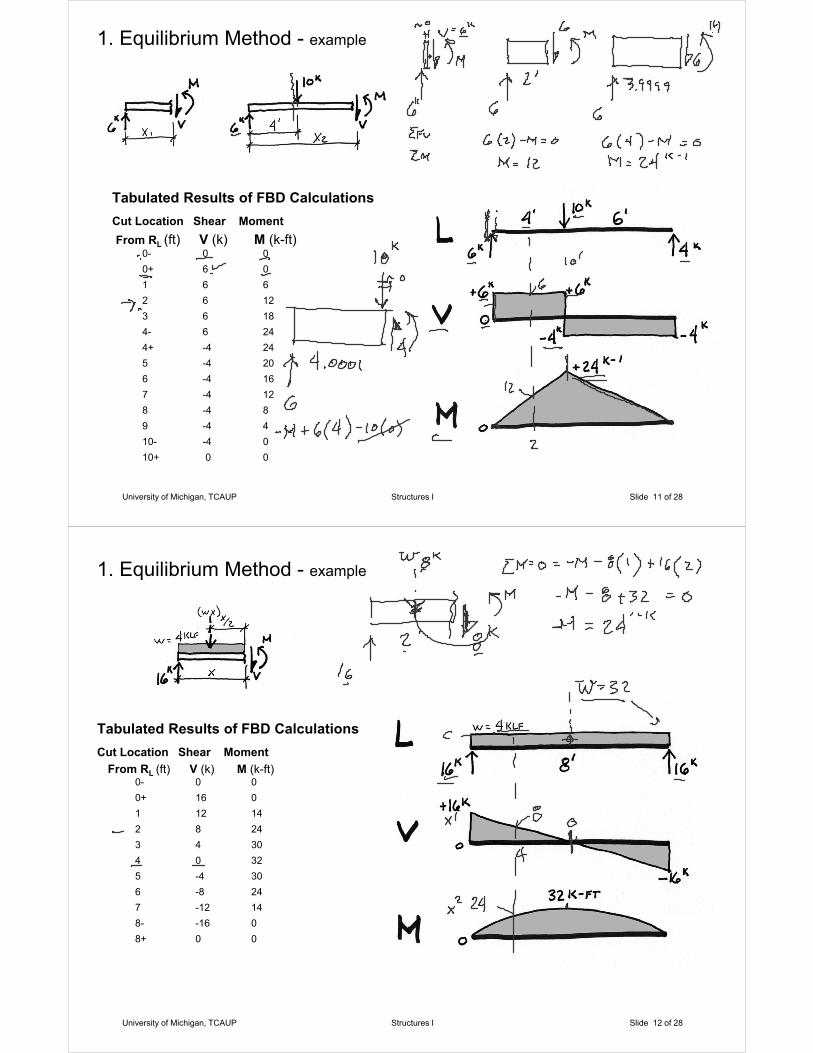
1. Equilibrium Method - example
Tabulated Results of FBD Calculations
Cut Location Shear Moment
From RL (ft) V (k) M (k-ft)0- 0 0
0+ 6 0
1 6 6
2 6 12
3 6 18
4- 6 24
4+ -4 24
5 -4 20
6 -4 16
7 -4 12
8 -4 8
9 -4 4
10- -4 0
10+ 0 0
University of Michigan, TCAUP Structures I Slide 12 of 28
1. Equilibrium Method - example
Tabulated Results of FBD Calculations
Cut Location Shear Moment
From RL (ft) V (k) M (k-ft)0- 0 0
0+ 16 0
1 12 14
2 8 24
3 4 30
4 0 32
5 -4 30
6 -8 24
7 -12 14
8- -16 0
8+ 0 0
University of Michigan, TCAUP Structures I Slide 13 of 28
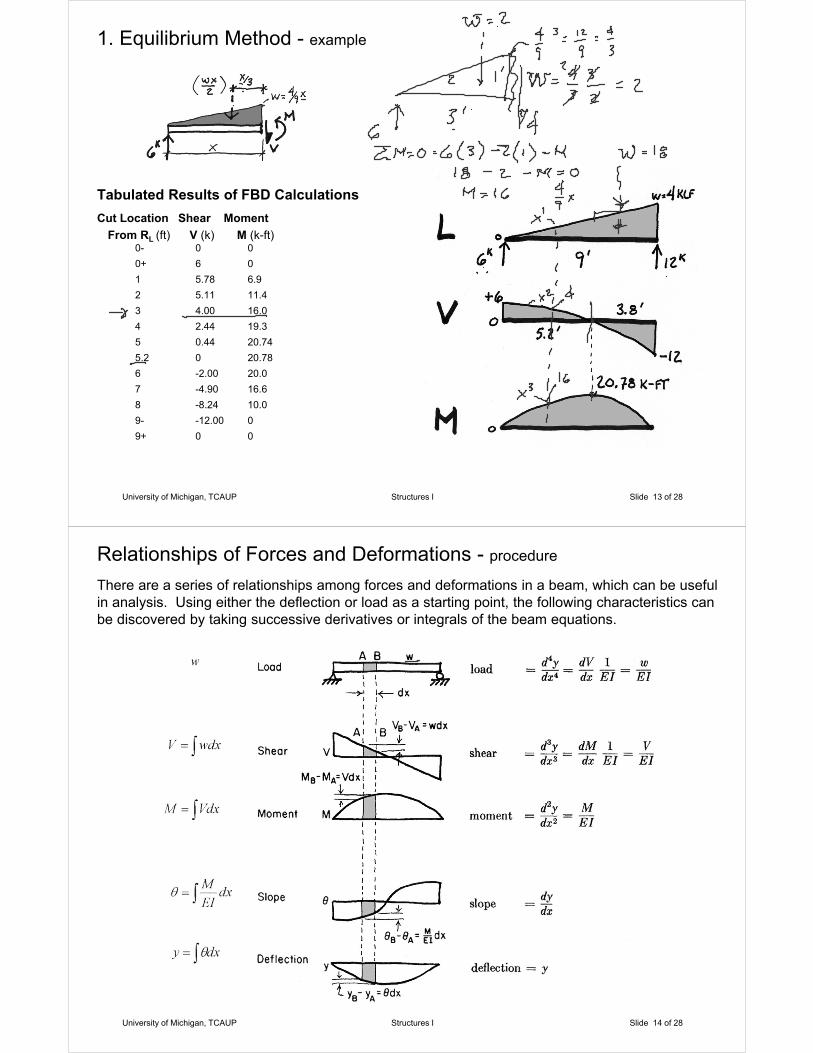
1. Equilibrium Method - example
Tabulated Results of FBD Calculations
Cut Location Shear Moment
From RL (ft) V (k) M (k-ft)0- 0 0
0+ 6 0
1 5.78 6.9
2 5.11 11.4
3 4.00 16.0
4 2.44 19.3
5 0.44 20.74
5.2 0 20.78
6 -2.00 20.0
7 -4.90 16.6
8 -8.24 10.0
9- -12.00 0
9+ 0 0
University of Michigan, TCAUP Structures I Slide 14 of 28
Relationships of Forces and Deformations - procedure
There are a series of relationships among forces and deformations in a beam, which can be useful in analysis. Using either the deflection or load as a starting point, the following characteristics can be discovered by taking successive derivatives or integrals of the beam equations.
University of Michigan, TCAUP Structures I Slide 15 of 28
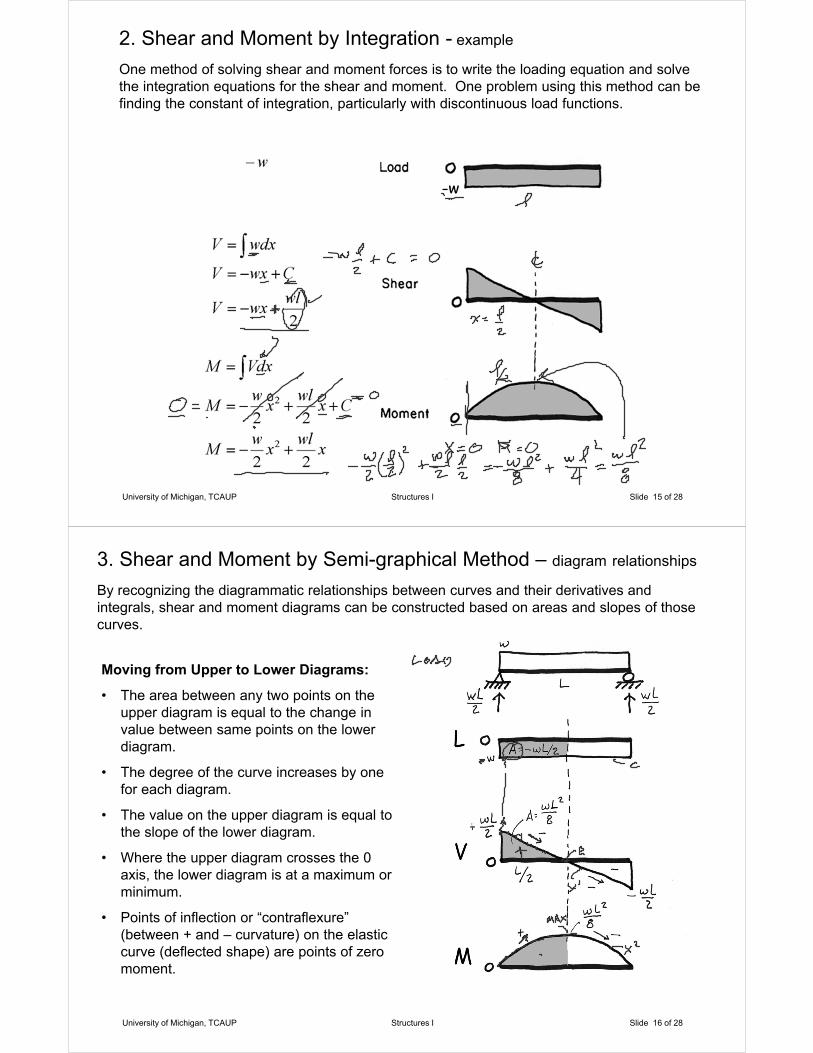
2. Shear and Moment by Integration - example
One method of solving shear and moment forces is to write the loading equation and solve the integration equations for the shear and moment. One problem using this method can be finding the constant of integration, particularly with discontinuous load functions.
University of Michigan, TCAUP Structures I Slide 16 of 28
3. Shear and Moment by Semi-graphical Method – diagram relationships
By recognizing the diagrammatic relationships between curves and their derivatives and integrals, shear and moment diagrams can be constructed based on areas and slopes of those curves.
Moving from Upper to Lower Diagrams:
• The area between any two points on the upper diagram is equal to the change in value between same points on the lower diagram.
• The degree of the curve increases by one for each diagram.
• The value on the upper diagram is equal to the slope of the lower diagram.
• Where the upper diagram crosses the 0 axis, the lower diagram is at a maximum or minimum.
• Points of inflection or “contraflexure” (between + and – curvature) on the elastic curve (deflected shape) are points of zero moment.
University of Michigan, TCAUP Structures I Slide 17 of 28
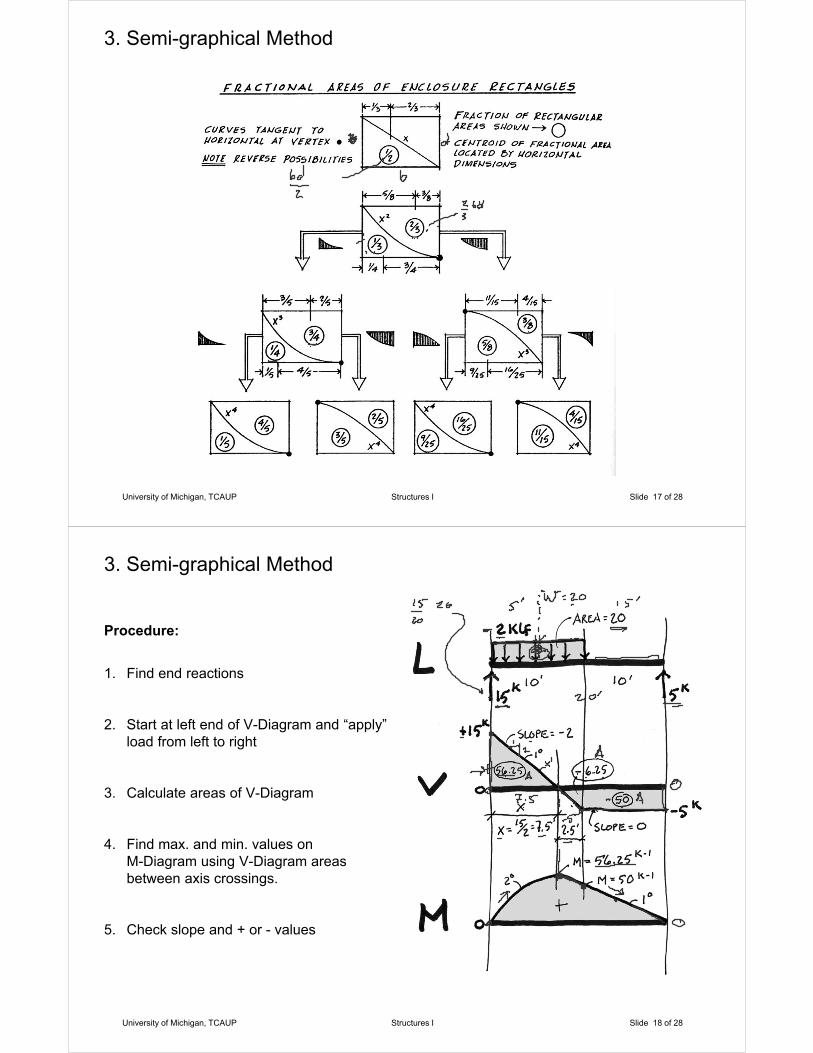
3. Semi-graphical Method
University of Michigan, TCAUP Structures I Slide 18 of 28
3. Semi-graphical Method
Procedure:
1. Find end reactions
2. Start at left end of V-Diagram and “apply” load from left to right
3. Calculate areas of V-Diagram
4. Find max. and min. values on M-Diagram using V-Diagram areas between axis crossings.
5. Check slope and + or - values
University of Michigan, TCAUP Structures I Slide 19 of 28
3. Semi-graphical Method
example
Cantilever Beam
University of Michigan, TCAUP Structures I Slide 20 of 28
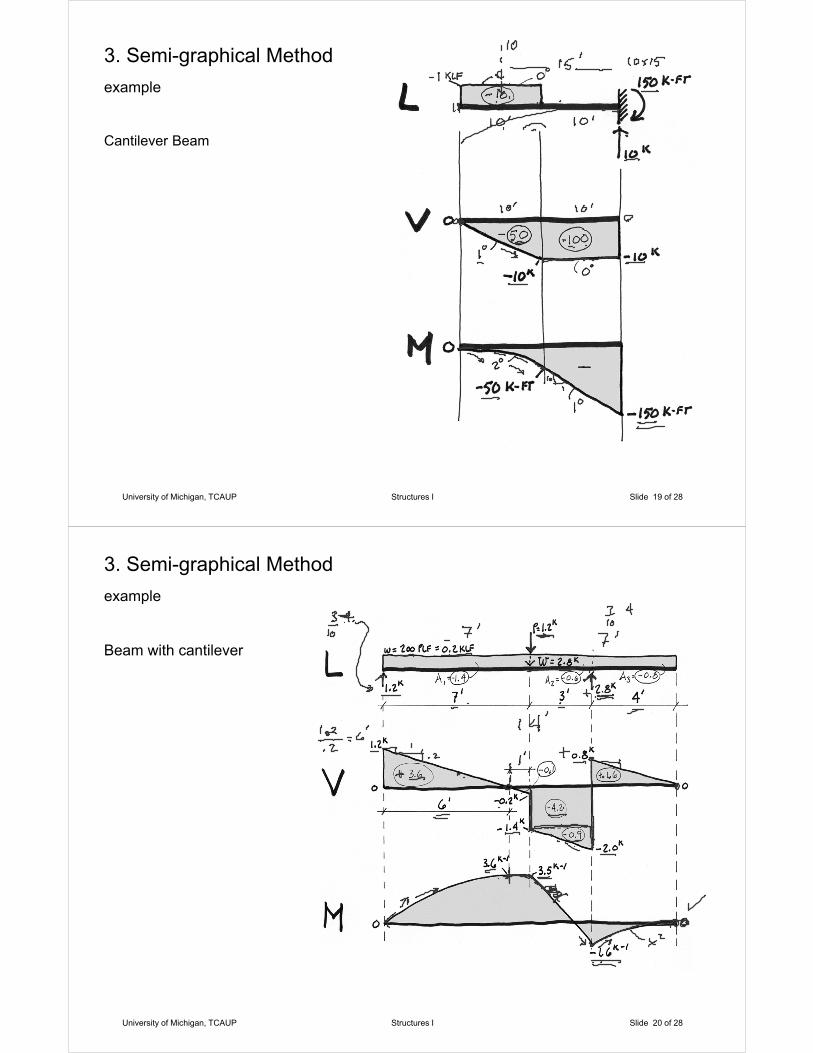
3. Semi-graphical Method
example
Beam with cantilever
University of Michigan, TCAUP Structures I Slide 21 of 28
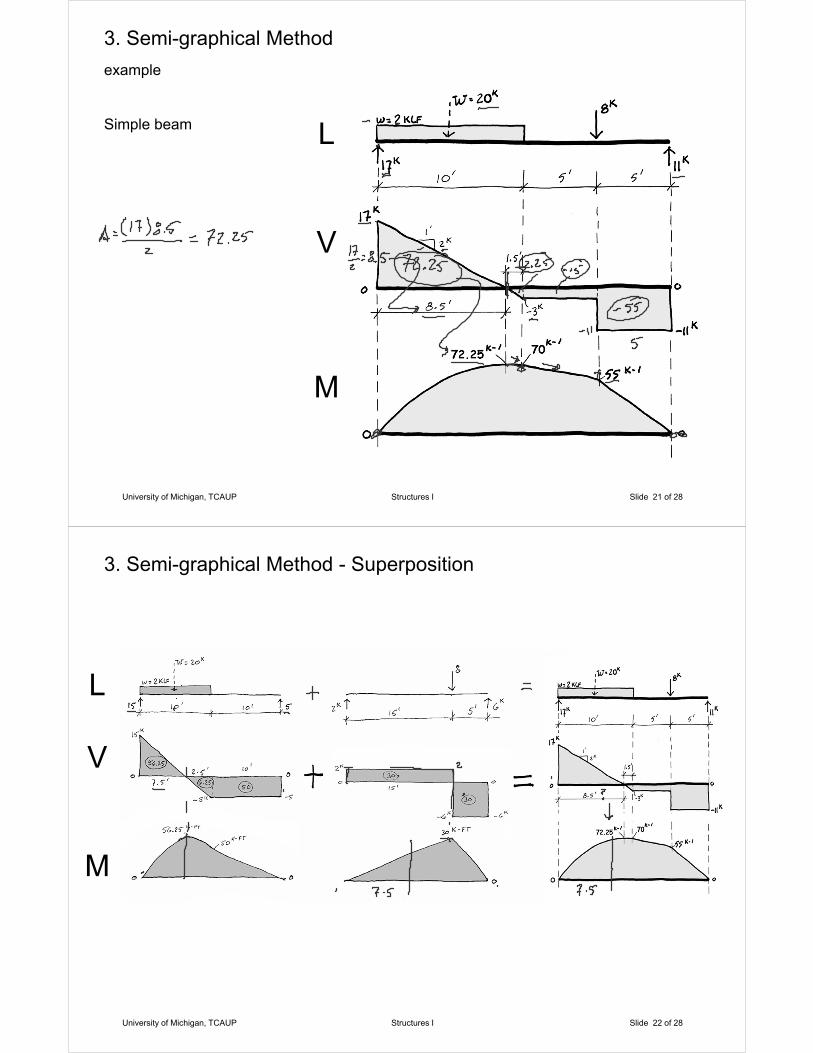
3. Semi-graphical Method
example
Simple beam L
V
M
University of Michigan, TCAUP Structures I Slide 22 of 28
3. Semi-graphical Method - Superposition
L
V
M

University of Michigan, TCAUP Structures I Slide 23 of 28
Equations Method
For simple spans:
Vmax is the larger reaction
For symmetric loadings:
Mmax is at C.L.
For cantilevers:
Both Vmax and Mmax are at the support
In these equations:
w = load per unit length (PLF or KLF)
W = the total load (LB or KIP)
AISC Manual
University of Michigan, TCAUP Structures I Slide 24 of 28
4. Superposition of Equations
Equations of shear or moment may be combined (superimposed) for any number of cases.
BUT
The appropriate location along the beam for which the equation is valid must be maintained
Thus
At the reaction, V = P/2 + wL/2
And at the C.L. M = PL/4 + wL2/8
University of Michigan, TCAUP Structures I Slide 25 of 28
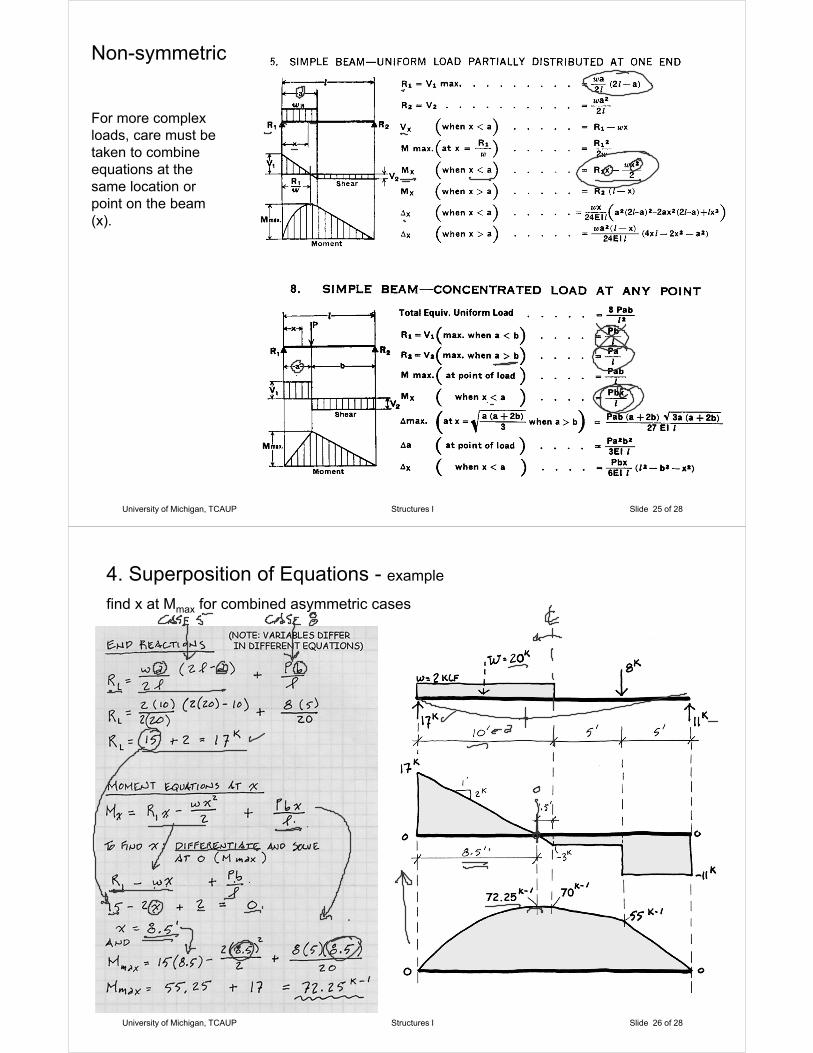
Non-symmetric
For more complex loads, care must be taken to combine equations at the same location or point on the beam (x).
University of Michigan, TCAUP Structures I Slide 26 of 28
4. Superposition of Equations - example
find x at Mmax for combined asymmetric cases
University of Michigan, TCAUP Structures II Slide 27 of 28
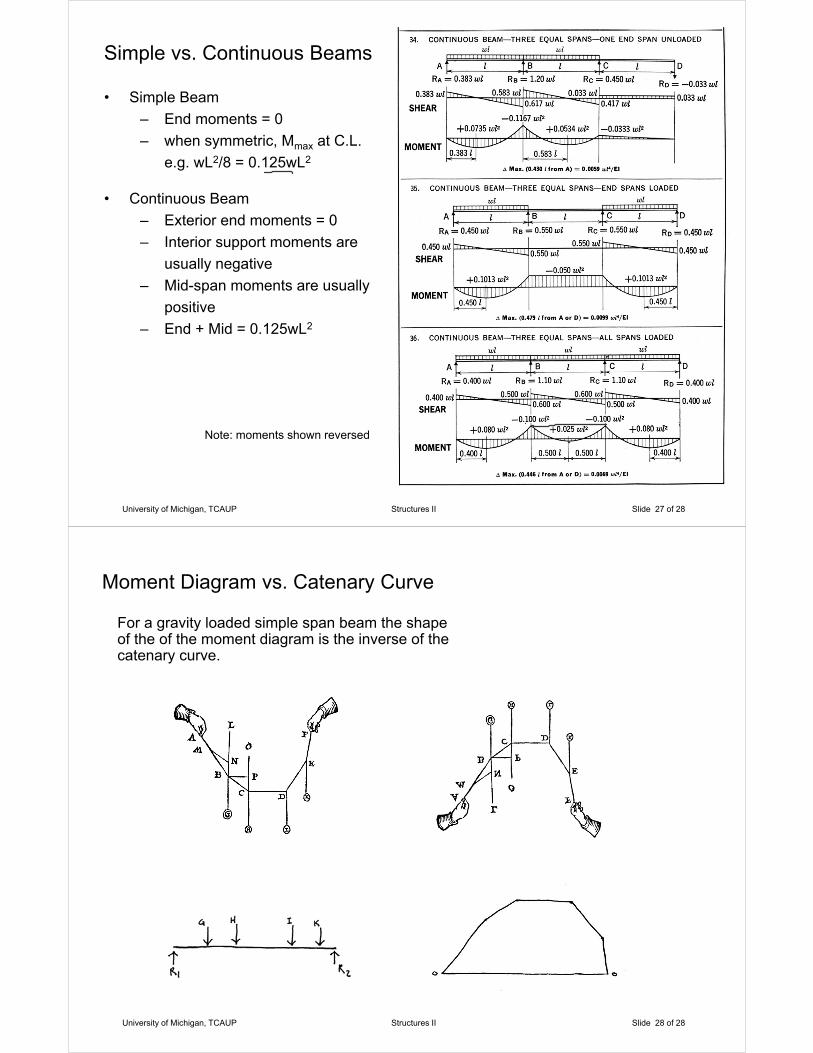
Simple vs. Continuous Beams
• Simple Beam
– End moments = 0
– when symmetric, Mmax at C.L.
e.g. wL2/8 = 0.125wL2
• Continuous Beam
– Exterior end moments = 0
– Interior support moments are
usually negative
– Mid-span moments are usually
positive
– End + Mid = 0.125wL2
Note: moments shown reversed
University of Michigan, TCAUP Structures II Slide 28 of 28
Moment Diagram vs. Catenary Curve
For a gravity loaded simple span beam the shape of the of the moment diagram is the inverse of the catenary curve.