3. Fatigue strength testing - imim
8
A R C H I V E S O F M E T A L L U R G Y A N D M A T E R I A L S Volume 57 2012 Issue 4 DOI: 10.2478/v10172-012-0131-3 M. SULIGA * THE INFLUENCE OF THE HIGH SPEED MULTIPASS DRAWING PROCESS ON THE FATIGUE STRENGTH OF HIGH CARBON STEEL WIRES WPLYW WIELOSTOPNIOWEGO PROCESU CIĄGNIENIA Z DUŻYMI PRĘDKOŚCIAMI NA WYTRZYMALOŚĆ ZMĘCZENIOWĄ DRUTÓW ZE STALI WYSOKOWĘGLOWEJ In this work the influence of the drawing speed on fatigue strength of high carbon steel wires has been assessed. The drawing process of ϕ5.5 mm wires to the final wire of ϕ1.6 mm was conducted in 11 passes, in industrial conditions, by means of a modern Koch multi-die drawing machine. The drawing speeds in the last passes were: 5, 10, 15 and 20 m/s. For ϕ1.6 mm wires the investigation of fatigue strength has been carried out. In order to explain the effect of drawing speed on fatigue strength of rope wires, the roughness of drawn wires have been also determined. In addition, the numerical analysis of the drawing process on the base of Drawing 2D in which distribution of redundant strain, has been shown. The data of investigations prove the favourable effect of high drawing speed on fatigue strength of drawn wires. It was found that the better fatigue strength of wires drawn at the speed of 20 m/s compared to the wires drawn at the speeds of 5-15 m/s is associated with a better geometric structure of the surface of those wires. In addition to the high fatigue strength of the wires drawn with high speed is related to theirs higher redundant strain. The obtained data investigation can be applied in wire industry while implementing the new technologies of high speed drawing process of high carbon steel wires. Keywords: drawing speed, fatigue strength, rope wires, wire roughness W pracy określono wplyw dużej prędkości ciągnienia na wytrzymalość zmęczeniową drutów ze stali wysokowęglowej. Proces ciągnienia drutów o średnicy 5,5 mm na średnicę końcową 1,60 mm zrealizowano w 11 ciągach, w warunkach prze- myslowych, na nowoczesnej ciągarce wielostopniowej Kocha. Prędkości ciągnienia na ostatnim ciągu wynosily odpowiednio: 5, 10, 15 i 20 m/s. Badania wytrzymalości zmęczeniowej przeprowadzono dla drutów końcowych ϕ1,60 mm. Dla pelniejszej oceny wplywu wielkości prędkości ciągnienia na wytrzymalość zmęczeniową drutów liniarskich przepro- wadzono także badania chropowatości powierzchni. Dodatkowo w pracy, w oparciu o program Drawing 2d, przeprowadzono analizę numeryczną procesu ciągnienia, w której określono odksztalcenia postaciowe w drutach po procesie ciągnienia. Uzyskane wyniki badań świadczą o korzystnym wplywie dużej prędkości ciągnienia na wytrzymalość zmęczeniową drutów. Stwierdzono, że lepsza wytrzymalość zmęczeniowa drutów ciągnionych z prędkością 20 m/s, w stosunku do dru- tów ciągnionych z prędkościami 5-15 m/s, związana jest z ich lepszą strukturą geometryczną powierzchni oraz większymi odksztalceniami postaciowymi. Uzyskane wyniki badań mogą być wykorzystane w przemyśle ciągarskim przy wdrażaniu nowych technologii szybko- ściowego ciągnienia drutów ze stali wysokowęglowych. 1. Introduction Drawing technology plays an important role in de- veloping the properties of wires drawn. The basic tech- nological parameters influencing the properties of drawn wires include drawing speed. Although some studies on the effect of high drawing speed on the drawing process parameters and the mechanical and technological prop- erties of wires can be found in literature, there are few studies dealing with the influence of this parameter on the fatigue strength of high-carbon steel wires [1÷3]. These wires are used for manufacturing ropes, springs and cord, that is metal products from which particularly high fatigue strength is required. Wire fatigue strength is the resistance of the wire to bending stresses that act upon it. * CZESTOCHOWA UNIVERSITY OF TECHNOLOGY, FACULTY OF MATERIAL PROCESSING TECHNOLOGY AND APPLIED PHYSICS, INSTITUTE OF PLASTIC FORMING AND SAFETY ENGINEERING, 42-200 CZĘSTOCHOWA, 19 ARMII KRAJOWEJ STR., POLAND
Transcript of 3. Fatigue strength testing - imim

A R C H I V E S O F M E T A L L U R G Y A N D M A T E R I A L S
Volume 57 2012 Issue 4
DOI: 10.2478/v10172-012-0131-3
M. SULIGA∗
THE INFLUENCE OF THE HIGH SPEED MULTIPASS DRAWING PROCESS ON THE FATIGUE STRENGTH OF HIGH CARBONSTEEL WIRES
WPŁYW WIELOSTOPNIOWEGO PROCESU CIĄGNIENIA Z DUŻYMI PRĘDKOŚCIAMI NA WYTRZYMAŁOŚĆ ZMĘCZENIOWĄDRUTÓW ZE STALI WYSOKOWĘGLOWEJ
In this work the influence of the drawing speed on fatigue strength of high carbon steel wires has been assessed. Thedrawing process of ϕ5.5 mm wires to the final wire of ϕ1.6 mm was conducted in 11 passes, in industrial conditions, by meansof a modern Koch multi-die drawing machine. The drawing speeds in the last passes were: 5, 10, 15 and 20 m/s. For ϕ1.6 mmwires the investigation of fatigue strength has been carried out.
In order to explain the effect of drawing speed on fatigue strength of rope wires, the roughness of drawn wires have beenalso determined. In addition, the numerical analysis of the drawing process on the base of Drawing 2D in which distributionof redundant strain, has been shown.
The data of investigations prove the favourable effect of high drawing speed on fatigue strength of drawn wires. It wasfound that the better fatigue strength of wires drawn at the speed of 20 m/s compared to the wires drawn at the speeds of5-15 m/s is associated with a better geometric structure of the surface of those wires. In addition to the high fatigue strengthof the wires drawn with high speed is related to theirs higher redundant strain.
The obtained data investigation can be applied in wire industry while implementing the new technologies of high speeddrawing process of high carbon steel wires.
Keywords: drawing speed, fatigue strength, rope wires, wire roughness
W pracy określono wpływ dużej prędkości ciągnienia na wytrzymałość zmęczeniową drutów ze stali wysokowęglowej.Proces ciągnienia drutów o średnicy 5,5 mm na średnicę końcową 1,60 mm zrealizowano w 11 ciągach, w warunkach prze-mysłowych, na nowoczesnej ciągarce wielostopniowej Kocha. Prędkości ciągnienia na ostatnim ciągu wynosiły odpowiednio:5, 10, 15 i 20 m/s. Badania wytrzymałości zmęczeniowej przeprowadzono dla drutów końcowych ϕ1,60 mm.
Dla pełniejszej oceny wpływu wielkości prędkości ciągnienia na wytrzymałość zmęczeniową drutów liniarskich przepro-wadzono także badania chropowatości powierzchni. Dodatkowo w pracy, w oparciu o program Drawing 2d, przeprowadzonoanalizę numeryczną procesu ciągnienia, w której określono odkształcenia postaciowe w drutach po procesie ciągnienia.
Uzyskane wyniki badań świadczą o korzystnym wpływie dużej prędkości ciągnienia na wytrzymałość zmęczeniowądrutów. Stwierdzono, że lepsza wytrzymałość zmęczeniowa drutów ciągnionych z prędkością 20 m/s, w stosunku do dru-tów ciągnionych z prędkościami 5-15 m/s, związana jest z ich lepszą strukturą geometryczną powierzchni oraz większymiodkształceniami postaciowymi.
Uzyskane wyniki badań mogą być wykorzystane w przemyśle ciągarskim przy wdrażaniu nowych technologii szybko-ściowego ciągnienia drutów ze stali wysokowęglowych.
1. Introduction
Drawing technology plays an important role in de-veloping the properties of wires drawn. The basic tech-nological parameters influencing the properties of drawnwires include drawing speed. Although some studies onthe effect of high drawing speed on the drawing processparameters and the mechanical and technological prop-
erties of wires can be found in literature, there are fewstudies dealing with the influence of this parameter onthe fatigue strength of high-carbon steel wires [1÷3].These wires are used for manufacturing ropes, springsand cord, that is metal products from which particularlyhigh fatigue strength is required. Wire fatigue strengthis the resistance of the wire to bending stresses that actupon it.
∗ CZESTOCHOWA UNIVERSITY OF TECHNOLOGY, FACULTY OF MATERIAL PROCESSING TECHNOLOGY AND APPLIED PHYSICS, INSTITUTE OF PLASTIC FORMING AND SAFETYENGINEERING, 42-200 CZĘSTOCHOWA, 19 ARMII KRAJOWEJ STR., POLAND
1172
Wire fatigue strength is influenced by a number offactors that may include: the type of drawing die, lubrica-tion conditions, drawing direction, the structure of steel,residual stresses, surface texture, mechanical propertiesand the hardening of the wire sub-surface layer [4÷7].
In connection with the above, the effect of thehigh-speed multi-stage drawing process on the fatiguestrength of high-carbon steel wires was determined inthe study.
2. Material and applied drawing technologies
The material used to the investigation was C72DPhigh carbon steel wire rod (0.72%C). The chemical com-position of C72DP steel is presented in Table 1.
TABLE 1The chemical composition of C72DP steel
Element contain, %
C Mn Si P S Cr Ni Cu Al N
0.74 0.61 0.23 0.009 0.013 0.04 0.02 0.03 0.003 0.0036
Before drawing, wire rod was patented, itched andboraxed. The structure of wire rod after patenting is pre-sented on Fig. 1.
Fig. 1. Microstructure of wire rod after patenting, nital etching
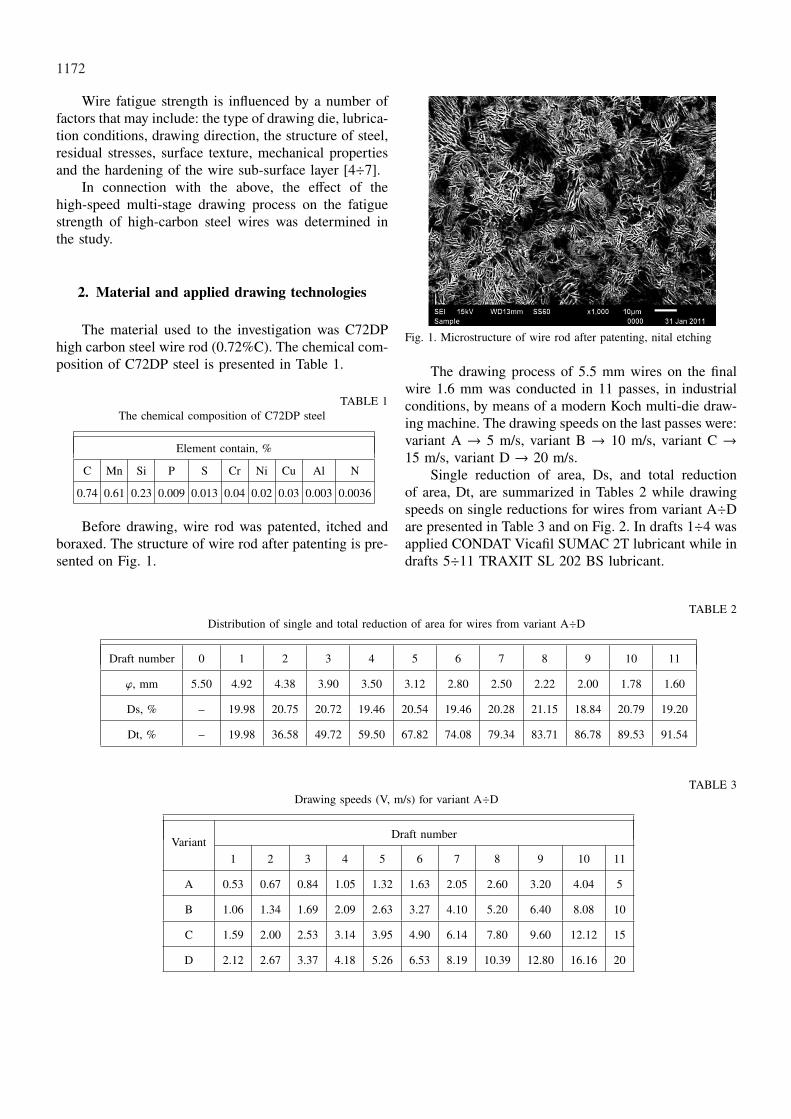
The drawing process of 5.5 mm wires on the finalwire 1.6 mm was conducted in 11 passes, in industrialconditions, by means of a modern Koch multi-die draw-ing machine. The drawing speeds on the last passes were:variant A → 5 m/s, variant B → 10 m/s, variant C →15 m/s, variant D → 20 m/s.
Single reduction of area, Ds, and total reductionof area, Dt, are summarized in Tables 2 while drawingspeeds on single reductions for wires from variant A÷Dare presented in Table 3 and on Fig. 2. In drafts 1÷4 wasapplied CONDAT Vicafil SUMAC 2T lubricant while indrafts 5÷11 TRAXIT SL 202 BS lubricant.
TABLE 2Distribution of single and total reduction of area for wires from variant A÷D
Draft number 0 1 2 3 4 5 6 7 8 9 10 11
ϕ, mm 5.50 4.92 4.38 3.90 3.50 3.12 2.80 2.50 2.22 2.00 1.78 1.60
Ds, % – 19.98 20.75 20.72 19.46 20.54 19.46 20.28 21.15 18.84 20.79 19.20
Dt, % – 19.98 36.58 49.72 59.50 67.82 74.08 79.34 83.71 86.78 89.53 91.54
TABLE 3Drawing speeds (V, m/s) for variant A÷D
VariantDraft number
1 2 3 4 5 6 7 8 9 10 11
A 0.53 0.67 0.84 1.05 1.32 1.63 2.05 2.60 3.20 4.04 5
B 1.06 1.34 1.69 2.09 2.63 3.27 4.10 5.20 6.40 8.08 10
C 1.59 2.00 2.53 3.14 3.95 4.90 6.14 7.80 9.60 12.12 15
D 2.12 2.67 3.37 4.18 5.26 6.53 8.19 10.39 12.80 16.16 20
1173
Fig. 2. Drawing speeds in total reduction function for wires fromvariant A÷D
3. Fatigue strength testing
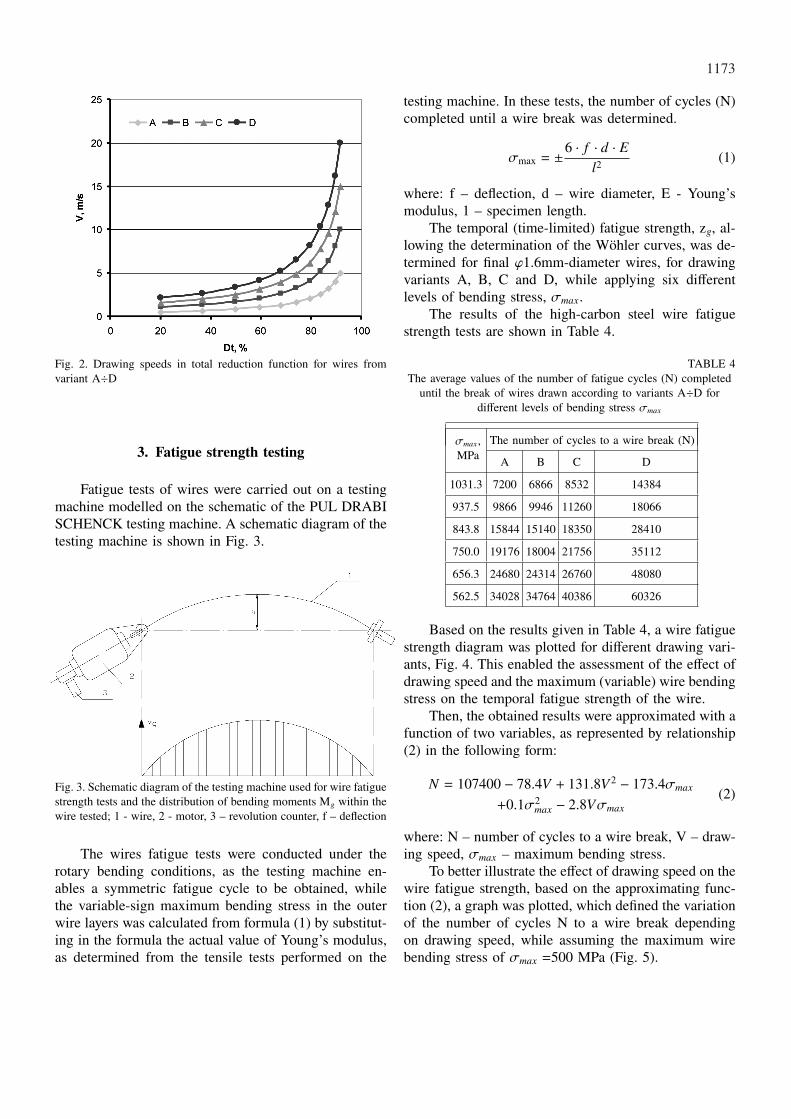
Fatigue tests of wires were carried out on a testingmachine modelled on the schematic of the PUL DRABISCHENCK testing machine. A schematic diagram of thetesting machine is shown in Fig. 3.
Fig. 3. Schematic diagram of the testing machine used for wire fatiguestrength tests and the distribution of bending moments Mg within thewire tested; 1 - wire, 2 - motor, 3 – revolution counter, f – deflection
The wires fatigue tests were conducted under therotary bending conditions, as the testing machine en-ables a symmetric fatigue cycle to be obtained, whilethe variable-sign maximum bending stress in the outerwire layers was calculated from formula (1) by substitut-ing in the formula the actual value of Young’s modulus,as determined from the tensile tests performed on the
testing machine. In these tests, the number of cycles (N)completed until a wire break was determined.
σmax = ±6 · f · d · El2
(1)
where: f – deflection, d – wire diameter, E - Young’smodulus, 1 – specimen length.
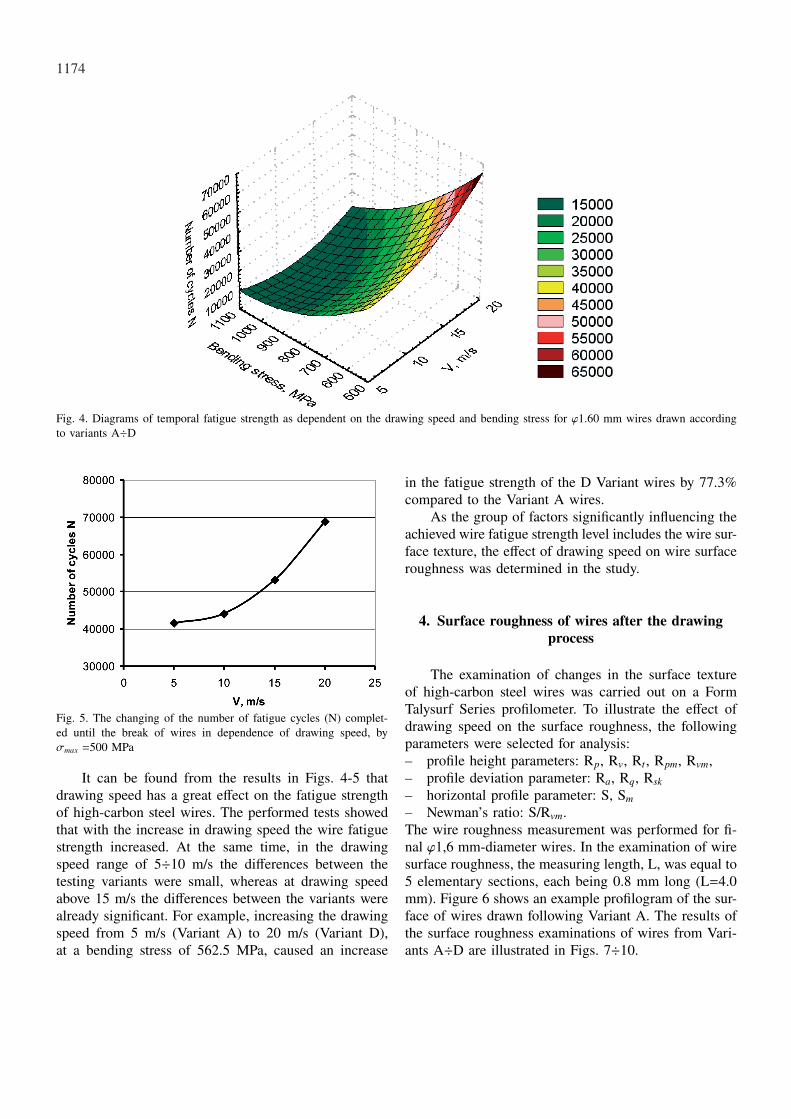
The temporal (time-limited) fatigue strength, zg, al-lowing the determination of the Wohler curves, was de-termined for final ϕ1.6mm-diameter wires, for drawingvariants A, B, C and D, while applying six differentlevels of bending stress, σmax.
The results of the high-carbon steel wire fatiguestrength tests are shown in Table 4.
TABLE 4The average values of the number of fatigue cycles (N) completed
until the break of wires drawn according to variants A÷D fordifferent levels of bending stress σmax
σmax ,MPa
The number of cycles to a wire break (N)
A B C D
1031.3 7200 6866 8532 14384
937.5 9866 9946 11260 18066
843.8 15844 15140 18350 28410
750.0 19176 18004 21756 35112
656.3 24680 24314 26760 48080
562.5 34028 34764 40386 60326
Based on the results given in Table 4, a wire fatiguestrength diagram was plotted for different drawing vari-ants, Fig. 4. This enabled the assessment of the effect ofdrawing speed and the maximum (variable) wire bendingstress on the temporal fatigue strength of the wire.
Then, the obtained results were approximated with afunction of two variables, as represented by relationship(2) in the following form:
N = 107400 − 78.4V + 131.8V 2 − 173.4σmax
+0.1σ2max − 2.8Vσmax
(2)
where: N – number of cycles to a wire break, V – draw-ing speed, σmax – maximum bending stress.
To better illustrate the effect of drawing speed on thewire fatigue strength, based on the approximating func-tion (2), a graph was plotted, which defined the variationof the number of cycles N to a wire break dependingon drawing speed, while assuming the maximum wirebending stress of σmax =500 MPa (Fig. 5).
1174
Fig. 4. Diagrams of temporal fatigue strength as dependent on the drawing speed and bending stress for ϕ1.60 mm wires drawn accordingto variants A÷D
Fig. 5. The changing of the number of fatigue cycles (N) complet-ed until the break of wires in dependence of drawing speed, byσmax =500 MPa
It can be found from the results in Figs. 4-5 thatdrawing speed has a great effect on the fatigue strengthof high-carbon steel wires. The performed tests showedthat with the increase in drawing speed the wire fatiguestrength increased. At the same time, in the drawingspeed range of 5÷10 m/s the differences between thetesting variants were small, whereas at drawing speedabove 15 m/s the differences between the variants werealready significant. For example, increasing the drawingspeed from 5 m/s (Variant A) to 20 m/s (Variant D),at a bending stress of 562.5 MPa, caused an increase
in the fatigue strength of the D Variant wires by 77.3%compared to the Variant A wires.
As the group of factors significantly influencing theachieved wire fatigue strength level includes the wire sur-face texture, the effect of drawing speed on wire surfaceroughness was determined in the study.
4. Surface roughness of wires after the drawingprocess
The examination of changes in the surface textureof high-carbon steel wires was carried out on a FormTalysurf Series profilometer. To illustrate the effect ofdrawing speed on the surface roughness, the followingparameters were selected for analysis:– profile height parameters: Rp, Rv, Rt , Rpm, Rvm,– profile deviation parameter: Ra, Rq, Rsk– horizontal profile parameter: S, Sm– Newman’s ratio: S/Rvm.The wire roughness measurement was performed for fi-nal ϕ1,6 mm-diameter wires. In the examination of wiresurface roughness, the measuring length, L, was equal to5 elementary sections, each being 0.8 mm long (L=4.0mm). Figure 6 shows an example profilogram of the sur-face of wires drawn following Variant A. The results ofthe surface roughness examinations of wires from Vari-ants A÷D are illustrated in Figs. 7÷10.

1175
Fig. 6. A profilogram of the surface of ϕ1.20 mm wires (Variant A) along the measuring length
Fig. 7. The changing of value of the profile height parameters of the surface roughness of wires of diameters of ϕ1.6 mm drawn in drawingspeed function
Fig. 8. The changing of value of the profile deviation parameter of the surface roughness of wires of diameters of ϕ1.6 mm drawn in drawingspeed function

1176
Fig. 9. The changing of value of of the horizontal parameters of the surface roughness of wires of diameters of ϕ1.6 mm drawn in drawingspeed function
Fig. 10. Changing of values of Newman’s ratio, S/Rvm, of the sur-face roughness of wires of diameters of ϕ1.6 mm in drawing speedfunction
From the data in Fig. 7 it can be found that draw-ing speed influences the profile height parameters. Thewires from Variant D (Vc=20m/s), as compared to thewires from variant A (Vc=5 m/s), have definitely low-er surface roughness, which is also evidenced by thesmaller values of Rp, Rv, Rt , Rpm, Rvm. The differencesbetween Variants A and D range from 74 to 85 %. It isfound that low values of the profile height parameters,and particularly the defect depth Rvm, for wires drawnat high speeds (Variant D) may positively influence thewire fatigue strength.
For the profile deviation parameter, Ra, Rq, Rsk ,the value of these parameters decreases with increas-ing drawing speed. These parameters for the wires fromVariant D are from 39% to 77% smaller compared tothe A Variant wires (Fig. 8).
From the data represented in Fig. 9 it is found thatfor the horizontal parameters the wires drawn at highdrawing speeds have a smaller distance between adjacentprofile hills.
The data in Fig. 10 shows that the wire drawn at highdrawing speeds are distinguished by greater Newman’sratio. The differences between the extreme variants, i.e.A and D, amounted to above 300%. Higher Newman’sratio values are indicative of lower susceptibility to crackinitiation in the sub-surface layers of wires drawn at high
drawing speeds. This, in turn, leads to an increase in theirfatigue strength.
5. Numerical analysis of the drawing process
The group of factors influencing the fatigue strengthof wire includes the hardening of the sub-surface layer,which is the sum of the homogeneous strain resultingfrom the cross-section reduction and the redundant strainthat increases the strain inhomogeneity. The maximumredundant strain values occur in sub-surface layers, whilein the wire axis they are close to zero; hence, in thestudy, the redundant strains were determined on the wiresurface.
The experimental determination of the distributionof redundant strain over the drawn wire cross-section isdifficult to accomplish; therefore a theoretical analysisof this problem based on the software program Draw-ing 2D [8] is put forward in the article. Simulation ofthe multi-stage drawing process was performed for wireof pearlitic-ferritic steel C75 (∼0.75%C) with the singlereduction of area, the reduction of area and the drawingspeeds shown in Tables 2÷3. Depending on the drawingspeed, the following friction coefficient were assumed:0.065; 0.067; 0.075; 0.09 (the friction coefficient valueswere taken from study [3]).
In the visualization of distribution of a particularparameter, the Drawing 2D program provides the capa-bility to read out the numerical value of that parameterfor each of the triangular grid nodes, which enables thedistributions of redundant strain over the cross-sectionof wires upon exit from the drawing die sizing part tobe determined. Figure 11 presents an example redundantstrain distribution over the cross-section of 1.6 mm wireddrawn according to Variant B. While Figure 12 showsthe distribution of redundant strain over the wire surfacedepending on the total reduction in area and drawingspeed.

1177
Fig. 11. The distribution of redundant strain of 1,6 mm diameter wires drawn according to variant B
Fig. 12. The distribution of redundant strain εxy on the surface of wires in total reduction of area and drawing speed function
From the data shown in Fig. 12 it can be foundthat using high drawing speed (above 15 m/s) in thehigh-carbon steel wire drawing process causes a signif-icant increase in redundant strain on the wire surface.Up to a total reduction of approx. Dt=80%, the dif-ference between the drawing variants examined amountto around 20%. While with a total reduction of areaof Dt=91%, these differences are much larger. Thesub-surface layers in the Variant D wires exhibit a re-dundant strain larger by approx. 41% compared to thewires from Variant A. Obviously, such a large redundantstrain increase in the wires drawn according to VariantD (V=20 m/s) should be associated with the impairmentof lubrication conditions.
Larger redundant strain values in wires drawn athigh speeds indicate higher material hardening. As aconsequence, more hardened subs-surface layers of wiresdrawn at high speeds should be distinguished by defi-nitely better resistance to the action of variable bendingstresses.
6. Findings and conclusions
The investigations carried out have led to the fol-lowing findings and conclusions:1. High drawing speed markedly influences the fatigue
strength of high-carbon steel wires. Wires drawnwith the drawing speed of 20 m/s exhibit much,

1178
i.e. by approx. 80%, higher temporal fatigue strengthcompared to wires drawn with the drawing speed of5 m/s.
2. The tests carried out have demonstrated that drawinghigh-carbon steel wires with high drawing speeds re-sults in a decrease in the surface roughness (smooth-ing of the drawn wire surface). The Variant D wiresshow profile height parameters (Rp, Rv, Rt , Rpm) low-er by 74 to 85% and profile deviation parameters (Ra,Rq, Rsk) lower by 39 to 77% compared to the wiresfrom Variant A.
3. The increase in drawing speed (notably above 15m/s) not only causes a decrease in roughness para-meters, but also results in the formation of a surfacedefect configuration such that delays the initiationof micro-cracks. Higher Newman’s ratio values areindicative of lower susceptibility to crack initiationin the sub-surface layers of wires drawn with highdrawing speeds.
4. It has been found that the distinct surface smoothingof wires drawn at the speed of 20 m/s is likely tobe associated with poorer lubrication conditions inthe drawing process. In the wire regions, where onlypartial separation of the surface with a lubricant layerhas taken place, wire surface tops are shorn, whichleads to a decrease in surface roughness.
5. The sub-surface layers in the wires from Variant D(V=20 m/s) exhibit a redundant strain larger by ap-prox. 40% compared to the wires from Variant A(V=5 m/s). As a consequence, the more hardenedsub-surface layers of wires drawn with high draw-ing speeds should be characterized by better resis-tance to the action of variable bending stresses, thuscontributing to an increase in the fatigue strength ofwires, specifically those from Variant D (V=20 m/s).
6. The definitely higher fatigue strength of high-carbonsteel wires drawn with high drawing speeds shouldmake for increasing the fatigue life of hoisting ropes.
7. The obtained investigation results could be utilizedin the wire drawing industry in the implementa-tion of new technologies for high-speed drawing ofhigh-carbon steel wires.
REFERENCES
[1] O. P a w e l s k i, H. V o l l m e r, Thermische Sim-ulation des Einflusses der Ziehgeschwindigkeit aufdie mechanischen Eigenschaften gezogener Stahldrahte,Arch. Eisenhuttenw 47, 1, 9-13 (1976).
[2] M. S u l i g a, The influence of the high drawing speedon mechanical-technological properties of high carbonsteel wires, Archieves of Metallurgy and Materials,Quarterly 56, 3, Warszawa-Kraków, 823-828 (2011).
[3] M. S u l i g a, The influence of drawing speed onmulti-pass drawing process of high carbon steel wires,Metallurgist-Metallurgical News (Hutnik-WiadomościHutnicze) 1, 132-135 (2011).
[4] J. Ł u k s z a, A. S k o ł y s z e w s k i, F. W i t e k, W.Z a c h a r i a s z, Druty ze stali i stopów specjalnych,Wydawnictwo Naukowo-Techniczne, Warszawa (2006).
[5] B. G o l i s, J.W. P i l a r c z y k, Druty stalowe. Met-alurgia Nr 35, Politechnika Częstochowska, Często-chowa (2003).
[6] Z. M u s k a l s k i, Analiza wpływu kierunku ciągnieniadrutów na ich wytrzymałość zmęczeniową i trwałośćzmęczeniową lin stalowych, Seria Metalurgia nr 43, Po-litechnika Częstochowska, Częstochowa (2004).
[7] M. S u l i g a, The influence of the multipass drawingprocess in classical and hydrodynamic dies on residualstresses of high carbon steel wires, Archieves of Metal-lurgy and Materials Quarterly 56, 4, Warszawa-Kraków,939-944 (2011).
[8] A.A. M i l e n i n, B.P.B. G a u t h a m, S.C. G o y a l,J. P i l a r c z y k, Z. M u s k a l s k i, FEM simulationof wire fracture phenomena during multi-pass drawing,Wire Journal International, 93-99, October (2008).
Received: 10 May 2012.