2DECIDE - trimis.ec.europa.eu · Elena Caprile, Paul Riley, Alexandra Kumpoštová First full draft...
116
2DECIDE Toolkit for sustainable decision making in ITS deployment D2.1 - Data Collection and Documentation Version 1.0 Public 2DECIDE is a Coordination and support action funded by the European Commission, DG Directorate-General for Mobility and Transport (MOVE) in the FP7-SST-2008-TREN1 programme
Transcript of 2DECIDE - trimis.ec.europa.eu · Elena Caprile, Paul Riley, Alexandra Kumpoštová First full draft...

2DECIDE
Toolkit for sustainable decision making in ITS deployment
D2.1 - Data Collection and Documentation
Version
1.0
Public
2DECIDE is a Coordination and support action funded by the
European Commission, DG Directorate-General for Mobility and Transport (MOVE)
in the FP7-SST-2008-TREN1 programme

2DECIDE
Coordination and support action
Page 2 of 117
Contract Number:
TREN/FP7TR/233608/”2DECIDE”
Acronym:
2DECIDE
Title:
Toolkit for sustainable decision making in ITS deployment
Date of delivery:
21st March 2011
Main author(s) or editor(s):
Luca Studer (Politecnico di Milano)
Giovanna Marchionni (Politecnico di Milano)
Elena Caprile (Politecnico di Milano)
Paul Riley (Jacobs Consultancy)
Alexandra Kumpoštová (Jacobs Consultancy)
Roberto Maja (Politecnico di Milano)
Alberto Colorni (Politecnico di Milano)
Version History:
Version Date Main contributor(s) Summary of changes
0.5 September 2010
Paul Riley, Alexandra Kumpoštová, Luca Studer, Giovanna Marchionni, Elena Caprile
2Decide Reports Extended Database Guide
0.7 December 2010
Paul Riley, Alexandra Kumpoštová, Luca Studer, Giovanna Marchionni, Elena Caprile
2Decide Reports Extended Database Guide
0.9 January 2011
Luca Studer, Giovanna Marchionni, Elena Caprile, Paul Riley, Alexandra Kumpoštová
First full draft with content to all chapters
1.0 March 2011
Luca Studer, Giovanna Marchionni, Elena Caprile
Comments of EC accepted

2DECIDE
Coordination and support action
Page 3 of 117
List of the 2DECIDE Project Partners:
Beneficiaryno.
Beneficiary name Beneficiaryshort name
Country
1 (coordinator)
AustriaTech - Federal Agency for Technological Measures Ltd.
ATE Austria
2 ECORYS Nederland BV ECO Netherlands
3 Egis Mobilité S.A. EGI France
4 VTT - Valtion teknillinen tutkimuskeskus (Technical Research Centre of Finland)
VTT Finland
5 Transver TRV Germany
6 Genua Consult GEN Denmark
7 Politecnico di Milano – Dipartimento Indaco, Laboratory for mobility and transport
POL Italy
8 Jacobs Consultancy spol. s.r.o. JBA Czech Republic
9 Vereinigung High Tech Marketing HTM Austria
10 EXODUS S.A. EXO Greece
11 Algoé Consultants ALG France
12 Center for Research and Technology Hellas HIT Greece
13 Rapp Trans (UK) Ltd. RAP United Kingdom
14 Mobycon BV MOB Netherlands

2DECIDE
Coordination and support action
Page 4 of 117
Table of contents Figure indexes 5
Table indexes 6
1 WP2 Activities 7
1.1 Introduction 7
1.2 WP2 Objectives 7
1.3 WP2 Activities 9
1.4 Relations and Contacts of 2DECIDE with UK Department for Transport’s and IBEC14
1.5 Copyrights Issues 14
2 Reports Collection 15
2.1 Introduction 15
2.2 Database Structure 16
3 Collected Reports 29
3.1 Introduction and methodology 29
3.2 Analysis of studies in the (partially cleaned) long-list 32
4 Analysis of Reports entered in the Database 37
4.1 Introduction 37
4.2 Analysis by Geographical Coverage 37
4.3 Analysis by Area of Transport 40
4.4 Analysis by ITS Service 44
4.5 Analysis by Problems 50
4.6 Analysis by Goals and Objectives 57
4.7 Analysis by Type of Evaluation 62
4.8 Analysis by Quality of Report 62
4.9 Analysis by Country 63
4.10 Conclusion 64
5 Reports Extended Access Database Guide 66
5.1 General information 66
5.2 Database fields description 70
5.3 Assessment results description 81
Annex 1 - 2DECIDE Document Use within the ITS Toolkit 100
2DECIDE
Coordination and support action
Page 5 of 117
Figure indexes
FIGURE 1.1 – IMPROVED DATA ACQUISITION WITHIN DECISION MAKING PROCESS WITH THE HELP OF 2DECIDE. ......................... 7
FIGURE 1.2 – GEOGRAPHICAL DISTRIBUTION OF THE 2DECIDE CONSORTIUM PARTNERS ........................................................ 8
FIGURE 1.4 – INTERRELATION OF THE OF WP2 WITH OTHERS WORK PACKAGES ................................................................... 10
FIGURE 1.5 – EXAMPLE OF SCREENSHOT OF DATABASE VERSION 9 (GENERAL DATA SECTION) ............................................... 10
FIGURE 1.6 – EXAMPLE OF SCREENSHOT OF DATABASE VERSION 9 (IMPACT SECTION) .......................................................... 11
FIGURE 1.7 – WP2 ACTIVITIES .................................................................................................................................. 13
FIGURE 1.8 – WP2 DATA ENTRY ACTIVITIES ................................................................................................................ 13
FIGURE 2.1 - SCREENSHOT OF INSERTFORM ................................................................................................................. 18
FIGURE 2.2 – GEOGRAPHICAL COVERAGE CATEGORIES ................................................................................................... 19
FIGURE 2.3 – AREA OF TRANSPORT CATEGORIES ........................................................................................................... 20
FIGURE 2.4 – ITS SERVICE CATEGORIES ....................................................................................................................... 21
FIGURE 2.5 – PROBLEMS CATEGORIES ........................................................................................................................ 22
FIGURE 2.6 – GOALS AND OBJECTIVE CATEGORIES ........................................................................................................ 23
FIGURE 2.7 - SCREENSHOT OF DOCUMENTINPUT FORM ................................................................................................. 25
FIGURE 2.8 – SCREENSHOT OF FORMINSERT_DTV FORM, THAT IS THE FORM TO INSERT DATA FOR DECREASE TRAFFIC VIOLATIONS
IMPACT ......................................................................................................................................................... 26
FIGURE 2.9 – SCREENSHOT OF FORMINSERT_BM ......................................................................................................... 27
FIGURE 3.1 - DISTRIBUTION OF THE STUDIES/RECORDS FROM THE LONGLIST INTO ITS CATEGORY MARKET PACKAGES.................. 33
FIGURE 3.2 - THE TOTAL NUMBER OF STUDIES/RECORDS PER COUNTRY .............................................................................. 34
FIGURE 4.1 – NUMBER OF REPORTS BY GEOGRAPHICAL COVERAGE. .................................................................................. 39
FIGURE 4.2 – NUMBER OF RECORDS PER AREA OF TRANSPORT. ........................................................................................ 42
FIGURE 4.3 – NUMBER OF RECORDS PER AREA OF TRANSPORT, WITH THE SEVERAL SUBCLASSES HIGHLIGHTED FOR THE CATEGORY
PASSENGER TRANSPORT. .................................................................................................................................. 43
FIGURE 4.4 – DISTRIBUTION OF THE NUMBER OF STUDIES PER ITS SERVICE. ........................................................................ 46
FIGURE 4.5 – DISTRIBUTION OF THE NUMBER OF STUDIES FOR THE SUBCATEGORY ITS SERVICE - TRAFFIC MANAGEMENT AND
OPERATIONS SERVICES - TRAFFIC MANAGEMENT AND CONTROL. ............................................................................. 49
FIGURE 4.6 – DISTRIBUTION OF THE NUMBER OF REPORTS FOR THE CLASS PROBLEMS. ......................................................... 53
FIGURE 4.7 – DISTRIBUTION OF THE NUMBER OF REPORTS FOR THE SEVERAL SUBCLASSES OF THE CATEGORY PROBLEMS. ............ 54
FIGURE 4.8 – CROSS DISTRIBUTION BETWEEN TWO CLASSES OF PROBLEMS. ....................................................................... 56
FIGURE 4.9 – DISTRIBUTION OF THE NUMBER OF STUDIES FOR THE CLASS GOALS AND OBJECTIVE. ........................................... 60
FIGURE 4.10 – DISTRIBUTION OF THE NUMBER OF REPORTS FOR THE SEVERAL SUBCLASSES OF THE CATEGORY GOALS AND OBJECTIVE.
.................................................................................................................................................................... 61
FIGURE 4.11 - DISTRIBUTION OF THE NUMBER OF STUDIES PER TYPE OF EVALUATION. ......................................................... 62
FIGURE 4.12 – DISTRIBUTION OF THE NUMBER OF STUDIES PER REPORT QUALITY BASED ON THE TYPE OF EVALUATION. ............. 63

2DECIDE
Coordination and support action
Page 6 of 117
Table indexes
TABLE 2.1 – DATABASE HISTORY ................................................................................................................................ 15
TABLE 3.1 - NUMBER OF STUDIES/RECORDS IN THE LONGLIST DISTRIBUTED INTO ITS SERVICE MARKET PACKAGES ...................... 33
TABLE 3.2 - THE TOTAL NUMBER OF STUDIES/RECORDS PER GEOGRAPHICAL COVERAGE ........................................................ 34
TABLE 3.3 - THE TOTAL NUMBER OF STUDIES/RECORDS PER GEOGRAPHICAL COVERAGE ........................................................ 35
TABLE 3.4 - THE TOTAL NUMBER OF STUDIES/RECORDS PER TYPE OF THE REPORT ................................................................ 36
TABLE 3.5 - THE TOTAL NUMBER OF STUDIES/RECORDS PER TYPE OF THE REPORT ................................................................ 36
TABLE 4.1 – NUMBER OF REPORTS INCLUDED IN THE DATABASE BASED ON THE NUMBER OF RECORDS THEY ARE ENTERED INTO THE
DATABASE WITH .............................................................................................................................................. 37
TABLE 4.2 – NUMBER OF REPORTS DIVIDED BY GEOGRAPHICAL COVERAGE. ........................................................................ 38
TABLE 4.3 – CLASSIFICATION BY AREA OF TRANSPORT .................................................................................................... 40
TABLE 4.4 – NUMBER OF STUDIES AND PERCENTAGE WITH RESPECT TO THE TOTAL PER ITS SERVICE. ....................................... 44
TABLE 4.5 – NUMBER OF STUDIES AND PERCENTAGE WITH RESPECT TO THE PARTIAL SUM FOR THE CATEGORY INTELLIGENT VEHICLE
SERVICES ....................................................................................................................................................... 47
TABLE 4.6 – NUMBER OF STUDIES AND PERCENTAGE WITH RESPECT TO THE PARTIAL SUM FOR THE CATEGORY TRAFFIC
MANAGEMENT AND OPERATIONS SERVICES ......................................................................................................... 48
TABLE 4.7 – NUMBER OF STUDIES AND PERCENTAGE WITH RESPECT TO THE TOTAL FOR THE CLASS PROBLEMS. .......................... 50
TABLE 4.8 – DISTRIBUTION OF LEVEL 2-SUBCLASSES IF THE REFERENCE CLASSES FOR PROBLEMS1 AND PROBLEMS2 ARE
CONGESTION. ................................................................................................................................................. 55
TABLE 4.9 – NUMBER OF STUDIES AND PERCENTAGE WITH RESPECT TO THE TOTAL FOR THE CLASS GOALS AND OBJECTIVE. .......... 57
TABLE 4.10 – NUMBER OF STUDIES AND PERCENTAGE WITH RESPECT TO THE TOTAL PER TYPE OF EVALUATION. ........................ 62
TABLE 4.11 – NUMBER OF STUDIES AND PERCENTAGE WITH RESPECT TO THE TOTAL PER REPORT QUALITY. .............................. 63
TABLE 4.12 – NUMBER OF STUDIES AND PERCENTAGE WITH RESPECT TO THE TOTAL PER COUNTRY. ........................................ 64

2DECIDE
Coordination and support action
Page 7 of 117
1 WP2 Activities
1.1 Introduction
This Deliverable describes the activities of 2DECIDE‟s Work Package 2 “Data Collection and
Documentation”. All analysis and results refer to January 2011. As WP2 will last until the end of the
Project the conclusion are subjected to changes.
1.2 WP2 Objectives
The main objectives of the Work Package 2 “Data Collection and Documentation” are:
• To build up the database that feeds the 2DECIDE-toolkit.
• To collect Reports (Evaluation Reports and Case Studies) around Europe (or World).
• to provide a broad range of structured data inputs into the subsequent knowledge base
development (done in WP3) which will give advice on impacts of different ITS applications
in different (socio-economic and technical) contexts. To integrate as much data as possible
from the available documented experience.
• to provide illustrative descriptions of practice in the field and in particular to give detailed
information on fully evaluated cases.
Figure 1.1 – Improved data acquisition within decision making process with the help of 2DECIDE.

2DECIDE
Coordination and support action
Page 8 of 117
As shown in Figure 1.1, the WP2 aims at collecting all the experiences which will otherwise remain
distributed and scattered around Europe and by the several subjects that implemented or studied the
ITS.
Each partner collected the case studies and the evaluation reports especially in his home Country
and within his network of contacts and with the help of the Supporting Partners. The dimension of the
Consortium, his expertise and the number of direct covered Countries is a guarantee of success for
the Reports collection (see Figure 1.2).
Figure 1.2 – Geographical distribution of the 2DECIDE consortium partners

2DECIDE
Coordination and support action
Page 9 of 117
1.3 WP2 Activities
The WP2 has a crucial role in the organization of the Project 2DECIDE. The activities of the WP2 are
strictly correlated with the work done within the WP1 “Toolkit Design and Specification”, while from
the WP3 “Knowledge Base Development of ITS Applications” it receives specifications and provides
the data bank to which the Evaluation Matrix is to be applied. The data bank is then migrated on-line
thanks to the cooperation with the WP4 “Software Tool Development and Validation”.
Figure 1.3, Figure 1.4 and Figure 1.5 show how the structure of the database used to collect Case
Studies and Evaluation Reports was defined based on the results given by the WP1, and in
particular from Task 1.1 “User Requirements”. The classification of the ITS, the definition of the
contexts where the ITS has been implemented, the problems that the ITS is going to solve as well as
its objectives were analyzed within the Task 1.3, and in particular in the Deliverable “D1.1 –
Selection Criteria and classification of ITS applications”. The definition of impact indicators, unit of
measurement, etc. was extremely relevant and precise, which is used to catalogue the ITS under
consideration. This activity was (and is still being) carried out starting from the results of Task 1.4
“Decision Tree and Evaluation Matrix”, in close contact with the WP3 that is going to plan the
Inference Engine.
It was decided to build the database on the electronic support Windows Access 2007, and to share it
among the Partners in order to allow each of them to enter the information required separately.
Once the database was populated with Reports, the interaction with the WP3 was started to define
the features of the Inference Engine in detail, as well as to test its results. As described below, data
entry campaigns were carried out in several phases, on one hand to create a data bank to satisfy the
minimum requirements in terms of quality and coverage of the several ITS, and on the other hand to
make resources available for Partners when entering Reports. By data entry campaigns we mean
the entry into the database of information from the collected Reports.
Finally, in December 2010, the database was transferred to the WP4 to be put online, first for
Partners only for controls and processing aims, and then integrated into the ITS Toolkit.

2DECIDE
Coordination and support action
Page 10 of 117
Figure 1.3 – Interrelation of the of WP2 with others work packages
Figure 1.4 – Example of Screenshot of Database version 9 (General Data Section)
WP1:
User Inputs
WP3:
Indicators
Definition

2DECIDE
Coordination and support action
Page 11 of 117
Figure 1.5 – Example of Screenshot of Database version 9 (Impact section)
The collection of Case Studies and Evaluation Reports of interest for 2DECIDE was organized as
follows (see Figure 1.6 and Figure 1.7)
First of all, a collection of high quality studies on the part of the Partners based on their
experience and network of acquaintances; the Partners shared a series of data banks / web
sites / organizations that may contain interesting Reports; some elementary but essential
information for each study was entered into the “Short Reporting Scheme”; this simplified
scheme aimed at identifying each time the studies that had the proper characteristics
(regarding quality, type of ITS, geographical coverage, etc) to satisfy the requirements of the
Project (see also the Inference Engine). Until January 2011 around 1200 Reports were
collected (see Chapter 3 for further details) to be chosen from, to enter into the database
and therefore make available with the Toolkit. The considerable use of the resources to
enter the information contained in the Reports into the database forced the Consortium to
select the Reports not to use up all the resources available to the WP2. The principle
governing the selection of the Reports to enter is a good coverage in terms of “ITS Service”,
“Area of Transport” and “Geographical Coverage”, besides the needs expressed by the WP3
of course. Only those projects with sufficiently detailed evaluation and those without such
documentation but considered of sufficient interest are included.
The structure of the database was defined (for further details see Chapter 2); information,
impact indicators and in general all the fields of the data bank were defined by the WP2 and
shared with all the Partners, especially with the WP3, which on a case-by-case basis
increased and extended the quantity of information to be entered and therefore extracted

2DECIDE
Coordination and support action
Page 12 of 117
from the Reports available in the DB to characterize each study; fields and indicators had to
be increased to allow the correct functioning of the Inference Engine and to reach the results
expected from the Toolkit. As already said, in this phase the structure is mainly based on the
following input from Partner Task 1.3 Deliverable “D1.1 – Selection Criteria and classification
of ITS applications” and Task 1.4 “Decision Tree and Evaluation Matrix”.
To support and ease the data entry operation by Partners and even out the understanding of
the fields, a Guidance was drawn up and from time to time updated (see Chapter 5).
Once the database was consolidated, campaigns were started to enter into the database the
information contained in the Reports collected.
The first data entry campaign was carried out in August 2010. Once all the databases filled
up by Partners were collected, they were merged into a single database which is common
and shared.
This first version of the filled up database was made available to the WP3, which could test
the correct application of the rules of the Inference Engine and then give indications on how
to proceed with the data entry.
The Partners‟ comments over the first data entry campaign were then collected, as well as
the indications on the part of the WP3 on the modification, addition or elimination of impact
indicators or database fields.
Subsequently, two further data entry moments occurred in October and November 2010. On
specific request of the WP3, they aimed at having enough cases to analyze for the following
ITS Services: “Traffic Management and Operations Services” and “Public Transport
Service”.
Finally, in December 2010 the results in the DB version 9 were shared with Partners during
the meeting held in Helsinki, and the Consortium decided to transfer the DB on-line in order
to favor sharing among Partners and set up the final and public version of the Toolkit. The
database was sent on 23 December 2010 to EXODUS (as responsible of the WP4) and to
VTT (as Leader of the WP3), as well as to AUSTRIATECH (as Project Manager).

2DECIDE
Coordination and support action
Page 13 of 117
Figure 1.6 – WP2 Activities
Figure 1.7 – WP2 Data Entry Activities
DB
Version 1
WP1WP3
Partners
DB
Version 2
Guidance
Version 2
WP1WP3
Partners
DB
Version 8
Guidance
Version 8
WP1WP3
Partners
DB
Version 9
Guidance
Version 9
WP1WP3/4
Partners
WP4

2DECIDE
Coordination and support action
Page 14 of 117
1.4 Relations and Contacts of 2DECIDE with UK Department for
Transport‟s and IBEC
Two meetings were held in order to discuss the relations and possible exchange of information
between UK Department for Transport‟s and IBEC (International Benefits, Evaluation and Costs
Working Group).
The UK Department of transport has developed his own ITS Toolkit which has been online from
2004 on and contains about 150 British ITS evaluation reports on ITS systems (see also D4.1
Business model). By the time of the meeting the future of the UK ITS toolkit was fairly uncertain due
to major restructuring measures in the UK DoT. An achievement was the willingness for cooperation
from both sides (e.g. mutual referencing by links) by the two toolkits. A complete integration of the
DoT Toolkit‟s content into 2DECIDE was not feasible due to differences in data structure and
content. By autumn 2010 EGIS managed to achieve the understanding that 2DECIDE is allowed to
contact the authors of the content in the DfT in case it is relevant to the 2DECIDE project and
established directed liaison with the Highways Agency (HA).
At that time of the meeting with IBEC the project was aiming to get access to material produced by
IBEC which was considered positively by the IBEC representative. However IBEC stated that it
usually does not produce documents on single projects but rather summaries of knowledge on ITS
technologies. In principle IBEC is willing to allow the use of any of their material available at the IBEC
website, to facilitate the mutual cross linking between the websites and the possible linking of the
users of the ITS Toolkit to the IBEC community.
1.5 Copyrights Issues
Due to the fact that the 2DECIDE Toolkit will contain many Reports owned by the Authors the
Copyright Issues became a relevant Task. The mechanism developed for the proper handling of
copy right protected material is to obtain a written consent of the copy right owner about the usage of
parts of articles and reports. The written consent, the “2DECIDE Permission to Use Copyrighted
Material” contains a description of the handling of content by the ITS Toolkit and a list of all articles
form each editor/author concerned. For the case of previously unpublished materials the “2DECIDE
Document Use Agreement” form serves as a more simple form of the first document described and
addresses rather authors than editors. The document handling strategies have been elaborated with
an expert on IPR and copy right expert who was hired as consultant. The document handling
strategies are the same in both forms of consent (Permission to Use Copyrighted Material and
Document Use Agreement). The consent is approved by the signature of both – AustriaTech
representing the 2DECIDE project and the author/editor. The written forms of the consents are
currently administrated by the project coordinator AustriaTech.
Once the ITS Toolkit is handed over to the future maintaining body the collected written consents will
be handed over. It is advisable to establish a relationship to the authors/editors to, first hand, inform
about the new maintaining body of the ITS Toolkit and to secondly facilitate the access to further
material from the editors and authors in the same or a similar manner.
A specific document containing all material related to these issues (see Annex1) is managing this.

2DECIDE
Coordination and support action
Page 15 of 117
2 Reports Collection
2.1 Introduction
Nine version of the DB have been developed. Input data tables and forms have been updated and
amended as needed by Partners during data entry phase.
In the first version, the DB design was based on Deliverable 1.1 and on the outcomes of the
Amsterdam and Athens meetings. There was a first suggestion of the Evaluation Indicators. This
was a result of the linking between the EASYWAY Evaluation Expert Group Indicators and
2DECIDE‟s Goals and Objectives .
After the first data entering were developed subsequent versions with necessary changes, according
to the needs of the Partners who entered data.
The final definition of the structure of the DB is based on the agreement with WP 1, WP2, WP3 and
the outcomes of the Milan and Paris meetings. The fields are described in the Guidance (see
Chapter 5).
In the Table 2.1 the steps from the previous to the final version are shown.
Table 2.1 – Database history
Version number and
Title
Differences/Changes Sent on
2Decide Extended
Reports Database 01
18/06/2010
2Decide Extended
Reports Database 02
and 03
Modified DB according to comments by Partners after data
entry test. Main changes:
Added fields regarding section on 2DECIDE contact
person
Added “Save” buttons
Corrected some mistakes
Validated some fields to avoid typing errors
Changed some impacts: feasibility assessment split in
4 + Technical Performance added
08/07/2010
2Decide Extended
Reports Database 04
Modified DB according to first comments by Partners during
meeting in Milan.
15/07/2010
2Decide Extended
Reports Database 05
Modified DB according to comments by Partners after data
entry test. Main changes:
Added, erased and updated fields
Updated ITS List table with one more sub-choice
(adapted to PIARC Classification), based on Specified
Classification of ITS Services_TRV20100721 from
28/07/2010

2DECIDE
Coordination and support action
Page 16 of 117
Alex Dinkel & Khaled El-Araby
For every indicators field Value erased; fields Value
before, Value After, Change, Percentage Change
added
2Decide Extended
Reports Database 06
Modified DB according to indications and needs in
2DECIDE_database guidance_JC5. Main changes:
Added indicator concerning the quality of reports (only
for internal use)
Developed tool to check the data entered (added
button “View Data”, designed ten sheets that allow
viewing General information and information about
impacts)
Modified tables (AreaOfTransportList,
GeographicalCoverageList, IndicatorsList, ITSList)
05/10/2010
2Decide Extended
Reports Database 07
Repaired truncated fields 08/10/2010
2Decide Extended
Reports Database 08
Updated reports from Data Entry Phase 1
Merged reports regarding TM/VMS
Added fields for indicators regarding User Acceptance
and Cost/Benefit Information impacts
03/11/2010
2Decide Extended
Reports Database 09
Merged reports with all updates from the partners (added new
reports and updated fields with the newest values)
Database sent to Exodus (WP4), VTT (WP3) and Austriatech
(Project Manager)
23/12/2010
2.2 Database Structure
The database is structured in five main tables: CaseStudy, Impact_1, Impact_2, Impact_3, Impact_4,
with the necessary fields to store all the information required by inference engine for processing and
retrieving data from the inserted studies (it was not possible to use only one table because the DB
has reached a total of about 800 fields and a table can have „only‟ 255 fields) and secondary tables
(CountryList, AreaOfTransportList, etc.), containing the lists of values that can be selected for a
faster data entry. The Database was developed in Access 2007 format (other versions do not allow
extended text entry).
All the records are stored in a big matrix where each Report is a row and each information is a
column/field. Every record of the five main tables has an identification number that uniquely defines
the Report and links/joints the tables together.
To facilitate data entry forms were created. The database is composed of three types of forms:
InsertForm..
DocumentInput.
FormInsert_Impact acronym .

2DECIDE
Coordination and support action
Page 17 of 117
All fields are described in depth in the Guidance (see Chapter 5). In the next Chapters the overview
of the fields is represented.
It was also implemented a function that allow to view the data entered for each report (View Data
Button).
InsertForm
InsertForm is the first form for entering information (Figure 2.1). Here is possible to insert general
information about the Report. Above, the description of the data you can fill in.
Title (original language)
Title (in english)
Number of source in short reporting scheme
Quality of the report (internal use)
2DECIDE Partner who entered the report
Geographical coverage
Area of transport
ITS service
Problems
Goals and objective
ITS description
Context/problems to be solved/objectives.
Planning and implementation.
Obstacles.
Lessons learnt, factors of success.
Type of evaluation.
Methodologies used.
Source/Quality assessment.

2DECIDE
Coordination and support action
Page 18 of 117
Figure 2.1 - Screenshot of InsertForm

2DECIDE
Coordination and support action
Page 19 of 117
Figure 2.2 – Geographical Coverage Categories

2DECIDE
Coordination and support action
Page 20 of 117
Figure 2.3 – Area of Transport Categories

2DECIDE
Coordination and support action
Page 21 of 117
Figure 2.4 – ITS Service Categories
2DECIDE
Coordination and support action
Page 22 of 117
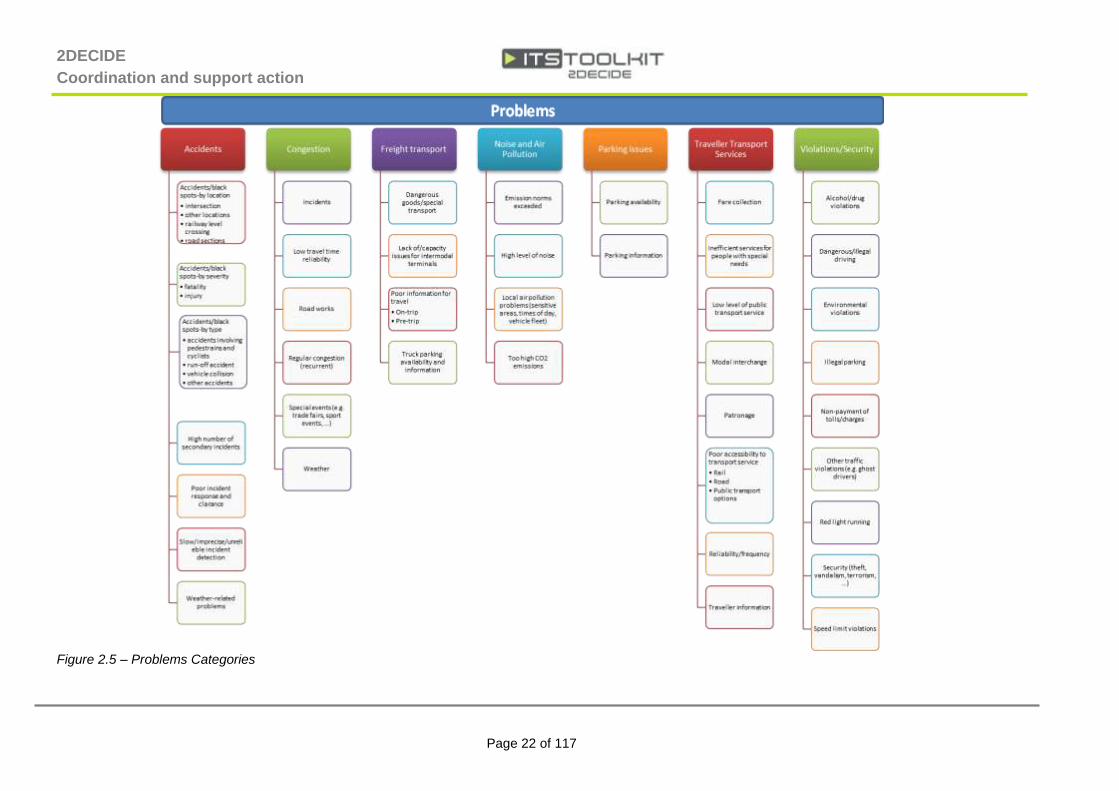
Figure 2.5 – Problems Categories

2DECIDE
Coordination and support action
Page 23 of 117
Figure 2.6 – Goals and Objective Categories

2DECIDE
Coordination and support action
Page 24 of 117
DocumentInput
In this form is possible to enter information about the report (Document, Author/s, Company)(Figure
2.7). Above, the description of the data you can fill in.
Document original language
Programme/Project
Country
Year of Syudy/Report
Year of implementation
Year of the data
Original document name
Document source
Document weblink
Copy Right claimed
Document use agreement
Author/s of the original report
Author/s Company
Company Name
UnitDivision
Name
Company e-mail
Free text (additional info)

2DECIDE
Coordination and support action
Page 25 of 117
Figure 2.7 - Screenshot of DocumentInput Form
FormInsert_Impact acronym
These are twenty (one for each impact) forms where is possible to insert data about the indicators of
the impacts. The final definition of the impacts, their indicators and the maximum number of
indicators allowed for every impact was the result of the needs and with the agreement with WP1
and WP3.
After a brief description, is possible to insert up to three or ten indicators for impact (it depends on
the impact).
For each indicator is possible to insert:
Description
Unit
value of indicator before the deployment of, or without the ITS service/application
value of indicator after the deployment of, or with the ITS service/application
change of indicator value from before/without to after/with, calculated as
valueafter/with - valuebefore/without
% change of indicator value from before/without to after/with, calculated as
100 (valueafter/with - valuebefore/without)/valuebefore/without

2DECIDE
Coordination and support action
Page 26 of 117
Figure 2.8 – Screenshot of FormInsert_DTV form, that is the form to insert data for Decrease Traffic
Violations Impact
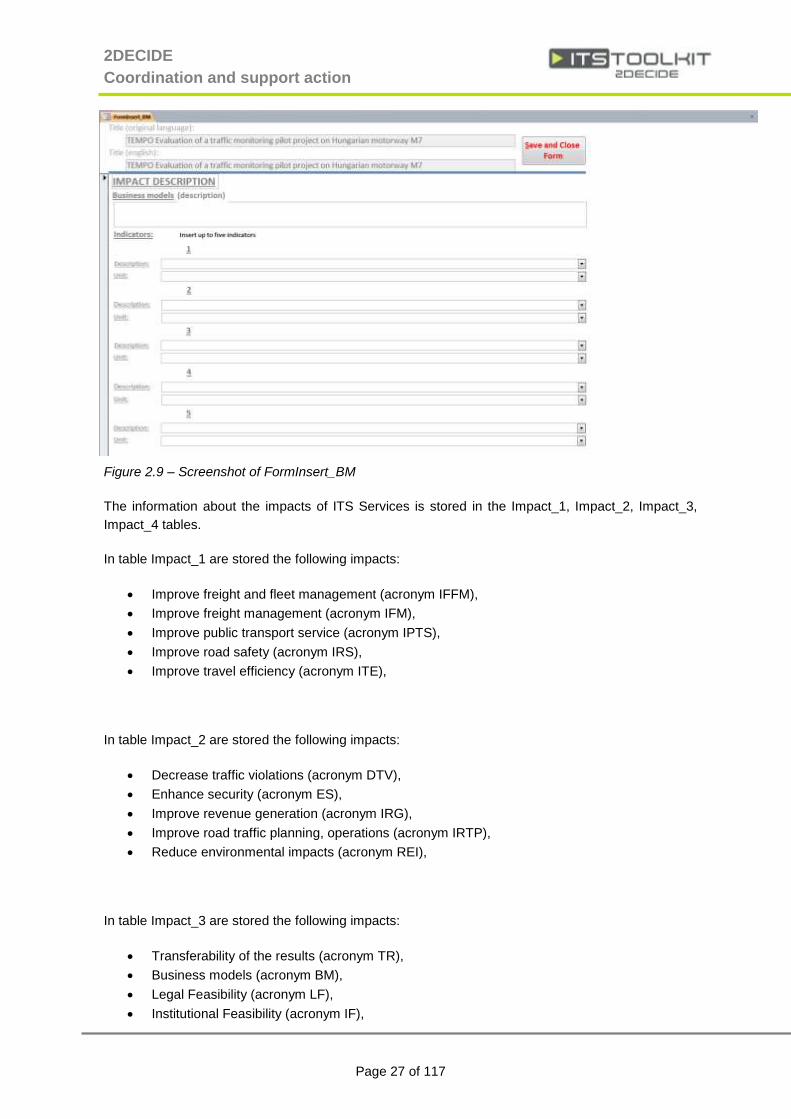
Business Model impact is the only one that differs from other . For this indicator is possible to insert
(as shown in Figure 2.9):
Description
Unit
Value
2DECIDE
Coordination and support action
Page 27 of 117
Figure 2.9 – Screenshot of FormInsert_BM
The information about the impacts of ITS Services is stored in the Impact_1, Impact_2, Impact_3,
Impact_4 tables.
In table Impact_1 are stored the following impacts:
Improve freight and fleet management (acronym IFFM),
Improve freight management (acronym IFM),
Improve public transport service (acronym IPTS),
Improve road safety (acronym IRS),
Improve travel efficiency (acronym ITE),
In table Impact_2 are stored the following impacts:
Decrease traffic violations (acronym DTV),
Enhance security (acronym ES),
Improve revenue generation (acronym IRG),
Improve road traffic planning, operations (acronym IRTP),
Reduce environmental impacts (acronym REI),
In table Impact_3 are stored the following impacts:
Transferability of the results (acronym TR),
Business models (acronym BM),
Legal Feasibility (acronym LF),
Institutional Feasibility (acronym IF),

2DECIDE
Coordination and support action
Page 28 of 117
Technical Feasibility (acronym TF),
Financial Feasibility (acronym FF),
Technical performance (acronym TP), 3
Technical performance - Service quality (acronym TPSQ),
In table Impact_4 are stored the following impacts:
User acceptance (acronym UA),
Cost/Benefit informations (acronym CBI).

2DECIDE
Coordination and support action
Page 29 of 117
3 Collected Reports
3.1 Introduction and methodology
As was mentioned in chapter 1, the main objective of the WP2 task is to prepare a database of case
and evaluation studies related to ITS implementation, demonstrations etc., review the data included
in the reports and elaborate relevant data with added value into a structure that can provide a broad
range of structured data inputs into the subsequent knowledge base development (done in WP3)
which will give advice on impacts of different ITS applications in different (socio-economic and
technical) contexts.
The first step in the practical process of report collection was to gather as many available studies
(case studies, evaluation reports, final reports, feasibility studies etc.) as possible, classify them, sort
them and set up a selection process for inclusion in the database. The process of collecting available
documented studies. The steps can be described as follows :
1. Preparation of a short reporting/classification scheme for study collection
2. Preparation of a long-list of studies
3. Long list analysis - Analysis of gaps in country coverage, ITS service coverage,
assessment of aspects of incompleteness and quality
4. Creation of basic criteria set for prioritising selection of studies to be elaborated
into the database
3.1.1 Short reporting scheme for the long-list of studies
The following short reporting scheme including the following information fields was proposed in order
to faciliate the study selection process :
SOURCE No. LANGUAGE
TITLE TYPE OF REPORT
DATE (mm/yyyy) DATA AVAILABILITY (in terms of quality)
ITS SERVICE 2DECIDE partner who provided the study
GEOGRAPHICAL COVERAGE REFERENCE (Author and Company
Responsible of ITS)
AREA OF TRANSPORT COMMENTS
COUNTRY
Data availability (quality) was judged only approximately at this stage. At the stage of entry into the
database, a more structured analysis was made.
3.1.2 Preparation of the longlist of studies
The identification and short reporting of long-list of case studies which presents an overview of
available cases and evaluation studies, feasibility studies, pilots, and experiments was in progress
from April 2010 till end of June 2010. Within this period a total number of 1538 CS and ES was
documented in the longlist.

2DECIDE
Coordination and support action
Page 30 of 117
Most of the project partners were involved in identifying, scanning and classifying individual studies
in their home countries and other places where they had strong contacts. In addition a number of
web databases and EU project sources were investigated and documented:
National research databases or
Internet library of national road
operators
(Ministries of transport, research
institutes, laboratories, etc.)
http://www.maatregelencatalogus.nl/literatuur.php
http://www.dodehoekpreventie.nl/en-GB/references-and-
links/,
http://www.incidentmanagement.nl
www.escota.fr, www.cofiroute.fr
www.asf.fr, www.sanef.com, www.inrets.fr
www.let.fr, http://www.zelt-fr.org/, www.certu.fr,
http://www.setra.equipement.gouv.fr/
http://www.predim.org/
www.transumofootprint.nl,
www.repository.tudelft.nl, www.ntc.gov.an, www.dft.gov.uk,
www.connekt.nl,www.itsdocs.fhwa.dot.gov,
http://database.calccit.org,
http://ntl.bts.gov, www.fta.dot.gov,
www.mlit.go.jp, www.krstc.in,
www.fietsberaad.nl, www.fta.dot.gov,
www.kpw.nl, www.verkeerenwaterstaat.nl,
www.highways.gov.uk
European transport research
databases and databases of different
european cooperation groups and
initiatives
www.esafety-effects-database.org
www.cedr.fr
http://www.polis-online.org
TRB- Transportation Research Board
European transport research or
development programmes
www.easyway-its.eu
ELTIS, ATLANTIC, CAPE, ADEPT II, AUSIAS, CAPITALS,
CAPTURE, CONVERGE, CARISMA, COREM,
CLEOPATRA, CROMATICA, COSMOS, ECHO,
DACCORD, EOLIA, DUMAS, EPISODE, ENTERPRICE,
ESCORT, EURAMP, EURONAV, European Digital Cities,
EUROSCOPE, EUROPETRIS, HEAVEN, EUROSPIN,
INCOME, EUROTRACKS, INFOPOLIS, EU SPIRIT,
INFOTEN, EVIDENCE, IN-RESPONSE, FARAWAY,
OPIUM, FORCE, 1, PORTAL, FORCE 2, PRIME, GNSS,
PRISCILLA, HANNIBAL, PRIVILEGE, INARTE, POMPT,
CHAUFFEUR, QUARTET, PLUS, INITIATIVE, ROMANSE,
INTACT, ROSETTA, INTERCEPT, SAMPLUS,
INTERPORT, SAMPO, MARCO, SMARTNETS, MORANE,
TABASCO, MOVE, IT, VOYAGER, MULTITRACK,
UTOPIA, PISCES, UTMC, POSEIDON, ROSIN,
SANCICOM, SAVE, SHIDESS, SUPRA, TEAM, TELSCAN,
TITAN, TRACAR, VERA, VADEMECUM, VASCO
The analysis was made with the use of MS excel. After the basic first collection process, the list was
centrally reviewed for duplications and incomplete or non-standardised description of the case and
evaluation studies (returned for revision and completion). Studies graded as having poor quality of

2DECIDE
Coordination and support action
Page 31 of 117
information were eliminated. In total, 1192 studies with normal or above information quality were
identified in this first period of reports collection
3.1.3 Long list analysis - Analysis of gaps in country coverage, ITS service
coverage, assessment of aspects of incompleteness and quality
At the end of August 2010, the final number of reports registered in the long list was 1564, (all
reports including poor quality). This number however the number of rows in the excel file because
when the particular analysis was made later on it was found that some of the studies are in the excel
file twice (recommended from more partners) or that one study can cover more ITS services or kinds
of transport, etc. Within the process of detailed elaboration of concrete studies it was also found that
some studies assessed as normal quality didn‟t reach the required quality in the toolkit. So the final
number of unique acceptable studies will be closer to the range 800 – 1000. A final long-list will be
produced after the final filtering and cleaning process which is still ongoing as studies are still being
elaborated.
The next phase of identification and collection of case and evaluation studies was focused only on
identifying and filling gaps. WP2 proposed a basic coverage for selection of case and evaluation
studies short list to be elaborated into the database:
At least normal quality
Min. 1 study for each ITS service (essential)
Min. 1 study for each transport area
Min 10 studies for each geographical area
Min. 1 study for each EU country (if at all possible)
Ratio of Evaluations / Case studies circa 2:1
Based on this, a gap analysis was made and other studies sought by the partners to complete the
gaps as well as possible.
The detailed analysis results of the long-list of studies with normal quality or above (coverage of ITS
service, geographical area, country, languages) is provided in chapter 3.2. The analysis was made at
the end of July 2010.
3.1.4 Creation of basic criteria set for selection into the database
The main selection criteria for studies to go into the database (resources do not allow all to be
documented) were suggested as follows to ensure that the best quality studies were included and
that a maximum of empirical data was included to feed the inference engine :
CASE STUDIES – priority levels for selection:
1. excellent
2. good quality
3. normal quality
2DECIDE
Coordination and support action
Page 32 of 117
EVALUATIONS – priority levels for selection ::
1. ex-post evaluation / excellent quality
2. ex-post evaluation / good quality
3. ex-post evaluation / normal quality
4. ex-ante evaluation / excellent quality
5. ex-ante evaluation / good quality
3.2 Analysis of studies in the (partially cleaned) long-list
In the follows sub-chapters we present an analysis of the content of the long-list of studies, which
forms a picking list for entry into the database. In total, 1192 studies/records with normal or above
information quality identified in the first period were analysed.
3.2.1 Analysis by ITS Service
Within 2DECIDE, the concept of ”market package‟‟ was used to aggregate and classify various ITS
applications and services. Market packages represent slices of ITS deployments that address
specific services like traffic management, public transport, traffic information, freight information, etc.
The detailed information of the process leading to final definition of market/submarket packages is
part of the Deliverable D1.1 – Selection criteria and classification of ITS applications.
Basic ITS Service Areas Classification with examples of submarket packages of ITS services are:
Traveller Information Services - Pre-Trip information, On-Trip information, etc.
Traffic Management and Operations - Traffic Management and Control, Incident
Management, Demand Management, etc.
Intelligent Vehicle Services - Vision Enhancement, Automated vehicle operations, etc.
Freight Transport Management - Intelligent Truck Parking, Management of dangerous goods
etc.
Public Transport - Public transport management, Demand-responsive and shared transport
Emergency Services - Emergency vehicle management, Hazardous material and incident
notification, etc.
Electronic Payment - Transport-related Electronic Financial Transactions, Integration of
Transport Related Electronic Payment Services
Road Transport Personal Safety - Public Travel Security, Safety Enhancements for Vulnerable
Road Users, etc.
Weather and Environmental monitoring - Weather monitoring, Environmental conditions
monitoring

2DECIDE
Coordination and support action
Page 33 of 117
Disaster response management and co-ordination - Disaster data management,
Disaster response management, Co-ordination with
emergency services
The total number of studies/records classified in individual ITS categories is provided in the table
below. As was mentioned before the analysis is made of reports status from the end of July.
Table 3.1 - Number of studies/records in the longlist distributed into ITS service market packages
ITS service market packages The quality of reports Total
Excellent Good Normal
Traveller Information Services 84 124 86 294
Traffic Management and Operations 85 219 130 435
Intelligent Vehicle Services 36 82 12 131
Freight Transport Management 11 46 4 61
Public Transport 10 65 37 112
Emergency Services 4 1 1 6
Electronic Payment 5 26 29 60
Road Transport Personal Safety 2 19 14 35
Weather and Environmental monitoring 11 16 12 39
Disaster response management and co-ordination 0 0 2 2
Other 17
The quality of the source was assessed on a 3 mark scale: “normal”, “good or very good” and
“excellent”. This is clearly a relative scale. Normal is really a minimal quality level.
Figure 3.1 - Distribution of the studies/records from the longlist into ITS category market packages
As the percentage shows the basic criteria to have minimally one study per ITS category is fulfilled
but some ITS categories aren´t well covered. Namely are the following:

2DECIDE
Coordination and support action
Page 34 of 117
Emergency services and Disaster response management and coordination.
3.2.2 Analysis by Country
The analysis showed that majority of studies/records origins in ITS technology and research
advanced countries such as Germany, UK, France, Netherlands and Finland. Numerous groups also
create the studies/records with European (international) participation.
Figure 3.2 - The total number of studies/records per country
3.2.3 Analysis by Geographical coverage
Table 3.2 - The total number of studies/records per geographical coverage
Geographical coverage
Quality of data in the study Total
Excellent Good Normal
Europe 5 23 13 41
Nation (country) 24 114 67 205
No specific geographical coverage (e.g. a wide range of geographical contexts depending on the project or activity)
45 45 71 161
Region (Province, county, etc) - Cross-border/intra-region area 18 44 12 74
Region (Province, county, etc) - Local area 57 136 59 252
Urban Area (city) - Large metropolitan area (over 1 million inhabitants)
29 61 34 124
Urban Area (city) - Medium metropolitan area (250 000 to 1 million inhabitants)
62 140 60 262
Urban Area (city) - Small metropolitan area (100 000 to 250 000 inhabitants)
6 21 19 46
Urban Area (city) - Small town or city (under 100 000 inhabitants)
2 22 8 32

2DECIDE
Coordination and support action
Page 35 of 117
Table 3.3 - The total number of studies/records per geographical coverage
Geographical coverage Quality of data in the study
Total Excellent Good Normal
Europe 2% 3.8% 3.8% 3.4%
Nation (country) 9.7% 18.8% 19.5% 17.1%
No specific geographical coverage (e.g. a wide range of geographical contexts depending on the project or activity) 18.2% 7.4% 20.7% 13.5%
Region (Province, county, etc) - Cross-border/intra-region area 7.3% 7.3% 3.5% 6.2%
Region (Province, county, etc) - Local area 23% 22.4% 17.2% 21.1%
Urban Area (city) - Large metropolitan area (over 1 million inhabitants) 11.7% 10.1% 9.91% 10.4%
Urban Area (city) - Medium metropolitan area (250 000 to 1 million inhabitants) 25% 23.1% 17.49% 21.9%
Urban Area (city) - Small metropolitan area (100 000 to 250 000 inhabitants) 2.4% 3.5% 5.5% 3.8%
Urban Area (city) - Small town or city (under 100 000 inhabitants) 0.8% 3.6% 2.3% 2.7%
3.2.4 Analysis by Type of Report/Evaluation
The key aspects of quality per study type were defined to have unified and consistent approach for
scoring within the longlist and database.
Ex-post evaluation:
Ex-post evaluation (known also as Post-Implementation Evaluation) is carried out after a telematics
system or application has been implemented, to compare observed results following implementation
with expected results of the pre-implementation evaluation.
Pilot – experiment - test:
This is an on-road trial of a new application which may or may not have been initially tested in an off-
road trial. Pilot studies are often used to test the technical feasibility of a telematics application,
and/or to carry out a preliminary assessment of the impacts of a new telematics application. The
focus of a pilot study is on the assessment of the technical performance and impacts of the
application.
Case study:
Case study is the description of the implemented ITS with more focus on problems solved, planning
and implementation issues, lessons learnt, factor of success and costs.
Ex-ante evaluation:
Ex-ante evaluation (known also as Pre-Implementation Evaluation) concerns the appraisal of a
telematics application prior to its implementation. In this instance, expected benefits are anticipated,
based on modelling techniques and/or possibly previous experience of similar applications in similar
locations.

2DECIDE
Coordination and support action
Page 36 of 117
Feasibility study:
This is a study usually carried out at an early stage of any project to determine the practicability of a
implementing a telematics application or system. They tend to be small-scale studies to determine
whether or not to proceed to a pilot study or to put together a full business case. The outcomes of
the study are assessed against reference figures and a recommendation on the best way to proceed
is made.
Table 3.4 - The total number of studies/records per Type of the report
TYPE OF REPORT
Quality of data in the study
Total Excellent Good Normal
Case Study 65 232 161 458
Ex - ante Evaluation 55 103 36 194
Ex - post & ex-ante Evaluation 1 1 2
Ex - post Evaluation 96 169 72 337
Experimentation Study report 1 2 3
Feasibility Study 7 42 38 87
Study report 1 17 18
Technical fact sheets 6 6
Test - Experimentation 23 35 36 94
Table 3.5 - The total number of studies/records per Type of the report
TYPE OF REPORT Quality of data in the study
Total Excellent Good Normal
Case Study 26.2% 38.3% 46.7% 38.2%
Ex - ante Evaluation 22.2% 17% 10.4% 16.2%
Ex - post & ex-ante Evaluation 0.4% 0.2% 0 % 0.2%
Ex - post Evaluation 38.7% 27.9% 20.9% 28%
Experimentation Study report 0 % 0.2% 0.6% 0.3%
Feasibility Study 2.8% 6.9% 11 % 7.3%
Study report 0.4% 2.8% 0 % 1.5%
Technical fact sheets 0 % 1 % 0 % 0.5%
Test - Experimentation 9.3% 5.8% 10.4% 7.8%

2DECIDE
Coordination and support action
Page 37 of 117
4 Analysis of Reports entered in the Database
4.1 Introduction
This analysis is carried out based on the reports entered into the database version 9 in January
2011.
The database includes 164 reports analyzed in 201 records. In some cases a report includes the
analysis and evaluation of more than one ITS; for this reason studies of this type had to be divided
into several records.
In particular, 93% of reports have a single record and therefore occur only once in the database,
while 5 reports occur with two records each and represent 3% of the cases (see Table 4.1). Only one
report was divided into 12 records.
The analysis of the database is developed by evaluating the number of records included in the
database. The following part of this analysis will refer to the number of records.
The analysis is mainly carried out with respect to the parameters that build up the decision-making
matrix of the ITS toolkit. In the database more than one category can be entered for each report.
This is possible because a study may either refer to several categories of problems or have more
than one objective. This analysis is mainly carried out with respect to the first category entered by
referring to the several criteria and only in some cases the distribution of the same criteria over the
several choice options is analyzed (see Paragraph 4.5).
Table 4.1 – Number of reports included in the database based on the number of records they are
entered into the database with
Division of records per single report
Number of reports Percentage
1 152 93%
2 5 3%
3 2 1%
4 1 1%
5 1 1%
6 2 1%
12 1 1%
Total 164 100%
4.2 Analysis by Geographical Coverage
The analysis by geographical coverage shows a good coverage of Urban areas in Europe (92
records with a percentage of 46% over the total present records, see Table 4.2) with a higher
frequency of metropolitan areas having more than 250.000 residents (see Figure 4.1). Areas and
regions in Europe also show a good coverage, above all as far as local areas with 49 records are
concerned, which represent 24% of the total number of studies entered.

2DECIDE
Coordination and support action
Page 38 of 117
Corridors occurs with only one report.
Table 4.2 – Number of reports divided by geographical coverage.
Geographical Coverage Subcategories Frequency Percentage
All Europe
6 3%
All scales applicable (no specific coverage)
13 6%
Areas and regions in Europe
Cross border/intra region area 3 1%
Local area 49 24%
Region 5 2%
Areas and regions in Europe - Total
57 28%
Corridors
1 0%
National level
32 16%
Urban areas in Europe
Large metropolitan area 39 19%
(over 1 million inhabitants)
Medium metropolitan area
41 20% (250 000 to 1 million inhabitants)
Small metropolitan area
8 4% (100 000 to 250 000 inhabitants)
Small town or city 4 2%
(under 100 000 inhabitants)
Urban areas in Europe - Total
92 46%

2DECIDE
Coordination and support
Page 39 of 117
Figure 4.1 – Number of reports by geographical coverage.

2DECIDE
Coordination and support action
Page 40 of 117
4.3 Analysis by Area of Transport
Areas of transport are classified first of all into 3 macro categories: Freight Transport, Passenger
Transport and Transport Infrastructure.
Passenger Transport represents 84% of the number of studies collected, with a clear frequency of
the subcategory Road Transport with 114 reports, see Figure 4.2. In particular the subcategory
Motorways and expressways (TERN) represents 24% of the number of studies. All the subcategories
of the section Passenger Transport- Road Transport are well represented; in particular, 27 studies
occur for Major, secondary and rural roads and 17 for City streets (see Table 4.3). All the
subcategories of road transport have at least one report to represent them. Public Transport occurs
with 43 records with a good frequency of Regional, intercity and local bus/coach with 14 studies (7%
of the total records) and of All public transport services with 15 studies (7% of the total records), see
Table 4.3. In the histogram in Figure 4.3 it is possible to analyze the distribution of the studies
collected under the category Passenger Transport, divided into its several subcategories.
Urban Freight in the category Freight Transport is represented by 6 records (see Figure 4.2), while
no report occurs in the database for Freight by other modes (rail, water, sea), see Table 4.3.
The category Transport Infrastructure shows a good coverage as far as all the occurring
subcategories are concerned, except for Rail and bus stations, airports and ports and Intermodal
freight terminal, as the histogram in Figure 4.2 shows.
Table 4.3 – Classification by area of transport
Area of Transport Subcategories 1 Subcategories 2 Frequency Percentage
Freight Transport
All freight transport classes
- 2 1%
Freight by other modes (rail, water,
sea) - 0 0%
Long distance road freight haulage
(lorries) - 3 1%
Urban freight - 6 3%
Freight Transport Total
11 5%
Passenger Transport
Other Transport
All above modes 1 0%
Cycling 4 2%
Taxis 2 1%
Ferries 0 0%
Walking 2 1%
Public Transport
All public transport services 15 7%
Demand-responsive/Special-needs
PT 3 1%

2DECIDE
Coordination and support action
Page 41 of 117
Train services (heavy rail) 0 0%
Metro/Subway and Tram/Trolley
3 1%
Regional, intercity and local bus/coach
14 7%
- 8 4%
Road Transport
All road networks 8 4%
City streets 17 8%
Major, secondary and rural roads
27 13%
Motorways and expressways (TERN)
49 24%
- 13 6%
-1 - 2 1%
Passenger Transport Total
168 84%
Transport Infrastructure
All transport infrastructure
elements - 1 0%
Car Parks and truck parking Area
- 8 4%
Rail and bus station, airports and ports
- 0 0%
Intermodal freight terminal
0 0%
Toll plaza - 5 2%
- - 8 4%
Transport Infrastructure Total
22 11%
Total
201 100%
1 The symbol “-“ refers to the case where it wasn‟t possible to link the report to a specific area of
investigation or to the various subcategories. For this example, two reports were classified in the
Area of Transport - Passenger, but the sub-category (Road Transport, Public Transport, Other
Transport) wasn‟t specified.

2DECIDE
Coordination and support action
Page 42 of 117
Figure 4.2 – Number of records per Area of transport.

2DECIDE
Coordination and support action
Page 43 of 117
Figure 4.3 – Number of records per Area of Transport, with the several subclasses highlighted for the category Passenger Transport.

2DECIDE
Coordination and support action
Page 44 of 117
4.4 Analysis by ITS Service
The analysis carried out by ITS service shows a good representation of the studies referred to Traffic
Management and Operations Services (73 studies and a percentage with respect to the total of
36%), Public Transport Service (40 records and a percentage with respect to the total of 20%) and
Traveller Information Services (42 records and a percentage with respect to the total of 21%), see
Figure 4.4 and Table 4.4. The presence of such a high number of reports for the first two categories
with respect to the others is due to the necessity for the WP3 to favour the collection in the three
specific areas of interest in order to finalize the construction of the inference engine; the result
therefore does not show a higher diffusion of reports for the three classes mentioned. The other
categories are represented with a percentage with respect to the total studies entered which varies
from 1% in the case of Emergency Services up to 6% for Intelligent Vehicle Services.
Table 4.4 summarizes the percentage distribution with respect to the total studies entered for ITS
Service and the first reference subcategory. No study was entered for the category Disaster
response Management and Co-ordination Services. This table shows that some subcategories are
not represented by the studies collected; for example, no studies were entered for Public Transport
Services - Communication systems, Intelligent Vehicle Services - Co-Operative Systems, Road
Transport Related Personal Safety - Public travel security e Safety Enhancements for Disabled Road
Users.
Table 4.4 – Number of studies and percentage with respect to the total per ITS Service.
ITS Service Subcategories 1 Frequency Percentage
Emergency Services
Emergency Vehicle Management 1 1%
Hazardous Material and Incident Notification 1 1%
Transport Related Emergency Notification and Personal Security
1 1%
Emergency Services Total 3 1%
Freight Transport Management
Intelligent Truck Parking 3 1%
Management of Dangerous Freight (Hazardous Goods)
1 1%
- 6 3%
Freight Transport Management Total 10 5%
Intelligent Vehicle Services
Automated vehicle operations 5 2%
Safety readiness 6 3%
Vision enhancement 2 1%
Co-operative Systems 0 0%
Intelligent Vehicle Services Total 13 6%
Public Transport Services
Demand-responsive and Shared Transport 10 5%
Public Transport Electronic Payment 2 1%
Public Transport Management 19 9%
- 9 4%
Communication systems 0 0%
Public Transport Services Total 40 20%

2DECIDE
Coordination and support action
Page 45 of 117
ITS Service Subcategories 1 Frequency Percentage
Road Transport Related Personal Safety
Safety Enhancements for Vulnerable Road Users 3 1%
Public travel security 0 0%
Safety Enhancements for Disabled Road Users 0 0%
Safety Provisions for Pedestrians Using Intelligent Junctions and Links
2 1%
Road Transport Related Personal Safety Total 5 2%
Traffic Management and Operations Services
Demand Management 1 1%
Incident Management 4 2%
Policing / Enforcement 4 2%
Traffic Management and Control 63 31%
Transport Infrastructure Maintenance Management
1 1%
Traffic Management and Operations Services Total 73 36%
Transport-related Electronic Payment
Services
Integration of Transport Related Electronic Payment Services
1 1%
Transport-related Electronic Financial Transactions
4 2%
- 2 1%
Transport-related Electronic Payment Services Total 7 3%
Traveller Information Services
On-Trip information 11 5%
Pre-Trip information 9 4%
Route Guidance and Navigation - on-trip 6 3%
Route Guidance and Navigation - pre-trip 1 1%
Travel Services Information 5 2%
Trip planning support 7 3%
- 3 1%
Traveller Information Services Total 42 21%
Weather and Environmental Conditions
Monitoring Services
Enviromental conditions monitoring 1 1%
Weather monitoring 4 2%
- 1 1%
Weather and Environmental Conditions Monitoring Services Total 6 3%
Disaster response Management and Co-
ordination Services
Disaster Data management 0 0%
Disaster Response management 0 0%
Coordination with emergency agencies 0 0%
Disaster response Management and Co-ordination Services Total 0 0%
-
2 1%
Total
201 100%

2DECIDE
Coordination and support action
Page 46 of 117
Figure 4.4 – Distribution of the number of studies per ITS service.
2DECIDE
Coordination and support action
Page 47 of 117
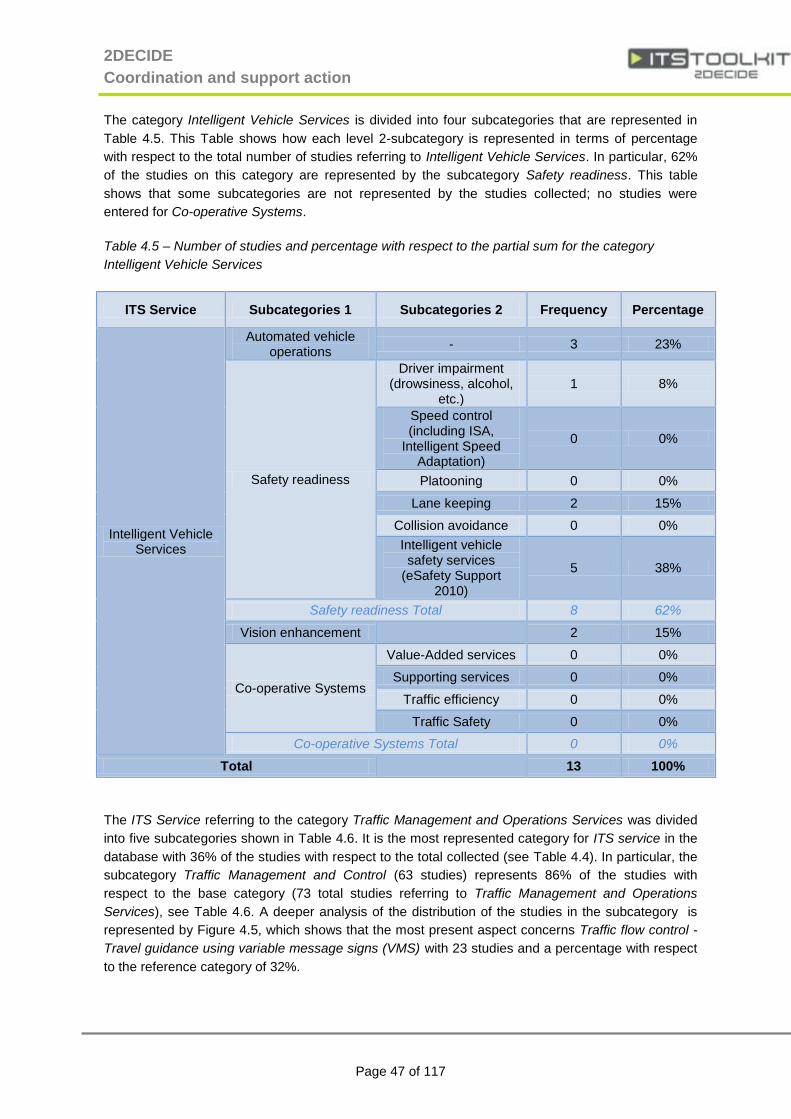
The category Intelligent Vehicle Services is divided into four subcategories that are represented in
Table 4.5. This Table shows how each level 2-subcategory is represented in terms of percentage
with respect to the total number of studies referring to Intelligent Vehicle Services. In particular, 62%
of the studies on this category are represented by the subcategory Safety readiness. This table
shows that some subcategories are not represented by the studies collected; no studies were
entered for Co-operative Systems.
Table 4.5 – Number of studies and percentage with respect to the partial sum for the category
Intelligent Vehicle Services
ITS Service Subcategories 1 Subcategories 2 Frequency Percentage
Intelligent Vehicle Services
Automated vehicle operations
- 3 23%
Safety readiness
Driver impairment (drowsiness, alcohol,
etc.) 1 8%
Speed control (including ISA,
Intelligent Speed Adaptation)
0 0%
Platooning 0 0%
Lane keeping 2 15%
Collision avoidance 0 0%
Intelligent vehicle safety services
(eSafety Support 2010)
5 38%
Safety readiness Total 8 62%
Vision enhancement
2 15%
Co-operative Systems
Value-Added services 0 0%
Supporting services 0 0%
Traffic efficiency 0 0%
Traffic Safety 0 0%
Co-operative Systems Total 0 0%
Total
13 100%
The ITS Service referring to the category Traffic Management and Operations Services was divided
into five subcategories shown in Table 4.6. It is the most represented category for ITS service in the
database with 36% of the studies with respect to the total collected (see Table 4.4). In particular, the
subcategory Traffic Management and Control (63 studies) represents 86% of the studies with
respect to the base category (73 total studies referring to Traffic Management and Operations
Services), see Table 4.6. A deeper analysis of the distribution of the studies in the subcategory is
represented by Figure 4.5, which shows that the most present aspect concerns Traffic flow control -
Travel guidance using variable message signs (VMS) with 23 studies and a percentage with respect
to the reference category of 32%.

2DECIDE
Coordination and support action
Page 48 of 117
Table 4.6 – Number of studies and percentage with respect to the partial sum for the category Traffic Management and Operations Services
ITS Service Subcategories 1 Subcategories 2 Subcategories 3 Frequency Percentage
Traffic Management
and Operations Services
Demand Management
1 1%
Incident Management
4 5%
Policing / Enforcement
4 5%
Traffic Management and Control
-
14 19%
Adaptive Traffic Control at Intersections
Delay minimisation, e.g., traffic control at one or more intersections
2 3%
Green wave 2 3%
Information Infrastructures
- 1 1%
Road Monitoring - Traffic monitoring
1 1%
Parking facilities management
2 3%
Planning and forecasting traffic conditions
1 1%
Traffic flow control
- 13 18%
Co-ordinated traffic management 2 3%
Travel guidance using variable message signs (VMS)
23 32%
Dynamic lane management 1 1%
Ramp metering 1 1%
Traffic Management and Control Total
63 86%
Transport Infrastructure Maintenance Management
1 1%
Total
73 100,00%

2DECIDE
Coordination and support action
Page 49 of 117
Figure 4.5 – Distribution of the number of studies for the subcategory ITS service - Traffic Management and Operations Services - Traffic Management and
Control.
2DECIDE
Coordination and support action
Page 50 of 117
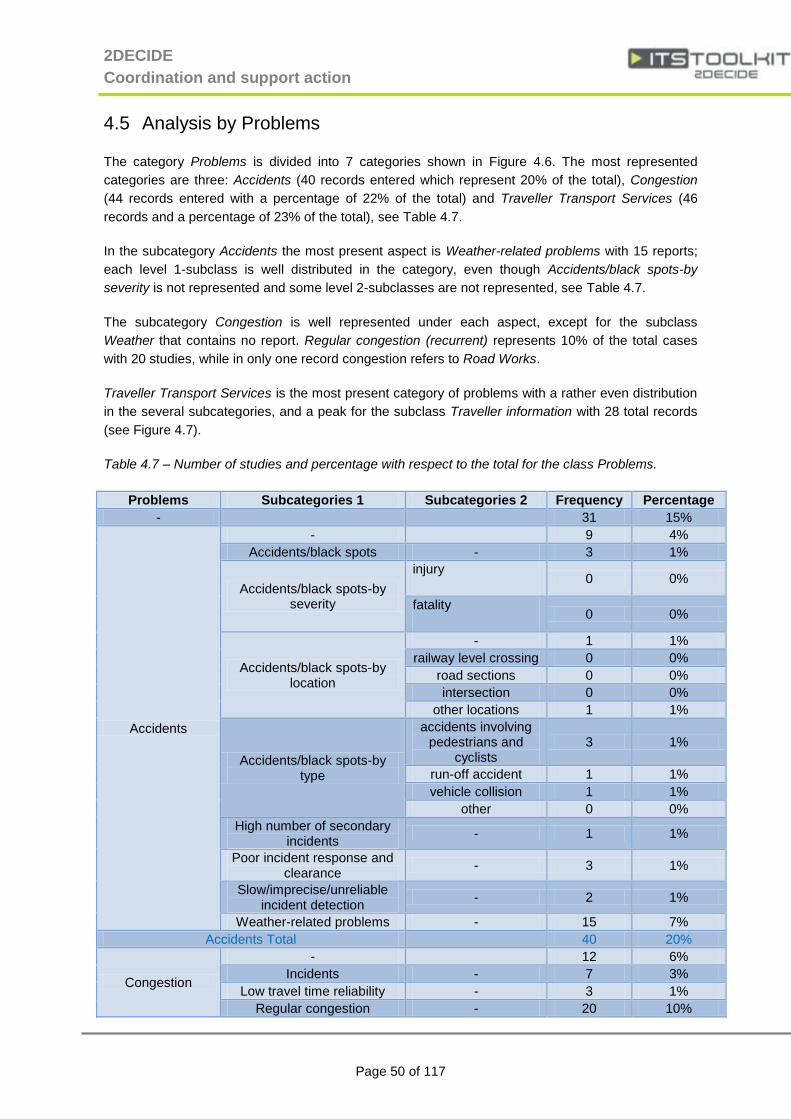
4.5 Analysis by Problems
The category Problems is divided into 7 categories shown in Figure 4.6. The most represented
categories are three: Accidents (40 records entered which represent 20% of the total), Congestion
(44 records entered with a percentage of 22% of the total) and Traveller Transport Services (46
records and a percentage of 23% of the total), see Table 4.7.
In the subcategory Accidents the most present aspect is Weather-related problems with 15 reports;
each level 1-subclass is well distributed in the category, even though Accidents/black spots-by
severity is not represented and some level 2-subclasses are not represented, see Table 4.7.
The subcategory Congestion is well represented under each aspect, except for the subclass
Weather that contains no report. Regular congestion (recurrent) represents 10% of the total cases
with 20 studies, while in only one record congestion refers to Road Works.
Traveller Transport Services is the most present category of problems with a rather even distribution
in the several subcategories, and a peak for the subclass Traveller information with 28 total records
(see Figure 4.7).
Table 4.7 – Number of studies and percentage with respect to the total for the class Problems.
Problems Subcategories 1 Subcategories 2 Frequency Percentage
-
31 15%
Accidents
-
9 4%
Accidents/black spots - 3 1%
Accidents/black spots-by severity
injury 0 0%
fatality 0 0%
Accidents/black spots-by location
- 1 1%
railway level crossing 0 0%
road sections 0 0%
intersection 0 0%
other locations 1 1%
Accidents/black spots-by type
accidents involving pedestrians and
cyclists 3 1%
run-off accident 1 1%
vehicle collision 1 1%
other 0 0%
High number of secondary incidents
- 1 1%
Poor incident response and clearance
- 3 1%
Slow/imprecise/unreliable incident detection
- 2 1%
Weather-related problems - 15 7%
Accidents Total
40 20%
Congestion
-
12 6%
Incidents - 7 3%
Low travel time reliability - 3 1%
Regular congestion - 20 10%

2DECIDE
Coordination and support action
Page 51 of 117
Problems Subcategories 1 Subcategories 2 Frequency Percentage
(recurrent)
Road works - 1 1%
Weather 0 0%
Special events (e.g. trade fairs, sport events, …)
- 1 1%
Congestion Total
44 22%
Freight transport
-
4 2%
Dangerous goods/special transport
0 0%
Truck parking availability and information
0 0%%
Lack of/capacity issues for intermodal terminals
- 1 1%
Poor information for travel - 1 1%
On trip 0 0%
Pre-trip 1 1%
Freight transport Total
7 3%
Noise and Air Pollution
-
2 1%
Emission norms exceeded - 3 1%
High level of noise - 5 2%
Too high CO2 emissions 0 0%
Local air pollution problems (sensitive areas, times of
day, vehicle fleet) - 4 2%
Noise and Air Pollution Total
14 7%
Parking issues
-
3 1%
Parking availability - 3 1%
Parking information - 1 1%
Parking issues Total
7 3%
Traveller Transport Services
-
3 1%
Fare collection - 1 1%
Inefficient services for people with special needs
- 1 1%
Low level of public transport service
- 6 3%
Modal interchange - 2 1%
Patronage - 1 1%
Poor accessibility to transport service
Public transport options
1 1%
Rail 0 0%
Road 0 0%
Reliability/frequency - 3 1%
Traveller information - 28 14%
Traveller Transport Services Total
46 23%
Violations/Security
-
2 1%
Dangerous/illegal driving - 2 1%
Red light running - 2 1%
Other traffic violations (e.g. ghost drivers)
0 0%
Environmental violations 0 0%
Illegal parking 0 0%
Non-payment of tolls/charges
0 0%

2DECIDE
Coordination and support action
Page 52 of 117
Problems Subcategories 1 Subcategories 2 Frequency Percentage
Alcohol/drug violations 0 0%
Security (theft, vandalism, terrorism, …)
- 1 1%
Speed limit violations - 5 3%
Violations/Security Total
12 6%
Total
201 100%

2DECIDE
Coordination and support action
Page 53 of 117
PB_1_1
Figure 4.6 – Distribution of the number of reports for the class Problems.

2DECIDE
Coordination and support action
Page 54 of 117
Figure 4.7 – Distribution of the number of reports for the several subclasses of the category Problems.

2DECIDE
Coordination and support action
Page 55 of 117
It is also possible to carry out a cross analysis with respect to the same category . As already
mentioned in the introduction, the database allows to enter more than one category into the same
section. In this way, if the ITS under analysis aims at solving several problems, this aspect can be
tracked. In the case of the category Problems, up to three different problems can be entered
(Problems1, Problems2 and Problems3) . Moreover, up to three different subclasses can be defined
for each category (Problems1.1, Problems1.2,Problems1.3,Problems2.1,Problems2.2, etc…). The
cross analysis of the first level class for the first two Problems shows that, once the category of the
first problem has been chosen (Problems1), the second problem will have the same category, too
(Problems2), while the subclasses entered will be different (Problems1.2, Problems1.3, Problems2.2,
Problems2.3), see Table 4.8. To make an example, if Problems1 is Congestion, most records where
Problems2 was entered will also be Congestion (see Figure 4.8).
Table 4.8 – Distribution of level 2-subclasses if the reference classes for Problems1 and Problems2
are Congestion.
Problems1.2 Problems2.2 Frequency
Incidents Regular congestion (recurrent) 3
Road works 2
Low travel time reliability Incidents 1
Regular congestion (recurrent) 2
Regular congestion (recurrent) Incidents 3
Total
11
The analysis shows quite a clear correlation between the classes Accident and Congestion, as well
as between the classes Congestion and Noise and Air pollution, (see Figure 4.8). However, in most
cases there isn‟t more than one Problems.

2DECIDE
Coordination and support action
Page 56 of 117
Figure 4.8 – Cross distribution between two classes of Problems.

2DECIDE
Coordination and support action
Page 57 of 117
4.6 Analysis by Goals and Objectives
The category Goals and Objectives is divided into 10 classes, nine of which occur in the database. In
particular, the classes Improve travel efficiency (54 studies with a percentage of 27% over the total),
Improve road safety (51 reports which represent 25% of the total) and Improve public transport
service (43 studies and a percentage of 21% of the total) show the highest number of reports
entered, see Table 4.9. On the contrary, the class Improve freight fleet management shows no
studies collected. The distribution of reports in the remaining classes is quite even, ranging from 3
reports (1% of the total) for the class Enhance security to 17 reports (8% of the total) for the category
Reduce environmental impacts, see Figure 4.9.
Goals and Objectives for the class Accidents has 45 reports in the subcategory Reduce Accidents
with a good distribution in the several level 2-subclasses: Exposure to accidents risk (6 reports),
Number of accidents (21 reports), Severity of accidents (1 report) and not specified (17 reports), see
Table 4.9 and Figure 4.9.
In the class Improve travel efficiency the most present subcategories are Reduce congestion with 24
records and Improve traveller information with 15 studies, see Figure 4.9.
The class Improve public transport service presents 21 records (10% of the total) for the subcategory
Improve public transport traveller information and 10 records (5% of the total) for the subcategory
Improve accessibility to public transport services, see Table 4.9 and Figure 4.9.
In particular, the most covered objectives in the database are the reduction of accidents or the
improvement of information to users.
Table 4.9 – Number of studies and percentage with respect to the total for the class Goals and
objective.
Goals and objective Subcategories 1 Subcategories 2 Frequency Percentage
- - - 4 2%
Decrease traffic violations
- - 1 1%
Improve monitoring and enforcement of violations
0 0%
Improve back-office management of
enforcement 0 0%
Improve compliance rates - 4 2%
Decrease traffic violations Total
5 2%
Enhance security
- - 2 1%
Improve planning for/mitigation of natural
disasters 0 0%
Increase security of
Infrastructure 0 0%
Terminals 0 0%
Transport services 0 0%
Increase feeling of security for travellers
0 0%
Improve prevention/detection of
crime, vandalism, terrorism,…
- 1 1%

2DECIDE
Coordination and support action
Page 58 of 117
Goals and objective Subcategories 1 Subcategories 2 Frequency Percentage
Enhance security Total
3 1%
Improve freight management
- - 1 1%
Improve freight management
- 1 1%
Improve inter-modal transfer
- 2 1%
Manage dangerous goods movement/special
transport 0 0%
Manage urban freight 0 0%
Promote use of non-road freight transport
0 0%
Improve truck parking Capacity 2 1%
Information 0 0%
Improve freight management Total
6 3%
Improve freight fleet management
Improve fleet management
Routing 0 0%
Scheduling 0 0%
Reduce transport cost and time
0 0%
Improve freight fleet management Total 0 0%
Improve public transport service
- - 4 2%
Improve accessibility to public transport services
- 10 5%
Improve inter-modal transfer
- 3 1%
Improve public transport monitoring and operations
- 2 1%
Increase reliability and punctuality
1 1%
Improve incident response
0 0%
Increase revenues/reduce operating costs
0 0%
Reduce travel time 1 1%
Improve public transport traveller information
- 21 10%
More efficient fare collection
- 1 1%
Improve public transport service Total
43 21%
Improve revenue generation
- - 1 1%
Introduce/improve road user charging
- 2 1%
Improve revenue generation Total
3 1%
Improve road safety
- - 2 1%
Manage incidents effectively
- 1 1%
Emergency response
1 1%
Incident clearance and management
2 1%
Reduce accidents
- 17 8%
Exposure to accidents risk
6 3%
Number of accidents
21 10

2DECIDE
Coordination and support action
Page 59 of 117
Goals and objective Subcategories 1 Subcategories 2 Frequency Percentage
Severity of accidents
(injuries/fatalities) 1 1%
Improve road safety Total
51 251%
Improve road traffic planning, operations
- - 5 21%
Improve traffic data (better detection and processing)
- 2 11%
Improve traffic estimation and forecasting
- 6 3%
Improve traffic management (cross-
border, organizational co-operation)
- 2 1%
Improve road traffic planning, operations Total
15 7%
Improve travel efficiency
- - 4 2%
Improve mobility options - 4 2%
Improve travel comfort and confidence
- 1 1%
Improve travel time reliability
- 3 1%
Improve traveller information
- 9 4%
Travel time 0 0%
Accident warning 0 0%
Congestion 0 0%
Routing 4 2%
Special events 2 0%
Reduce congestion - 24 12%
Reduce travel time - 3 0%
Improve travel efficiency Total
54 27%
Reduce environmental impacts
- - 3 1%
Improve local air quality - 4 2%
Reduce noise - 5 2%
Reduce transport emissions (CO, NOX,
particulates, …) - 5 2%
Reduce greenhouse gases from transport
0 0%
Optimize energy consumption
0 0%
Reduce environmental impacts Total
17 8%
Total
201 100%

2DECIDE
Coordination and support action
Page 60 of 117
Figure 4.9 – Distribution of the number of studies for the class Goals and objective.

2DECIDE
Coordination and support action
Page 61 of 117
Figure 4.10 – Distribution of the number of reports for the several subclasses of the category Goals and objective.

2DECIDE
Coordination and support action
Page 62 of 117
4.7 Analysis by Type of Evaluation
The studies entered are for 59% of cases Ex-post evaluation with 118 records entered, while Case
studies are 24% of the total with 49 studies entered.
Table 4.10 – Number of studies and percentage with respect to the total per Type of Evaluation.
Type of evaluation Frequency Percentage
- 1 1%
Case Study 49 24%
Ex - ante Evaluation 9 4%
Ex - post Evaluation 118 59%
Feasibility Study 7 3%
Field Study 1 1%
Test - Pilot 16 8%
Total 201 100,00%
Figure 4.11 - Distribution of the number of studies per Type of Evaluation.
4.8 Analysis by Quality of Report
The quality of the reports entered represents the evaluation criteria given by the partner who entered
the report into the database. It is a personal evaluation that summarizes the study and may include
comments by the authors over the quality of the study itself. There are four possible levels of
evaluation: Good, Normal, Poor and Very good or Excellent. It is important to notice that the partners
carried out an initial screening on the quality of the studies to collect, excluding a priori the reports

2DECIDE
Coordination and support action
Page 63 of 117
that were not particularly good. 70 reports of the entered ones were evaluated of Normal quality,
while the others show a Good (44% of the cases over the total) or Very Good quality (17% of cases),
see Table 4.11. Only in one case the quality of the study was considered Poor.
Table 4.11 – Number of studies and percentage with respect to the total per Report Quality.
Report_Quality Frequency Percentage
- 7 3%
Poor 1 1%
Normal 70 35%
Good 88 44%
Very good or Excellent 35 17%
Total 201 100,00%
The quality of the report can be crossed with the type of study entered. In particular, as Figure 4.12
shows, the studies evaluated to be of Excellent quality belong for the most part (30 reports out of 35)
to Ex post evaluation.
Figure 4.12 – Distribution of the number of studies per Report Quality based on the Type of
Evaluation.
4.9 Analysis by Country
The analysis by Country shows a good coverage of the studies entered for Germany (22,9% over the
total), Finland (16,4% over the total) and United Kingdom (14,9% of the total).

2DECIDE
Coordination and support action
Page 64 of 117
Ireland, Greece and Belgium are only present with one report like many countries of Eastern Europe,
such as Poland, Romania, the Czech Republic, Estonia, Hungary, Slovenia and Slovakia.
Table 4.12 – Number of studies and percentage with respect to the total per Country.
Country Frequency Percentage
- 5 2,5%
AT - Austria 3 1,5%
BE - Belgium 1 0,5%
CZ - Czech Republic 1 0,5%
DE - Germany 46 22,9%
DK - Denmark 6 3,0%
EE - Estonia 1 0,5%
EL - Greece 1 0,5%
ES - Spain 3 1,5%
Europe 6 3,0%
FI - Finland 33 16,4%
FR - France 14 7,0%
HU - Hungary 1 0,5%
IE - Ireland 1 0,5%
IT - Italy 6 3,0%
NL - Netherlands 14 7,0%
NO - Norway 3 1,5%
PL - Poland 2 1,0%
RO - Romania 2 1,0%
SE - Sweden 19 9,5%
SI - Slovenia 1 0,5%
SK - Slovakia 1 0,5%
UK - United Kingdom 30 14,9%
US - United States 1 0,5%
Total 201 100%
4.10 Conclusion
The analysis of the reports entered into the database version 9 in January 2011 allows to summarize
some aspects, and above all to plan the next insertion of new reports in order to reach quite an even
coverage in all the classes under consideration.
The category Geographical Coverage shows a good coverage; the least present subclasses are
Corridors and Areas and regions in Europe - Cross border/intra region area.
In the class Area of Transport the least covered area is Freight Transport, above all as far as railway
and sea transport is concerned.
In the first phases of insertion of the studies, all efforts were concentrated, according to the
indications of the WP3, on two particular ITS services: Traffic Management and Operation services
and Public Transport Service. The large collection of studies for these two classes allowed to apply
data to the construction and validation of the inference engine. A greater effort, in the next phases of
collection, may concern other ITS, in particular Freight Transport Management, Emergency Services
and Road Transport Related Personal Safety.

2DECIDE
Coordination and support action
Page 65 of 117
The analysis of the class Problems highlights the poor number of studies for the following
subclasses: Freight Transport, Noise and Air Pollution and Parking Issues.
The class Goals and objective shows a lack of studies collected for the subclasses: Improve Freight
Fleet Management, Decrease traffic violations and Improve revenue generation.
2DECIDE
Coordination and support action
Page 66 of 117
5 Reports Extended Access Database Guide
5.1 General information
5.1.1 Introduction
General comments and guidance on quality standards
There is no single recipe for ensuring quality of a source or the quality of its transcription into the
2Decide database.
9 tips however:
1. Read the descriptions and guidance below before entering data.
2. You need to make an expert judgement on whether the source information content adds
sufficient value (e.g. is it very general, poorly expressed or very light on information?). If not you
may need to leave the study out or seek a better source for the case (perhaps the primary
source in the case of EasyWay Tempo summaries, which are often very brief). If a partner might
have better access to sources due to language or own knowledge, let the WP2 leaders know.
3. Look at the table in chapter 5.1.2. to find out what fields should be mandatorily entered for each
study type. There is no total dogma, but this will give a strong indication of where you lack
information. Make sure you can fill in all the mandatory fields as defined below in a satisfactory
way (not just putting in anything just to “tick the box”.) In the case where you cannot fill these
fields, you need to seek more information, reject the study or justify the study due to unusual
strength in other areas. There may be exceptions, but at this point it is probably good to make a
conscious judgement on acceptability.
4. Please take maximum care when selecting classifications to make sure you get this right. The
classification is the main thing that will drive the system‟s offer of relevant studies based on the
selection of desired characteristics by the user. It also contributes to the relevance and
transferability assessment, which will rank the output. If you put in irrelevant attributes, the user
will get irrelevant studies in his search. If you leave out relevant attributes, the user will not find
relevant studies or they may be hidden at the end of a very long list.
5. Look exhaustively for indicators in the available sources and include all that you find and not just
some of them. This is a key for the success of the inference engine.
6. Put yourself into the shoes of the potential database user with potentially limited technical
knowledge of ITS, does it tell a complete story for such a person ? The text description of the
study needs to stand alone on its own merit.
7. If cutting and pasting ask yourself the question, is the original of sufficient quality /
understandability and does it fit properly into the field I am putting it in. We will not add value by
copying other peoples‟ poor quality outputs or putting inappropriate text into boxes.
8. Get a colleague to read it through and give an outside opinion. A sample mutual peer review
system within the consortium to control quality and give feedback from a point of view will be
introduced.
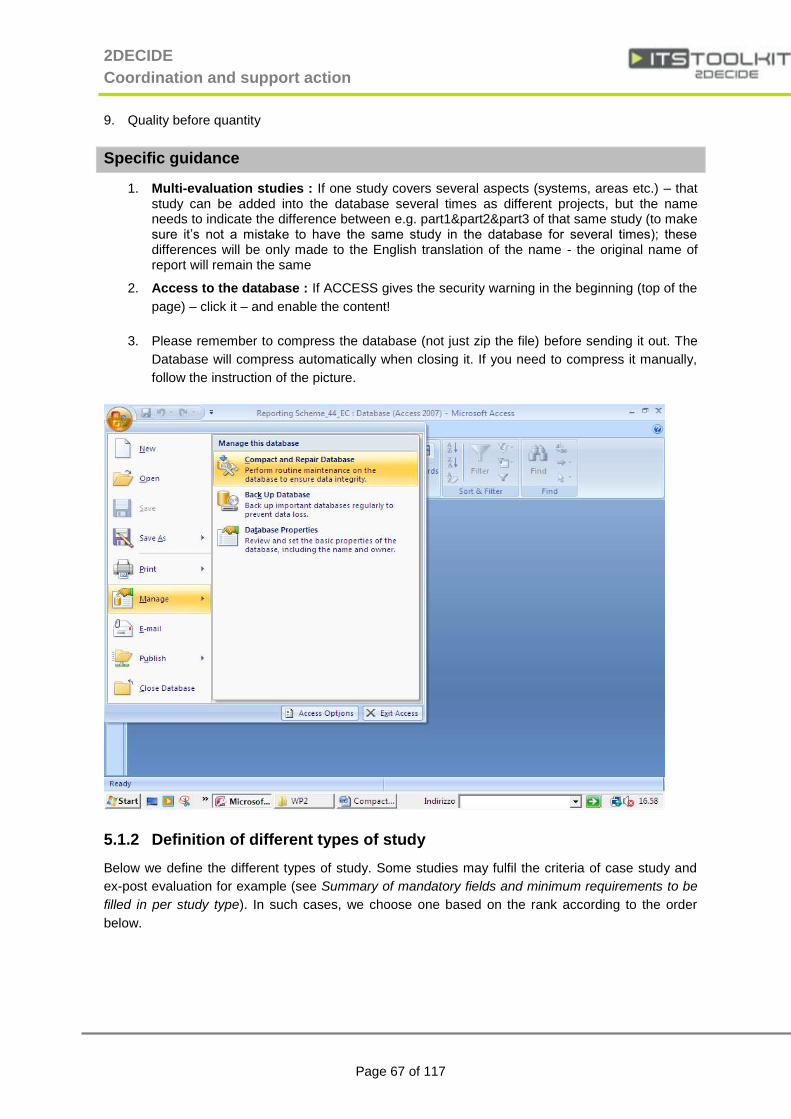
2DECIDE
Coordination and support action
Page 67 of 117
9. Quality before quantity
Specific guidance
1. Multi-evaluation studies : If one study covers several aspects (systems, areas etc.) – that study can be added into the database several times as different projects, but the name needs to indicate the difference between e.g. part1&part2&part3 of that same study (to make sure it‟s not a mistake to have the same study in the database for several times); these differences will be only made to the English translation of the name - the original name of report will remain the same
2. Access to the database : If ACCESS gives the security warning in the beginning (top of the
page) – click it – and enable the content!
3. Please remember to compress the database (not just zip the file) before sending it out. The
Database will compress automatically when closing it. If you need to compress it manually,
follow the instruction of the picture.
5.1.2 Definition of different types of study
Below we define the different types of study. Some studies may fulfil the criteria of case study and
ex-post evaluation for example (see Summary of mandatory fields and minimum requirements to be
filled in per study type). In such cases, we choose one based on the rank according to the order
below.
2DECIDE
Coordination and support action
Page 68 of 117
Ex-post evaluation:
Ex-post evaluation (known also as Post-Implementation Evaluation) is carried out after a telematics
system or application has been implemented, to compare observed results following implementation
with expected results of the pre-implementation evaluation.
Pilot – test:
This is an on-road trial of a new application which may or may not have been initially tested in an off-
road trial. Pilot studies are often used to test the technical feasibility of a telematics application,
and/or to carry out a preliminary assessment of the impacts of a new telematics application. The
focus of a pilot study is on the assessment of the technical performance and impacts of the
application.
Case study:
Case study is the description of the implemented ITS with more focus on problems solved, planning
and implementation issues, lessons learnt, factor of success and costs. See section Summary of
mandatory fields and minimum requirements to be filled in per study type for differences in
mandatory fields.
Ex-ante evaluation:
Ex-ante evaluation (known also as Pre-Implementation Evaluation) concerns the appraisal of a
telematics application prior to its implementation. In this instance, expected benefits are anticipated,
based on modelling techniques and/or possibly previous experience of similar applications in similar
locations.
Feasibility study:
This is a study usually carried out at an early stage of any project to determine the practicability of a
implementing a telematics application or system.
They tend to be small-scale studies to determine whether or not to proceed to a pilot study or to put
together a full business case. The outcomes of the study are assessed against reference figures and
a recommendation on the best way to proceed is made.

2DECIDE
Coordination and support action
Page 69 of 117
Summary of mandatory fields and minimum requirements to be filled in per
study type

2DECIDE
Coordination and support action
Page 70 of 117
10. The table above gives a strong indication of what should be a minimum information coverage of
a study. It is not dogma but this will give a strong indication of where you lack information. In the
case where you cannot fill some “mandatory” fields, you need to seek more information, reject
the study or justify the study due to unusual strength in other areas.
5.1.3 Securing permission and deciding what information can be used
Guidance: The partner entering the study is responsible for this process !
Please refer to the Deliverable 2DECIDE Document Use within the ITS Toolkit to get directions on
what to take care of when entering data out of documents. This document has been elaborated by a
contracted lawyer specialised in copy right issues and needs to be read and accepted by every user
(end user, administrator, project partner).
There are also two formalised letters for the achievement of a written consent from an individual
author (Document use agreement) or a publisher (standardized letter). Both letters shall be
additionally backed with a support letter from the European Commission explaining the importance of
the ITS Toolkit.
All documents are available at the project portal and can also be requested from the coordinator.
5.2 Database fields description
Important general point : a field left blank means that data is not available or is not (totally or
sufficiently) relevant in the context. If you have nothing, leave it blank.
5.2.1 Basic information about the report
Title, Title english
Description: Title of the report/case study in original language. Mandatory field.
Notes, suggestion for guidance: can be used title of the report or the project, etc.– but it is not
necessary to use the whole original name of the report when the title is too long (also to be easily
identifiable please add e.g. concrete location, state). This title should give useful differentiating
information (e.g. place or country).
Note: as mentioned in section Specific guidance, if one study source has several systems or
geographical areas (and needs to be added to the database several times, make sure you name the
sub-study including the name of the system or area also (only the English name, the original name
has to be identical to the original source). Make it clear in the name (same name root) that it is part
of a single source.
Number_Source
Description: Number of source in long list reporting scheme. Mandatory field, if number allocated.
Quality of report
Description: Assessment of source quality (very good or excellent / good / normal). Mandatory field

2DECIDE
Coordination and support action
Page 71 of 117
This is a personal assessment of the partner summarising the study or it might include the own
comments of the authors on quality in their study (if you agree with them). If there is not enough
information in the report to make an assessment on quality, this should also be stated.
We ask you here to categorise the studies you enter according to the quality of the source on a 3
mark scale : “normal”, “good” or “very good or excellent”. This has been done provisionally in the
initial selection process. This is an internal assessment and will not be made public or presented to
the original authors. It will be used in the prioritisation of the studies for presentation to the user.
This is clearly a relative scale and with different summarisers it will not be a perfect process. Try
however to judge it according to the expectations that you would have of a very good or good study.
Normal is really a minimal quality level. Anything less than this does not belong in the database. To
summarise
If you feel it necessary, please contact WP2 leaders for some examples of very good, good and
normal in our view. It is impossible to define a precise marking system or put weights on criteria, you
need to use experience and feel in deciding what is key and not.
The following broad 3 criteria (with some suggested sub-criteria as appropriate by study type) should
be considered when “scoring” the quality
1. Quality of the analytical approach of the study (in particular for evaluations and feasibility
studies)
Appropriate method and/or experimental design
Approach to analysis of feasibility issues or transferability
Use of CBA indicators in evaluations
Independence of appraisal/evaluation
Statistical significance of results
Originality of the approach and topic
Systematic reliability of the results (sample timing issues, bias, etc).
Use of this study in national guidance, key nature of result
2. Quality of information available
Comprehensibility, depth, consistency of written descriptions, explanations
Availability of information required to make judgements on quality of the analytical approach
Clear empirical or modelling basis
3. Amount/level of relevant information available
Level and balance of overall coverage of the content descriptive database fields as appropriate
per study type
Level of coverage of all the relevant (in particular mandatory) database fields
Presence of quantitative or ranking evaluation data in the source
Number of indicators filled out
In summary we are looking for added value that is significant, reliable, well described and set
into context for potential implementers. The more added value of this type there is, the better the
study. If there is none or negligible amounts, the study does not belong in the database.
2DECIDE
Coordination and support action
Page 72 of 117
High quantity with low quality should always be considered lower than high quality with lower
quantity.
Key aspects of quality per study type
Ex-post evaluation, Pilot – test
Key aspects for quality assessment : The ITS description // Problem or Issue Description //
Methodologies used // Assessment results, primarily green button and cost-benefit.
Red line requirement for very good: Method and experimental design are clearly described and
appropriate, there are no obvious doubts about the independence or systematic reliability of the
approach.
Case study
Key aspects for quality assessment : The ITS description // Problem or Issue Description //
Obstacles // Lessons learnt // Assessment results, primarily red button.
Red line requirement for very good : There are clear learning points/conclusions of the case, there
are no obvious doubts about the objectivity of the description.
Ex-ante evaluation
Key aspects for quality assessment : The ITS description // Problem or Issue Description //
Methodologies used // Green button assessment results and cost-benefit.
Red line requirement for very good : Method is clearly described and appropriate, there are no
obvious doubts about the independence of the approach, there are clear conclusions of the
evaluation.
Feasibility study
Key aspects for quality assessment : The ITS description // Problem or Issue Description //
Methodologies used // Assessment results including red-button descriptions of feasibility issues.
Red line requirement for very good : Method is clearly described and appropriate, there are no
obvious doubts about the independence of the approach, there are clear conclusions on all relevant
feasibility issues.
Partner
Description: 2DECIDE Partner who entered the report. Mandatory field.
5.2.2 Document information
General information

2DECIDE
Coordination and support action
Page 73 of 117
Language
Description: Document original language. Mandatory field.
Guidance : Please check if the language fits to the original report, it is easy to make a mistake.
Programme_Project
Description: Title of the Programme/Project. Mandatory field.
Guidance : Insert the official name of the Project/acronym, if defined; otherwise leave blank.
Country
Description: Country of the report/case study. Mandatory field.
Guidance : Insert the name of the Country where it has been implemented. If more countries choose
the main one or the group of countries (e.g. Europe)
Year of the study
Description: Year of the report/case study. Mandatory field. Format field: Year (YYYY).
Year of the implementation
Description: Year of the implementation. Format field: Year (YYYY). First year if multi-year.
Mandatory field for ex-post/pilot. Mandatory for case study only if related to implementations of ITS
solution.
Year of the data
Description: Year of the data collection. Format field: Year (YYYY). First year if multi-year.
Mandatory field for Ex-post ES / pilot, for case study if includes data.
Document_Name
Description: Original Document Name (ex: Report.pdf). Mandatory field, if document exists.
Guidance : Notes, suggestion for guidance: If based on a summary report, quote summary report
name, if more documents, name the main one.
Document_Source
Description: Document source (website, other). Mandatory field, if the document exists.
DocumentWeblink
Description: Link to the website where you can find Original Document. Check whether the link is
still valid when you use the one stated in the study. Write in the weblink the link to the page where
we have found the document. We download the document with its original name; we save it and will
later on transmit it to EXODUS. Exodus will make the connection within the 2DECIDE tool.
Mandatory field, if a valid current Document weblink exists.

2DECIDE
Coordination and support action
Page 74 of 117
CopyRight (©) claimed
Description: yes/no
Guidance : Notes, suggestion for guidance: A copy right sign © in the document indicates that the
author intends to keep control on how his document or parts of it by third parties. In this case an
examination of the copy rights claimed in the document is necessary and a consultation of the author
before the usage of the document in the ITS Toolkit is required. For such cases the Document Use
Agreement (see Annexes) needs to be signed by the author/copy right owner and AustriaTech as
project coordinator. This is particularly valid for documents from journals or any other sources where
the reader/user has to pay for accessing the document.
Author/s information (Document input form)
Author of the report
Description: Name/s of the author/s of the original report. Format field: Surname, N. e.g: Studer, L.
(1); Marchionni, G. (1); El-Araby, K. (2). In brackets a different number for each different Company.
(If multiple authors exist per company, put down the first two authors + et.al) Mandatory field, if
available.
AuthorCompany
Description: Name of the Company of the author/s of the original report. Format: (1) Politecnico di
Milano, (2) Transver. The numbers should refer to the Author‟s field. Mandatory field, if available.
CompanyName
Description: Name of the company responsible for ITS Implementation (ex. Motorway
Concessionaire) information. Mandatory field, if available.
UnitDivision
Description: Mandatory field, if available.
Name
Description: Name of the person delegated by the company to oversee ITS Implementation Mandatory field, if available. Format field: N. Surname. e.g: L. Studer..
Description: e-mail address for information about ITS Implementation (ex: [email protected])
Mandatory field, if available (if present on the report: no web research needed),.
Free text
Description: Any additional info should be added here.

2DECIDE
Coordination and support action
Page 75 of 117
5.2.3 Specific report information – classification
Important general point : please take maximum care when selecting these aspects. This
classification is the main thing that will drive the system output based on the selection of desired
characteristics by the user. It also contributes to the relevance and transferability assessment, which
will rank the output. If you put in irrelevant attributes, the user will get irrelevant studies in his search.
If you leave out relevant attributes, the user will not find relevant studies or they may be hidden at the
end of a very long list.
Geographical Coverage
Description: Mandatory field at least one
Guidance: Notes, suggestion for guidance: Different levels mean the level of application or network
scale of planned or implemented ITS service (e.g. a localised speed control system on a motorway
might be considered at national level due to the network level) or the geographical scope of problem
or objective. More than one choice of coverage means different scales are applicable in the case
(perhaps an integrated motorway – urban application).
Geographical Coverage Categories
all Europe
National Level
Areas and regions in Europe
o Region
o Local area
o Cross-border/intra-region area
Corridors
Urban areas in Europe
o Large metropolitan area (over 1 million inhabitants)
o Medium metropolitan area (250 000 to 1 million inhabitants)
o Small metropolitan area (100 000 to 250 000 inhabitants)
o Small town or city (under 100 000 inhabitants)
All scales applicable (no specific coverage)
Area of Transport
Description: general description here, then individual description for each area of transport is in
annex. Mandatory field at least one.
Guidance: Notes, suggestion for guidance : It is not mandatory to go down to the lowest possible
level for a given high level choice. If your project doesn‟t fit to narrow categories - you can stop the
definition at the higher level. Order does not mean priority. More than one choice of area of transport
means different areas to be tested and required for assessment by the Toolkit.

2DECIDE
Coordination and support action
Page 76 of 117
Area of Transport Categories and Sub-categories
1. Passenger Transport/Road Transport
Motorways and expressways (TERN)
Major, secondary and rural roads
City streets
All road networks
2. Passenger Transport/Public Transport
Train services (heavy rail)
Metro/Subway and Tram/Trolley
Regional, intercity and local bus/coach
Demand-responsive/Special-needs PT
All public transport services
3. Passenger Transport/Other Transport
Taxis
Walking
Cycling
Ferries
All above modes
4. Freight Transport
Long distance road freight haulage
(lorries)
Urban freight
Freight by other modes (rail, water, sea)
All freight transport classes
5. Transport Infrastructure
Rail and bus stations, airports and ports
Car parks and truck parking Area
Toll plaza
Intermodal freight terminal
All transport infrastructure elements
ITS Service
Description : general description here, then individual description required for each ITS service (see
annex for more details on sub-applications). Mandatory field at least one.
Traveller information Services - This domain addresses the provision of both static and dynamic
information about the transport network, services for users prior to and during the trip.
Pre-trip Information
On-Trip Information
Travel Services Information
Route Guidance and Navigation – Pre-trip
Route Guidance and Navigation – On-trip
Trip Planning Support

2DECIDE
Coordination and support action
Page 77 of 117
Traffic Management and Operations Services - This domain is central to road network operations.
It concerns the movement of people, goods and vehicles throughout the transportation network, and
includes both automated monitoring and control actions
Traffic Management and Control
Demand Management
Transport Infrastructure Maintenance
Management
Policing/Enforcement
Intelligent Vehicle Services - ITS services in this domain focus on services and systems that
improve the operational safety of vehicles, and are contained within the vehicle itself.
Vision Enhancement
Automated Vehicle Operation
Safety readiness
Co-operative Systems
Freight Transport Management - This domain addresses activities that facilitate both commercial vehicle operations and multi-modal logistics, including inter-jurisdictional coordination.
Management of Dangerous Freight (Hazardous Goods) Intelligent Truck Parking
Public Transport Services - This domain describes the activities that will deliver more timely and
efficient operation of public transport services and provision of operational information to the operator
and passenger.
Public Transport Management
Demand Responsive and Shared
Transport
Public Transport Electronic Payment
Communication Systems

2DECIDE
Coordination and support action
Page 78 of 117
Emergency Services - This domain describes activities that permit emergency support services to
be more quickly initiated and expedited throughout the transportation network.
Transport Related Emergency Notification and Personal Security
Emergency Vehicle Management
Hazardous Materials and Incident Notification
Transport-related Electronic Payment Services - This domain addresses activities that permit
revenues for transport services, tolls and payment for other facilities to be collected through non-
cash and non-stop payment. This does not include public transport-related payment services
which are in the domain "Public Transport Services".
Transport-related Electronic Financial Transactions
Integration of Transport Related Electronic Payment Services
Road Transport Related Personal Safety - The services in this domain describe activities that
protect the personal safety of pedestrians and individuals using the road network.
Public Travel Security
Safety Enhancements for Vulnerable Road Users
Safety Enhancements for Disabled Road Users
Safety Provisions for Pedestrians Using Intelligent Junctions and Links
Weather and Environmental Conditions Monitoring Services - The services in this domain
describe activities that monitor weather and environmental conditions that have an impact upon the
transport network and its users.
Weather monitoring
Environmental Conditions Monitoring
Disaster Response Management and Co-ordination Services - This domain describes ITS
activities will assist multiple jurisdictions in their response to natural disasters, civil disturbances, or
terrorism.
Disaster Data Management
Disaster Response Management
Coordination With Emergency Agencies
Guidance : Order does not mean any priority. ITS service must be defined at sub-market level. If
this is NOT done, the toolkit will not find the study when searching the database. More than one
choice of ITS service means different services to be tested and required for assessment by the
Toolkit.
Note: if the study assesses more than one service separately, a different record needs to be filled in
for each service.
Problems
Description: Problems might be clearly identified in the study or you might infer them from the
objectives. Problems are often identified on an operational level. The single problems are self-
evident. Mandatory field problem or goals and objectives at least one. It is possible to have both
problems and goals/objectives.

2DECIDE
Coordination and support action
Page 79 of 117
Guidance: Order does not mean priority. A study needs to have either a problem or objective defined – it is a must to find the study in the database!.
Goals and Objectives
Description: Goals and objectives might be clearly identified in the study or you might infer them
from the problems. Single goals and objectives are self-evident. Mandatory field problem or goals
and objectives at least one. It is possible to have both problems and goals and objectives.
Guidance : Order does not mean priority. A study needs to have either a problem or objective defined – it is a must to find the study in the database!
5.2.4 Report of the ITS study
Important general point : this is the core descriptive part of the report, it is what gives the study
comprehensibility and meaning to the user (the user may be more or less technically oriented). This
should not be too long, but should contain relevant and concise but sufficiently stand-alone
information about the study.
ITS Description
Description: “Describe the appraised / evaluated ITS application, the functionality and technologies
used, users involved, location, physical scope / user reach, context within wider ITS system etc,
current status of the application,– basic question. Any innovative, unusual features ? Describe the
before(reference) and after (project) cases of the appraisal/evaluation - basic questions : WHAT,
WHERE FOR WHOM”. Mandatory field.
Context/problems to be solved/objectives
Description: “Background/motivation to the ITS application: transport/ITS strategic context of
application, transport/problem context (e.g. traffic levels, congestion), final objectives of the
application, objectives of the evaluation - basic question: WHY.” Mandatory field
Planning and implementation
Description: “Summary of significant features such as timing, milestones of the planning and implementation process/model including future plans / known progress since the evaluation. Might include appraisal/evaluation process (not methods), solution selection process, stakeholder management / relationships, business model, cooperation model, project management - basic questions : HOW, WHEN. Avoid duplication with assessment results description; use a reference here to specific impact
analysis if needed.” Mandatory field for case study.
Obstacles
Description: “Summary of significant obstacles to implementation (technical, financial, institutional/organizational, legal) and how they were overcome, if at all. Avoid duplication with assessment results description; use a reference here to specific impact analysis if needed.” Recommended field if available especially for case studies, summary only if addressed also in feasibility assessment descriptions.

2DECIDE
Coordination and support action
Page 80 of 117
Lessons Learnt, factors of success
Description: What were the key lessons learnt in various aspects of the planning and implementation process (could be technical, institutional/organizational, legal, financial) including for example
Was the implementation a success? Were the objectives met?
What were the conclusions of the appraisal/evaluation
What could be done differently next time?
What factors made the implementation successful, if at all? e.g. good technical testing, mature technology, good management, a strong champion, legislation etc.)
Impacts of evaluation on future implementations Avoid duplication with assessment results description; use a reference here to specific impact analysis if needed.”
Mandatory field for a case study. Recommended for ex-post evaluations / pilot studies.
Type of evaluation
Description: for individual description/definitions of each type of evaluation see chapter 1.2.
Mandatory field.
Guidance: It is not possible to classify the report as ex-ante or ex-post evaluation when no indicator
results are obtained in the report
Methodologies used
Description: “summarise the methodologies used in the study: scientific appraisal/evaluation
approach, official guidance used, types of surveys/counts, transport modelling, sources of
parameters for cost/benefits estimates, modelling appraisal etc. If there is not enough information,
this should also be stated. Mandatory field for ex-post evaluations / pilot studies, ex-ante evaluations
and feasibility studies.
Source/quality assessment
Description: This is a personal text assessment of the partner summarising the study or it might include the own comments of the authors on quality in their study (if you agree with them). If there is not enough information in the report to make an assessment on quality, this should also be stated. Related to the quality of report assessment in section 5.2.1, see this chapter for possible issues to consider. This will be public information. Do not enter any formulations or criticisms which might offend the original source authors. Mandatory field.

2DECIDE
Coordination and support action
Page 81 of 117
5.3 Assessment results description
5.3.1 Generally about ASSESSMENT RESULTS DESCRIPTION
General Description of ASSESSMENT RESULTS DESCRIPTION :
An important aim of the toolkit is to provide decision makers guidance on how different ITS applications and services have been assessed to operate, perform and fulfill different expectations. Therefore it is essential that all assessment results, which are relevant to people deciding on whether to apply or utilise an application or service, are filled into the database. For all ex-post evaluations, pilots/tests and ex-ante evaluations, it is Mandatory to have at
least two impact assessment areas filled in with an indicator.
In some cases, the data to be filled in should be self-explanatory, but the following subchapters
provide additional guidance based on first experiences from filling in the data. The general guidance
in the next subchapter is followed by any specific guidance for the different assessment categories.
General Guidance:
A distinction can be made between the buttons with the GREEN text (Impact assessment) and the
RED text (mostly feasibility aspects assessment) .
Generally : When you‟ve selected a specific goal in the drop down boxes in the previous section,
you might assume that you‟ll only need to fill in the accompanying subform (eg, when the goal
selected is Improve travel efficiency you will have to fill in the improve travel efficiency subform in
any case).
HOWEVER: if you come across an indicator that is not directly linked to travel efficiency (eg, an
indicator on the emissions) you will need to fill in this indicator once only but in the appropriate
subform, in this case Reduce environmental impacts. DO NOT ADD THE INDICATOR IN THE
Improve travel efficiency in this case.
If you come across an indicator in your report and you‟re not sure where to find it, please check the
D3.1 deliverable. This deliverable includes all indicators used.
The subforms with the red text on the buttons have all to be filled in where data is available
(whatever the type of the report: case study or evaluation report).
For each red or green button category with at least one indicator in it or where important
qualitative (and maybe not quantifiable or categorisable) information is available, the general impact
description text field at the top of the page should be filled in, which should explain the context of
the indicators and in the case of qualitative assessment, the content of such assessment. Note that
often this information may not be listed in the summary of the report, but can be nevertheless found
in the report. For instance, many reports may make a reference to how well the system is performing
(Technical performance) or how many and which stakeholders are involved in providing the service.
Filling in impact description field and the indicators : Please note indicator filling in:
1. Select ALL that apply

2DECIDE
Coordination and support action
Page 82 of 117
2. Impact description field (at top of the page) : describe the impacts as detailed as possible.
(for all variables used in the study even if not among the ones in the pre-defined indicator
fields).
3. Indicator description: please select one from the drop down list. If you come across an
indicator in your report that is not in the list and not to be found in one of the other subforms,
you can add this indicator (AND THE UNIT). Don‟t add city names or specific ITS services in
the indicator description.
If the impact is a range, e.g. -2 - -4%, indicate that in the description field and calculate
the average and fill it into the numerical fields. (in this case, -3%)
A drop in a certain indicator between before / after (or without / with) should be
registered as a MINUS value. Only fill in the number (preceded by the minus sign when
appropriate), not the percentage symbol.
Always fill in the pre-defined fields if applicable.
Calculate all the results into pre-defined units when possible (e.g. number per week or
month – easy to calculate into number per year). Please add your calculation in the
impact description field.
Fill in all the available numerical values – if something not available, leave it blank (e.g.
it‟s ok to fill in just the effect – not pre/post values, if those are not mentioned in the
report)
Usually effects are calculated in two ways: 1) comparing the same entities (persons,
vehicles, locations, etc.) before and after they have the ITS application in use, or 2)
comparing entities without the application to those with the application in use. Today, the
database uses the terminology of 1), i.e. a before and after study. If instead of before
and after, the study has compared "with the system" to "without the system", the value
without system should be filled in as the „before‟ value (+ description in the description
field), and the value with system should be filled in as the „after‟ value (+description in
the description field
5.3.2 Impact assessment – GREEN BUTTONS
Improve travel efficiency
General Description of the impact category : Improve travel efficiency concerns issues like: reducing travel times, travel time reliability and reducing congestion, etc.
Description of the indicator[s] (changes and unit) :
Traffic concerns travel times, congestion, etc. The main indicators expected to describe travel
efficiency improvement are:
Average delay per vehicle kilometre (congestion), with as unit: hour delay/vehicle;
Vehicle kilometres travelled in congestion, with as unit: vehicle-km and tonne-km (these will
be two separate indicators in the database);
Travel time (average per traffic unit), with as unit: hour/traffic unit;
Additional travel time caused by incidents, with as unit: hour;

2DECIDE
Coordination and support action
Page 83 of 117
Improve road safety
General Description of the impact category: This category concerns safety aspects, and concerns for example injuries and fatalities as a result of traffic accidents.
Description of the indicator[s] (changes and unit):
The main indicators expected to describe road safety improvement are:
Number of traffic accident injuries (per traffic unit), with as unit: number of traffic accident
injuries/year. The number of injury accidents can be used as a surrogate for this indicator.
Number of traffic accident fatalities (per traffic unit), with as unit: number of traffic accident
fatalities/year. The number of fatal accidents can be used as a surrogate for this indicator.
Number of traffic accidents resulting in death or injury (per traffic unit), with as unit: number
of traffic accidents per year
Number of traffic violations, with as unit: number; This indicator must be disaggregated to
differentiate at least between the violations for speeding, traffic signal compliance, and
driving while intoxicated. In addition, other violations should be covered as a sum. Hence,
this indicator will result in at least four indicators in the 2DECIDE data base.
Feeling of safety, with no unit, this is a qualitative indicator
Improve public transport service
General Description of the impact category: This category concerns issues related to public transport services.
Description of the indicator[s] (changes and unit):
Main indicators expected to describe public transport service improvement are:
Peak-hour service frequency on main routes (departures/h)
Off-peak service frequency on main routes (departures/h)
Passenger loads on route (Passenger.Km/day or passengers/day)
Daily hours of delay (h/day)
Reliability of Service: % of buses/trains/etc. arriving within 0-(x) minutes of scheduled time
on a particular route
Availability of public transport timetables and real-time information (qualitative)
Level of use of Park-and-Ride facilities (%)
Vehicle hours/year
Availability of inter-modal transfers (free text)
Use of intermodal transfers (passengers/hour)'
Public transport service can also be evaluated through supporting (secondary) indicators:
Total travel time in comparison with trip taken by private car: ratio travel time PT/travel time
car
Public transport‟s share of all trips (%)
Number of visitors or users of the system (e.g.a terminal) (Number of users/day)
Disabled people‟s share of all passengers (% of disables in total passengers)
Number of trips taken by disabled (number of trips/day)

2DECIDE
Coordination and support action
Page 84 of 117
Availability of the services at different times (free text descriptive indicator)
Improve freight management
General Description of the impact category: This category concerns issues related to freight management.
Description of the indicator[s] (changes and unit) :
Main expected indicators are:
Freight traffic by mode on corridor (Tonne.Km/day)
Level of intermodal rail traffic (amount of tonne.kms, container.kms etc transported per year)
Capacities at intermodal terminals (tonnes, trailers, containers, pellets etc. per year)
Capacity of truck parking on corridors (number of spaces per corridor)
Use of truck parking on corridors (%)
Improve freight and fleet management
General Description of the impact category: This category is mainly related to fleet managent in the freight sector.
Description of the indicator[s] (changes and unit) :
Main expected indicators are:
Door-to-Door freight travel time (h)
Load factors on main routes (level of empty backhauls, %)
Enhance security
General Description of the impact category: This category concerns the security issues, like travel comfort experience by the user or number of crimes committed in vehicles or terminals. Not to be confused with road safety.
Description of the indicator[s] (changes and unit):
The main indicators expected to describe any security enhancement are:
Feeling of personal security (a free text descriptive and qualitative indicator with no unit).
Travel comfort experienced by the user (a free text descriptive and qualitative indicator with
no unit).
Security enhancement can also be evaluated through the following supporting indicators:
Number of crimes committed in vehicles and terminals, with as unit: number of crimes/year;
Damage done to valuable nature sites; descriptive
Reduce environmental impacts
General Description of the impact category: This category concerns environmental impacts. The main ones are: emissions, air quality, noise and energy consumption.
Description of the indicator[s] (changes and unit):

2DECIDE
Coordination and support action
Page 85 of 117
The main indicators are:
CO2 emissions, with as unit: tonne/year;
NOx emissions, with as unit kg/day;
PM10 emissions, with as unit kg/day;
Number of people exposed to exhaust emissions, with as unit: inhabitants;
Air quality indices of urban districts, qualitative indicator expressed in free text
Noise perception, qualitative indicator;
Transport energy consumption, with as unit: litre or KWh per tonne-km or vehicle-km (in total
four different indicators)
Improve road traffic planning, operations
General Description of the impact category: This category road traffic planning & operations is mainly related to the operational level.
Description of the indicator[s] (changes and unit): Main indicators are:
Demand/Capacity on main routes (Volume/Capacity ratios) (also belongs to traffic indicators)
Availability of real-time traffic and road works information (pre-trip and on-trip, qualitative)
Availability of traffic forecasts (qualitative)
Travel time in peak periods (h, also belongs to traffic indicators)
Number of incidents (by type) on main corridors (number/km/year; also belongs to traffic indicators)
Improve revenue generation
General Description of the impact category: This category concerns generated revenues with a specific ITS service.
Description of the indicator[s] (changes and unit):
Revenue generation:
Revenue created, with as unit: million euro/year
Volume traffic using specific pricing zone/link; with as unit: vehicles/day
Number of payment violations; with as unit: number/year
Annual return of investments: with as a unit, %
Decrease traffic violations
General Description of the impact category: This category is related to traffic violations.
Description of the indicator[s] (changes and unit): The main indicator is:
Number of traffic violations, with as unit: number; This indicator must be disaggregated to
differentiate at least between the violations for speeding, traffic signal compliance, and driving while
intoxicated. In addition, other violations should be covered as a sum. Hence, this indicator will result
in at least four indicators in the 2DECIDE data base.

2DECIDE
Coordination and support action
Page 86 of 117
5.3.3 FEASIBILITY, COSTS AND BENEFITS - RED BUTTONS
User acceptance
General Description of the impact category: The strongest user acceptance indicators are indicators that show if users already invested or have the intention to invest in ITS applications. In detail indications that show users investments (purchase, intention to buy) including indications to the willingness to pay included in the case study/evaluation report.
Specific Guidance:
Please enter any text that is related to user acceptance (user system assessments,
willingness to pay, or money spent) into the main impact description text field at the top of
the page.
Please make sure that the text is also there for cases where you did enter specific numerical values in the user acceptance fields.
It is not sufficient to enter numerical values only in the description field.
In order to make the 2decide toolkit valuable for the years to come please also add some timing anchor (when was this data gathered).
User acceptance will be used by future users to have some proxy orientation on how mature the service is or where unknown / unstudied risks might arise.
Description of the indicator[s] (changes and unit):
Users investments – purchase of ITS application (How many solutions were sold until now) (exact number)
Users investments – intention to buy (scale 1-5 very low, low, medium, high very high),
Users investments – willingness to pay
Perceived usefulness ( i.e. users find the system useful) (scale 1-5 very low, low, medium, high, very high)
Perceived ease of use (i.e. users find the system easy to use, clear and understandable) (scale 1-5 very low, low, medium, high, very high)
Attitude towards using (i.e. users like the system) (scale 1-5 very low, low, medium, high, very high)
Behavioural intention to use (i.e users would buy the system, would use the system) (scale 1-5 very low, low, medium, high, very high)
All kind of questionnaires / interviews covering the opinion of users on ITS systems/services and experience of users with ITS systems/services (end users, public authorities, road operators, etc.); free text field.
Perceived equity of the measure, free text descriptive indicator, so as to understand the feeling of the users regarding the distribution of benefits and costs among population (low versus high income) and users (double tax for motorists…);
User attitudes toward the transport system (fraud, driving behaviour, attention paid to the systems…)
Cost/Benefit information
General Description of the impact category: This category concerns costs and benefits of the ITS services which are presented in the study which is entered in the WP2 database. This can consist of:
Costs: please provide an indication of the main costs in euros.
Benefits: Please provide an indication of the main benefits in euros. If available, please include in the free text field the calculation methodology.
Cost Benefit results: please provide the results of cost benefit calculations.

2DECIDE
Coordination and support action
Page 87 of 117
Description of the indicator[s] (changes and unit):
a. For all monetarised values: Recalculate all the currencies into € (not $, not millions of euros…). Please make use of the exchange rate sheet send out by ECORYS. Add the calculation in the free text description field
b. Only for some indicators the before and after value can be filled in. With other indicators, these fields make no sense (eg: investment costs of a new system). In that case, please fill the value in the AFTER field. Leave the other fields empty.
c. Please do add the year of the costs or monetarised benefit calculated.
Costs:
Investment/implementation costs; euro
Maintenance costs (per year); euro
Operations and maintenance costs (per year); euro
Benefits:
Total savings in accident costs: euro per year
Total savings in vehicle operation costs: euro per year
Total savings in environmental costs: euro per year
Total savings in freight management costs: euro per year
Total savings in travel time costs for passengers and freight, both road and public transport: euro
per year
Cost Benefit results:
CBR (Cost benefit Ratio), number.
NPV (Net Present value), number (euro)
IRR (Internal rate of return), percentage (%)
Transferability of the results
General Description of the impact category: Transferability of the results will be calculated based
on the given input of the geographical area and traffic environment. Therefore it is important to fill in
carefully all the environments and geographical areas into the relevant fields. In addition,
transferability should be explained in the main impact description text at the top of the page.
– if covered in the original report.
Specific Guidance :
Fill in all the relevant fields for traffic environments and geographical coverage (transferability will
be later calculated based on these values.
Describe any issues related to transferability in the description field, if available in the original
report.
Description of the indicator[s] (changes and unit): no specific indicators filled in for transferability.

2DECIDE
Coordination and support action
Page 88 of 117
Business models
General Description of the impact category : It is always important to make a clear distinction between a business case and a business model. These are quite separate concepts, although often this separation is not properly understood. This can lead to misunderstandings about the role of each, and what one can expect them to contain.
A business case:
provides the justification for the investment of resources
relates to a specific project or investment
contains an appraisal based on an analyses of financial other factors
presents the potential benefits / opportunities which can be realised
assists a decision to be taken by the stakeholders
A business model:
described the mechanism by which opportunities will be exploited
defines the products and / or services to be provided
defines the relationships and financial flows between participants
defines the means by which the products / services will be provided.
In simple terms, we can say that:
a business case is the "why"
a business model is the "how"
Within this task we focus on business models – not on business cases. In short, a business model
describes the specific way a business / authority / service provider etc. expects to recover costs of
implementing ITS services (investments and maintenance as described in 5.3.3), in order to continue
(and even expand) the services over a longer time period.
Description of the indicator[s] (changes and unit): In D3.1 we proposed to look for the following information regarding business models:
Please select the appropriate business model(s) out of a pull-down menu and provide additional
information if possible.
1. Subscription Model (paid service through periodic fees)
Revenue is raised through periodic (weekly, monthly and annual) fees. This is a popular model for
supplying access to a service that is frequently used. The advantage for the service provider is that
revenue is raised in advance and thus providing more certainty of regular income. The advantage for
the user is that costs of using the service are known in advance and access is unlimited within the
subscription limit.
2. Usage Model (paid service – pay per use)
Revenue is raised through actual usage of a service (pay-per-use). Usage may be measured in time,
per bytes, per area or per session. Thus, if you don‟t use the service - you don‟t pay for it. The
provider earns money by applying a mark-up to the actual cost of each item or service.

2DECIDE
Coordination and support action
Page 89 of 117
3. Free Model (free service – offered by authorities / socio-economic benefits generated)
There is no direct revenue raised through this model, although there will be indirect benefits. Public
sector organisations often employ this model. The immediate benefits are intangible, e.g. a better-
informed citizen or better policy effectiveness, or the benefits may be financial in the long term, e.g.
less congestion, emissions, accidents etc.
4. Advertising Model (free service – revenue generated via for instance advertisement)
This business model creates a community of users bound together by a common purpose or
viewpoint. Revenue can be based on the sale of other services. Facebook, Twitter and other social
networking websites use the community model to create revenues from banner advertisements and
sales of branded merchandise.
5. Enticement Model (free service – revenue generated via additional services)
Here, part of the service is provided free of charge as a lure to entice the user. Revenue is raised
from the sale of other products and services. This is often used for information and web-based
services. No direct or immediate services are thus created, unless combined with another model.
The reports already entered in the DB need to be changed accordingly.
6. Other – to be used when none of the above are applicable
Specific Guidance:
Select one of the reference business models described above. In some case it might be a
combination of business models – it this case select the appropriate ones.
Additional information (who, to whom, how?) could be provided in the main impact description text
field at the top of the page.
Legal Feasibility
General Description of the impact category: The objective of the assessment is to highlights
elements that characterize the ITS application from a legal point of view and make it a very relevant
best practice. The way an ITS application is planned or implemented may depend on the legal frame
of the context. The Toolkit users can search for special legal issues and investigate which kind of ITS
application can be adopted in certain situation or be informed about legal aspects or consequences
of the adoption of specific ITS solutions.
Legal feasibility should be investigated if the design or installation of new ITS services was allowed
by an amendment of the law or if a service is regulated by local, regional or national or European
laws.
Description of the indicator[s] (changes and unit):
appeals/recourses related to the Its ITS application, (number)
Amendments to Law due to the ITSIts application, (number)
privacy problems related to the ITSIts application, (free text field)
approvals, related to the ITS application (number)
differences with other national laws related to the ITS application (free text field)
Specific Guidance:

2DECIDE
Coordination and support action
Page 90 of 117
Please enter any text that is related to legal feasibility into the main impact description field at the top of the page.
Please make sure that the main impact description text at the top of the page is also there for cases where you did enter specific values in the legal feasibility indicator fields.
Institutional Feasibility
General Description of the impact category: With institutional feasibility we mean the ease of deploying the system or operating the service from the institutional or organisational point of view. Usually, the more stakeholders are involved in the value chain or value network of a service, the more complicated the service provision or deployment becomes and the more difficult will the institutional issues be. The issues will be made easier by having a clear champion for the service, i.e. a specific stakeholder taking the main responsibility for driving the service or the deployment of a system, or by having set up specific contracts or other agreements between all stakeholders involved.
The reader of the study report should look for any cues reporting problems related to poor stakeholder cooperation in service provision or deployment, and any solutions for clearing up such issues. At the minimum, the various stakeholders in the deployment or service provision should be looked up and their number be reported.
Description of the indicator[s] (changes and unit):
The main indicators of institutional feasibility are:
number of stakeholders needed to deploy and operate the service; a number
service responsible / champion; select from the following alternatives (public stakeholder/
private stakeholder/ PPP/ user community / other)
primary institutional issues encountered; select from the following possible values: yes / no /
not analysed; if yes, a description as a free text
level of inter-stakeholder co-ordination'; select from the following possible values: Ad-hoc (as
needed), Pilot/test phase, Formal agreement (protocols)
Specific Guidance:
Please enter any text that is related to institutional feasibility into the main impact description text field at the top of the page .
Please make sure that this text is also there for cases where you did enter specific numerical values in the institutional feasibility fields.
It is less than sufficient to enter numerical values only in the description field.
In order to make the 2decide toolkit valuable for the years to come please also add some timing anchor (when was this data gathered).
Institutional feasibility will be used by future users to have some proxy orientation on how mature the service is or where unknown / unstudied risks might arise
Technical Feasibility
General Description of the impact category: We above all aim to describe with technical feasibility assessment whether the system is technically ready and mature for deployment and implementation (main indicator: Level of application development or maturity). So the reader of the evaluation or

2DECIDE
Coordination and support action
Page 91 of 117
case study report should look for cues concerning whether the system described is a prototype, an early test implementation or pilot, or full scale deployment of an "off-shelf product" widely available in the market place.
In addition, we in 2DECIDE would like to know
whether the study reports any technical issues with finding the right solutions(secondary indicator: technical issues/ problems encountered).
whether technical standards or agreements are available and should be complied to (secondary indicator: requirements for standards/agreements or requirements for compatibility with other systems).
Note that problems and issues with the technical performance of the system, i.e. how well a system works and fulfills the technical expectations with regard to the reliable technical operation of the system should be filled in under the main impact description text field at the top of the page. .
Description of the indicator [s] (changes and unit) :
The main indicators of technical feasibility are:
level of application development or maturity; eight possible levels; levels taken from Tempo
Euro-Regional Project Evaluation Guidelines (Tarry et al. 2005): idea (new concept); plan;
prototype; pilot off road; pilot on road; large scale demonstration (level of benefit in question);
implementation (proven benefits but highly location dependent; full scale implementation
(proven product, predictable benefits)
requirements for compatibility
with other systems and services (what compatible systems were reported); list of reported
compatible system as free text
with standards/agreements (European and National standards reported) : list of required
and applied standards as free text
Technical issues / problems encountered ( yes; no; not analysed, if yes a description as free
text)
Specific Guidance :
Check in the indicator list in the WP2 database if the indicator is already mentioned in the list
with default indicators. If not, please add a new indicator and its description
For the “free text” indicators (compatibility, further development), report the proposed one when
existing in the case study, otherwise leave it blank.
Please make sure that the text is also there for cases where you did enter specific numerical values in the technical feasibility fields.
It is less than sufficient to enter numerical values only in the description field.
In order to make the 2decide toolkit valuable for the years to come please also add some timing anchor (when was this data gathered).
Technical feasibility will be used by future users to have some proxy orientation on how mature the service is or where unknown / unstudied risks might arise.

2DECIDE
Coordination and support action
Page 92 of 117
Financial Feasibility
General Description of the impact category: Indicators for financial feasibility refer especially to
the costs related to a system. These costs include investment costs and maintenance costs of the
ITS application.
Indicators for financial feasibility refer as well to the market potential of ITS solutions. Indicators for
market potential are sales numbers. These sales numbers do not need to take a future market into
account.
Description of the indicator (changes and unit):
Investment costs (proposed scoring: <30.000 €; 30.000 -500.000€; >500.000€, or exact costs)
Maintenance costs (exact costs per year)
Lifecycle duration (number of years)
Number of sales until now (commercially sold ITS solutions)
Expected sales (exact number)
With regard to the investment costs a scoring could refer to the three categories (<30.000 €; 30.000
-500.000€; >500.000€). If possible the data entry team should give information in which investment
category the ITS application can be found or insert the exact costs of the ITS solution.
With regard to maintenance costs, lifecycle duration and sales numbers the exact number should be
inserted in the value field.
Specific Guidance:
Please enter any text that is related to financial feasibility into the main impact description text field at the top of the page.
Please make sure that this text is also there for cases where you did enter specific numerical values in the financial feasibility fields.
It is less than sufficient to enter numerical values only in the description field.
In order to make the 2decide toolkit valuable for the years to come please also add some timing anchor (when was this data gathered).
Financial feasibility will be used by future users to have some proxy orientation on how mature the service is or where unknown / unstudied risks might arise.
Technical performance
General Description of the impact category: The technical performance of a system aims to describe how well a system works and fulfils the technical expectations with regard to the reliable technical operation of the system. The reader of the report should look for any cues reporting problems or disappointments with regard to the reliable and expected performance of the systems. This is important as a well-performing system and service will have much stronger impact on the users that a poor-performing service, and in order to compare the impacts of two similar services, we need to know whether any differences might be due to technical performance of the service. Description of the indicator[s] (changes and unit) : Concerning the technical performance of the ITS application and the related ITS service quality, the
main indicator is:
Fulfilment of expectations (is the system working as planned); text; free text
Specific Guidance :

2DECIDE
Coordination and support action
Page 93 of 117
Please enter any text that is related to technical performance into the main impact
description text field at the top of the page.
In order to make the 2decide toolkit valuable for the years to come please also add some timing anchor (when was this data gathered).
Technical performance will be used by future users to have some proxy orientation on how mature the service is or where unknown / unstudied risks might arise.
:
Technical performance - Service quality
General Description of the impact category: These indicators for service quality aim to describe how well the service operates in terms of
different aspects of service quality. According to the European QUANTIS project, the following
indicators are the most useful in this respect:
physical coverage of the area or network targeted
coverage of the target event such as incidents
availability of up-time
veracity or correctness indicated often as error probability
precision with regard to location and duration
timeliness
This is an important indicator as the impacts of the services depend on the service quality, with
better quality tending to provide more effectiveness.
Description of the indicator[s] for Technical performance/service quality (changes and unit):
Physical coverage of target area or network; number; % (of area or network length)
Coverage of target events (e.g. incidents); number; % (of events)
Availability (up-time); number ; % (of time)
Veracity (error probability); number; % (of events, values, information)
Precision - location accuracy; number; m
Precision - duration accuracy; number; minutes
Timeliness (data update interval); number; minutes
Specific Guidance:
Please enter any text that is related to technical performance/service quality into the main impact description text field at the top of the page.
Please make sure that the text is also there for cases where you did enter specific numerical values in the technical performance/service quality fields.
It is less than sufficient to enter numerical values only in the description field.
In order to make the 2decide toolkit valuable for the years to come please also add some timing anchor (when was this data gathered).
Technical performance/service quality will be used by future users to have some proxy orientation on how mature the service is or where unknown / unstudied risks might arise.

2DECIDE
Coordination and support action
Page 94 of 117
ANNEX 1
1 Traveller information Services
This domain addresses the provision of both static and dynamic information about the transport network, services for users prior to and during the trip.
Pre-trip Information
Travel information received at home, work, hotels, major public locations, such as shopping centres, and on portable terminals comes into this category. It includes shared transport such as public transport and other modes of transport.
On-Trip Information
ITS-based information services may include real-time travel information, estimated time to a destination based on current traffic conditions, as well as work zones, incidents, weather, tolls, parking, etc.
Travel Services Information
Activities that support travellers either in a pre-trip, or on-trip context are an important part of ITS. This information provides „yellow pages‟ type functions that can be allocated to different services.
Route Guidance and Navigation – Pre-trip
ITS can provide information on optimum route options for specified destinations. Best route options may be calculated taking account of network and public transport information, and may incorporate more information.
Route Guidance and Navigation – On-trip
These services are similar to pre-trip but cover the services used whilst the trip is in progress. The additional services can be dynamic in real-time, such as congestion avoidance route guidance.
Trip Planning Support
ITS systems provide data regarding traffic flows and travel demand for journey planning and transportation planning purposes, including collection, archiving and retrieval of system data.
2 Traffic Management and Operations Services
This domain is central to road network operations. It concerns the movement of people, goods and vehicles throughout the transportation network, and includes both automated monitoring and control actions
Traffic Management and Control
ITS can address the management and control of traffic flows for both urban networks (e.g.,
arterial streets, central business districts) and interurban networks (e.g., freeway, motorway,
autobahn) as lane control, ramp metering, signal control, etc., The following list adapted from
KAREN/FRAME List of User Needs for Traffic Control, with several changes made as in
"Information Infrastructures" to fit the needs and requirements of 2DECIDE.
1. Traffic Flow Control
o Dynamic lane management
o Ramp metering

2DECIDE
Coordination and support action
Page 95 of 117
o Travel guidance using variable message signs (VMS)
o Co-ordinated traffic management
o Traffic management for specific vehicles (dangerous cargo, wide loads, etc.,)
o Specific control measures for tunnels
o Specific control measures for bridges
o Specific control measures for vulnerable road users
2. Adaptive Traffic Control at Intersections
o Green wave
o Delay minimisation, e.g., traffic control at one or more intersections
o priority to selected travellers (e.g. cyclists, pedestrians) and/or vehicles (e.g. PT,
emergency)
3. Information Infrastructures
o Road Monitoring
a. Traffic monitoring
b. Weather monitoring
o Traffic Centers
c. Traffic Information Centers
d. Traffic Control Centers or both
4. Parking facilities management
5. Planning and forecasting traffic conditions
Incident Management
ITS provides the capability for preventing, detecting and responding to various incidents in the transport network, which specifically involve conditions initiated in the network itself. Such a system might contain a package of Traffic Management and Control with the primary aim of incident management.
Demand Management
Demand management covers the development and implementation of management and control strategies designed to influence the demand for travel. These strategies influence the overall level of demand for transport
Transport Infrastructure Maintenance Management
This service group covers the application of ITS technologies to the management of road network maintenance, plus the maintenance of the communication and computer infrastructures used to support travel services
Policing/Enforcement
ITS technologies contribute to the enforcement of traffic laws and regulations. The services make use of automatic detection of vehicle type, access permissions, vehicle registration plates, vehicle speeds, etc.

2DECIDE
Coordination and support action
Page 96 of 117
3 Intelligent Vehicle Services
ITS services in this domain focus on services and systems that improve the operational safety of vehicles, and are contained within the vehicle itself.
Vision Enhancement
These services cover the application of ITS technologies to the enhancement of driver perception
through the use of in-vehicle equipment.
Safety Readiness
The safety readiness service group covers the use of monitoring and warning systems for both
private car driver and vehicle. At the current moment, many automated vehicle systems can only be
found, in advisory (assistance) mode under „safety readiness‟, e.g., lane departure warning,
advisory, ISA, etc., and not in "automated/control modes".
1 Driver impairment (drowsiness, alcohol, etc.)
2 Intelligent vehicle safety systems or eSafety systems (eSafety Support 2010), e.g. local danger warning (congestion, obstacle, low friction, low visibility, road works, etc.).
3 Collision avoidance
4. Lane keeping
5. Platooning
6. Speed control (including ISA, Intelligent Speed Adaptation)
Automated Vehicle Operation
ITS technology can automate the driving process, creating a „driver assisted‟ or completely „hands
off‟ driving environment. For public transport, specific tools can be used to permit vehicles to be
automated.
Co-operative Systems (Newly added on based on recent input by Peter Jesty, E-FRAME)
Covers the ablility of the system to warn and inform drivers in a timely manner of different types of events, warnings and information via an in-vehicle display, including the ability to send and request information. Categories include:
1 Traffic Safety (stationary vehicles, road hazard warning, ghost driver, lane utilisation, speed management, etc.)
2 Traffic efficiency (traffic flow optimisation, adaptive traffic signals, flexible lane management, etc.)
3 Supporting services (service continuity, communications management, etc)
4 Value-Added services (enhanced route guidance and navigation, automated access control and parking, etc.)
4. Freight Transport Management
This domain addresses activities that facilitate both commercial vehicle operations and multi-modal
logistics, including inter-jurisdictional coordination.

2DECIDE
Coordination and support action
Page 97 of 117
Management of Dangerous Freight (Hazardous Goods)
The transport of dangerous loads involves monitoring status and condition of the load and its location as it progresses along the infrastructure of the transport modes that are used.
An additional service not directly included in the PIARC list of ITS services has been added to the 2DECIDE list of services:
Intelligent Truck Parking
This service includes collection and communication of real-time information to operators and truck drivers pertaining to the availability and locations of truck parking spaces along the road network.
5. Public Transport Services
This domain describes the activities that will deliver more timely and efficient operation of public
transport services and provision of operational information to the operator and passenger.
Public Transport Management
Advanced public transport systems provide information on vehicle location and status and enable the
identification of departures from schedule and rescheduling in real-time.
Demand Responsive and Shared Transport
Shared transport is an alternative to the single occupancy private car. A dispatching system assigns
vehicles to travellers according to the demand. The fleet may include buses, vans and taxis.
Public Transport Electronic Payment
Covers all types of electronic payment systems related to use of public transport systems
Communication Systems
Covers all communication elements between public transport fleet, control centres and road-side
infrastructure
6. Emergency Services
This domain describes activities that permit emergency support services to be more quickly initiated
and expedited throughout the transportation network
Transport Related Emergency Notification and Personal Security
ITS can provide driver and personal security services and automatic incident notification for all both private and professional drivers. Automated European emergency call service E-call (eSafetySupport 2010) is one example of such service.
Emergency Vehicle Management
Fleet management, route guidance and traffic signal priority techniques can be applied to the management of emergency vehicles such as fire, police and ambulance. These services are implemented in connection to traffic management and incident notification.

2DECIDE
Coordination and support action
Page 98 of 117
Hazardous Materials and Incident Notification
ITS can provide authorities with data on the nature, location and condition of hazardous goods cargoes. This facilitates the enforcement of routing instructions and the effective response to any incident
7. Transport-related Electronic Payment Services
This domain addresses activities that permit revenues for transport services, tolls and payment for
other facilities to be collected through non-cash and non-stop payment. This does not include public
transport-related payment services which are in the domain "Public Transport Services".
Transport-related Electronic Financial Transactions (Public Transport Electronic
Payment selected and transferred to Public Transport Services)
Electronic, or „cashless‟ payment systems are an important group of services. They include automated drive through systems to collect tolls and road user fees (e.g., distance-based, not just use of fixed tags) This does not include public transport-related payment services.
Integration of Transport Related Electronic Payment Services
This service group includes development of integrated payment systems and mechanisms between jurisdictions as well as between different travel modes.
8. Road Transport Related Personal Safety
The services in this domain describe activities that protect the personal safety of pedestrians and individuals using the road network.
Public Travel Security
This group includes the surveillance and monitoring systems for public transport vehicles transit stops and facilities, car parks, etc. Systems may be automatic, or manually initiated.
Safety Enhancements for Vulnerable Road Users
The enhancement of safety levels for vulnerable road user groups, such as motor cyclists, pedal cyclists, children, elderly or disabled pedestrians, and road maintenance workers is an important objective of this sub-service.
Safety Enhancements for Disabled Road Users
ITS technology can improve safety for disabled road users (particularly pedestrians with physical impairment).
Safety Provisions for Pedestrians Using Intelligent Junctions and Links
The provision of monitoring and warning systems can enhance pedestrian safety at junctions, both signalised and priority (and including multi-modal or inter-modal intersections).

2DECIDE
Coordination and support action
Page 99 of 117
9. Weather and Environmental Conditions Monitoring Services
The services in this domain describe activities that monitor weather and environmental conditions that have an impact upon the transport network and its users.
Weather monitoring
Monitoring of weather conditions, includes the detection of fog, ice, snow, wind, rain and heat; along with prediction of specific road and travel conditions such as icing and visibility.
Environmental Conditions Monitoring
Conditions such as flooding (due to high tides), land movement (earthquakes, mud slides, etc.) and pollution levels can be monitored. Prediction based on current and historical trends can be incorporated.
10 Disaster Response Management and Co-ordination Services
This domain describes ITS activities will assist multiple jurisdictions in their response to natural disasters, civil disturbances, or terrorism.
Disaster Data Management
These services concern the systematic management of data and databases on natural and man-made disasters gathered by the appropriate agencies.
Disaster Response Management
Services that manage the use of the transport network to minimise the impact of a disaster on the transport network and its users fall into this category.
Coordination with Emergency Agencies
This group includes services that co-ordinate the use of the road network by vehicles belonging to emergency agencies. This may utilise the traffic control services activities, incident notification, etc.

2DECIDE
Coordination and support action
Page 100 of 117
Annex 1 - 2DECIDE Document Use within the ITS Toolkit

2DECIDE
Toolkit for sustainable decision making in ITS deployment
WP2
2DECIDE Document Use within the ITS Toolkit
Version
1.0
Dissemination level
Restricted
2DECIDE is a Coordination and support action funded by the
European Commission, DG Directorate-General for Mobility and Transport (MOVE)
in the FP7-SST-2008-TREN1 programme

Page 102 of 116
Contract Number:
TREN/FP7TR/233608/”2DECIDE”
Acronym:
2DECIDE
Title:
Toolkit for sustainable decision making in ITS deployment
Contractual date of delivery:
Actual date of delivery:
Main author(s) or editor(s):
S. Schwillinsky
Other author(s):
Version History:
Version Date Main author(s) Summary of changes
0.1 28.06.2010 Stefan Schwillinsky
0.2 31.08.2010 Stefan Schwillinsky Minor changes
1.0 01.10.2010 Stefan Schwillinsky Final version after revision through legal expert

Page 103 of 116
List of the 2DECIDE Project Partners:
Beneficiaryno.
Beneficiary name Beneficiaryshort name
Country
1 (coordinator)
AustriaTech - Gesellschaft des Bundes für technologiepolitische Maßnahmen GmbH.
ATE Austria
2 ECORYS Nederland BV ECO Netherlands
3 Egis Mobilité S.A. EGI France
4 VTT - Valtion teknillinen tutkimuskeskus (Technical Research Centre of Finland)
VTT Finland
5 Transver TRV Germany
6 Genua Consult GEN Denmark
7 Politecnico di Milano – Dipartimento Indaco, Laboratory for mobility and transport
POL Italy
8 Jacobs Consultancy spol. s.r.o. JBA Czech Republic
9 Vereinigung High Tech Marketing HTM Austria
10 EXODUS S.A. EXO Greece
11 Algoé Consultants ALG France
12 Center for Research and Technology Hellas HIT Greece
13 Rapp Trans (UK) Ltd. RAP United Kingdom
14 Mobycon BV MOB Netherlands

Page 104 of 116
Table of Contents
1. Introduction 105
1.1 Copyright related questions identified within the 2DECIDE project consortium 105
1.2 Rules for document use 106
GENERAL RULES FOR DOCUMENT USE OF AND WITH REGARD TO THE ITS TOOLKIT 2DECIDE 106
1 Use of documents available on public websites in the ITS Toolkit 106
2. Documents processed by the ITS Toolkit 107
3. 2DECIDE ITS Toolkit Document Use Agreements 108
4. ITS Toolkit and other online data bases 108
5. Disclaimer of Liability for the ITS Toolkit 109
5.1 Terms of Use for the ITS Toolkit 109
5.2 Disclaimer of Liability 109
List of Figures
Figure 1: output of the ITS Toolkit 107

Page 105 of 116
1. Introduction
The result of the 2DECIDE project is the ITS Toolkit (www.ITS-Toolkit.eu) where documents
and data extracted from documents related to ITS will be made available to the interested
public. A vital part of the ITS Toolkit are documents elaborated by various sources. In the
following binding guidelines shall ensure the correct collection, storage and usage of these
documents. These guidelines are also intended to give a general overview on the relevant
legal framework as well as on procedures designed for the 2DECIDE project.
1.1 Copyright related questions identified within the 2DECIDE
project consortium
In the course of the 2DECIDE project the need for an outline of the legal framework encompassing the
development of the ITS Toolkit emerged and a list of essential questions were compiled:
What is required that the public is allowed to use a document made available by the ITS-Toolkit via a website?
If material is available at a public website, does this imply that this material can be used by 2DECIDE / the public without further notice to the author/copyright owner?
Processing a document (store, summarise, extract, display, translate) how does this interfere with copy rights?
In the case material has been transmitted to 2DECIDE, does the Document Use Agreement in the proposed form meet the needs for a legally sound agreement between external authors/copy right owners and the ITS-Toolkit ? What kind of guarantees shall be proposed to external authors/copy right owners?
When a Document Use Agreement for one or more documents is signed - who should sign as representative for 2DECIDE / ITS-Toolkit (when the 2DECIDE project is finished the agreement needs to be handed over to the future maintaining body) (project coordinator, the partner dealing with the document)?
In the case an organisation offers the possibility to search in their databases from 2 DECIDE tool, what kind of guarantees shall be proposed?
Terms of Use or Disclaimer for outputs of the ITS-Toolkit (summaries, exported material in PDF-format)
Liability for outputs of the ITS-Toolkit -How to protect the maintaining body of the ITS-Toolkit against legal claims by third parties?

Page 106 of 116
1.2 Rules for document use
This section features the general rules for the use of documents in response to the list of
questions in section 1.1 and shall represent the general rules for document use every user
and project partner has to comply with.
GENERAL RULES FOR DOCUMENT USE OF AND WITH
REGARD TO THE ITS TOOLKIT 2DECIDE
AustriaTech – Gesellschaft des Bundes für technologiepolitische Maßnahmen GmbH
(Austria Tech) is project coordinator and represents the 2DECIDE project ITS TOOLKIT
2DECIDE and the other partners of the 2DECIDE project and is the maintaining entity of the
ITS Toolkit during the project.
The General Rules for Document Use apply to project partners and users of the ITS
TOOLKIT 2DECIDE.
1 Use of documents available on public websites in the
ITS Toolkit
If a document is available via a public website, it might be protected under copyright or under
other intellectual property rights. The use of such published documents (download and
storing in the ITS Toolkit) basically requires the prior approval of the documents
author/copyright owner. Parts of such documents or short summaries might be used in own
documents that deal with the subject of such documents. General citation rules (see below)
shall apply.
If approval of the author/copyright owner is required for the usage of the document in the ITS
Toolkit the Document Use Agreement (see Annexes: Request for Permission to Use Material
Protected by Copyright, Permission for Document Use by the ITS Toolkit) needs to be signed
by the author/copy right owner and AustriaTech as project coordinator.
The following citation is recommended::
Web site: author(s), article and publication title where appropriate, as well as a URL,
and a date when the site was accessed.1
1 http://en.wikipedia.org/wiki/Citation#Citation_content, as on 28.06.2010

Page 107 of 116
Example:
B. Merlin: CON10 EVALUATION OF VMS DEPLOYMENT ON SLOVENIAN PART
OF CORRIDOR V V1(2).doc, URL: http://www.easyway-
its.eu/1/index.php?option=com_docman&task=doc_download&gid=1562&Itemid=103,
accessed on 28.06.2010
In cases of doubt each user and/or project partners have to consult national copyright rules.
2. Documents processed by the ITS Toolkit
The documents (reports, case studies) will be processed by the ITS Toolkit. Processing
includes storing, extracting of data into data base fields of the knowledge base, displaying of
parts or the whole document and translating single parts of the documents in other
languages.
Figure 1 shows the steps of processing a user query and the parts of the generated output:
Figure 1: output of the ITS Toolkit
The “summary part” (Part A) of the output consists of data extracted and categorized in the
knowledge base of the ITS Toolkit. Additionally a generic part describing the ITS
technologies identified relevant to the query is included.
A complete citation (see example in section 1) needs to be included in the “relevant report
summary” (Part B), where the documents are sorted by relevance and quality.
Objectives
Problems
Context
ITS Service
Inference
Engine
Knowledge
Base
Knowledge
Base
Relevant Ranked
ITS Service(s)
- Ranking by
relevance
- Rationale
(fired criteria)
- Summary
Implementation
Requirements
Related
conventional
measures
Parameters
Report 1
Report 2
Report ….
Document
Document
Document
Databases
- External DBs
(IBEC,
TEMPO,
EasyWay, ...
- 2DECIDE
Internal DB
OR
OR
AND
Decision Tree
Evaluation
Matrix
PART A
Service(s)
Summary
Sheets
PART B
Relevant Report
Summary:
- Best practice
- Evaluation
Report
- Case Study
PART C
Detailed
Reports
…
…
…
…
…
…
Reports
ranked by:
- Relevance
- Quality

Page 108 of 116
In the “detailed reports section” (part C) the actual document as a whole including all
information about the author will be presented to the user.
Every output to a user request will consist of the three parts A, B and C which ensures
complete information about the authorship of all parts of the query results.
The content and the query results may change along the timeline, therefore a time stamp
needs to be included in every output along with the disclaimer (see section 5.2).
3. 2DECIDE ITS Toolkit Document Use Agreements
The Document Use Agreements (Request for Permission to Use Material Protected by Copyright,
Permission for Document Use by the ITS Toolkit) serve as standardized written consents for the
use of documents provided by external authors/copyright owners. In the data collection
phase done in work package 2 of the 2DECIDE project the Document Use Agreements serve
the purpose to establish consent in written form between the author/ copyright owners and
the ITS Toolkit.
In the Document Use Agreements all data about the author/copy right owner and the
document are included. Every 2DECIDE project partner shall provide the Document Use
Agreement to the authors/copyright owners and assist with filling in the form. Once filled in,
the form shall be signed by the author/copyright owner and sent to AustriaTech by email (as
scan), fax or hard copy. AustriaTech will return a signed hard copy of the document in return.
The actual documents in electronic form of hard copy will be collected by the project partner
and processed in accordance with the work package 2 activities.
During the 2DECIDE project the Document Use Agreements will be signed by the author and
the project coordinator AustriaTech as legal body representing the 2DECIDE consortium.
Once the ITS Toolkit is handed over to a future maintaining entity the Document Use
Agreements will be included.
The ITS Toolkit will include an online submission facility for documents. The online
submission facility shall also include the Document Use Agreements in an adopted form to
meet the requirements for the online processing. This way the future maintaining entity of the
ITS Toolkit is enabled to administer the Document Use Agreements of all documents added
in future to the ITS Toolkit represented by AustriaTech.
4. ITS Toolkit and other online data bases
Beside the technical aspects of the query mechanism, for free to use websites no copyright
issues are expected if the rights of use of the said data base grant unlimited free use of the
collected data. The signing of a Document Use Agreement can be necessary. It is advisable

Page 109 of 116
to establish a cooperation between the ITS Toolkit and other databases to ensure a correct
matching of search criteria and a smooth technical performance.
5. Disclaimer of Liability for the ITS Toolkit
The disclaimer includes rules for the user in terms of the correct use and the limitation of
liability for outputs of the ITS Toolkit. It consists of terms of rules and on regulations on
liability (Haftungsbegrenzung). When registering to the ITS Toolkit, the user will implicitly
accept the disclaimer or if necessary, be prompted to do so.
To protect the maintaining entity of the ITS Toolkit against legal claims of users or
authors/copy right owners of documents every output (on the screen and as exported
document e.g. as PDF) of the ITS Toolkit needs to have a time stamp (date and time) and
the disclaimer included which corresponds to the disclaimer as outlined under 5.2.
5.1 Terms of Use for the ITS Toolkit
The maintaining entity of the ITS Toolkit complies with all applicable data protection rules of
personal related information stored in user profiles.
The maintaining entity of ITS Toolkit further endeavours to ensure a correct and extensive
citation of all authors/copy right owners. Users and project partners have to correctly use
citation of all authors / copy right owners.
No user has any entitlement towards the maintaining entity that any documents are either
accepted or removed. This does not apply to authors / copy right owners. It is the sole
responsibility and right of the maintaining entity to update the content or remove parts and to
issue (additional) rules and conditions how the outputs of the ITS Toolkit may be used.
Every user acknowledges that the maintaining entity owns copy rights and any other
intellectual property rights on the ITS Toolkit website (data base structure, algorithms) and
the generic parts of information (technical descriptions etc).
5.2 Disclaimer of Liability
Any output of the ITS Toolkit has been created to the best knowledge of the maintaining
entity and should constitute the state of art at the date of the creation of the output.

Page 110 of 116
The use of the ITS Toolkit is restricted to read and to download the output as pdf for private
use. Specific restrictions with regard to individual documents have to be complied with.
With regard to the ITS Toolkit output or to any links to documents of other websites/data
bases, the maintaining entity of the ITS-Toolkit disclaims all warranties and liabilities, either
express or implied, relating to quality, completeness, fitness for purpose or achievement of a
particular result and further disclaims all warranties and liabilities that the outputs will be error
free.
The use of outputs of the ITS-Toolkit may not be deemed a substitute for any planning done
by an expert.

Page 111 of 116
Annexes:
Request for Permission to Use Material Protected by Copyright (EN)
Document Use Agreement (EN)
Support Letter of the European Commission

Page 112 of 116
Dear Sir/Madam!
2DECIDE is a European Research project funded in the FP7 framework programme. Within the
project the ITS Toolkit will be developed. The ITS Toolkit (www.its-toolkit.eu) is a web based decision
support tool on ITS deployment and will be available for free to the public. The document repository of
the ITS Toolkit collects ITS related documents like evaluation reports, case studies and best practice
examples from all over Europe. There will be no commercial exploitation neither of the ITS Toolkit nor
of its content.
As author/copyright owner of the documents as indicated below I confirm that AustriaTech as
coordinator of the 2DECIDE project is entitled to store and display the mentioned documents within
the ITS Toolkit’s document repository.
In return, AUSTRIATECH as coordinator of the 2DECIDE project ensures that the author/Copyright
ownership is indicated every time the documents are processed by the ITS Toolkit. A statistic on the
number of ‘hits’ on each of the documents is available from the administrator of the ITS Toolkit on
request.
List of documents: (add rows as needed)
Title Author / copy right
owner
Contact (email,
address)
Date of
issue
Electronic file
format
Company
Name
Address
ZIP Place
Country
Subject: Permission for Document Use by the ITS Toolkit Place, date
Signature
Name
Place, Date
For the 2DECIDE project
Signature
Name
Place, Date
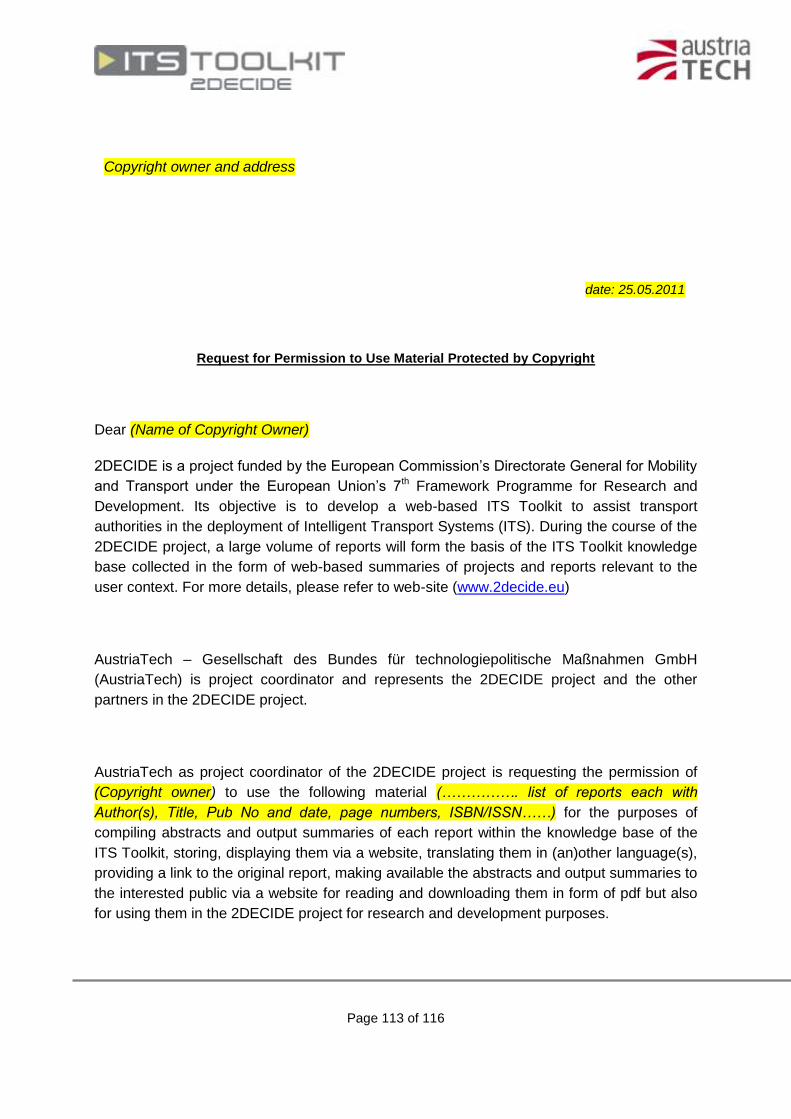
Page 113 of 116
date: 25.05.2011
Request for Permission to Use Material Protected by Copyright
Dear (Name of Copyright Owner)
2DECIDE is a project funded by the European Commission’s Directorate General for Mobility
and Transport under the European Union’s 7th Framework Programme for Research and
Development. Its objective is to develop a web-based ITS Toolkit to assist transport
authorities in the deployment of Intelligent Transport Systems (ITS). During the course of the
2DECIDE project, a large volume of reports will form the basis of the ITS Toolkit knowledge
base collected in the form of web-based summaries of projects and reports relevant to the
user context. For more details, please refer to web-site (www.2decide.eu)
AustriaTech – Gesellschaft des Bundes für technologiepolitische Maßnahmen GmbH
(AustriaTech) is project coordinator and represents the 2DECIDE project and the other
partners in the 2DECIDE project.
AustriaTech as project coordinator of the 2DECIDE project is requesting the permission of
(Copyright owner) to use the following material (……………. list of reports each with
Author(s), Title, Pub No and date, page numbers, ISBN/ISSN……) for the purposes of
compiling abstracts and output summaries of each report within the knowledge base of the
ITS Toolkit, storing, displaying them via a website, translating them in (an)other language(s),
providing a link to the original report, making available the abstracts and output summaries to
the interested public via a website for reading and downloading them in form of pdf but also
for using them in the 2DECIDE project for research and development purposes.
Copyright owner and address

Page 114 of 116
AustriaTech as project coordinator of the 2DECIDE project will ensure to give proper credit to
the author and your organisation. We request your support as copyright owner to allow the
2DECIDE project the right to use the articles listed above free of charge in the manner
described herein.

Page 115 of 116
Provided your approval please complete and sign the bottom of this letter and return it to
us.
In support of our request, please find attached a letter from the European Commission
explaining the project and its purpose.
Your quick response would be highly appreciated as we would like to start soon with the
2DECIDE database compilation and testing.
Thank you for your consideration,
Sincerely,
Signature
Martin Boehm
2DECIDE Project Manager
(AustriaTech, Donau City Strasse , A1220 Vienna, Austria)
Permission is Hereby Granted Pursuant to the Terms and Conditions of this Letter
(Name and address of Copyright Owner)
By: ----------------------
Title: --------------------
Signature
Date: ------------------------
Further conditions and instructions (if any): ---------------------

Page 116 of 116