2020 - SANDAG ::HOME:: San Diego's Regional Planning Agency
182
5594 9/20 For the Fiscal Year Ended June 30, 2020 ___ San Diego, California San Diego Association of Governments COMPREHENSIVE ANNUAL FINANCIAL REPORT 2020 2020 2020 2020 2020 2020
Transcript of 2020 - SANDAG ::HOME:: San Diego's Regional Planning Agency

5594 9/20
For the Fiscal Year EndedJune 30, 2020___San Diego, California
San Diego Association of Governments
COMPREHENSIVEANNUAL FINANCIAL REPORT
2020
2020
20202020
2020
2020


San Diego Association of Governments
San Diego, California
Comprehensive Annual Financial Report
For the year ended June 30, 2020
PREPARED BY THE SAN DIEGO ASSOCIATION OF GOVERNMENTS
FINANCE DEPARTMENT

This page intentionally left blank.

San Diego Association of Governments
Table of Contents Year ended June 30, 2020
INTRODUCTORY SECTION Page
Letter of Transmittal ....................................................................................................................................... i
SANDAG Board of Directors ....................................................................................................................... xiii
SANDAG Executive Staff ............................................................................................................................ xiv
SANDAG Organization Chart ....................................................................................................................... xv
Certificate of Achievement for Excellence in Financial Reporting - GFOA ................................................. xvi
FINANCIAL SECTION
Independent Auditor’s Report ................................................................................................................... 3
Management’s Discussion and Analysis (Required Supplementary Information) .............................. 7
Basic Financial Statements
Government-Wide Financial Statements:
Statement of Net Position .............................................................................................................. 25 Statement of Activities .................................................................................................................... 26
Fund Financial Statements
Governmental Fund Financial Statements:
Balance Sheet – Governmental Funds ................................................................................... 32 Reconciliation of the Governmental Funds Balance Sheet to the
Government-Wide Statement of Net Position ................................................................... 35 Statement of Revenues, Expenditures, and Change in Fund Balances –
Governmental Funds ........................................................................................................ 36 Reconciliation of the Statement of Revenues, Expenditures, and Changes
in Fund Balances of Governmental Funds to the Government-Wide Statement of Activities ...................................................................................................... 39
Proprietary Fund Financial Statements:
Statement of Net Position – Proprietary Funds ....................................................................... 43 Statement of Revenues, Expenses, and Change in Fund Net Position –
Proprietary Funds .............................................................................................................. 44 Statement of Cash Flows – Proprietary Funds ........................................................................ 45

San Diego Association of Governments
Table of Contents, Continued Year ended June 30, 2020
FINANCIAL SECTION, Continued Page
Notes to the Basic Financial Statements
San Diego Association of Governments Notes to the Basic Financial Statements for the Fiscal Year Ended June 30, 2020 ....................................................................................... 49
Required Supplementary Information
Schedule of Changes in Net OPEB Liability and Related Ratios ..................................................... …….115 Schedule of OPEB Contributions .............................................................................................................. 116 Schedule of Changes in Net Pension Liability and Related Ratios .......................................................... 118 Schedule of Plan Contributions ................................................................................................................. 119 Schedule of Revenues, Expenditures, and Changes in Fund Balances – Budget and Actual:
General Fund ....................................................................................................................................... 121 San Diego County Regional Transportation Commission Sales Tax Projects Fund ........................... 122 Notes to Required Supplementary Information .................................................................................... 123
Supplementary Information
Combining and individual fund statements and schedules:
Combining Balance Sheet – Nonmajor Governmental Funds ..................................................... 127 Combining Statement of Revenues, Expenditures and Changes in Fund Balances –
Nonmajor Governmental Funds .............................................................................................. 128 Combining Statement of Net Position – Nonmajor Proprietary Funds ........................................ 129 Combining Statement of Revenues, Expenses and Changes in Fund Net Position –
Nonmajor Proprietary Funds ................................................................................................... 130 Combing Statement of Cash Flows – Nonmajor Proprietary Funds ............................................ 131
Schedule of Revenues, Expenditures, and Changes in Fund Balances – Budget and Actual:
Capital Projects Fund ................................................................................................................... 132 San Diego County Regional Transportation Commission Debt Service Fund ............................ 133 San Diego Association of Governments Debt Service Fund ....................................................... 134 General Services Fund ................................................................................................................ 135 SAFE Program Fund .................................................................................................................... 136

San Diego Association of Governments
Table of Contents, Continued Year ended June 30, 2020
STATISTICAL SECTION Page
Financial Trends:
Net Position by Component – Last Ten Fiscal Years ......................................................................... 139 Change in Net Position – Last Ten Fiscal Years ................................................................................ 140 Fund Balances of Governmental Funds – Last Ten Fiscal Years ...................................................... 142 Change in Fund Balances of Governmental Funds – Last Ten Fiscal Years .................................... 143
Revenue Capacity:
Tax Revenues by Source, Governmental Funds – Last Ten Fiscal Years ........................................ 145 Direct and Overlapping Sales Tax Rates – Last Ten Fiscal Years .................................................... 146 San Diego Region Taxable Sales by Jurisdiction – Fiscal Year 2019 and Nine Years Prior ............. 147
Debt Capacity:
Ratios of Outstanding Debt by Type – Last Ten Fiscal Years ........................................................... 148 Pledged-Revenue Coverage – Last Ten Fiscal Years ....................................................................... 149Pledged-Revenue Coverage – SR 125 Toll Road - Last Seven Fiscal Years ................................... 150
Demographic and Economic Information:
Demographic and Economic Statistics – Last Ten Available Calendar Years ................................... 151 San Diego Region Employment by Industry – Calendar Year 2019 and Nine Years Prior................ 152
Operating Information:
Operating Indicators: Employees by Functional Department – Last Ten Fiscal Years ..................... 153 Capital Asset and Asset Held for Distribution Statistics by Program – Last Ten Fiscal Years .......... 154

This page intentionally left blank.

INTRODUCTORY SECTION

This page intentionally left blank.
December 23, 2020
Honorable Chair and Members of the Board of Directors
San Diego Association of Governments
We are pleased to present the basic financial statements of the San Diego
Association of Governments (SANDAG) for the fiscal year ended June 30, 2020.
Responsibility for both the accuracy of the data and the completeness and
fairness of the presentation, including all disclosures, rests with management
of SANDAG. A comprehensive framework of internal controls has been
designed and implemented to ensure the assets of SANDAG are protected from
loss, theft, or misuse, and to ensure that financial information is accurate and
complete. Because the cost of internal control should not exceed anticipated
benefits, the objective is to provide reasonable, rather than absolute, assurance
that the financial statements are free of any material misstatements.
To the best of our knowledge and belief, the enclosed data is accurate in all
material respects and is reported in a manner designed to present fairly the
financial position and changes in financial position including results of
SANDAG’s operations. All disclosures necessary to enable the reader to gain an
understanding of SANDAG’s financial activities have been included.
Crowe LLP has issued an unmodified (“clean”) opinion on SANDAG’s financial
statements for the fiscal year ended June 30, 2020.
Management’s Discussion and Analysis (MD&A) immediately follows the
independent auditor’s report and provides a narrative introduction, overview,
and analysis of the basic financial statements. MD&A complements this letter
of transmittal and should be read in conjunction with it.
Reporting Entity
SANDAG is the San Diego region’s Council of Governments (COG). Local elected
officials throughout the United States have joined together to form similar
COGs to deal cooperatively with issues that go beyond jurisdictional
boundaries, such as transportation, growth management, environmental
quality, and other public facility needs. SANDAG is a statutorily created agency,
codified in California state law. Voting among the agency’s 18 cities and county
government is based upon both membership and the population of each
jurisdiction, providing for an equitable representation of the region’s residents.
Caltrans, United States Department of Defense, San Diego Unified Port District,
San Diego Metropolitan Transit System (MTS), North County Transit District
(NCTD), San Diego County Water Authority, Imperial County, Southern
California Tribal Chairmen’s Association, and Mexico (Consulate General of
Mexico) are nonvoting advisory members of SANDAG.

ii
SANDAG traces its origins to the 1960s as local planners and decision-makers saw the need for
coordinated efforts to solve a growing list of regional issues. In 1972, a Joint Powers Agreement was
formalized among local governments, creating a COG, then known as the Comprehensive Planning
Organization, with independent staffing and cooperative financing from the local members and
project grants from state and federal agencies. In 1980, the name was changed from the
Comprehensive Planning Organization to the San Diego Association of Governments, to better reflect
the agency’s purpose. In 2003, Senate Bill 1703 (Peace, 2003), as amended by Assembly Bill 361
(Kehoe, 2003), called for the consolidation of certain MTS and NCTD transit functions into SANDAG.
SANDAG is now responsible for long-range transit planning, programming, project development, and
construction of transportation projects in the region. This structure is intended to streamline regional
decision making to improve the transportation system, protect open space and habitat, bolster our
infrastructure, and sustain our quality of life.
The San Diego County Regional Transportation Commission (Commission) is a blended component
unit of SANDAG and therefore, is considered part of the SANDAG primary government. The SANDAG
Board of Directors also serves as the Commission’s Board of Directors. The Commission is responsible
for the implementation and administration of transportation improvement programs funded by the
San Diego countywide one-half percent sales tax. This tax became effective on April 1, 1988, as a
result of the passage of Proposition A – The San Diego County Transportation Improvement Program,
known as TransNet. The sales tax funds are used for highway, public transit, local street and road
improvements, bicycle and pedestrian facilities, and administration.
In November 2004, the voters of San Diego County extended the one-half cent sales tax another
40 years to 2048. The extension of TransNet will help SANDAG continue to implement the region’s
transportation program, as well as provide funding for bicycle, pedestrian, and neighborhood safety
projects; major corridor capital projects; environmental mitigation projects; smart growth projects;
local street and road projects; transit system projects; and operation of the new transit services.
The Extension Ordinance includes a mandate that an Independent Taxpayer Oversight Committee
(ITOC) for TransNet be formed to provide an enhanced level of accountability for the expenditure of
funds under the TransNet expenditure plan. The ITOC also helps ensure that all voter mandates are
carried out as required and develops recommendations for improvements to the financial integrity
and performance of the program. The Commission is authorized to issue limited tax bonds payable
from the sales tax receipts, the proceeds of which can be used to finance approved TransNet projects.
The Commission has created a Plan of Finance (POF) for the TransNet program, which is updated at
least annually. A summary of the most recent POF is provided near the end of this letter.
San Diego’s Regional Economy
Basics of the San Diego Economy
San Diego is a diverse, growing region of just under 3.4 million people, who are younger than the
national average, richer in terms of per capita income, and better educated with more college and
advanced degrees. The $250 billion economy is also diverse and well positioned for the future in
innovative sectors.

iii
Blessed with a beautiful natural environment, 70 miles of coastline, mild weather, and a plethora of
outdoor activities, the city is often referred to as “America’s Finest City.” This moniker pays tribute to
the natural amenities that make San Diego one of the most desirable places to live and work in the
nation, and one to which most people would consider relocating.
This offers employers a highly skilled workforce and forecasts for the next 20 years show a growing
population, adding roughly 15,000 residents annually. The San Diego job base and economy continue
to diversify over the forecast period.
While the local economy has been severely affected by the recession associated with the COVID-19
pandemic, it is expected to bounce back in the coming years. While uncertainty persists over the short
term and the shape of the recovery, the strong pre-recession trend should be reached by 2026, or
even before.
History of the San Diego Economy
Once characterized as a sleepy Navy town, and later as a tourist destination, San Diego’s economy
has diversified and matured over the last 75 years. Before World War II, 70 percent of jobs in the local
economy were in traditional sectors such as the Military, Manufacturing, Construction, Finance, and
Retail and Wholesale Trade; today it is less than 50 percent. The military accounted for about 20
percent of the region’s employment in 1940 (and ballooned to nearly half during the early 1950s) and
stayed prominent throughout the Cold War.
The 1960s brought the emergence of the Tourism and Hospitality industry, the opening of
UC San Diego (which became a key economic engine), as well as the approval of maquiladoras in
Mexico, allowing U.S. firms access to low-cost manufacturing. By the 1980s, tourism was booming,
and the nascent life sciences sector was beginning to take root. Base Re-alignment and Closure
(BRAC), shuttered the Naval Training Center in the early 1990s and helped reduce the Military sector
to today’s 8 percent, despite a steady military presence. The 2000s brought the dot-com bust, 9/11,
and the Great Recession, but also the longest expansion on record from 2010 to early 2020 which has
greatly benefited the region.
Sectors driving the San Diego Economy
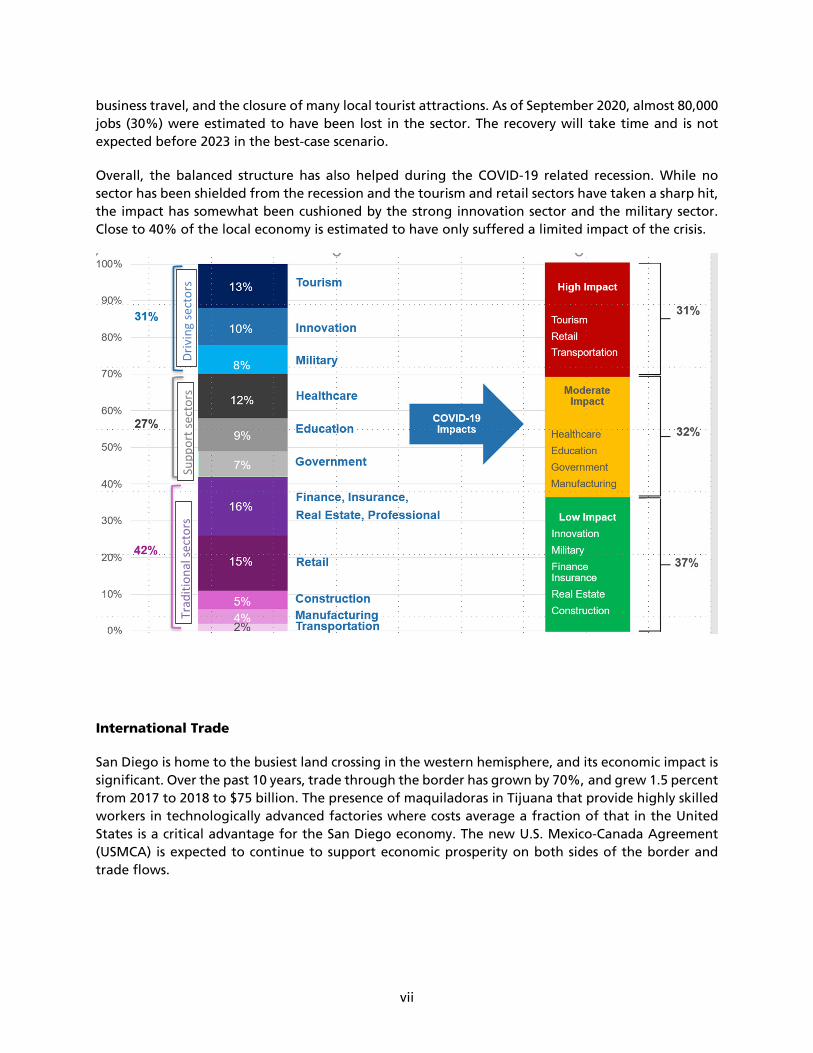
Today, San Diego boasts an economy that is not dominated by any one sector and, in fact, no sector
accounts for more than 16 percent of the regional economy.
Many of these sectors are physically clustered in San Diego’s “employment centers,” which allow
opportunities to develop a more compact development pattern. In analyzing the travel patterns,
regional agencies can plan for improved transportation options, such as the in-progress Mid-Coast
Corridor Transit Project.

iv
San Diego fares well in industries like Health Care, Education, and a lean Government sector. These
sectors are generally population driven (rising in tandem with population) have proven through the
Great Recession to be less affected by economic cycles.
Several sectors are “economic drivers,” specifically the “Innovation”, Military and Tourism sectors,
which together make up almost a third of the regional economy. Moreover, innovation will continue
to drive San Diego’s economy, with forward-looking technologies with massive growth potential
from companies like Illumina (revolutionized DNA sequencing with tremendous potential to improve
health care and quality of life), PacketSled and SPAWAR (cybersecurity experts), and Nuvasive (most
used products and techniques for adult back surgeries). The Military is pivoting toward Asia and has
committed to San Diego, as have many military contractors, like General Dynamics (makers of the
Predator drone) and ViaSat (satellite communications leaders). Tourism is supported by the weather,
beaches, as well as major attractions, such as the San Diego Zoo, and the Convention Center.

v
The “Innovation Sector” is key in the positioning of the regional economy for the future. Its success
can be traced back to our higher learning institutions and research facilities, like the Salk Institute,
Scripps Institute of Oceanography, San Diego State University, the University of San Diego, Cal State
San Marcos, and UC San Diego.
Nineteen different institutions of higher education enroll about 300,000 students in the region. UC
San Diego specifically is a highly ranked research university that has spawned hundreds of businesses,
many of which remain important local employers, and which together employ about 4 percent of San
Diego workers. Moreover, UC San Diego’s commitment to generating economic opportunity is
evident through their business-friendly approach to licensing technologies to new startup companies
that simplifies the transfer of copyrights and licenses for a minimal equity in the company.
Incubated by world-class research institutions, San Diego’s Innovation sector has grown considerably
over the last 25 years, posting a growth rate ten times that of the rest of the economy. It now
represents 10 percent of our local economy and employs over 160,000 people in high-paying jobs.
The Innovation sector is also itself diverse, featuring Information and Communication Technology,
Biotechnology and Biomedical, Aerospace and Navigation, and CleanTech. San Diego is the second
most patent-intensive county in the United States, behind Santa Clara County, and is the top
destination for National Institutes of Health research funding, first in life-sciences laboratory space,
and seventh in the United States to launch a startup, according to Forbes. The contribution of several

vi
regional institutions to COVID-19 epidemiology research and vaccine development confirms the
strength and high contribution of the sector to our economy.
The military sector provides a stable and diverse employment base to the region, following San
Diego’s long and successful relationship with the military. San Diego’s economy will benefit from the
decision to reallocate 60 percent of military assets to the West Coast over the next decade. During
the next few years, 50 percent more ships will be berthed in San Diego, and billions of dollars will be
invested by the Navy in infrastructure like the Seal training facility. The presence of the military
attracts over $10 billion in government contracts each year, and almost 150,000 jobs, about 1 in 12
San Diegans are directly employed by the military or Department of Defense. Many of these jobs are
highly skilled, and all generate indirect employment effects in many other sectors throughout the
economy. With a large deepwater port, a dozen military installations, and a well-developed support
economy, San Diego is an irreproducible ecosystem for the military.
San Diego is also a major tourism destination, routinely listed as the number one domestic travel
destination, such as in Money magazine’s 2016 assessment. As a result, San Diego’s Hospitality sector
grew two times as fast as our overall economy during the past 27 years. Nearly 37 million visitors
come to San Diego annually, bringing almost $12 billion into the regional economy. While tourism
jobs pay slightly less than the average, they do provide ample entry-level employment.
The tourism sector has been one of the hardest hit by the COVID-19 related recession as a result of
the high-contact business closures like restaurants and bars, the sharp declines in international and
vii
business travel, and the closure of many local tourist attractions. As of September 2020, almost 80,000
jobs (30%) were estimated to have been lost in the sector. The recovery will take time and is not
expected before 2023 in the best-case scenario.
Overall, the balanced structure has also helped during the COVID-19 related recession. While no
sector has been shielded from the recession and the tourism and retail sectors have taken a sharp hit,
the impact has somewhat been cushioned by the strong innovation sector and the military sector.
Close to 40% of the local economy is estimated to have only suffered a limited impact of the crisis.
International Trade
San Diego is home to the busiest land crossing in the western hemisphere, and its economic impact is
significant. Over the past 10 years, trade through the border has grown by 70%, and grew 1.5 percent
from 2017 to 2018 to $75 billion. The presence of maquiladoras in Tijuana that provide highly skilled
workers in technologically advanced factories where costs average a fraction of that in the United
States is a critical advantage for the San Diego economy. The new U.S. Mexico-Canada Agreement
(USMCA) is expected to continue to support economic prosperity on both sides of the border and
trade flows.
Driving sectors
Traditional sectors
Support sectors

viii
Jobs, Wages, and Housing
The diverse and robust San Diego economy presented above resulted in strong job growth and low
unemployment for San Diegans during the post Great Recession expansion. In 2019, San
Diego’s unemployment rate stood at 3.3 percent, lower than both California (4.1%) and the United
States as a whole (3.7%).
The brutal Covid-19 related recession resulted in a sharp increase in unemployment that is estimated
to have peaked at 25% in early May and is now hovering around 10%. Job losses have been
concentrated in high contact sectors such as tourism, retail and education, which are estimated to
account for 80% of the job losses in the region. Traditional sectors like Professional
Services, Construction, Finance, have fared much better than in past recessions, while military has
proven an essential buffer.
Despite wage increases, after adjusting for inflation, real wages remained stagnant, between
early-2017 and mid-2019. Strong wage increases and lower inflation boosted the purchasing
power of wages in the second half of 2019, but the recession has put an end to this favorable
trend.
Job losses and stagnating wage gains have however been partly compensated by income support
via the stimulus package and temporarily enhanced unemployment insurance benefits. This has
helped support households spending during the recession.
The San Diego region is in the midst of a reassessment of past housing and development practices. In
prior eras, it was assumed that housing would continue to spread east into the back-country, but
jurisdictions throughout the county have responded to residents’ concerns about sprawl and
adjusted their general plans to concentrate growth in existing communities. On the positive side,
much of the recent development has been in multifamily housing in downtown areas, which is
generally both less expensive and attractive to younger, high-skill workers (and some senior
buyers) who prefer active, vibrant communities. As open land acceptable for residential
development is in short supply, demand continues to outstrip the pace of building, and while San
Diego housing costs are less than those of comparable coastal metros, prices and rents are higher
than California or the United States as a whole and represent a challenge to additional economic
growth and to the economic well-being of many residents.
Despite the pandemic the median price of a detached home averaged $732,560 in August 2020, about 10 times the county median household income and more than 7 out 10 San Diegans are priced out of the housing market.
Outlook
While structurally strong, the San Diego economy has been hardly hit by the COVID-19
related recession. Nationally, GDP growth is expected to contract by 4 to 5% in 2020, and the
recovery is expected to be protracted especially until a vaccine is developed and widely distributed.
This means that it will also take several years for the regional economy to recover. The travel
and hospitality sector is expected to take the longest to recover. On the other hand, economic
drivers like the Innovation sector should continue to thrive and the Military will continue to
expand its strong presence. In the long run, the Health Care sector, both in the United States and
globally, is expected to see continued growth as the population ages, and as new therapies and
treatments are available to more people. Education, once it recovers, should also be a long-term
driver of economic growth, and Government typically grows proportional to population and is
forecasted to increase. The Financial, Professional, and Information sector (excluding Innovation
sectors), has done relatively better than other sectors during the pandemic and is expected to
ix
see slow but steady growth. Construction and Real Estate have also fared better than others.
Major Budget Initiatives and TransNet Plan of Finance Update
The FY 2021 Program Budget will see the continuation or completion of several significant work
efforts and the start of several new activities, as summarized below:
Overall Work Program
2021 Regional Plan
The bold new transportation vision for the 2021 Regional Plan will focus on creating a
balanced transportation system through the implementation of five strategies SANDAG refers to as
the “5 Big Moves” These closely coordinated initiatives create a framework for a
transformative vision for mobility in our region, and the FY 2021 budget reflects the region’s early
steps toward realizing that vision.
Complete Corridors focuses on improving how people travel by balancing the need for
dedicated space for cars, transit vehicles, shared mobility options, bike riders, pedestrians,
commercial vehicles, and other fleets of vehicles that promote individual mobility (Flexible Fleets),
including small transit shuttles and rideshare services such as Uber and Lyft. The anticipated benefits
of developing Complete Corridors include increased roadway capacity, reduced congestion and air
pollution, shorter travel times, increased transit ridership, improved safety, and the maximization
of existing infrastructure.
Transit Leap is an initiative to create a complete network of high-speed, high-capacity, and
frequent transit services that connect major residential areas with employment centers and local
attractions. New high-speed transit services, covering longer distances with limited stops, may be
separated from vehicle traffic with bridges, tunnels, or dedicated lanes. Service times will be
expanded, transit will be more personalized with a greater variety of vehicles and types of
service, and new and existing transit service will transition to electric power or alternative
fuels to decrease greenhouse gas emissions. Less congestion, faster transit travel times, reduced
air pollution, decreased demand for parking, and lower household transportation costs are among
the anticipated benefits.
Mobility Hubs are places of connectivity where different types of travel options—walking,
biking, transit, and shared mobility—come together. They are uniquely designed around the
needs of communities and better connect high-frequency transit to an individual’s origin or
destination. Mobility Hubs offer people safe walkways and bikeways; shared mobility options such
as transit, on-demand rideshare, and smaller vehicles such as scooters and bikes; support services
such as real-time travel information and charging stations for electric cars and bikes; and other
features. Higher transit ridership, less congestion, reduced air pollution, and increased mobility for
seniors and people with disabilities are among the anticipated benefits of Mobility Hubs.
Flexible Fleets will provide people with shared vehicles for all types of trips 24 hours a day and seven
days a week—all aimed at improving individual mobility. They will provide important connections
between highspeed transit and key destinations such as work and home, making it easier for people

x
to choose public transit and reduce the need to own a car. Anticipated benefits include better access
to transit, trip convenience, reduced air pollution, congestion relief, and increased mobility for seniors
and people who are physically disabled.
Next Operating System is the “brain” of the entire transportation system, and it will be the digital
platform through which technology and data can be used to connect and manage different modes
of transportation, including passenger vehicles, buses, ridesharing vehicles, delivery trucks, bikes,
scooters, and more. The result will be roadways and transit services that operate more smoothly and
serve people better. Next OS will make the other four big moves discussed above work in unison to
give people a seamless travel experience across all modes of transportation.
Del Mar Bluffs Stabilization
In the City of Del Mar, construction began in FY 2020 on the fourth phase of stabilization efforts
along the coastal bluffs. These improvements include the installation of support columns that
stabilize localized areas and sea walls, construction of a drainage channel on the top of the bluffs,
repair of concrete channels, and stabilization of storm chute outfalls and an existing headwall.
SANDAG and the North County Transit District (NCTD) are currently seeking $100 million to accelerate
two more phases of stabilization projects: Del Mar Bluffs Phase 5 and 6. Phase 5 is currently funded
through design and will address additional seismic and general stabilization needs, install additional
support columns, and replace more aging drainage structures. Phase 6 will continue to provide long-
term rehabilitation and stabilization work, including protecting the base of the bluffs against
additional bluff retreat and improved pedestrian access. Simultaneously, to ensure the long-term
viability of the corridor, SANDAG is also seeking $5 million to study potential long-term solutions,
which could include tunneling below Del Mar.
Navy Old Town Campus Revitalization/Central Mobility Hub
For decades, San Diego has explored ways to improve regional connectivity to San Diego International
Airport. With future traffic impacts to current San Diego International Airport roads projected to
exceed capacity, combined with insufficient transit access to the airport, SANDAG has made it a chief
priority to identify a solution for a direct transit connection to the airport. Revitalization of the Naval
Base Point Loma Old Town Campus, situated on the west side of I-5 about one mile north of the
airport, may solve this longstanding regional connectivity issue by providing a location for a new
central mobility hub. The Central Mobility Hub at the revitalized Naval Base Point Loma Old Town
Campus, if realized, would include a state-of-the-art transportation center with a direct connection
to the airport and additional connections to the Trolley, COASTER, Amtrak Pacific Surfliner, Rapid
transit, local bus, and future transportation options. It would offer San Diegans a one-transfer
connection to the airport from major destinations across the region for generations to come.
In FY 2021, discussions will continue on redevelopment of the Naval Base Point Loma Old Town
Campus for the benefit of the Navy and the San Diego region.
Otay Mesa East Port of Entry and State Route 11
The Otay Mesa East Port of Entry (POE) project, along with a new connecting future tolled road, SR
11, is jointly undertaken by SANDAG and Caltrans, in cooperation with key partner agencies on both
sides of the United States–Mexico border. Project milestones reached so far include the start of
construction in FY 2020 of the SR 125 southbound connectors to westbound SR 905 and SR 11, the
final segment of SR 11, and procurement of ROW for the new POE.

xi
FY 2021 work will continue these construction efforts and begin construction on the Siempre Viva
Road interchange improvements.
Regional Operations and Services
State Route 125 Operations: SANDAG will continue operations and maintenance of the SR 125 toll
road while controlling costs and meeting financial obligations. Focus in FY 2021 will include the
continuation of the implementation of a new tolling system to support centralized operations for the
I-15, SR 125, State Route 11/Otay Mesa East, and future priced facilities, completing the transition to
a Regional Back Office System and updating business processes to support the implementation of the
6C toll transponder technology.
Motorist Aid Services: SANDAG will continue implementing expanded Freeway Service Patrol
(FSP) service hours funded by California Senate Bill 1 (SB 1) (Beall, 2017); increasing active real-time
fleet management using the fleet management system; and continuing to provide cost-effective
roadside assistance service for the San Diego region in FY 2021.
Capital Program
Mid-Coast Corridor Transit Project: In FY 2020, SANDAG completed major work on bridges, abutments and piers, utility undergrounding, and columns in addition to forming the full length of the elevated Trolley viaduct by installing 192 pre-cast concrete girders and conducting cast-in-place concrete pours. Work also began on construction of the Trolley stations, including initial systems work, and the Trolley underpass. In addition, crews have almost completed realigning the rail corridor, double-tracking the heavy rail, and have begun to install the Trolley light-rail lines. SANDAG will continue work on the viaducts in the northern section of the project and grading, drainage, retaining walls, and bridges in the southern section. Trackwork, station construction, and systems elements will also continue along the length of the alignment. San Diego River Bridge Double Track Project: Construction was completed at Poinsettia Station in FY 2020, which included lengthening the station platforms, installing an intertrack fence, replacing the existing at-grade rail crossings with a grade-separated undercrossing, and relocating the existing tracks. The project was designed to improve traveler wait times, provide easier access, reduce train delays, enhance pedestrian safety, and upgrade station amenities. Interstate 5 North Coast Corridor Program/Build NCC: In FY 2020 and 2021, Build NCC will be focused on the continued construction of the San Elijo Lagoon Highway Bridge and the Express Lanes on I-5 between Manchester Avenue and Palomar Airport Road. The next segment of I-5 Express Lanes construction between Palomar Airport Road and SR 78 is expected to commence in fall 2020. The San Elijo Lagoon Restoration project is expected to be completed in mid-2020. Interstate 805/State Route 15 Exchange: Design of two high-occupancy vehicle (HOV) lanes and direct connectors between I-805 and SR 15 for northbound-to-northbound and southbound-to-southbound HOV/Rapid traffic is complete.
A TransNet Program Budget Amendment was approved by the Board of Directors in September 2019
and provided a summary of TransNet, federal, state, and other local formula funds estimated to
become available for Major Corridor projects and is reflected in the FY 2021 Budget adopted by the
Board of Directors on June 12, 2020. Significant long-term challenges exist, including a funding
shortfall to complete all remaining TransNet projects. The 2020 Plan of Finance update is in process.

xii
Sales tax impacts of COVID 19, paired with changes in California Department of Tax and F ee
Administration methodologies for sales tax distributions have resulted in the need to pause revenue
forecast updates while impacts are assessed. The opportunity to complete some projects remains,
though state and federal funding programs are reimbursed programs and rely initially on local funds
prior to seeking reimbursement. The ability to advance major projects is through the issuance of
bonds against the sales tax receipts.
Acknowledgments
The Government Finance Officers Association (GFOA) of the United States and Canada awarded a
Certificate of Achievement for Excellence in Financial Reporting to SANDAG for its comprehensive
annual financial report for the fiscal year ended June 30, 2020. This was the twelfth consecutive year
that SANDAG has received this prestigious award. In order to be awarded a Certificate of
Achievement, a government must publish an easily readable and efficiently organized comprehensive
annual financial report. This report must satisfy both generally accepted accounting principles and
applicable legal requirements.
A Certificate of Achievement is valid for a period of one year only. We believe that our current
comprehensive annual financial report continues to meet the Certificate of Achievement Program’s
requirements, and we are submitting it to the GFOA to determine its eligibility for another certificate.
The preparation of this report was accomplished by SANDAG management and financial staff.
SANDAG independent auditors, Crowe LLP performed the audit of the financial statements. We
express our appreciation to the staff members and Crowe LLP who contributed to the issuance of this
report.
Respectfully submitted,
ANDRÉ DOUZDJIAN RAY MAJOR
Chief Financial Officer Chief Analytics Officer/Chief Economist

-sANDAG Board of Directors
The 18 cities and county government are SANDAG serving as the forum for regional decision-making. SANDAG builds consensus; plans, engineers, and builds public transit; makes strategic plans; obtains and allocates resources; and provides information on a broad range of topics pertinent to the region's quality of life.
Chair Vice Chair
Hon. Steve Vaus Hon. Catherine Blakespear
Executive Director
Hasan lkhrata
City of Carlsbad Hon. Cori Schumacher, Councilmember (A) Hon. Keith Blackburn, Mayor Pro Tem(A) Hon. Priya Bhat-Patel, Councilmember
City of Chula Vista Hon. Mary Salas, Mayor(A) Hon. Steve Padilla, Councilmember(A) Hon. John Mccann, Councilmember
City of Coronado Hon. Richard Bailey, Mayor(A) Hon. Bill Sandke, Councilmember(A) Hon. Mike Donovan, Councilmember
City of Del Mar Hon. Ellie Haviland, Deputy Mayor(A) Hon. Dwight Worden, Councilmember(A) Hon. Dave Druker, Councilmember
City of El Cajon Hon. Bill Wells, Mayor(A) Hon. Steve Goble, Deputy Mayor
City of Encinitas Hon. Catherine Blakespear, Mayor(A) Hon. Kellie Hinze, Councilmember(A) Hon. Joe Mosca, Councilmember
City of Escondido Hon. Paul McNamara, Mayor(A) Hon. Olga Diaz, Councilmember(A) Hon. Mike Morasco, Councilmember
City of Imperial Beach Hon. Serge Dedina, Mayor(A) Hon. Mark West, Councilmember(A) Hon. Paloma Aguirre, Councilmember
City of La Mesa Hon. Bill Baber Councilmember(A) Hon. Kristine Alessio, Councilmember(A) Hon. Akilah Weber, Councilmember
City of Lemon Grove Hon. Racquel Vasquez, Mayor(A) Hon. Jennifer Mendoza, Councilmember(A) Hon. Jerry Jones, Councilmember
City of National City Hon. Alejandra Sotelo-Solis, Mayor(A) Hon. Mona Rios, Councilmember(A) Vacant
City of Oceanside Hon. Jack Feller, Deputy Mayor(A) Hon. Christopher Rodriguez, Councilmember(A) Hon. Ryan Keim, Councilmember
City of Poway Hon. Steve Vaus, Mayor(A) Hon. John Mullin, Councilmember(A) Hon. Caylin Frank, Councilmember
City of San Diego Hon. Kevin Faulconer, Mayor(A) Hon. Mark Kersey, Councilmember(A) Hon. VIvian Moreno, CouncilmemberHon. Georgette Gomez, Council President(A) Hon. Barbara Bry, Council President Pro Tern(A) Hon. Monica Montgomery, Councilmember
City of San Marcos Hon. Rebecca Jones, Mayor(A) Hon. Sharon Jenkins, Mayor Pro Tern(A) Hon. Maria Nunez, Councilmember
City of Santee Hon. John Minto, Mayor (A) Hon. Ronn Hall, Councilmember(A) Hon. Rob McNelis, Councilmember
City of Solana Beach Hon. David A. Zito, Councilmember(A) Hon. Jewel Edson, Mayor(A) Hon. Kristi Becker, Councilmember
City of Vista Hon. Judy Ritter, Mayor(A) Hon. Joe Green, Councilmember(A) Hon. Amanda Rigby Deputy Mayor
County of San Diego Hon. Jim Desmond, Vice Chair(A) Hon. Dianne Jacob, SupervisorHon. Kristin Gaspar, Supervisor(A) Hon. Greg Cox, Chair(A) Hon. Nathan Fletcher, Supervisor
Advisory Members Imperial County Hon. Jesus Eduardo Escobar, Supervisor (A) Mark Baza, Imperial County TransportationCommission
California Department of Transportation Toks Omishakin, Executive Director (A) Gustavo Dallarda, Acting District 11 Director(A) Ann Fox, Deputy Director
Metropolitan Transit System Hon. Paloma Aguirre(A) Hon. Bill Sandke
North County Transit District Hon. Tony Kranz(A) Hon. Priya Bhat-Patel(A) Hon. Jewel Edson
U.S. Department of Defense Joe Stuyvesant, Navy Region Southwest Executive Director(A) Steve Chung, Navy Region Southwest
Port of San Diego Hon. Garry Bonelli, Commissioner(A) Hon. Dan Malcolm, Commissioner
San Diego County Water Authority Mel Katz Director(A) Gary Croucher, Vice Chair(A) Vacant
San Diego County Regional Airport Authority April Boling, Chair(A) Paul Robinson
Southern California Tribal Chairmen's Association Hon. Cody Martinez, Chairman,Sycuan Band of the Kumeyaay NationHon. Edwin "Thorpe" Romero, Chairman, Barona Band of Mission Indians
Mexico Hon. Carlos Gonzalez Gutierrez Consul General of Mexico (A) Mario FigueroaDeputy Consul General of Mexico(A) Hon. Natalia Figueroa, Vice Consul
Revised June 25, 2020 xiii

SAN DIEGO ASSOCIATION OF GOVERNMENTS
Executive Staff
June 30, 2020
Executive Director Hasan Ikhrata
Chielf Capital Programs and Regional Services Officer Jim Linthicum
Chief Planning and Innovation Officer Ray Traynor
Chief Operations Officer Laura Coté
Chief Data Analytics Officer/Chief Economist Ray Major
Chief Financial Officer André Douzdjian
General Counsel John Kirk
ARJIS, Director I Craig Carter
Business Information & Technology Services, Director II James Dreisbach-Towle
Contracts and Grants, Director II Julie Wiley
Diversity and Equity, Director I Elaine Richardson
Engineering and Construction, Director II John Haggerty
Government Relations, Director II Victoria Stackwick
Integrated Transportation Planning, Director I Elisa Arias
Mid-Coast Transit Project, Director I Ramon Ruelas
Mobility and Innovation, Director I Antoinette Meier
Organization Effectiveness, Director II Melissa Coffelt
Regional Planning, Director II Coleen Clementson
Research and Program Management, Director II Cindy Burke
Strategic Communications, Director II Irene McCormack
Strategic Projects, Director I Ryan Kohut
TransNet, Director II José Nuncio
xiv

SANDAG Board of Directors
Audit Committee
Borders Committee
Executive Committee
Public Safety Committee
Regional Planning Committee
Transportation Committee
Office of the Independent Performance Auditor
Executive Office
Planning and Innovation
Capital Programs & Regional Services
Business Operations & Advisory Services
Office of General Counsel
Finance Services
Data Science and Analytics
Government Relations
xv

Government Finance Officers Association
Certificate of Achievementfor Excellence
in Financial Reporting
Presented to
San Diego Association of GovernmentsCalifornia
For its Comprehensive AnnualFinancial Report
For the Fiscal Year Ended
June 30, 2019
Executive Director/CEO
xvi

FINANCIAL SECTION

This page intentionally left blank.
2
Crowe LLP
Independent Member Crowe Global
(Continued)
3
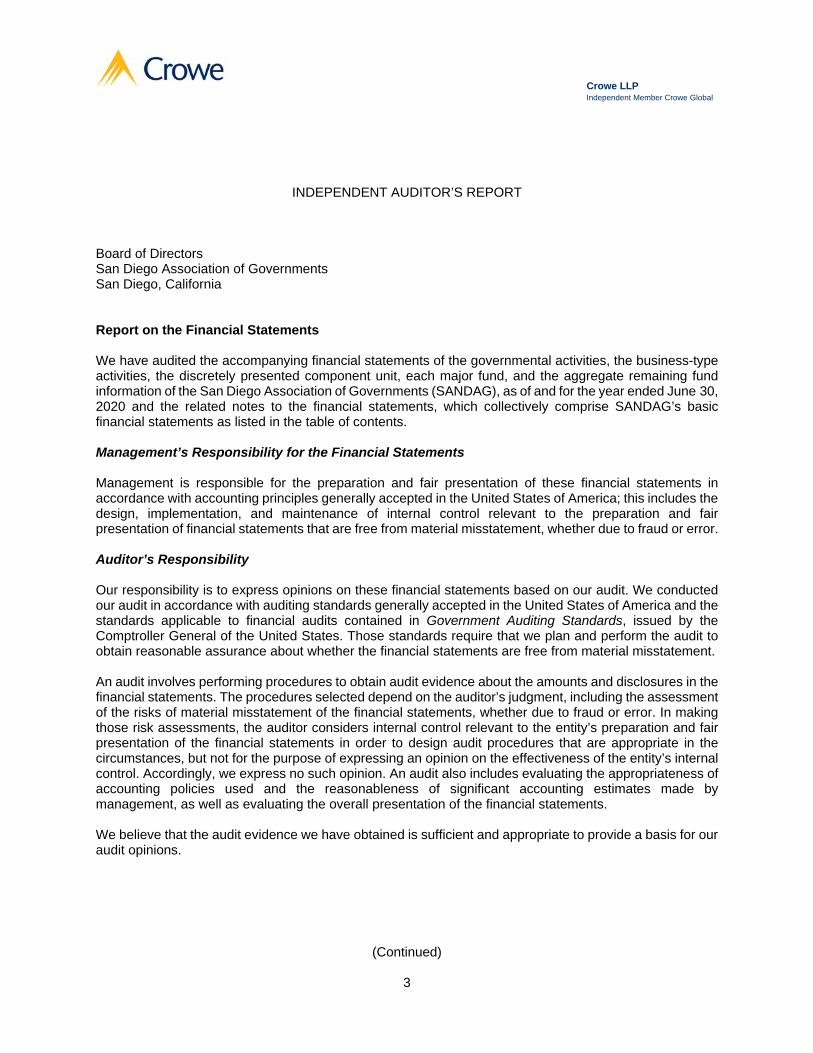
INDEPENDENT AUDITOR’S REPORT Board of Directors San Diego Association of Governments San Diego, California Report on the Financial Statements We have audited the accompanying financial statements of the governmental activities, the business-type activities, the discretely presented component unit, each major fund, and the aggregate remaining fund information of the San Diego Association of Governments (SANDAG), as of and for the year ended June 30, 2020 and the related notes to the financial statements, which collectively comprise SANDAG’s basic financial statements as listed in the table of contents. Management’s Responsibility for the Financial Statements Management is responsible for the preparation and fair presentation of these financial statements in accordance with accounting principles generally accepted in the United States of America; this includes the design, implementation, and maintenance of internal control relevant to the preparation and fair presentation of financial statements that are free from material misstatement, whether due to fraud or error. Auditor’s Responsibility Our responsibility is to express opinions on these financial statements based on our audit. We conducted our audit in accordance with auditing standards generally accepted in the United States of America and the standards applicable to financial audits contained in Government Auditing Standards, issued by the Comptroller General of the United States. Those standards require that we plan and perform the audit to obtain reasonable assurance about whether the financial statements are free from material misstatement. An audit involves performing procedures to obtain audit evidence about the amounts and disclosures in the financial statements. The procedures selected depend on the auditor’s judgment, including the assessment of the risks of material misstatement of the financial statements, whether due to fraud or error. In making those risk assessments, the auditor considers internal control relevant to the entity’s preparation and fair presentation of the financial statements in order to design audit procedures that are appropriate in the circumstances, but not for the purpose of expressing an opinion on the effectiveness of the entity’s internal control. Accordingly, we express no such opinion. An audit also includes evaluating the appropriateness of accounting policies used and the reasonableness of significant accounting estimates made by management, as well as evaluating the overall presentation of the financial statements. We believe that the audit evidence we have obtained is sufficient and appropriate to provide a basis for our audit opinions.

4
Opinions In our opinion, the financial statements referred to above present fairly, in all material respects, the respective financial position of the governmental activities, the business-type activities, the discretely presented component unit, each major fund, and the aggregate remaining fund information of SANDAG, as of June 30, 2020, and the respective changes in financial position and, where applicable, cash flows thereof for the year then ended in accordance with accounting principles generally accepted in the United States of America. Other Matters Required Supplementary Information Accounting principles generally accepted in the United States of America require that the management’s discussion and analysis, schedule of changes in net OPEB liability and related ratios, schedule of OPEB contributions, schedule of changes in net pension liability and related ratios, schedule of plan contributions, and budgetary comparison information for the general fund and San Diego County Regional Transportation Commission sales tax projects fund, as listed in the table of contents, be presented to supplement the basic financial statements. Such information, although not a part of the basic financial statements, is required by Governmental Accounting Standards Board who considers it to be an essential part of financial reporting for placing the basic financial statements in an appropriate operational, economic, or historical context. We have applied certain limited procedures to the required supplementary information in accordance with auditing standards generally accepted in the United States of America, which consisted of inquiries of management about the methods of preparing the information and comparing the information for consistency with management’s responses to our inquiries, the basic financial statements, and other knowledge we obtained during our audit of the basic financial statements. We do not express an opinion or provide any assurance on the information because the limited procedures do not provide us with sufficient evidence to express an opinion or provide any assurance. Supplementary Information Our audit was conducted for the purpose of forming opinions on the financial statements that collectively comprise SANDAG’s basic financial statements. The introductory section, combining and individual fund statements and schedules, budgetary comparison information for the capital projects fund, San Diego County Regional Transportation Commission debt service fund, San Diego Association of Governments debt service fund, general services fund, and SAFE program fund, and statistical section, as listed in the table of contents, are presented for purposes of additional analysis and are not a required part of the basic financial statements. The combining and individual fund statements and schedules and budgetary comparison information for the capital projects fund, San Diego County Regional Transportation Commission debt service fund, San Diego Association of Governments debt service fund, general services fund, and SAFE program fund are the responsibility of management and were derived from and relates directly to the underlying accounting and other records used to prepare the basic financial statements. Such information has been subjected to the auditing procedures applied in the audit of the basic financial statements and certain additional procedures, including comparing and reconciling such information directly to the underlying accounting and other records used to prepare the basic financial statements or to the basic financial statements themselves, and other additional procedures in accordance with auditing standards generally accepted in the United States of America. In our opinion, the combining and individual fund statements and schedules and budgetary comparison information for the capital projects fund, San Diego County Regional Transportation Commission debt service fund, San Diego Association of Governments debt service fund, general services fund, and SAFE program fund are fairly stated, in all material respects, in relation to the basic financial statements as a whole. The introductory section and statistical section have not been subjected to the auditing procedures applied in the audit of the basic financial statements, and accordingly, we do not express an opinion or provide any assurance on them.

5
Other Reporting Required by Government Auditing Standards In accordance with Government Auditing Standards, we have also issued our report dated December 23, 2020 on our consideration of SANDAG’s internal control over financial reporting and on our tests of its compliance with certain provisions of laws, regulations, contracts, and grant agreements and other matters. The purpose of that report is to describe the scope of our testing of internal control over financial reporting and compliance and the results of that testing, and not to provide an opinion on the effectiveness of SANDAG’s internal control over financial reporting or on compliance. That report is an integral part of an audit performed in accordance with Government Auditing Standards in considering SANDAG’s internal control over financial reporting and compliance. Crowe LLP Costa Mesa, California December 23, 2020

This page intentionally left blank.
6

Management’s Discussion and Analysis
As management of the San Diego Association of Governments (SANDAG), we provide this narrative overview and analysis of the financial activities of SANDAG for the fiscal year ended June 30, 2020. The intent of this analysis is to assist the readers of SANDAG financial statements in better understanding the overall financial condition of the agency. The information presented here should be considered in conjunction with the information provided in the Letter of Transmittal.
Financial Highlights
SANDAG reported net position of $280,270,865. Of this amount, net position (deficit) of ($830,132,071) is considered unrestricted. A significant factor related to the net position balance is the issuance of $2,563,025,000 in bonds issued in 2008, 2010, 2012, 2014, 2016, 2019 and 2020 and the issuance of $537,480,000 Series A Subordinate Sales Tax Revenue Short-Term Notes (2018 short-term notes) in 2018, as well as the issuance of the Capital Grant Receipts Revenue Bonds (Mid-Coast Corridor Transit Project) Series 2019A & 2019B (GANS) of $335,000,000 in 2019 for a total of $3,435,505,000 to expedite congestion relief projects focusing on jump-starting construction of the region’s top priority transportation infrastructure projects.
SANDAG total net position decreased by $81,249,683 in fiscal year 2020. This decrease is primarily due to an increase in SANDAG capital project expenses and lower grant revenue offset by an increase in capital assets.
As of the close of the current fiscal year, SANDAG governmental funds reported combined ending fund balances of $743,100,031. Of this total amount, $740,307,815 is restricted for pension benefits, debt service, and project spending, $4,269,977 as nonspendable prepaid items, $5,302,000 committed to contingency reserve, and $6,779,761 as an unassigned fund deficit.
SANDAG total debt balance at the close of the current fiscal year increased by $415,445,799 compared to the prior year. This is primarily due to the issuance of 2019 and 2020 bonds, GANS and commercial paper of $881,818,000 offset by bond principal repayments of $441,110,000 and the $1,857,000 principal repayment of commercial paper as well as bond premium amortization of $80,407,204. At the end of the current fiscal year, the San Diego County Regional Transportation Commission (Commission), a blended component unit of SANDAG, had a total debt outstanding of $2,486,643,967. State Route 125 toll road fund (SR 125 fund) had a total debt outstanding of $218,376,331.
Overview of the Financial Statements
The SANDAG annual financial report consists of five parts: (1) management’s discussion and analysis; (2) basic financial statements; (3) required supplementary information; (4) an optional section that presents combining statements and additional supplementary information; and (5) a statistical section, which furnishes relevant statistical data of the agency.
Management’s discussion and analysis provided here is intended to serve as an introduction to SANDAG basic financial statements. SANDAG basic financial statements consist of three components: (1) government-wide financial statements; (2) fund financial statements; and (3) the notes to the financial statements.
Government-wide financial statements. The government-wide financial statements are designed to provide readers with a broad overview of SANDAG finances, in a manner similar to a private sector business.
7

The Statement of Net Position presents financial information on all SANDAG assets and liabilities, and deferred inflows/outflows of resources, with the difference reported as net position. Over time, increases or decreases in net position may serve as a useful indicator of whether the financial position of SANDAG is improving or deteriorating.
The Statement of Activities presents information showing changes in the SANDAG net position during the most recent fiscal year. All changes in net position are reported when the underlying events giving rise to the change occurs, regardless of the timing of related cash flows. Thus, revenues and expenses are reported for some items that will only result in cash flows in future fiscal periods.
Both of the government-wide financial statements distinguish functions of SANDAG that are principally supported by sales taxes and intergovernmental revenues (governmental activities) from other functions that are intended to recover all or a significant portion of their costs through user fees and charges (business-type activities). The governmental activities of SANDAG include general government, net of cost recovery, modeling and research, criminal justice, sustainable development, sustainable mobility programs and services, internal and external coordination, Service Authority for Freeway Emergency Operations (SAFE) program, bicycle facilities, Independent Taxpayer Oversight Committee (ITOC), major corridor capital projects, major corridor environmental mitigation, local project environmental mitigation, local street improvements, smart growth, new major corridor transit operations, transit system improvements, transit capital contributions, and interest on long-term debt.
The business-type activities of SANDAG include the Service Bureau, which provides informational and technical services to member agencies, nonmember government agencies, private organizations, and individuals to enhance the quality and extent of demographic, economic, transportation, land use, criminal justice, and other information maintained in the Regional Information System; SourcePoint, which is a 501(c)(3) nonprofit public benefit corporation chartered in 1982 by SANDAG to provide data research for the San Diego region, solve regional planning issues and assist local governments with special projects; the Property Management Fund, which provides property management functions for the commercial buildings purchased by the agency; the Interstate 15 (I-15) FasTrak® program, which allows solo drivers to pay a toll to use the express lanes on I-15; and the State Route 125 (SR 125) toll road operations, an 11.2-mile, limited-access highway in the County of San Diego.
The government-wide financial statements include not only SANDAG itself (known as the primary government), but a legally separate Joint Powers Agency, Automated Regional Justice Information System (ARJIS), which provides a regional complex criminal justice enterprise information system utilized by more than 50 local, state, and federal agencies in the San Diego region. Financial information for this component unit is reported separately from the financial information presented for the primary government itself. The Commission, although legally separate, functions for all practical purposes as a program of SANDAG and, therefore, has been reported as a blended component unit and included as an integral part of the primary government. SourcePoint, a legally separate nonprofit corporation, which provides regional information services and technical assistance to private clients and public agencies, is under the common control of the primary government, therefore also reported as a blended component unit and included as one of the enterprise funds of the primary government.
The government-wide financial statements can be found on pages 25 to 27 of this report.
Fund financial statements. A fund is a grouping of related accounts that is used to maintain control over resources that have been segregated for specific activities or objectives. SANDAG, like other state and
8

local governments, uses fund accounting to ensure and demonstrate compliance with finance-related legal requirements. All of the funds of SANDAG are either governmental-type funds or proprietary funds.
Governmental funds. Governmental funds are used to account for essentially the same functions reported as governmental activities in the government-wide financial statements. However, unlike the government-wide financial statements, governmental fund financial statements focus on near-term inflows and outflows of spendable resources, as well as balances of spendable resources available at the end of the fiscal year. Such information may be useful in assessing a government’s near-term financing requirements.
Because the focus of governmental funds is narrower than that of the government-wide financial statements, it is useful to compare the information presented for governmental funds with similar information presented for governmental activities in the government-wide financial statements. By doing so, readers may better understand the long-term impact of the government’s near-term financing decisions. Both the governmental fund balance sheet and the governmental fund statement of revenues, expenditures, and changes in fund balances provide a reconciliation to facilitate this comparison between governmental funds and governmental activities.
SANDAG maintains seven individual governmental funds. Information is presented separately in the governmental fund balance sheet and in the governmental fund statement of revenues, expenditures, and changes in fund balances for the general fund, Commission sales tax projects fund, capital projects fund, Commission debt service fund, and SANDAG debt service fund established in FY 20 to account for the grant anticipation notes, which are considered to be major funds. Data from the two nonmajor funds which are: (1) the general services fund; and (2) the SAFE program fund, are combined into a single aggregated presentation. Individual fund data for each of these nonmajor governmental funds are provided in the form of combining statements in the combining and individual fund statements and schedules section of this report.
Proprietary funds. SANDAG maintains five proprietary funds. Proprietary funds can either be enterprise funds or internal service funds. Enterprise funds are used to report the same functions presented as business-type activities in the government-wide financial statements. SANDAG uses enterprise funds to account for its I-15 FasTrak program, Service Bureau program, SourcePoint, property management of the commercial buildings, and the SR 125 toll road operations.
Proprietary funds provide the same type of information as the government-wide financial statements, only in more detail. The proprietary fund financial statements provide separate information for the SR 125 fund, which is considered to be a major fund. Data from the other four nonmajor proprietary funds are combined into a single aggregated presentation. Individual fund data for each of these nonmajor proprietary funds are provided in the form of combining statements in the combining and individual fund statements and schedules of this report.
The basic proprietary fund financial statements can be found on pages 43 to 45 of this report.
Notes to the basic financial statements. The notes provide additional information that is necessary to acquire a full understanding of the data provided in the government-wide and fund financial statements. The notes to the financial statements can be found on pages 49 to 111 of this report.
Other information. In addition to the basic financial statements, required supplementary information can be found on pages 116 to 124 of this report.
9

The combining statements referred to earlier in connection with nonmajor governmental funds and proprietary funds are presented immediately following the required supplementary information on pensions and other post-employment benefits. Combining and individual fund statements and schedules can be found on pages 128 to 137 of this report.
San Diego Association of Governments’ Net Position
2020 2019 2020 2019 2020 2019
Interfund balances (771,549)$ 2,800,552$ 771,549$ (2,800,552)$ -$ -$
Capital assets 2,118,463,850 1,840,552,061 320,995,919 333,416,086 2,439,459,769 2,173,968,147
Other assets 1,027,148,412 945,849,969 152,041,635 157,374,632 1,179,190,047 1,103,224,601
Total assets 3,144,840,713 2,789,202,582 473,809,103 487,990,166 3,618,649,816 3,277,192,748
Deferred outflows of resources 144,439,142 106,381,630 3,327,564 2,646,685 147,766,706 109,028,315
Current liabilities 278,351,040 249,055,831 10,766,108 14,819,133 289,117,148 263,874,964
Restricted liabilities 87,197,653 79,559,205 - - 87,197,653 79,559,205
Noncurrent liabilities 2,870,629,960 2,445,638,333 226,311,217 231,973,876 3,096,941,177 2,677,612,209
Total liabilities 3,236,178,653 2,774,253,369 237,077,325 246,793,009 3,473,255,978 3,021,046,378
Deferred inflows of resources 12,570,787 3,299,493 318,891 354,644 12,889,678 3,654,137
Net Position:
Net investment in capital assets 803,549,001 601,533,597 102,412,780 105,093,201 905,961,781 706,626,798
Restricted for:
Mid-Coast project 34,085,951 - - - 34,085,951 -
Debt service 63,669,996 47,604,345 18,476,695 18,285,521 82,146,691 65,889,866
Environmental mitigation 1,177,237 1,159,810 - - 1,177,237 1,159,810
Freeway emergency service 8,683,786 8,582,301 - - 8,683,786 8,582,301
Major maintenance post-acquisition - - 47,197,962 47,037,264 47,197,962 47,037,264
Project revenue - - 34,285,520 32,062,084 34,285,520 32,062,084
Toll road operations - - 35,410,702 39,888,725 35,410,702 39,888,725
Customer prepaid - - 69,404 137,148 69,404 137,148
iCommute program - - 9,071 12,636 9,071 12,636
Property management - - 1,374,831 549,181 1,374,831 549,181
Unrestricted (deficit) (870,635,557) (540,848,703) 503,486 423,438 (870,132,071) (540,425,265)
Total net position 40,530,414$ 118,031,350$ 239,740,451$ 243,489,198$ 280,270,865$ 361,520,548$
Governmental activities Business-type activities Total
Government-Wide Overall Financial Analysis
As noted earlier, net position may serve over time as a useful indicator of a government’s financial position. In the case of SANDAG, assets and deferred outflows of resources exceeded liabilities and deferred inflows of resources by $280,270,865 at the close of the most recent fiscal year.
In fiscal year 2020, $2,072,299,466 was the balance of construction in progress for the governmental activities, which includes the accumulative costs of various regional transportation infrastructure improvement projects. SANDAG retains legal title of the assets during the construction phase and until such time as these projects are complete and operational. Upon completion, the assets, as well as the legal title of the assets, if applicable, are formally transferred and contributed to other governmental agencies to reflect the other governments’ custodial accountability for the operation and maintenance of the assets.
The majority of the SANDAG net position includes $905,961,781 net investment in capital assets for both governmental and business-type activities. These capital assets are used to provide services to citizens by
10

SANDAG; therefore, it is not available for future spending. A total of $244,441,155 is restricted for Mid-Coast project, debt service, environmental mitigation projects, major maintenance, project revenue, toll road operations, customer prepaid, freeway emergency service, iCommute and property management. The remaining offsetting balance of net position is the unrestricted net deficit of $870,132,071.
Factors contributing to the unrestricted net deficit of $870,132,071 include debt activities of the Commission and SR 125 fund, and the SANDAG net pension liability.
In fiscal year 2020, SR125 fund had a long-term debt of $186,755,000 with a premium of $31,621,331, which is offset by $104,671,161 restricted cash and cash equivalents set aside for debt service, major maintenance and capital expenditures for the SR 125 fund.
The Commission’s outstanding debt of $2,486,643,967 is included in the statement of net position. The debt is issued to advance fund various TransNet projects in the region as part of the Early Action Plan (EAP) and is repaid using annual sales tax revenue. Funds are set aside each month to cover monthly 2008 bond interest and swap payments, one-sixth of upcoming interest payments on all other bonds, and one-twelfth of upcoming principal payments.
Offsetting the outstanding Commission debt balance are $73,958,925 of related balances of cash and investments used for future debt service payments and the reserve account for the 2008 sales tax bond; due from other governments for debt proceeds passed through to another government, net of principal retirement for a balance of $79,670,022; and $572,684,195 of cash and investments related to TransNet balances not yet requested by recipient agencies.
The liabilities from restricted assets consist primarily of the following purposes:
$8,096,861 will be used to repay outstanding Commission bonds.
$23,050,000 will be used to repay a portion of the outstanding commercial paper notes issued to buy the North County Transit District (NCTD) Certificates of Participation (COPs) investment.
$236,971 is a restricted deposit payable from NCTD for commercial paper interest payments related to the COPs.
$15,514 is a restricted deposit payable from Barclays Bank PLC, which is held as collateral on the 2018 basis rate swaps.
$55,798,307 is being held for retention on regional transportation improvement projects and will be paid once the projects are complete.
Restricted net position includes resources subject to externally imposed restrictions that must be used for debt repayments and environmental mitigation projects. At the end of fiscal year 2020, the SANDAG net pension liability balance is $55,664,357, which includes $3,395,526 of net pension liability of ARJIS, a discretely presented component unit of SANDAG.
Additional information on SANDAG long-term debt can be found in Note II.G, and additional information on SANDAG capital assets can be found in Note II.C in the notes to the basic financial statements of this report.
11

San Diego Association of Governments’ Change in Net Position
2020 2019 2020 2019 2020 2019Revenues:
Program Revenues:Charges for services 4,268,144$ 4,019,387$ 49,791,032$ 56,551,583$ 54,059,176$ 60,570,970$ Operating grants and contributions 40,211,436 39,970,028 - - 40,211,436 39,970,028 Capital grants and contributions 46,465,874 331,973,062 - - 46,465,874 331,973,062
General Revenues:Local TransNet sales tax funds 313,251,738 303,529,448 - - 313,251,738 303,529,448 Local Transportation Development Act funds 10,140,628 11,472,988 - - 10,140,628 11,472,988 Investment earnings 12,735,312 18,552,398 2,115,859 2,658,443 14,851,171 21,210,841 Other revenues 2,525,662 532,730 825,650 513,617 3,351,312 1,046,347
Total revenues 429,598,793 710,050,041 52,732,541 59,723,643 482,331,334 769,773,684 Expenses:
General government, net of cost recovery 1,811,023 286,736 - - 1,811,023 286,736 Modeling and research 9,983,140 6,724,948 - - 9,983,140 6,724,948
Criminal justice 1,103,957 1,101,009 - - 1,103,957 1,101,009 Sustainable development 16,337,124 9,449,673 - - 16,337,124 9,449,673 Sustainable mobility programs and services 21,612,236 22,305,301 - - 21,612,236 22,305,301 Internal and external coordination 7,123,096 7,223,524 - - 7,123,096 7,223,524 SAFE program 1,520,134 1,589,922 - - 1,520,134 1,589,922 Bicycle facilities 365,593 894,799 - - 365,593 894,799 Independent Taxpayer Oversight Committee 376,416 368,376 - - 376,416 368,376 Major corridor capital projects 157,915 - - - 157,915 - Major corridor environmental mitigation 15,124 7,979 - - 15,124 7,979 Local project environmental mitigation 10,381 10,002 - - 10,381 10,002 Local street improvements 79,726,182 76,138,673 - - 79,726,182 76,138,673 Smart growth 8,809,836 2,698,814 - - 8,809,836 2,698,814 New major corridor transit operations 19,797,658 16,255,635 - - 19,797,658 16,255,635 Transit system improvement 51,033,075 49,741,390 - - 51,033,075 49,741,390 Transit capital contributions 214,437,991 186,145,897 - - 214,437,991 186,145,897 Interest on long-term debt 86,709,311 87,163,728 6,934,037 7,094,248 93,643,348 94,257,976 Service Bureau - - 310,243 287,561 310,243 287,561 SourcePoint - - 11,510 12,998 11,510 12,998 Interstate 15 FasTrak - - 8,858,083 7,871,335 8,858,083 7,871,335 State Route 125 toll road - - 26,536,953 26,741,801 26,536,953 26,741,801
Total expenses 520,930,191 468,106,406 42,650,826 42,007,943 563,581,017 510,114,349
Change in net position before transfers (91,331,398) 241,943,635 10,081,715 17,715,700 (81,249,683) 259,659,335
Transfers in (out) 13,830,462 431,281 (13,830,462) (431,281) - - Change in net position (77,500,936) 242,374,916 (3,748,747) 17,284,419 (81,249,683) 259,659,335
Net position, beginning of year 118,031,350 (124,343,566) 243,489,198 226,204,779 361,520,548 101,861,213
Net position, end of year 40,530,414$ 118,031,350$ 239,740,451$ 243,489,198$ 280,270,865$ 361,520,548$
Governmental activities Business-type activities Total
Governmental activities. Governmental activities decreased the SANDAG net position by $77,500,936, which is due to total expenses of $520,930,191 exceeding total revenue of $429,598,793 by $91,331,398 offset by a transfer in of $13,830,462.
Key elements of the revenue and expense differences between fiscal years 2020 and 2019 for governmental activities are as follows:
Total revenues decreased by $287,243,863, or 40.45 percent, over the prior year. Key factors for this net decrease are as follows:
The decrease in capital grant and contributions of $285,507,188, or 86.0 percent, is primarily the result of the $280 million federal grants for the Mid-Coast Trolley project received in FY 2019, but such funding was not received in the current year due to the timing of the execution of the grant agreement.
Local Transportation Development Act (TDA) Program revenue decreased $1.3 million in fiscal year 2020. The decrease of TDA revenue in fiscal year 2020 was due to the CRT San Diego to Rose Creek project funding with TDA revenue in FY2019, none of which occurred in FY 2020.
12

Investment earnings decreased by $5,817,086. The decrease is primarily attributable to the derivative instrument interest adjustment on the rate swaps and offset by the earnings on the unused debt proceeds.
The above decreases were offset by the increase in Sales tax revenue by $9,722,290, which is driven primarily by an increase in taxable consumption in the region resulting from the continued improvement of local economy and growth in consumer spending for the first three quarters of the fiscal year. In December 2019, a novel strain of coronavirus (COVID 19) has spread around the world resulting in business and social disruption. The coronavirus was declared a Public Health Emergency of International Concern by the World Health Organization on January 30, 2020. During the fourth quarter of the fiscal year, sales tax revenue collection was stalled as COVID 19 related recession wiped away the strong revenue registered before the pandemic hit the region.
Total expenses increased by $52,823,785, or 11.3 percent, over the prior year. Key factors in this net decrease are as follows:
Transit capital contributions increased $28,292,094 or 15.2 percent. This increase is due to the higher amount of capital project completion for contributions this fiscal year. During the year, $209,682,337 of completed construction-in-progress (CIP) projects, as well as title to the assets, if applicable, was transferred to other government agencies responsible for public transportation operations compared to $188,511,440 of CIP projects completed and transferred out in the prior fiscal year. Of completed projects, $118,697,988 was transferred to Metropolitan Transit System, $80,969,894 to NCTD, $5,676,466 to Caltrans, $126,223 to the City of San Diego, $52,685 to the City of Encinitas, $695,500 to the County of San Diego, $1,095,384 to the San Diego Foundation and $2,018,547 to SANDAG to reflect the government’s assumption of ownership and accountability for the ongoing operations and maintenance of the assets. These contributions represent a reduction in capital assets and are not restricted to specific programs per the government-wide statement of activities.
TransNet program expenses increased $14,018,594, which is primarily due to Local Street Improvement project expense increase of $3,587,509, Smart Growth program cost increase of $6,111,022, New Major Corridor Transit Operations cost increase of $3,542,023 as well as Transit System Improvements cost increase of $1,291,685. These expenses were based on recipient requests of TransNet funds for eligible costs, which were higher in fiscal year 2020 in relation to fiscal year 2019 as a result of a three-year cycle of call for projects started in fiscal year 2019 and those expenses increased as grantees requested reimbursements on their TransNet Active Transportation Grants to continue making timely progress toward completion of the projects.
During the year, Sustainable Development project expenses increased by $6,887,451, or 72.9 percent. This increase was a direct result of major work on the San Diego Forward Regional Plan, which incurred higher costs to meet state and federal laws and regulations. As a major planning project, the Regional Plan serves as the Regional Transportation Plan for the San Diego region and embodies a unified vision for our future in the next 30 years, as well as a specific approach to help make that vision a reality.
Business-type activities. Business-type activities decreased the SANDAG net position by $3,748,747, because of total revenue of $52,732,541 exceeding total expenses of $42,650,826 by $10,081,715 offset by a net transfer out of $13,830,462.
13

Key elements of the revenue and expense differences between fiscal year 2020 and fiscal year 2019 for business-type activities are as follows:
Total revenue for business-type activities decreased $6,991,102, or 12.0 percent, in fiscal year 2020. This revenue decrease was primarily the result of a decrease in the utilization of the SR 125 toll road and I-15 high occupancy vehicle (HOV) toll lane by commuters. In March 2020, the State of California issued a statewide shelter-in-place order that was the contributing factor to the toll road utilization decrease and continues to have a significant impact on the operations and business results of the toll road. The extent to which the coronavirus may impact business activity will depend on future developments, which are highly uncertain and cannot be predicted, including new information which may emerge concerning the severity of the coronavirus and the actions required to contain the coronavirus.
Total expenses for business-type activities increased $642,883 in fiscal year 2020. This was primarily a result of an increase in operating expense for the I-15 HOV toll lane operations.
Expenses – Governmental Activities
$0
$20,000,000
$40,000,000
$60,000,000
$80,000,000
$100,000,000
$120,000,000
$140,000,000
$160,000,000
$180,000,000
$200,000,000
$220,000,000
TransNetactivities
Transit capitalcontributions
Interest onlong-term debt
All other
FY20 Expenses FY19 Expenses
14

Financial Analysis of the Government’s Funds
As noted earlier, SANDAG uses fund accounting to ensure and demonstrate compliance with finance-related legal requirements.
Governmental funds. The focus of SANDAG governmental funds is to provide information on near-term inflows, outflows, and balances of spendable resources. Such information is useful in assessing SANDAG financing requirements. In particular, unreserved fund balance may serve as a useful measure of a government’s net resources available for spending at the end of the fiscal year.
As of the end of the fiscal year, SANDAG governmental funds reported combined ending fund balances of $743,100,031. Of this total amount, $6,779,761 constitutes unassigned fund deficit. The remainder of the fund balance is either nonspendable, restricted or committed.
The general fund is the chief general government operating fund of SANDAG. At the end of the current fiscal year, fund balance of the general fund was $19,850,970, and of this amount, $409,802 was nonspendable prepaid items, $8,182,701 was restricted for pension related costs, $5,302,000 was SANDAG Board approved contingency reserve balance. The fund balance of the general fund during the current fiscal year increased by $790,780. The key factors contributing to this increase is the investment earnings of $578,011 and the electronic payment program rebate and other miscellaneous revenue of $110,409. The TDA Program revenue received by the agency was lower than the actual expenditures of the TDA-eligible projects funded by the TDA Program revenue in fiscal year 2020. The agency’s receipt of TDA Program revenue was based on the SANDAG portion of the total apportionment of available TDA sales tax revenues. SANDAG funds TDA-eligible project expenditures as a transfer to other funds on a reimbursement basis, which is not always equal to the revenue apportioned. The timing difference between the TDA revenue received and expenditures incurred resulted in the fund balance increase in the current fiscal year. A portion of the unused revenues accumulated in previous years as part of the fund balance was used this fiscal year to cover for the costs of these TDA-eligible projects.
Local TransNetsales tax funds
73%
Capital grants and contributions
11%
Operating grants and contributions
9%All other sources7%
Revenues by Source – Governmental Activities
15

The Commission sales tax projects special revenue fund had a fund balance of $524,159,234, all of which was restricted. The fund balance of this fund during the current fiscal year was decreased by $29,768,024. Key factors contributing to this decrease are as follows:
Total fund expenditures and transfers out to the general fund, general services fund, capital projects fund and debt service fund were $179,308,142 and $272,832,198, respectively, which exceeded fund revenue by $122,117,113 due to increased capital project costs offset by net interfund transfers in of $92,349,089 primarily from the Commission’s debt service fund for the use of debt proceeds toward major corridor and major corridor environmental mitigation projects and for principal and interest payments. The transfers in of $83,849,089, which is predominantly bond proceeds, are reduced by sales tax receipts transfers out of $132,677,284 that are transferred to the debt service fund for payment of debt principal and interest.
The capital projects fund had a fund deficit of $3,891,428. The fund balance of the capital projects fund decreased by $3,289,996 during the current fiscal year primarily due to revenue recognition timing between fiscal year 2020 and fiscal year 2019.
The Commission commercial paper and sales tax revenue bonds debt service fund (RTC debt service fund) had a fund balance of $152,314,193, all of which was restricted. The fund balance of the debt service fund during the current fiscal year increased by $49,721,294, and key factors for this increase are as follows:
Expenditures in the current year exceeded revenues by $120,369,327 due to required debt payments of commercial paper and the 2008, 2010, 2012, 2014, 2016, 2019, 2020 bonds and 2018 short-term notes that included principal and interest payments and other charges, offset with the receipt of federal subsidy revenue for the 2010 Buy America Bonds net interest payment.
Net interfund transfers in of $48,828,195 were primarily transfers with the special revenue fund for the use of sales tax revenue toward the partial refunding of the existing debt and to meet required principal and interest payments on outstanding debt obligations.
Issuances of $29,378,000 in Commercial Paper, $517,440,000 in Bonds along with $20,448,312 in premiums provided additional sources of financing in FY 2020
The SANDAG debt service fund had a fund balance of $47,013,667. This fund was established in FY 2020 to account for the Capital Grant Receipts Revenue Bonds (Mid-Coast Corridor Transit Project) Series 2019A and Series 2019B issued in August 2019.
The general services fund had a fund deficit of $5,032,976. The fund balance of the general services fund decreased by $5,178,499 during the current fiscal year primarily due to the revenue recognition timing between FY 2020 and FY 2019, offset by $31 million fund transfer in from sales tax projects special revenue fund and General Fund.
The SAFE special revenue fund had a fund balance of $8,686,371. The fund balance increased $102,711 in the current fiscal year due to revenue exceeding operating expenses by $1,598,461 and offset by a transfer out of $1,495,750 to the Capital Projects fund.
General Fund Budgetary Highlights
The general fund is the SANDAG primary operating fund and accounts for all financial resources of the general government, except those required to be accounted for in another fund. During the fiscal year, there was a fund expense reduction between the original and final amended budget.
16

Local TDA sales tax revenues were equivalent to the SANDAG apportionment of FY 2020 TDA sales tax plus administrative and planning funds transferred to SANDAG by the local transit agencies. SANDAG budgets TDA revenues to fund eligible projects as a transfer to other funds on a reimbursement basis, which is not always equal to the claim amount.
Actual transfers out were lower than the budget by $1,642,396. The budget is comprised of TDA and Member Assessment funding expected to be transferred to other funds to pay for eligible project expenditures. Project expenditures in the general services fund, some of which are funded with TDA funds, were under budget with some projects experiencing delayed work efforts. Projects are initially funded using dedicated funds before TDA funding is applied, allowing TDA to be carried over for work efforts in FY 2021.
General government actual expenses were below the budgeted amount by $6,926,001. This is primarily related to salaries and benefits savings of $5,262,108 caused by employee turnover and the resulting vacancies in those staff positions while recruiting efforts were underway. The actual non-personnel expense is below the budgeted amount by $1,663,000 primarily attributable to actual spending timing difference of the agency system modernization program budget and under spending in the professional services line item.
Cost recovery expenses were lower than the budget by $5,112,900. Cost recovery amount was determined by applying an approved indirect cost rate to the direct base salary amount. This variance is a result of the direct personnel costs lower than the budgeted amount due to staff turnover.
Capital Assets
SANDAG investment in capital assets for its governmental activities, as of June 30, 2020, amounts to $2,118,409,257 (net of accumulated depreciation).
Capital Assets (Net of accumulated depreciation)
2020 2019Governmental activities:
Construction-in-progress 2,072,299,466$ 1,794,819,222$
Easement 17,004,331 15,950,412
Office equipment 8,743 13,026
Computer equipment 752,185 349,910
Other equipment 291,409 439,978
Vehicles 3,535,592 4,431,194
Buses 39,335 75,168 Leasehold improvements 162,500 -
Land 19,609,644 19,609,644
Land Improvement 3,780 4,835
Building 4,756,865 4,858,672
Governmental activities capital assets, net 2,118,463,850$ 1,840,552,061$
Governmental activities
Additional information on SANDAG capital assets can be found in Note II.C in the notes to the basic financial statements of this report.
17

Major projects under construction as of June 30, 2020, include:
TransNet projects. These include major corridor projects for I-5, I-15, I-805, State Route 76, the Mid-Coast Corridor, and the Transportation Project Biological Mitigation Fund. The CIP balance for those projects is $2.1 billion and the overall cumulative fiscal year 2020 approved budget for EAP projects through fiscal year 2028 is $8.1 billion.
Debt Administration
Long-term debt. At the end of the current fiscal year, SANDAG had total debt outstanding of $3,074,297,125, which is comprised of $1,438,975,000 of tax-exempt sales tax revenue bonds, $338,960,000 of BABs (sales tax revenue bonds), net premium on the tax-exempt bonds of $106,983,254, $537,480,000 of 2018 short-term notes with a premium of $8,032,713, $58,213,000 of outstanding commercial paper notes, grant anticipation notes of $335,000,000 with a premium of $30,676,658, compensated absences payable of $3,362,012, claims payable of $238,157, and $186,755,000 of 2017 Series A toll revenue bonds with $31,621,331 premium.
2020 2019 2020 2019 2020 2019
Sales tax bonds 1,884,918,254$ 1,845,785,956$ -$ -$ 1,884,918,254$ 1,845,785,956$ 2018 short-term notes 545,512,713 556,222,998 - - 545,512,713 556,222,998 Commercial paper 56,213,000 28,692,000 - - 56,213,000 28,692,000 Grant anticipation notes 365,676,658 - - - 365,676,658 - Compensated absences 3,116,728 2,279,416 245,284 214,587 3,362,012 2,494,003 Claims payable - 25,000 238,157 500,000 238,157 525,000 2017 Series A toll revenue bonds - - 218,376,331 225,131,369 218,376,331 225,131,369
Total 2,855,437,353$ 2,433,005,370$ 218,859,772$ 225,845,956$ 3,074,297,125$ 2,658,851,326$
Governmental activities Business-type activities Total
In addition to the debt noted in the schedule above, net pension liability of $55,664,357 and Other Post-Employment Benefit liability of $1,555,253 are included in fiscal year 2020. See Note II.K and II.L for further information.
SANDAG total debt, including compensated absences, increased $422,633,131, which is primarily a result of issuances of grant anticipation notes and 2019 and 2020 sales tax bonds offset by the debt principal paydown and bond premium amortization.
Additional information on SANDAG long-term debt can be found in Note II.G in the notes to the basic financial statements of this report.
Economic Factors and Next Year’s Budgets
The Overall Work Program (OWP) and Regional Operations Program are the non-capital portions of the Program Budget. For the OWP, federal consolidated planning grant sources are expected to grow by 4.8 percent in fiscal year 2021, with local sales tax revenue originally expected to decrease by 4.0 percent. However, COVID-19 has not had as much of a negative impact on sales tax revenues through the first five months of the fiscal year and are relatively flat over the prior year. The total fiscal year 2021 OWP budget is $46.3 million. Planning efforts continue to increase in the development of the Regional Plan and work continues the agency’s Strategic Initiatives of becoming a data-driven organization.
The FY 2021 Regional Operations Program budget was approved for $62.9 million in the fiscal year 2021 budget and consists of the ongoing activities that require 24-hour monitoring, including the SR 125 Facilities Operations, Motorist Aid Call Box program, I-15 FasTrak, Freeway Service Patrol,
18

property management, and ARJIS. COVID-19 has led to a significant reduction in traffic on all local freeways, and as a result, some motorists that regularly travel the SR 125 toll road and I-15 Express Lanes have temporarily switched to free alternatives with reduced congestion. It was originally estimated that revenue will decrease from original FY 2020 forecasts by 11% on SR 125 and 14% on the I-15 Express Lanes. However, since COVID-19 pandemic has continued longer than originally anticipated the usage on the toll roads has not recovered and further revenue decreases are expected. In the Capital Budget, cumulative capital project funding through fiscal year 2029 as approved in the fiscal year 2021 budget remained at $8.6 billion with $6.5 billion already expended and $2.1 billion budgeted for future expenditures, as more Regional Bikeway Projects move into the construction phase. SANDAG continues to partner with Caltrans and the transit operators to implement major transit and highway projects throughout the San Diego region.
SANDAG continues to strive for continuous improvement by implementing cost-effective measures to maximize the efficiency of the general fund expenditures. In fiscal year 2021, emphasis is placed on an agency-wide modernization program that provides technology improvements to increase overall efficiencies. Administrative expenditures are increasing 7.3 percent, with an approved budget of $18.5 million, primarily due to increased information and technology costs.
Actual cash basis sales tax collections have increased in 22 of the last 26 years of collections, with decreases occurring in fiscal years 2008, 2009, 2010, and 2020. Actual sales tax receipts in fiscal year 2020 came in 2 percent lower than fiscal year 2019 actual receipts. The decrease from previous years is due to the COVID-19 related disruption and its recessionary impact on the economy.
For the fiscal year 2020 budget, $286 million in TransNet sales tax receipts is budgeted. The sales tax revenue budget will fund general government administration, bicycle, pedestrian, and neighborhood safety projects, the ITOC, major corridor capital projects, major corridor environmental mitigation, local project environmental mitigation, local street improvements, smart growth, new major corridor transit operations, and transit system improvements.
Requests for Information
This financial report was designed to provide a general overview of SANDAG finances for all those interested. Questions concerning any of the information provided in this report, or requests for additional financial information, should be addressed to the Director of Finance, San Diego Association of Governments, 401 B Street, Suite 800, San Diego, California 92101, or emailed to the Public Information Officer at [email protected].
19

This page intentionally left blank.
20

BASIC FINANCIAL STATEMENTS
21

This page intentionally left blank.
22

GOVERNMENT-WIDE FINANCIAL STATEMENTS
23

This page intentionally left blank.
24

San Diego Association of GovernmentsStatement of Net Position
June 30, 2020
Component Units
Governmental Business-type Totals
Activities Activities 2020 ARJIS
ASSETS
Cash and investments - unrestricted 683,821,496$ 40,996,408$ 724,817,904$ 8,614,765$
Cash and investments - restricted - 4,641,580 4,641,580 -
Accounts receivable 558,302 5,112,902 5,671,204 -
Prepaid items and other assets 4,269,977 532,115 4,802,092 333,451
Interest receivable 2,141,177 147,197 2,288,374 10,945
Due from other governments 179,116,052 572,581 179,688,633 1,261,953
Due from component units 124,374 - 124,374 -
Internal balances (771,549) 771,549 - -
Derivative instrument - swap asset 6,363,787 - 6,363,787 -
Restricted assets:
Cash restricted for capital project retentions 54,506,668 34,285,520 88,792,188 -
Cash and investments restricted for debt service and other liabilities 95,069,342 18,476,695 113,546,037 -
Cash and investments restricted for environmental mitigation 1,177,237 - 1,177,237 -
Cash and investments restricted for major maintenance & project revenue - 47,276,637 47,276,637 -
Capital assets:
Non-depreciable 2,108,913,441 20,326,963 2,129,240,404 -
Depreciable, net of accumulated depreciation 9,550,409 300,668,956 310,219,365 28,018
Total assets 3,144,840,713 473,809,103 3,618,649,816 10,249,132
DEFERRED OUTFLOWS OF RESOURCES
Accumulated decrease in fair value of hedging swap agreement 130,288,295 - 130,288,295 -
Deferred refunding charge 3,680,821 470,746 4,151,567 -
Pension related 9,545,845 2,787,416 12,333,261 1,064,634
Other post-employment benefit related 924,181 69,402 993,583 20,433
Total deferred outflows of resources 144,439,142 3,327,564 147,766,706 1,085,067
LIABILITIES
Accounts payable 55,527,197 1,725,368 57,252,565 98,986
Retentions payable 3,915,681 348,843 4,264,524 -
Due to other governments 41,036,443 891,696 41,928,139 491,959
Due to primary government - - - 124,374
Accrued interest payable 24,314,114 4,700,742 29,014,856 -
Transponder deposits payable - 23,913 23,913 -
Unearned revenue 23,269,312 3,075,546 26,344,858 -
Derivative instrument - swap liability 130,288,295 - 130,288,295 -
Liabilities payable from restricted assets:
Deposits payable 252,485 - 252,485 -
Retentions payable 55,798,307 - 55,798,307 -
Long-term debt payable - due within one year 31,146,861 - 31,146,861 -
Noncurrent liabilities:
Due within one year 598,022,867 4,780,284 602,803,151 -
Due in more than one year 2,226,267,625 214,079,488 2,440,347,113 -
Net pension liability 44,921,136 7,347,695 52,268,831 3,395,526
Net other post-employment benefit liability 1,418,332 103,750 1,522,082 33,171
Total liabilities 3,236,178,655 237,077,325 3,473,255,980 4,144,016
DEFERRED INFLOWS OF RESOURCES
Deferred refunding 9,389,365 - 9,389,365 - Pension related 3,145,190 286,450 3,431,640 307,526
Other post-employment benefit related 36,232 32,441 68,673 27,055
Total deferred inflows of resources 12,570,787 318,891 12,889,678 334,581
NET POSITION
Net investment in capital assets 803,549,001 102,412,780 905,961,781 28,018
Restricted for:
Mid-coast project 34,085,951 - 34,085,951 -
Debt service and other liabilities 63,669,996 18,476,695 82,146,691 -
Environmental mitigation 1,177,237 - 1,177,237 -
Major maintenance post-acquisition - 47,197,962 47,197,962 -
Project revenue - 34,285,520 34,285,520 -
Toll road operations and improvements - 35,410,702 35,410,702 -
Customer prepaid - 69,404 69,404 -
Freeway emergency service 8,683,786 - 8,683,786 -
iCommute - 9,071 9,071 -
Property management - 1,374,831 1,374,831 -
Unrestricted (deficit) (870,635,557) 503,486 (870,132,071) 6,827,584
40,530,414$ 239,740,451$ 280,270,865$ 6,855,602$
See accompanying Notes to the Basic Financial Statements.
Total net position
Primary Government
25
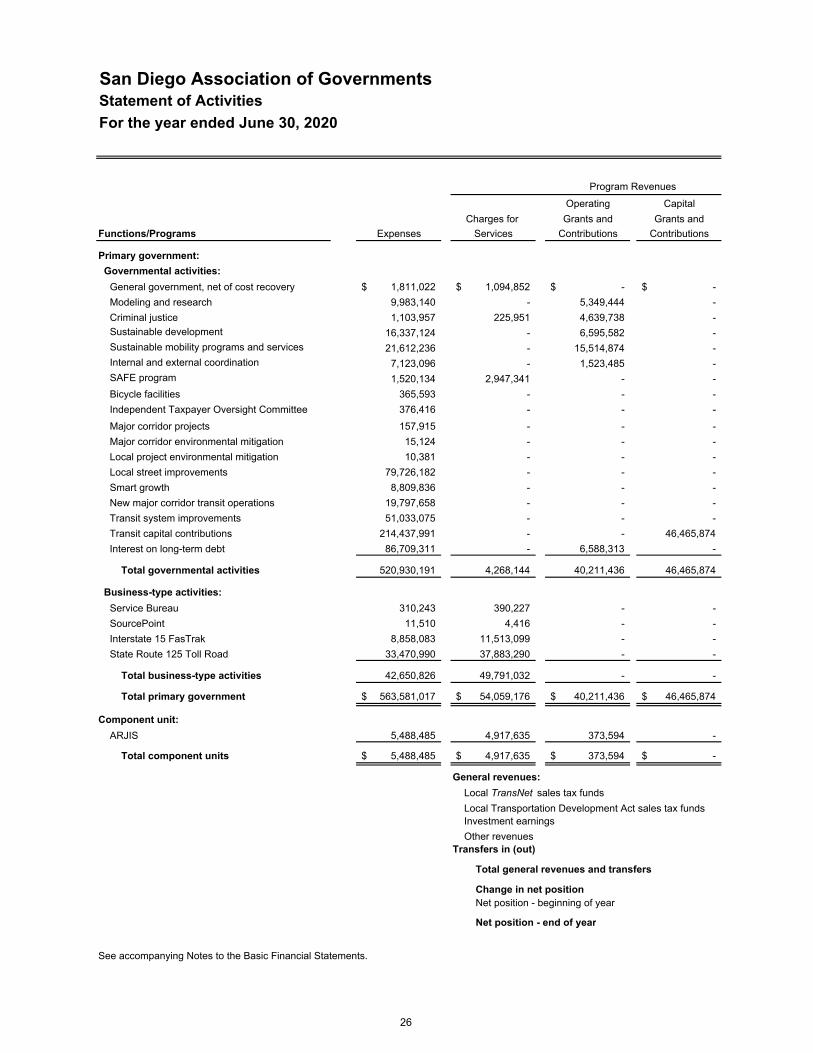
San Diego Association of GovernmentsStatement of Activities
For the year ended June 30, 2020
Operating Capital
Charges for Grants and Grants and
Functions/Programs Expenses Services Contributions Contributions
Primary government:
Governmental activities:
General government, net of cost recovery 1,811,022$ 1,094,852$ -$ -$
Modeling and research 9,983,140 - 5,349,444 -
Criminal justice 1,103,957 225,951 4,639,738 -
Sustainable development 16,337,124 - 6,595,582 -
Sustainable mobility programs and services 21,612,236 - 15,514,874 -
Internal and external coordination 7,123,096 - 1,523,485 -
SAFE program 1,520,134 2,947,341 - -
Bicycle facilities 365,593 - - -
Independent Taxpayer Oversight Committee 376,416 - - -
Major corridor projects 157,915 - - -
Major corridor environmental mitigation 15,124 - - -
Local project environmental mitigation 10,381 - - -
Local street improvements 79,726,182 - - -
Smart growth 8,809,836 - - -
New major corridor transit operations 19,797,658 - - -
Transit system improvements 51,033,075 - - -
Transit capital contributions 214,437,991 - - 46,465,874
Interest on long-term debt 86,709,311 - 6,588,313 -
Total governmental activities 520,930,191 4,268,144 40,211,436 46,465,874
Business-type activities:
Service Bureau 310,243 390,227 - -
SourcePoint 11,510 4,416 - -
Interstate 15 FasTrak 8,858,083 11,513,099 - -
State Route 125 Toll Road 33,470,990 37,883,290 - -
Total business-type activities 42,650,826 49,791,032 - -
Total primary government 563,581,017$ 54,059,176$ 40,211,436$ 46,465,874$
Component unit:
ARJIS 5,488,485 4,917,635 373,594 -
Total component units 5,488,485$ 4,917,635$ 373,594$ -$
General revenues:
Local TransNet sales tax funds
Local Transportation Development Act sales tax fundsInvestment earnings
Other revenuesTransfers in (out)
Total general revenues and transfers
Change in net positionNet position - beginning of year
Net position - end of year
See accompanying Notes to the Basic Financial Statements.
Program Revenues
26
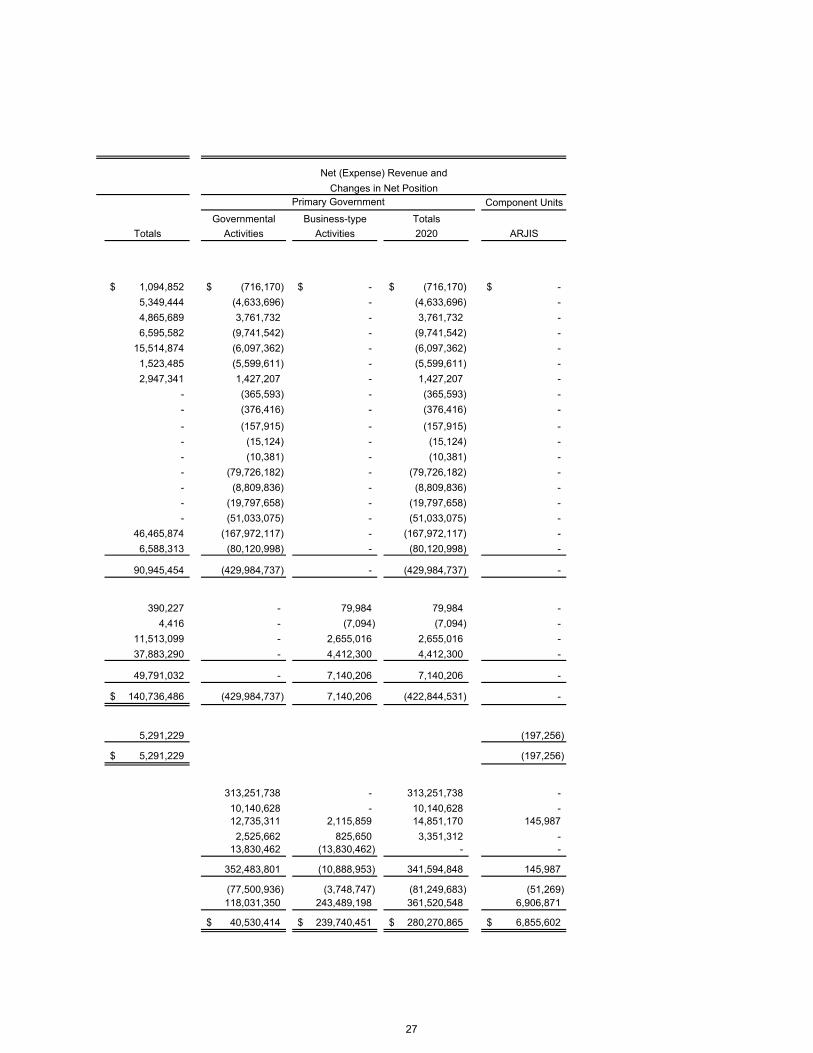
Component Units
Governmental Business-type Totals
Totals Activities Activities 2020 ARJIS
1,094,852$ (716,170)$ -$ (716,170)$ -$
5,349,444 (4,633,696) - (4,633,696) -
4,865,689 3,761,732 - 3,761,732 -
6,595,582 (9,741,542) - (9,741,542) -
15,514,874 (6,097,362) - (6,097,362) -
1,523,485 (5,599,611) - (5,599,611) -
2,947,341 1,427,207 - 1,427,207 -
- (365,593) - (365,593) -
- (376,416) - (376,416) -
- (157,915) - (157,915) -
- (15,124) - (15,124) -
- (10,381) - (10,381) -
- (79,726,182) - (79,726,182) -
- (8,809,836) - (8,809,836) -
- (19,797,658) - (19,797,658) -
- (51,033,075) - (51,033,075) -
46,465,874 (167,972,117) - (167,972,117) -
6,588,313 (80,120,998) - (80,120,998) -
90,945,454 (429,984,737) - (429,984,737) -
390,227 - 79,984 79,984 -
4,416 - (7,094) (7,094) -
11,513,099 - 2,655,016 2,655,016 -
37,883,290 - 4,412,300 4,412,300 -
49,791,032 - 7,140,206 7,140,206 -
140,736,486$ (429,984,737) 7,140,206 (422,844,531) -
5,291,229 (197,256)
5,291,229$ (197,256)
313,251,738 - 313,251,738 -
10,140,628 - 10,140,628 - 12,735,311 2,115,859 14,851,170 145,987
2,525,662 825,650 3,351,312 - 13,830,462 (13,830,462) - -
352,483,801 (10,888,953) 341,594,848 145,987
(77,500,936) (3,748,747) (81,249,683) (51,269) 118,031,350 243,489,198 361,520,548 6,906,871
40,530,414$ 239,740,451$ 280,270,865$ 6,855,602$
Primary Government
Net (Expense) Revenue and
Changes in Net Position
27

This page intentionally left blank.
28

FUND FINANCIAL STATEMENTS
29

This page intentionally left blank.
30

GOVERNMENT FUND FINANCIAL STATEMENTS
31

San Diego Association of GovernmentsBalance Sheet
Governmental Funds
June 30, 2020
San Diego
County Regional
Transportation Capital
General Commission Sales Projects
Fund Tax Projects Fund Fund
ASSETS
Cash and investments 14,286,144$ 494,095,956$ 5,047,854$
Accounts receivable 28,025 - 40,266
Prepaid items and other assets 409,812 45,766 3,500,044
Interest receivable 14,001 2,016,929 -
Due from other funds 880,606 495,403 74,418,347
Due from other governments 151,799 60,094,932 24,282,325
Due from component units 124,374 - -
Cash and investments - restricted 8,182,701 1,177,237 54,506,668
Total assets 24,077,462$ 557,926,223$ 161,795,504$
LIABILITIES
Liabilities:
Accounts payable 119,894$ 623,581$ 47,496,123$
Accrued liabilities 856,646 - -
Retentions payable - 4,905 2,572,618
Due to other funds 2,792,099 28,194,388 448,094
Due to other governments 457,853 4,944,115 29,600,365
Unearned revenue - - 21,145,494
Liabilities payable from restricted assets - - 55,798,307
Total liabilities 4,226,492 33,766,989 157,061,001
DEFERRED INFLOWS OF RESOURCES
Unavailable revenue - - 8,625,931
Total deferred inflows of resources - - 8,625,931
FUND BALANCES (DEFICIT)
Nonspendable:
Prepaid items 409,812 45,766 3,500,044
Restricted for:
Pension benefits 8,182,701 - -
Environmental mitigation - 1,177,237 -
Debt service - - -
TransNet -eligible projects - 522,936,231 -
Mid-coast project - - -
Freeway emergency service - - -
Total restricted 8,182,701 524,113,468 -
Committed to:
Agency contingency reserve 5,302,000 - -
Unassigned 5,956,457 - (7,391,472)
Total fund balances (deficit) 19,850,970 524,159,234 (3,891,428)
Total liabilities, deferred inflows of resourcesand fund balances
24,077,462$ 557,926,223$ 161,795,504$
See accompanying Notes to the Basic Financial Statements.
Major Funds
32

San Diego
County Regional San Diego
Transportation Association of Other
Commission Governments Governmental
Debt Service Fund Debt Service Fund Funds 2020
78,588,239$ 80,559,195$ 11,244,108$ 683,821,496$
- - 490,011 558,302
- - 314,355 4,269,977
20,027 - 37,293 2,088,250
- - 7,133,709 82,928,065
79,670,022 - 14,910,667 179,109,745
- - - 124,374
73,958,925 12,927,716 - 150,753,247
232,237,213$ 93,486,911$ 34,130,143$ 1,103,653,456$
513$ -$ 6,402,923$ 54,643,034$
- - 27,517 884,163
- - 1,338,157 3,915,680
- 46,473,244 5,791,789 83,699,614
- - 6,034,110 41,036,443
- - 2,123,818 23,269,312
252,485 - - 56,050,792
252,998 46,473,244 21,718,314 263,499,038
79,670,022 - 8,758,434 97,054,387
79,670,022 - 8,758,434 97,054,387
- - 314,355 4,269,977
- - - 8,182,701
- - - 1,177,237
73,706,440 12,927,716 - 86,634,156
78,607,753 - - 601,543,984
- 34,085,951 - 34,085,951
- - 8,683,786 8,683,786
152,314,193 47,013,667 8,683,786 740,307,815
- - - 5,302,000
- - (5,344,746) (6,779,761)
152,314,193 47,013,667 3,653,395 743,100,031
232,237,213$ 93,486,911$ 34,130,143$ 1,103,653,456$
See accompanying Notes to the Basic Financial Statements.
Totals
33

This page intentionally left blank.
34

San Diego Association of GovernmentsReconciliation of the Governmental Funds Balance Sheet
to the Government-Wide Statement of Net Position
Total Fund Balances - Total Governmental Funds 743,100,031$
Capital assets used in governmental activities are not financial resources and, therefore, are notreported in the governmental funds.
Capital assets, non-depreciable 2,108,913,441
Capital assets, depreciable 20,954,916
Accumulated depreciation (11,404,507)
Other long-term assets are not available to pay for current-period expenditures and, therefore,are not reported in the governmental funds.
Interest receivable - swap asset 52,927
Interest receivable - commercial paper 6,307
Some revenues will be collected after year-end, but are not available soon enough to pay for thecurrent period's expenditures, and therefore are not reported in the governmental funds. 97,054,387
Long-term liabilities, including debt payable, are not due and payable in the current period and,therefore, are not reported in the governmental funds.
Accrued interest payable - bond (24,307,807)
Accrued interest payable - commercial paper (6,307)
Commercial paper payable (56,213,000)
Bond premium (145,692,625)
Deferred refunding charge -deferred outflow of resources 3,680,821
Bonds payable (2,650,415,000)
Deferred refunding - deferred inflow of resources (9,389,365)
Compensated absences (3,116,728)
Net pension liability and related deferred outflow and inflows of resources are not due andpayable in the current period and, therefore, are not reported in the governmental funds.
Deferred outflows of resources - pension related 9,545,845
Net pension liability (44,921,136)
Deferred inflows of resources - pension related (3,145,190)
Net other post-employment benefit (OPEB) liability and related deferred outflow and inflows ofresources are not due and payable in the current period and, therefore, are not reported in thegovernmental funds.
Deferred outflows of resources - OPEB related 924,181
Net OPEB liability (1,418,332)
Deferred inflows of resources - OPEB related (36,232)
Derivative instruments are not reported in the funds but must be reported in the statement of netposition.
Derivative instrument - swap asset 6,363,787
Accumulated decrease in fair value of hedging swap agreements 130,288,295 Derivative instrument - swap liability (130,288,295)
Net Position of Governmental Activities 40,530,414$
See accompanying Notes to the Basic Financial Statements.
Amounts reported for governmental activities in the statement of net position are different because:
June 30, 2020
35

San Diego Association of GovernmentsStatement of Revenues, Expenditures, and Change in Fund Balances
Governmental Funds
For the year ended June 30, 2020
San DiegoCounty RegionalTransportation
General Commission SalesFund Tax Projects Fund
REVENUES
Federal funds -$ -$ State funds - - Local TransNet sales tax funds - 313,251,738 Local Transportation Development Act sales tax funds 7,951,987 - Other local governmental funding - - SAFE program revenue - - Member agency assessments 1,094,852 -
Investment earnings 578,011 16,600,049
Debt repayments from other governments - - Other revenues 110,409 171,440
Total revenues 9,735,259 330,023,227
EXPENDITURES
Current:General government 54,579,269 - Cost recovery (54,385,304) - Modeling and research - - Criminal justice - - Sustainable development - - Sustainable mobility programs and services - - Internal and external coordination - - SAFE program - - Bicycle facilities - 6,426 Independent Taxpayer Oversight Committee - 376,416
Major corridor capital projects - 157,915
Major corridor environmental mitigation - 15,124 Local project environmental mitigation - 10,381 Local street and road improvements - 109,104,182 Smart growth - 10,029 New major corridor transit operations - 19,797,658 Transit system improvements - 49,830,011 Regional transportation improvements - -
Debt service:Principal retirement - - Debt issuance costs - - Interest and other charges - -
Payments to refunding escrow agent - -
Total expenditures 193,965 179,308,142
REVENUES OVER (UNDER) EXPENDITURES 9,541,294 150,715,085
OTHER FINANCING SOURCES (USES)
Transfers in 1,068,506 92,349,089 Transfers out (9,819,020) (272,832,198) Commercial paper issued - - Bonds issued - - Premium on bonds issued - -
Payments to refunding escrow agent - -
Total other financing sources (uses) (8,750,514) (180,483,109)
Net change in fund balances 790,780 (29,768,024)
FUND BALANCES (DEFICIT)
Beginning of year 19,060,190 553,927,258
End of year 19,850,970$ 524,159,234$
See accompanying Notes to the Basic Financial Statements.
36

San DiegoCounty Regional San Diego
Capital Transportation Association of Other TotalsProjects Commission Governments Governmental
Fund Debt Service Fund Debt Service Fund Funds 2020
12,588,774$ 6,588,313$ -$ 19,127,470$ 38,304,557$ 27,368,748 - - 7,566,002 34,934,750
- - - - 313,251,738 2,188,641 - - - 10,140,628 6,478,748 - - 1,299,364 7,778,112
- - - 2,947,341 2,947,341 - - - 225,951 1,320,803
- 3,401,768 3,587,633 171,254 24,338,715
- 4,150,792 - - 4,150,792 150,000 2,093,813 - - 2,525,662
48,774,911 16,234,686 3,587,633 31,337,382 439,693,098
- - - - 54,579,269 - - - - (54,385,304) - - - 9,983,140 9,983,140 - - - 1,103,957 1,103,957 - - - 16,337,124 16,337,124 - - - 19,500,160 19,500,160 - - - 7,123,096 7,123,096 - - - 1,520,134 1,520,134 - - - 359,167 365,593 - - - - 376,416
- - - - 157,915
- - - - 15,124 - - - - 10,381 - - - - 109,104,182 - - - 8,799,807 8,809,836 - - - - 19,797,658 - - - 1,203,064 51,033,075
493,168,391 - - - 493,168,391 -
- 31,642,000 - - 31,642,000 - 854,744 1,564,502 - 2,419,246 - 99,827,008 9,597,917 - 109,424,925
- 4,240,102 - - 4,240,102
493,168,391 136,563,853 11,162,419 65,929,649 886,326,419
(444,393,480) (120,329,167) (7,574,786) (34,592,267) (446,633,321)
441,390,988 132,677,284 - 31,012,229 698,498,096 (287,504) (83,849,089) (316,384,073) (1,495,750) (684,667,634)
- 29,378,000 - - 29,378,000 - 517,440,000 335,000,000 - 852,440,000 - 20,448,312 35,972,526 - 56,420,838
- (446,044,046) - - (446,044,046)
441,103,484 170,050,461 54,588,453 29,516,479 506,025,254
(3,289,996) 49,721,294 47,013,667 (5,075,788) 59,391,933
(601,432) 102,592,899 - 8,729,183 683,708,098
(3,891,428)$ 152,314,193$ 47,013,667$ 3,653,395$ 743,100,031$
See accompanying Notes to the Basic Financial Statements.
Major Funds
37

This page intentionally left blank.
38
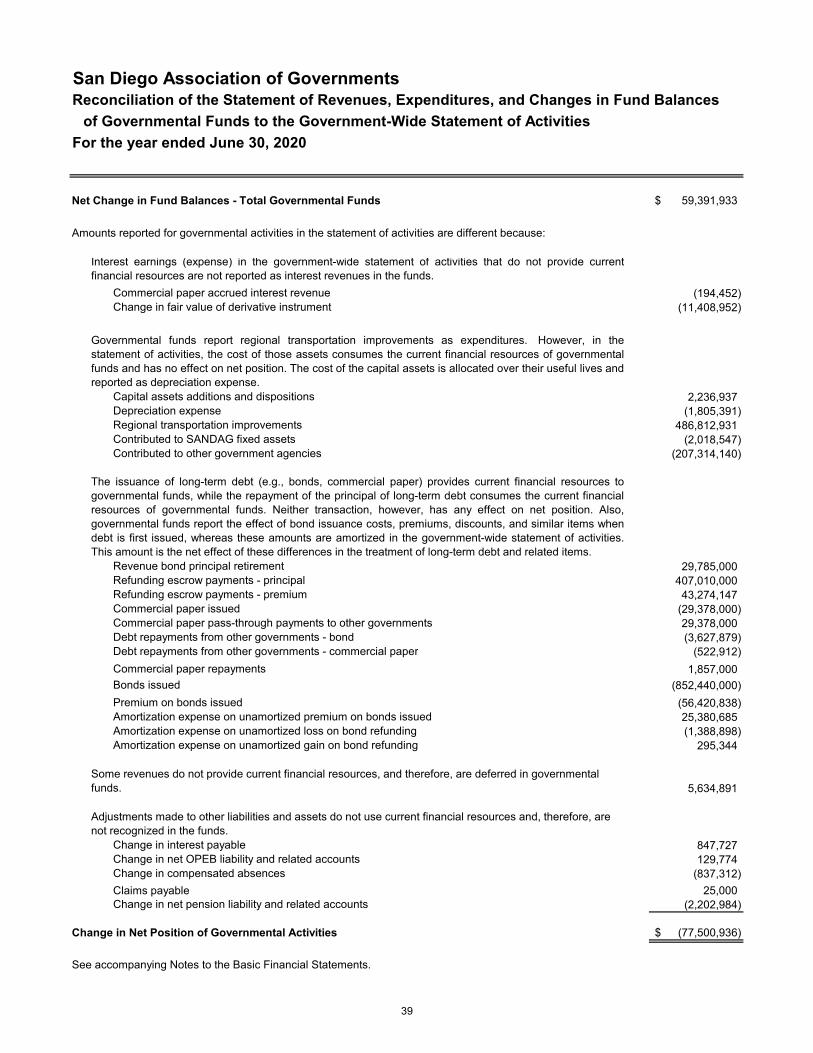
San Diego Association of GovernmentsReconciliation of the Statement of Revenues, Expenditures, and Changes in Fund Balances
of Governmental Funds to the Government-Wide Statement of Activities
For the year ended June 30, 2020
Net Change in Fund Balances - Total Governmental Funds 59,391,933$
Interest earnings (expense) in the government-wide statement of activities that do not provide currentfinancial resources are not reported as interest revenues in the funds.
Commercial paper accrued interest revenue (194,452) Change in fair value of derivative instrument (11,408,952)
Governmental funds report regional transportation improvements as expenditures. However, in thestatement of activities, the cost of those assets consumes the current financial resources of governmentalfunds and has no effect on net position. The cost of the capital assets is allocated over their useful lives andreported as depreciation expense.
Capital assets additions and dispositions 2,236,937 Depreciation expense (1,805,391) Regional transportation improvements 486,812,931 Contributed to SANDAG fixed assets (2,018,547) Contributed to other government agencies (207,314,140)
The issuance of long-term debt (e.g., bonds, commercial paper) provides current financial resources togovernmental funds, while the repayment of the principal of long-term debt consumes the current financialresources of governmental funds. Neither transaction, however, has any effect on net position. Also,governmental funds report the effect of bond issuance costs, premiums, discounts, and similar items whendebt is first issued, whereas these amounts are amortized in the government-wide statement of activities.This amount is the net effect of these differences in the treatment of long-term debt and related items.
Revenue bond principal retirement 29,785,000 Refunding escrow payments - principal 407,010,000 Refunding escrow payments - premium 43,274,147 Commercial paper issued (29,378,000) Commercial paper pass-through payments to other governments 29,378,000 Debt repayments from other governments - bond (3,627,879) Debt repayments from other governments - commercial paper (522,912)
Commercial paper repayments 1,857,000
Bonds issued (852,440,000)
Premium on bonds issued (56,420,838) Amortization expense on unamortized premium on bonds issued 25,380,685 Amortization expense on unamortized loss on bond refunding (1,388,898) Amortization expense on unamortized gain on bond refunding 295,344
Some revenues do not provide current financial resources, and therefore, are deferred in governmental funds. 5,634,891
Adjustments made to other liabilities and assets do not use current financial resources and, therefore, are not recognized in the funds.
Change in interest payable 847,727 Change in net OPEB liability and related accounts 129,774 Change in compensated absences (837,312)
Claims payable 25,000 Change in net pension liability and related accounts (2,202,984)
Change in Net Position of Governmental Activities (77,500,936)$
See accompanying Notes to the Basic Financial Statements.
Amounts reported for governmental activities in the statement of activities are different because:
39

This page intentionally left blank.
40

PROPRIETARY FUND FINANCIAL STATEMENTS
41

This page intentionally left blank.
42

San Diego Association of GovernmentsStatement of Net Position
Proprietary Funds
June 30, 2020
Totals
Major Fund Nonmajor
SR 125 Toll Road Funds 2020
ASSETS
Current assets:
Cash and cash equivalents - unrestricted 3,895,375$ 37,101,033$ 40,996,408$
Cash and cash equivalents - restricted - 9,271 9,271
Accounts receivable 4,105,880 1,007,022 5,112,902
Prepaid items and other assets 526,322 5,793 532,115
Interest receivable - 147,197 147,197
Due from other funds 760,775 1,458,440 2,219,215
Due from other governments 230,845 341,736 572,581
Total current assets 9,519,197 40,070,492 49,589,689
Noncurrent assets:
Cash and cash equivalents - restricted 104,671,161 - 104,671,161
Non-depreciable capital assets 14,173,737 6,153,226 20,326,963
Depreciable capital assets, net of accumulated depreciation 296,420,783 4,248,173 300,668,956
Total noncurrent assets 415,265,681 10,401,399 425,667,080
Total assets 424,784,878 50,471,891 475,256,769
DEFERRED OUTFLOWS OF RESOURCES
Deferred outflow of resources - refunding 470,746 - 470,746
Deferred outflow of resources - pension related 2,787,416 - 2,787,416
Deferred outflow of resources - OPEB related 69,402 - 69,402
Total deferred outflows of resources 3,327,564 - 3,327,564
LIABILITIES
Current liabilities:
Accounts payable 711,633 926,584 1,638,217
Accrued liabilities 332,435 - 332,435
Retentions payable 243,357 105,486 348,843
Due to other funds 1,410,335 37,331 1,447,666
Due to other governments 118,797 772,899 891,696
Security deposit - 31,867 31,867
Transponder deposits payable 19,865 4,048 23,913
Unearned revenue 1,892,956 1,182,590 3,075,546
Interest payable 4,668,875 - 4,668,875
Long term liabilities due within one year 4,535,000 - 4,535,000
Total current liabilities 13,933,253 3,060,805 16,994,058
Noncurrent liabilities:
Bonds payable 213,841,331 - 213,841,331
Claims payable 238,157 - 238,157 Net pension liability 7,347,695 - 7,347,695
Net OPEB liability 103,750 - 103,750
Total noncurrent liabilities 221,530,933 - 221,530,933
Total liabilities 235,464,186 3,060,805 238,524,991
DEFERRED INFLOWS OF RESOURCES
Deferred inflows of resources - pension related 286,450 - 286,450
Deferred inflows of resources - OPEB related 32,441 - 32,441
Total deferred inflows of resources 318,891 - 318,891
NET POSITION
Net investment in capital assets 92,299,784 10,112,996 102,412,780
Restricted for:
Debt service 18,476,695 - 18,476,695
Major maintenance and capital expenditure 47,197,962 - 47,197,962
Project revenue 34,285,520 - 34,285,520
Customer prepaid reserve 69,404 - 69,404
iCommute - 9,071 9,071
Property management - 1,374,831 1,374,831
Toll road operations and improvements - 35,410,702 35,410,702
Unrestricted (deficit) - 503,486 503,486
Total net position 192,329,365$ 47,411,086$ 239,740,451$
See accompanying Notes to the Basic Financial Statements.
Business-type Activities-Enterprise Funds
43

San Diego Association of GovernmentsStatement of Revenues, Expenses, and Change in Net Position
Proprietary Funds
For the year ended June 30, 2020
Totals
Major Fund Nonmajor
SR 125 Toll Road Funds 2020
OPERATING REVENUES
State Route 125 Toll Road revenue 36,498,425$ -$ 36,498,425$
Interstate 15 FasTrak permit revenue - 11,425,005 11,425,005
Interstate 15 FasTrak fines and forfeitures revenue - 88,094 88,094
Service Bureau transportation modeling service fees - 390,227 390,227
SourcePoint charges for service - 4,416 4,416
Other revenue 1,384,865 - 1,384,865
Total operating revenues 37,883,290 11,907,742 49,791,032
OPERATING EXPENSES
Roadway operations expenses 2,469,721 4,079,409 6,549,130
SourcePoint iCommute operating expenses - 6,065 6,065
Payroll and other compensation expenses 7,698,183 1,375,774 9,073,957
Administrative costs 1,256,576 38,300 1,294,876
Professional services 1,112,134 1,219,769 2,331,903
Claims expense - - -
Depreciation 14,000,339 2,460,519 16,460,858
Total operating expenses 26,536,953 9,179,836 35,716,789
Operating income (loss) 11,346,337 2,727,906 14,074,243
NONOPERATING REVENUES (EXPENSES)
Other income (expenses) - 825,650 825,650
Interest income 1,310,907 804,952 2,115,859
Interest expense (6,934,037) - (6,934,037)
Total nonoperating revenues (expenses) (5,623,130) 1,630,602 (3,992,528)
INCOME (LOSS) BEFORE CONTRIBUTIONS AND TRANSFERS 5,723,207 4,358,508 10,081,715
Transfers out (5,321,060) (8,509,402) (13,830,462)
Total contributions and transfers (5,321,060) (8,509,402) (13,830,462)
CHANGE IN NET POSITION 402,147 (4,150,894) (3,748,747)
Net position:
Beginning of year 191,927,218 51,561,980 243,489,198
End of year 192,329,365$ 47,411,086$ 239,740,451$
See accompanying Notes to the Basic Financial Statements.
Business-type Activities - Enterprise Funds
44

San Diego Association of GovernmentsStatement of Cash Flows
Proprietary Funds
For the year ended June 30, 2020
SR 125 Toll Road Nonmajor Funds 2020
CASH FLOWS FROM OPERATING ACTIVITIES
Receipts from customers and users 37,661,313$ 11,883,002$ 49,544,315$
Payments for employee salaries and benefits (7,072,927) (1,279,451) (8,352,378)
Payments for operations (4,707,211) (5,747,848) (10,455,059)
Net cash provided by (used for) operating activities 25,881,175 4,855,703 30,736,878
CASH FLOWS FROM NONCAPITAL FINANCING ACTIVITIES
Transfer from other funds 603,094 - 603,094
Transfer to other funds (6,042,917) (11,480,393) (17,523,310)
Net cash provided by (used for) noncapital financing activities (5,439,823) (11,480,393) (16,920,216)
CASH FLOWS FROM CAPITAL FINANCING AND RELATED ACTIVITIES
Acquisition and construction of capital assets (5,317,848) (2,017,414) (7,335,262)
Principal payment on debt (4,315,000) - (4,315,000)
Interest payment on debt (9,445,625) - (9,445,625)
Proceed from disposition assets 5,500 - 5,500
Net cash provided by (used for) capital financing and related activities (19,072,973) (2,017,414) (21,090,387)
CASH FLOWS FROM INVESTING ACTIVITIES
Receipts from rent - 672,592 672,592
Payment made for rental property - (672,592) (672,592)
Interest received 1,310,907 1,072,662 2,383,569
Net cash provided by (used for) investing activities 1,310,907 1,072,662 2,383,569
Net increase in cash and investments 2,679,286 (7,569,442) (4,890,156)
Cash and investments, beginning of year 105,887,250 44,679,746 150,566,996
Cash and investments, end of year 108,566,536$ 37,110,304$ 145,676,840$ (139,357,739)
RECONCILIATION OF OPERATING INCOME (LOSS) TO NET CASH
PROVIDED BY (USED FOR) OPERATING ACTIVITIES
Operating income (loss) 11,346,337$ 2,727,906$ 14,074,243$
Adjustments to reconcile net cash provided by (used for) operating activities:
Depreciation 14,000,339 2,460,519 16,460,858
Gain on disposition of capital assets (2,602) (2,602)
(Increase) decrease in:
Accounts receivable (123,844) 49,366 (74,478)
Due from other governments 251,909 259,631 511,540
Prepaid expenses 437,953 - 437,953
Increase (decrease) in:
Accounts payable 1,233,258 (815,166) 418,092
Retentions payable - 26,412 26,412
Due to other governments (493,775) 178,007 (315,768)
Accrued liabilities (1,405,975) - (1,405,975)
Unearned revenue 67,007 (30,972) 36,035
Net pension liability 1,300,356 - 1,300,356
Pension related deferred outflows (679,468) - (679,468)
Pension related deferred inflows (28,455) - (28,455)
Net OPEB liability 23,169 - 23,169
OPEB related deferred outflows (37,736) - (37,736)
OPEB related deferred inflows (7,298) - (7,298)
Total adjustments 14,534,838 2,127,797 16,662,635
Net cash provided by (used for) operating activities 25,881,175$ 4,855,703$ 30,736,878$
NONCASH INVESTING, CAPITAL AND FINANCING ACTIVITIES
Bond premium amortization (2,440,038)$ -$ (2,440,038)$
Refunding loss amortization 36,325 - 36,325
Capital asset purchase included in accounts payable 389,151 182,917 572,068
See accompanying Notes to the Basic Financial Statements.
Business-type Activities - Enterprise Funds Totals
45

This page intentionally left blank.
46

NOTES TO THE BASIC FINANCIAL STATEMENTS
47

This page intentionally left blank.
48

San Diego Association of Governments Notes to the Basic Financial Statements For the Fiscal Year Ended June 30, 2020
I. SUMMARY OF SIGNIFICANT ACCOUNTING POLICIES
The basic financial statements of the San Diego Association of Governments (SANDAG) have been prepared in conformity with generally accepted accounting principles (GAAP) in the United States as applied to governmental units. The Governmental Accounting Standards Board (GASB) is the accepted standard-setting body of establishing governmental accounting and financial reporting principles. The more significant of SANDAG accounting policies are described below.
A. Reporting entity
SANDAG was formed under a Joint Powers Agreement dated September 10,1972 and was originally named the Comprehensive Planning Organization. The Joint Powers Agreement was amended on November 5, 1980, to change the agency’s name to the San Diego Association of Governments. The member agencies include 18 incorporated cities from the San Diego region and the County of San Diego, California.
On January 1, 2003, SANDAG became a legislatively created regional government agency pursuant to the San Diego Regional Transportation Consolidation Act (Public Utilities Code Section 132350, et seq.). The SANDAG Board of Directors (Board) includes representatives from the 18 incorporated cities in the San Diego region and the County of San Diego. The effect of this legislation was to make SANDAG a permanent, rather than voluntary, association of local governments and to increase the SANDAG responsibilities and powers. The act also required the consolidation of the planning, programming, project development, and construction functions of the San Diego Metropolitan Transit Development Board, currently known as the Metropolitan Transit System (MTS) and the North San Diego County Transit Development Board, currently known as the North County Transit District (NCTD), into SANDAG.
As required by GAAP, these financial statements present SANDAG and its component units, entities for which SANDAG is considered to be financially accountable. Blended component units, although legally separate units are, in substance, part of an agency’s operations, and so data from these units are combined with data of the agency. Discretely presented component units, on the other hand, are reported in a separate column in the combined financial statements to emphasize they are legally separate from the agency. SANDAG has two blended component units and one discretely presented component unit. All component units have a June 30 year end.
Included within the reporting entity as blended component units:
San Diego County Regional Transportation Commission (Commission) – The Commission is the agency established for the purpose of, and is responsible for, the implementation and administration of transportation improvement programs funded by the San Diego countywide one-half percent sales tax that was effective April 1, 1988, through 2008, as a result of the passage of Proposition A – The San Diego County Transportation Improvement Program. On November 2, 2004, the voters of San Diego County voted to extend the one-half percent sales tax for 40 more years to 2048. The Commission’s governing board is the same as the SANDAG governing board. The Commission exclusively benefits SANDAG and SANDAG member agencies. The Commission is presented as two funds: (1) a special revenue fund type; and (2) a debt service fund type.
49

San Diego Association of Governments Notes to the Basic Financial Statements, Continued
For the Fiscal Year Ended June 30, 2020
SourcePoint – On April 15, 1982, SANDAG formed a nonprofit 501(c)(3) corporation, SourcePoint, for the purpose of providing fee-based products and services that meet the needs of decision-makers in the public and private sectors, while enhancing the quality and extent of demographic, economic, transportation, land use, criminal justice, and other information maintained in the Regional Information System. The SourcePoint governing board is the SANDAG Executive Committee, which is made up of six voting members from among the primary and alternate voting members of the SANDAG governing board. As a blended component unit of SANDAG, all of the members of the SourcePoint board are primary voting members of the SANDAG governing body, and SANDAG can, therefore, impose its will on SourcePoint activities. SANDAG is financially responsible for and benefits exclusively from SourcePoint activities. SourcePoint provides services directly to the public.
Included within the reporting entity as a discretely presented component unit:
Automated Regional Justice Information System (ARJIS) – ARJIS is a Joint Powers Agency established in December 1980 under a joint powers agreement with the County of San Diego and all municipalities in the County, including the City of San Diego. In January 2004, the joint powers agreement was amended, as public agencies of the San Diego region recognized the need for continued operation, maintenance, enhancement, and implementation of ARJIS in order to provide improved law enforcement capabilities within the San Diego region and designated SANDAG as the administrator, effective July 1, 2004. ARJIS provides a regional complex criminal justice enterprise information system utilized by more than 50 local, state, and federal agencies in the San Diego region. The ARJIS governing board is the SANDAG Public Safety Committee, which is made up of six members from among the primary and alternate voting members of the SANDAG governing board, as well as six voting public safety representatives, and various public safety advisory members. The ARJIS governing board is not substantively the same as the entire SANDAG governing board; however, a voting majority of the ARJIS board can be primary or alternate voting members of the SANDAG governing board, and SANDAG is the administrator of ARJIS. Therefore, SANDAG can and does impose its will on ARJIS activities. ARJIS provides services directly to the public.
Complete audited individual financial statements for the Commission, SourcePoint, and ARJIS component units may be obtained from SANDAG, 401 B Street, Suite 800, San Diego, California 92101, (619) 699-1900, sandag.org.
B. Government-wide and fund financial statements
The government-wide financial statements (i.e., the statement of net position and the statement of activities) report information on all of the activities of the primary government and its discretely presented component unit. For the most part, the effect of interfund activity has been removed from these statements. Governmental activities, which normally are supported by taxes and intergovernmental revenues, are reported separately from business-type activities, which rely to a significant extent on fees and charges for support. The primary government is reported separately from the legally separate, discretely presented component unit for which the primary government is financially accountable.
50

San Diego Association of Governments Notes to the Basic Financial Statements, Continued
For the Fiscal Year Ended June 30, 2020
The statement of activities demonstrates the degree to which the direct expenses of a given function or segment are offset by program revenues. Direct expenses are those that are clearly identifiable with a specific function or segment. Program revenues include: (1) charges to customers or applicants who purchase, use, or directly benefit from goods, services, or privileges provided by a given function or segment; and (2) grants and contributions that are restricted to meeting the operational or capital requirements of a particular function or segment. Taxes and other items not properly included among program revenues are reported instead as general revenues. Separate financial statements are provided for governmental funds and proprietary funds.
C. Measurement focus, basis of accounting, and financial statement presentation
Government-wide financial statements are reported using the “economic resources” measurement focus and the accrual basis of accounting. Revenues are recorded when earned, and expenses are recorded when a liability is incurred, regardless of the timing of related cash flows. Sales tax is recognized as revenue in the year in which it is earned. Grants and similar items are recognized as revenue as soon as all eligibility requirements imposed by the provider have been met.
Governmental fund financial statements are reported using the “current financial resources” measurement focus and the modified accrual basis of accounting. Revenues are recognized as soon as they are both measurable and available. Revenues are considered available when they are collectible within the current period or soon enough thereafter (generally 120 days after year end) to pay liabilities of the current period. Expenditures generally are recorded when a liability is incurred, as under accrual accounting; however, debt service expenditures, as well as expenditures related to compensated absences, and claims and judgments, are recorded only when payment is due.
Revenues which are considered susceptible to accrual include sales tax, interest, and state and federal grants. In applying the subject to accrual concept to state and federal revenues, the legal and contractual requirements of the numerous individual programs are used as guidance.
Other revenues are recorded as revenues when received in cash because they are generally not measurable until received.
Proprietary funds distinguish operating revenues and expenses from nonoperating items. Operating revenues and expenses generally result from providing services and producing and delivering goods in connection with a proprietary fund’s principal ongoing operations. The principal operating revenues of SANDAG proprietary funds are toll revenues, charges for services, and iCommute promotions. Operating expenses for proprietary funds include roadway maintenance, cost of services, administrative expenses and depreciation on capital assets. All revenues and expenses not meeting this definition are reported as nonoperating revenues and expenses.
SANDAG reports the following major governmental funds:
The general fund is the SANDAG primary operating fund. It accounts for all financial resources of the general government, except those required to be accounted for in another fund. Revenues are primarily derived from local Transportation Development Act (TDA) funds, member agency assessments, and cost recovery related to labor and overhead costs which are recovered through
51

San Diego Association of Governments Notes to the Basic Financial Statements, Continued
For the Fiscal Year Ended June 30, 2020
operating and capital grants. Expenditures are primarily for general government overhead, net of cost recovery.
The special revenue San Diego County Regional Transportation Commission sales tax projects fund (Commission sales tax projects fund) accounts for the activities and resources of the Commission, a blended component unit, received pursuant to the countywide one-half percent local sales tax. These revenues are passed through to other governmental agencies to be spent in accordance with the TransNet ordinances, transferred to other SANDAG governmental funds, or transferred to the Commission’s debt service fund to make principal and interest payments on the long-term debt sales tax revenue bonds, short-term notes and commercial paper.
The capital projects fund accounts for the resources and activities of SANDAG to provide for highway improvements and rail and bus capital improvements, and replacements and other capital implementation projects. Revenues are primarily derived from federal and state capital grants, TDA, and TransNet funds.
The San Diego County Regional Transportation Commission debt service fund (Commission debt service fund) accounts for the activities and resources accumulated for principal and interest payments on the long-term debt sales tax revenue bonds, short-term notes and commercial paper of the Commission, a blended component unit. Revenues are derived from interest earned on investments accumulated for the payment of principal and interest on the bonds, notes and commercial paper, proceeds of bonds, debt repayments from other governmental agencies, and the federal subsidy related to the 2010 Build America Bonds (BABs) issuance.
The SANDAG debt service fund accounts for the activities and resources accumulated for principal and interest payments on the long-term debt Capital Grant Receipts revenue bonds to finance a portion of the costs of the design and construction of the Mid-Coast Corridor Transit Project. Revenues are derived from interest earned on investments accumulated for the payment of principal and interest on the bonds and grant proceeds received from the U.S. Department of Transportation, Federal Transit Administration.
SANDAG reports the following other governmental fund types:
The special revenue general services fund accounts for the activities and resources of SANDAG to provide primarily for modeling and research, criminal justice, sustainable development, sustainable mobility programs and services, internal and external coordination and bicycle facilities. Revenues are primarily derived from federal, state, and local operating grants and contributions.
The special revenue San Diego Service Authority for Freeway Emergencies (SAFE) fund accounts for the activities of the SAFE program, which is responsible for purchasing, installing, operating, and maintaining a motorist aid system of call boxes in San Diego County. The SAFE program operation was transferred from the County of San Diego to SANDAG as of January 1, 2013, by the adoption of Assembly Bill No. 1572 (Fletcher, 2012).
SANDAG reports the following major proprietary funds:
52

San Diego Association of Governments Notes to the Basic Financial Statements, Continued
For the Fiscal Year Ended June 30, 2020
The State Route 125 toll road (SR 125) fund accounts for the activities of the SANDAG SR 125 toll road, an 11.2-mile, limited-access highway in the County of San Diego. On December 21, 2011, SANDAG acquired the rights and interest in a Franchise Agreement between South Bay Expressway, LLC, and Caltrans. Under the Agreement, SANDAG has contractual rights to develop and operate the SR 125 toll road. The SR 125 fund was established in December 2011 as a proprietary fund under the oversight of SANDAG to operate the toll road.
SANDAG reports the following other proprietary fund types:
The Service Bureau fund accounts for activities of the SANDAG Service Bureau, which is a fee-based operation providing informational and technical services to member agencies, nonmember government agencies, private organizations, and individuals. The purpose of the Service Bureau is to offer products and services that meet the needs of decision-makers in the public and private sectors, while enhancing the quality and extent of demographic, economic, transportation, land use, criminal justice, and other information maintained in the SANDAG Regional Information System and the technology used to support it. One of the goals of the Service Bureau is to generate revenue to update and enhance the Regional Information System.
The SourcePoint fund, a blended component unit 501(c)(3) nonprofit agency, accounts for fee-based products and services of projects for clients with a requirement to conduct business with a nonprofit agency.
The Interstate 15 (I-15) FasTrak® fund accounts for the activities of the I-15 FasTrak program, which allows solo drivers to pay a toll to use the 16 miles of express lanes on I-15.
The Property Management fund accounts for the operating activities of commercial buildings and land purchased by SANDAG in the current fiscal year for the benefit and in support of the Mid-Coast Corridor Transit project undertaken by SANDAG.
Interfund balances and transfers have been eliminated from the government-wide financial statements. However, interfund services provided and used are not eliminated in the process of consolidation.
Amounts reported as program revenues include: (1) charges to customers or other governmental agencies for services or privileges provided; (2) operating grants and contributions; and (3) capital grants and contributions. Internally dedicated resources are reported as general revenues rather than as program revenues. Likewise, general revenues include sales tax and other general revenues not restricted to specific programs.
Certain eliminations have been made as prescribed by GASB Statement No. 34 in regard to interfund activities, payables, and receivables. All internal balances in the statement of net position have been eliminated except those representing balances between the governmental activities and the business-type activities, which are presented as internal balances and eliminated in the total primary government column. In the statement of activities, those transactions between governmental and business-type activities have not been eliminated.
53

San Diego Association of Governments Notes to the Basic Financial Statements, Continued
For the Fiscal Year Ended June 30, 2020
D. Budgetary information
1. Budgetary basis of accounting
An annual budget is adopted on a basis consistent with GAAP for the general fund, special revenue funds, debt service funds, proprietary funds, and capital projects fund.
2. Appropriations in excess of expenditures
The Commission sales tax projects fund ended the year with $9,539,542 of expenditures in excess of appropriations, which is primarily the result of sales tax used for local street improvements, major corridor environmental mitigation programs and bicycle facilities. This fund is budgeted based on estimated sales tax revenues and does not include the use of debt proceeds or unspent revenue received in prior years.
The Commission debt service fund expenditures were $29,787,468 below appropriations at June 30, 2020, which was primarily the result of the refunding of the 2010, 2012 and 2014 bonds in addition to the excess of variable-rate interest and swap payments and other costs on the 2008, 2010, 2012, 2014, 2016, 2018, 2019 and 2020 Series bonds.
E. Assets, liabilities, deferred outflows/inflows of resources, and net position/fund balance
1. Cash and investments
SANDAG considers all highly liquid investments with maturities of 90 days or less at the acquisition date to be cash and cash equivalents because they are readily convertible to known amounts of cash and are so near their maturity that they present an insignificant risk of change in value. Securities purchased with a maturity date greater than three months at the date of acquisition have been classified as investments.
SANDAG investment policies are in accordance with California Government Code Section 53601. See Note II.A.3 for further detail of allowable investments.
SANDAG voluntarily participates in an investment pool managed by the State of California, titled Local Agency Investment Fund (LAIF). Deposits in the LAIF pool are presented as cash and cash equivalents as they are available for immediate withdrawal or deposit at any time without prior notice or penalty and there is no significant risk of principal loss. The LAIF investments are subject to credit risk with the full faith and credit of the State of California collateralizing these investments. In addition, these structured notes and asset-backed securities are subject to market risk and to change in interest rates. The reported value of the pool is at amortized cost and is not rated. At June 30, 2020, LAIF had an average maturity of 191 days.
SANDAG is a voluntary participant in the CAMP, which is an investment pool, offered by the California Asset Management Trust. The trust is a joint powers authority and public agency created by the Declaration of Trust and established under the provisions of the California Joint Exercise of Powers Act (California Government Code Sections 6500, et seq.) for the purpose of exercising the common power of its participants to invest certain proceeds of debt issues and
54

San Diego Association of Governments Notes to the Basic Financial Statements, Continued
For the Fiscal Year Ended June 30, 2020
surplus funds. In accordance with Section 53601(p) of the California Government Code, CAMP’s investments are limited to investments permitted by subdivisions (a) to (n), inclusive, of Section 53601. Deposits in the CAMP are presented as cash and cash equivalents as they are available for immediate withdrawal or deposit at any time without prior notice or penalty and there is no significant risk of principal loss. SANDAG reports its investments in CAMP at amortized cost provided by CAMP, which is the same as the value of the pool share. At June 30, 2020, the pool had an average maturity of 53 days.
SANDAG also voluntarily participates in the San Diego County Treasurer’s Pooled Money Fund (Pool), which is administered by the Treasurer-Tax Collector’s Office. Deposits in the Pool are presented as cash and cash equivalents as they are available for withdrawal with two days’ notice or immediate deposit at any time without prior notice or penalty and there is no significant risk of principal loss. The fair value of the SANDAG investment in the Pool is reported at amounts based upon the SANDAG pro rata share of the fair value provided by the Treasurer-Tax Collector’s Office for the entire portfolio (in relation to the amortized cost of that portfolio). The balance available for withdrawal is based on the accounting records maintained by the Treasurer-Tax Collector’s Office, which is recorded on the amortized cost basis. Earnings realized on investments based on amortized cost are distributed to Investment Pool participants. Section 27013 of the California Government Code authorizes the Treasurer-Tax Collector’s Office to deduct administrative fees related to investments. The net realized earnings on investments are apportioned to Pool participants quarterly, based on the participants’ average daily balances. The County’s annual financial report for the Pool can be obtained from the Treasurer-Tax Collector at 1600 Pacific Highway, Room 162, San Diego, California, 92101, and also can be accessed at www.sdttc.com.
In accordance with GASB Statement No. 40, Deposit and Investment Risk Disclosures (an amendment of GASB Statement No. 3), SANDAG adheres to certain disclosure requirements. See Note II.A for more detail.
2. Fair value measurements
Certain assets and liabilities are required to be reported at fair value. The fair value framework provides a hierarchy that prioritizes the inputs to valuation techniques used to measure fair value. The hierarchy gives the highest priority to unadjusted quoted prices in active markets for identical assets or liabilities (Level 1 measurements) and the lowest priority to unobservable inputs (Level 3 measurements). The three levels of fair value hierarchy are described as follows:
Level 1 – Inputs to the valuation methodology are unadjusted quoted prices for identical assets or liabilities in active markets.
Level 2 – Inputs other than quoted prices included within Level 1 that are observable for the asset or liability, either directly or indirectly, and fair value is determined through the use of models or other valuation methodologies including:
Quoted prices for similar assets or liabilities in active markets;
Quoted prices for identical or similar assets or liabilities in markets that are inactive;
55

San Diego Association of Governments Notes to the Basic Financial Statements, Continued
For the Fiscal Year Ended June 30, 2020
Inputs other than quoted prices that are observable for the asset or liability;
Inputs that are derived principally from or corroborated by observable market data by correlation or other means.
Level 3 – Inputs to the valuation methodology are unobservable and significant to the fair value measurement. These unobservable inputs reflect SANDAG’s own assumptions about the inputs market participants would use in pricing the asset or liability (including assumptions about risk). These unobservable inputs are developed based on the best information available in the circumstances and may include SANDAG’s own data.
3. Accounts receivable
Accounts receivable are recognized when invoiced to customers. As of June 30, 2020, an allowance for uncollectible accounts was provided for accounts receivable. The allowance is determined by management to be uncollectible amounts based on historical collection percentages and other information.
4. Interfund receivables and payables
Activities between funds that are representative of short-term lending and borrowing arrangements outstanding at the end of the fiscal year are referred to as “due to/from other funds”.
5. Prepaid items
Payments made to vendors for services that will benefit periods beyond June 30, 2020, are recorded as prepaid items in both government-wide and fund financial statements. The cost of prepaid items is recorded as expenditures/expenses when consumed rather than when purchased.
6. Restricted assets
Certain cash and cash equivalents and investments are restricted as these assets are restricted for debt service, their use is limited externally by applicable bond covenants, the assets are held for payment of future capital contract retention liabilities to be paid as work is completed, or the assets are set aside and held for TransNet environmental mitigation purposes.
7. Capital assets
Capital assets are reported in the applicable governmental or business-type activities in the government-wide financial statements, net of accumulated depreciation, except for construction-in-progress, land and easements which are not depreciated. Capital assets are defined by SANDAG as assets with an initial individual cost of equal to or greater than $5,000 and a useful life in excess of one year. Such assets are recorded at historical cost or estimated historical cost if purchased or constructed.
56

San Diego Association of Governments Notes to the Basic Financial Statements, Continued
For the Fiscal Year Ended June 30, 2020
The purchase of the SR 125 toll road and related assets were valued on the acquisition date at fair value. Donated capital assets are recorded at acquisition value rather than fair value at the date of donation.
The cost of normal maintenance and repairs that do not add to the value of the asset or materially extend the asset’s life are expensed.
Capital assets are carried at cost and depreciated using the straight-line method based on the estimated useful life of the asset as follows:
Office equipment 3
Computer equipment 3
Equipment and other 5
Vehicles 5
Leasehold improvements 5
Internally generated computer software 5
Electronic toll collection system 10
Buses 12
Toll road 31
Buildings 50
Land Improvements 5
Useful Life in Years
Asset Type
8. Deferred outflows/inflows of resources
In addition to assets, the statement of net position reports a separate section for deferred outflows of resources, which represents a consumption of assets that applies to a future period and so will not be recognized as an outflow of resources (expense/expenditure) until then. SANDAG has four items that qualify for reporting in this category in the government-wide statement of net position: (1) the accumulated decrease in fair value of the hedging swap agreement; (2) the deferred charge on refunding loss; (3) the pension-related amounts for the year based upon the accounting valuation (actuarial) report; and (4) the other post-employment benefit (OPEB) related amounts for the year based upon the accounting valuation (actuarial) report. See Note II.G for more information on SANDAG long-term debt.
In addition to liabilities, the statement of net position reports a separate section for deferred inflows of resources which represents an acquisition of assets that applies to a future period(s) and so will not be recognized as an inflow of resources (revenue) until that time. SANDAG has three types of this item that are reported in this category in the government-wide statement of net position: (1) pension-related amounts for the year based upon the accounting valuation (actuarial) report; (2) OPEB-related amounts for the year based upon the accounting valuation (actuarial) report; and (3) gains on advance refunding of debts.
57

San Diego Association of Governments Notes to the Basic Financial Statements, Continued
For the Fiscal Year Ended June 30, 2020
Unavailable revenue arises only under a modified accrual basis of accounting that qualifies for reporting in this category and, therefore, is reported only in the governmental funds balance sheet. The governmental funds report unavailable revenues in the capital projects fund, Commission debt service fund, and general services fund. These amounts are deferred and recognized as an inflow of resources in the period the amounts become available.
9. Net position
The difference between assets and deferred outflows of resources, and liabilities and deferred inflows of resources is “Net Position” on government-wide and proprietary fund financial statements.
The following terms are used in the reporting of net position:
Net investment in capital assets consists of capital assets, net of accumulated depreciation, reduced by outstanding debt attributed to the acquisition, construction or improvement of these assets.
Restricted net position consists of restricted assets reduced by liabilities and deferred inflows of resources related to those assets. The following terms are used in the reporting of restricted net position:
Debt service and other liabilities consists of payments for future debt service.
Environmental mitigation consists of funding of various TransNet environmental mitigation projects.
Major maintenance post-acquisition consists of assets collected for the SR 125 toll road major maintenance projects.
Project revenue consists of other legally restricted assets of the SR 125 proprietary fund.
Toll road operations and improvements consists of assets collected for activities of the I-15 FasTrak program.
Customer prepaid reserve consists of advance payments made by the SR125 toll road users.
Property management consists of operating activities of the property acquired related to the Mid-Coast Corridor Transit Project.
Freeway emergency service consists of funding for the SAFE program.
iCommute consists of assets received for the iCommute program. Certain iCommute activities are performed through SourcePoint, including providing regional information services, promotions, and programs for commuter services. The majority of iCommute activities are performed through SANDAG; however, cash donations that are made by
58

San Diego Association of Governments Notes to the Basic Financial Statements, Continued
For the Fiscal Year Ended June 30, 2020
iCommute sponsors are paid to SourcePoint to utilize the 501(c)(3) status. Those cash donations are used to purchase promotional items to encourage participation in the iCommute program. In fiscal year 2020, iCommute promotional expenses exceeded iCommute revenue generated through cash donations by $7,094.
Unrestricted net position consists of net position that does not meet the definition of net investment in capital assets or restricted net position.
The governmental activities unrestricted net deficit of $870,635,557 results primarily from the issuance of the $2,824,520,000 sales tax revenue bonds in 2008 (net of refunding), 2010 (net of refunding), 2012 (net of refunding), 2014 (net of refunding), 2016, 2019, 2020, the sales tax revenue short-term note in 2018, and the 2019 capital grant receipts revenue bonds, for transportation-related projects, primarily major corridor and the bicycle pedestrian program. The Commission plans to repay the bonds with future sales tax revenue which is dedicated for transportation projects. The short-term note will be repaid with the Transportation Infrastructure Finance and Innovation Act (TIFIA) loan. See Note II.F on long-term debt for further information.
The business-type activities unrestricted net position of $503,486 results from the operations of the Service Bureau and SourcePoint programs.
10. Net position flow assumption
SANDAG funds outlays for particular purposes from both restricted (e.g., restricted bond or grantproceeds) and unrestricted resources. In order to calculate the amounts to report as restrictednet position and unrestricted net position in the government-wide and proprietary fund financialstatements, a flow assumption must be made about the order in which the resources areconsidered to be applied. It is SANDAG policy to consider restricted net position to have beendepleted before unrestricted net position is applied.
11. Fund balance
In the fund financial statements, governmental funds report fund balances as nonspendable,restricted, committed, assigned or unassigned based on the extent to which the Commission isbound to observe constraints imposed on the use of resources:
Nonspendable fund balance – amounts that cannot be spent because they are either (a) notspendable in form (such as prepaids) or (b) legally or contractually required to be maintainedintact (such as endowments).
Restricted fund balance – amounts with constraints placed on their use that are (a) externallyimposed by creditors, grantors, contributors or laws or regulations of other governments, or (b)imposed by law through constitutional provisions or enabling legislation. If the Board actionlimiting the use of funds is included in the same action (legislation) that created (enables) thefunding source, then it is restricted.
59

San Diego Association of Governments
Notes to the Basic Financial Statements, Continued
For the Fiscal Year Ended June 30, 2020
Committed fund balance – amounts that can only be used for specific purposes imposed by a
formal action of the Board. The Board uses resolutions to commit fund balances. It includes
legislation (Board action) that can only be overturned by new legislation requiring the same type
of voting consensus that created the original action. Therefore, if the Board action limiting the use
of the funds is separate from the action (legislation) that created (enables) the funding source,
then it is committed, not restricted.
Assigned fund balance – amounts that are constrained by the Board’s intent to be used for specific
purposes, but do not meet the criteria to be classified as restricted or committed and does not
require a formal action like a resolution or ordinance. The Board has not delegated to any other
persons or bodies the authority to assign fund balance to specific purposes.
Unassigned fund balance – residual amounts which are not included in one of the other
classifications and is the residual classification for the General Fund. The General Fund should
be the only fund that reports a positive unassigned fund balance amount. In other governmental
funds, if expenditures incurred for specific purposes exceeded the amounts restricted, committed,
or assigned to those purposes, it may be necessary to report a negative unassigned fund balance.
The capital projects and general services funds report negative unassigned fund balances at year
end due to timing of revenue recognition.
12. Fund balance flow assumptions
Sometimes SANDAG will fund outlays for a particular purpose from both restricted and
unrestricted resources (the total of committed, assigned, and unassigned fund balance). In order
to calculate the amounts to report as restricted, committed, assigned, and unassigned fund
balance in the governmental fund financial statements, a flow assumption must be made about
the order in which the resources are considered to be applied. It is SANDAG policy to consider
restricted fund balance to have been depleted before using any of the components of unrestricted
fund balance. Further, when the components of unrestricted fund balance can be used for the
same purpose, committed fund balance is depleted first, followed by assigned fund balance.
Unassigned fund balance is applied last.
13. Long-term debt
In the government-wide financial statements, long-term debt obligations are reported as liabilities
in the governmental activities of the statement of net position. Debt premiums and discounts are
amortized over the life of the bonds or short-term notes using the effective interest method. Debt
payable is reported net of the applicable bond or short-term note premium or discount. Debt
issuance costs are expensed in the period in which they are incurred.
See Note II.G for more information on SANDAG long-term debt.
60
San Diego Association of Governments Notes to the Basic Financial Statements, Continued
For the Fiscal Year Ended June 30, 2020
14. Other post-employment benefits (OPEB)
For purposes of measuring the net OPEB liability, deferred outflows and inflows of resources related to OPEB and OPEB expense, information about the fiduciary net position of the SANDAG plan (OPEB Plan), the assets of which are held by the California Employers’ Retiree Benefit Trust (CERBT), and additions to/deductions from the OPEB Plan’s fiduciary net position have been determined on the same basis they are reported by CERBT. For this purpose, benefit payments (including refunds of employee contributions) are recognized when due and payable in accordance with the benefit terms. Investments are reported at fair value. OPEB liabilities are liquidated by the general fund.
GASB 75 requires that the reported results must pertain to liability and asset information within certain defined timeframes. For this report, the following timeframes are used:
Valuation Date June 30, 2019 Measurement Date June 30, 2019 Measurement Period July 1, 2018 to June 30, 2019
15. Pensions
For purposes of measuring the net pension liability, deferred outflows and inflows of resources related to pensions, pension expense, information about the fiduciary net position, and additions to/deductions from the fiduciary net position have been determined on the same basis as they are reported by CalPERS. For this purpose, benefit payments (including refunds of employee contributions) are recognized when due and payable in accordance with the benefit terms. Investments are reported at fair value. Pension liabilities are liquidated by the general fund.
GASB 68 requires that the reported results must pertain to liability and asset information within certain defined timeframes. For this report, the following timeframes are used:
Valuation Date June 30, 2018 Measurement Date June 30, 2019 Measurement Period July 1, 2018 to June 30, 2019
16. Compensated absences
It is SANDAG policy to permit employees to accumulate earned but unused vacation and sick pay benefits. A liability for these amounts is reported in governmental funds only if they have matured, for example, as a result of employee resignations and retirements; and proprietary funds report compensated absence amounts when earned. Based on the reduction in the compensated absences payables governmental funds of $3,308,698 and proprietary funds of $445,714, during fiscal year 2020, it was determined that the entire balance of compensated absences reported at June 30, 2020, is expected to be exhausted in fiscal year 2021. Because the turnover each year nets to approximately $0, the entire balance is reported as current. Compensated absences are liquidated by the general fund.
61

San Diego Association of Governments Notes to the Basic Financial Statements, Continued
For the Fiscal Year Ended June 30, 2020
17. Unearned revenues
In the government-wide and fund financial statements, unearned revenues are resource inflows that do not meet the criteria for revenue recognition. Unearned revenues arise when resources are received by SANDAG before it has a legal claim to them, such as grant monies received prior to incurring the qualifying expenditures. When revenue recognition criteria are met, or when SANDAG has a legal claim to the resources, unearned revenue is removed from the Statement of Net Position and the revenue is recognized.
18. Other financing sources and uses
In the fund financial statements, issuance of debt, including commercial paper, bonds, short-term notes, premium on bonds and notes issued, and transfers in are reported as other financing sources. Transfers out and discounts on bonds issued are reported as other financing uses.
19. Estimates
The preparation of basic financial statements in conformity with GAAP in the United States requires management to make estimates and assumptions that affect reported amounts of certain assets and liabilities, disclose contingent assets and liabilities at the date of the basic financial statements, and disclose the reported amounts of revenues and expenditures during the reporting period. Actual results could differ from those estimates.
20. Effects of new pronouncements
There were no new pronouncements having an impact on the financial statements in FY 2020.
21. Recent Event
In December 2019, a novel strain of coronavirus has spread around the world resulting in business and social disruption. The coronavirus was declared a Public Health Emergency of International Concern by the World Health Organization on January 30, 2020. In March 2020, the State of California issued a statewide shelter-in-place order that continues to have a significant impact on the operations and business results SANDAG. The extent to which the coronavirus may impact business activity or investment results will depend on future developments, which are highly uncertain and cannot be predicted, including new information which may emerge concerning the severity of the coronavirus and the actions required to contain the coronavirus. Management has not included any contingencies in the financial statements specific to this recent event.
62

San Diego Association of Governments Notes to the Basic Financial Statements, Continued
For the Fiscal Year Ended June 30, 2020
II. DETAILED NOTES ON ALL FUNDS
A. Cash and investments
Cash, cash equivalents, and investments consisted of the following as of June 30, 2020:
Investment Type Amount
Weighted Average Maturity (Days)
NRSRO Rating
Cash and cash equivalents:Cash - demand deposits 108,939,627$ 1 Not ratedCash equivalents - NCTD Certificates of Participation 23,050,000 79 NR,A1State of California Local Agency Investment Fund 68,025,348 191 Not ratedCalifornia Asset Management Program 292,086,863 53 AAAmSan Diego County Treasurer's Pooled Money Fund 184,042,339 556 AAAf / S1
Total Primary Government cash and cash equivalents 676,144,177 196
Investments:U.S. Agencies 195,478,001 636 AA+, AaaCorporate Medium-Term Notes 71,531,263 737 A- to AAASupranational Agency Bond/Note 24,879,834 153 AAA,AaaCertificates of Deposit 6,431,654 82 A-1, A-1+Asset-Backed Security 5,786,654 820 AAA,Aaa
Total Primary Government investments 304,107,406 612
Total Primary Government cash, cash equivalents,and investments 980,251,583 282
ARJIS:Cash - demand deposits 261,251 1 Not ratedCalifornia Asset Management Program 5,736,451 53 AAAmSan Diego County Treasurer's Pooled Money Fund 2,617,063 556 AAAf / S1
Total ARJIS cash and cash equivalents 8,614,765 324
Total cash, cash equivalents, and investments 988,866,348$
At year end, the primary government’s carrying amount of deposits was $108,939,627, and the bank balance was $118,624,002.
At year end, ARJIS’ carrying amount of deposits was $261,251 with $65,435 in outstanding checks, aggregating to the bank balance of $326,686. This balance was covered by federal depository insurance.
SANDAG is invested in two forward contract pay-variable, receive-variable investment derivative instruments with notional amounts of $156,600,000 each. At the effective date of April 1, 2018, SANDAG began making monthly variable payments to the counterparty based on the current Securities Industry and Financial Markets Association (SIFMA) Swap Index and received variable
63

San Diego Association of Governments Notes to the Basic Financial Statements, Continued
For the Fiscal Year Ended June 30, 2020
payments based on 107.4 percent of three-month London Interbank Offered Rate (LIBOR). At June 30, 2020, these investment derivative instruments had a fair value of $6,363,787, net of interest, and are not rated. Other applicable risks (credit risk, interest rate risk, basis risk, termination risk, roll-over risk, etc.) associated with the SANDAG investment derivative instruments are described in Note II.E.
1. Interest rate risk
Interest rate risk is the risk that changes in interest rates will adversely affect the fair value of an investment. Generally, the longer the maturity of an investment, the greater the sensitivity of its fair value to changes in market interest rates. To limit losses from interest rate risk, investments are generally limited to a maturity of 5 years or less, unless express authority is granted by the board. Endowment funds may also be invested in securities with maturities longer than 5 years with executive approval and given maturity does not exceed use of funds. Furthermore, SANDAG does not have callable step up United States Agency securities and holds investments in liquidity to sustain operations for the next 6 months. SANDAG is in compliance with all provisions of the investment policy.
2. Credit risk
Investments are subject to credit risk, which is the chance that an issuer will fail to pay principal or interest in a timely manner, or that negative perceptions of the issuer’s ability to make these payments will cause price to decline. SANDAG maintains policies to manage credit risks, which include requiring minimum credit ratings issued by nationally recognized statistical rating organizations for its investments.
The portfolio is diversified by security type and institution to avoid incurring unreasonable and avoidable risks regarding specific security types or individual financial institutions. Credit requirements listed in the investment policy apply at the time of purchase. In the event a security held by SANDAG is subject to a credit rating change that brings it below the minimum credit ratings specified for purchase, the Chief Financial Officer shall review the security. The course of action to be followed will then be decided by the Chief Financial Officer and either the Executive Director or the Chief Deputy Executive Director on a case-by-case basis, considering such factors as the reason for the change, prognosis for recovery or further rate drops, and the market price of the security. Any credit rating changes below the minimum credit ratings specified for purchase will be reported to the Board along with the findings and any actions taken.
The SANDAG portfolio is in compliance with all minimum rating requirements of the investment policy and did not experience any credit rating changes that brought a security below the minimum required credit ratings.
3. Concentration of credit risk
Concentration of credit risk is the risk associated with a lack of diversification or having too much invested in a few individual issuers. As disclosed in the table below, SANDAG maintains investment policies that establish thresholds for holdings of individual securities. SANDAG did not have any holdings meeting or exceeding the allowable threshold levels as of June 30, 2020.
64

San Diego Association of Governments Notes to the Basic Financial Statements, Continued
For the Fiscal Year Ended June 30, 2020
Authorized Investment TypeMaximum Effective Maturity
Maximum Percentage of
Portfolio
Maximum Investment in
One Issuer
Minimum Ratings
Treasury obligations 5 Years N/A N/A N/A
Federal agencies and U.S. government N/Asponsored enterprises 5 Years N/A N/A
State municipal obligations 5 Years N/A N/A A-1/AA
Local agency obligations 5 Years N/A N/A A-1/AA
Repurchase agreements 90 Days N/A N/A A-1
Bankers' acceptances 180 Days 40% 10% A-1
Commercial paper 270 Days 25% 10% A-1
Medium-Term notes 5 Years 30% 10% A
Negotiable certificates of deposits 5 Years 30% N/A A
Nonnegotiable certificates of deposit 5 Years 30% N/A N/A
State of California's Local N/A
agency investment fund (LAIF) N/A Set by LAIF Set by LAIF
San Diego county treasurer's pooled N/A
investment fund N/A Set by LAIF Set by LAIF
Savings/money market accounts 5 Years Not to exceed equity
N/A N/A
California asset management program N/A N/A N/A AA/A-2
Money market funds 5 Years 20% N/A AAA
Mortgage and asset-backed obligations 5 Years 20% N/A AA
Supranationals 5 Years 30% N/A AA
As of June 30, 2020, with the exception of investments that are explicitly guaranteed by the U.S. government and investments in mutual funds, external investment pools, and other pooled investments, SANDAG did not have any investments with more than 5 percent of the total investments under one issuer except for the following securities:
Investment TotalConcentration of
Credit Risk
Federal Home Loans Bank (FHLB) 35,552,363$ 12.74%
Federal Home Loan Mortgage Corp (FHLMC) 21,208,527 7.60%
Federal National Mortgage Association (FNMA) 31,280,662 11.21%Federal Farm Credit Bank 47,335,346 16.96%Inter-American Development Bank 14,615,470 5.24%
65

San Diego Association of Governments Notes to the Basic Financial Statements, Continued
For the Fiscal Year Ended June 30, 2020
4. Custodial credit risk
The California Government Code requires California banks and savings and loan associations to secure SANDAG cash deposits by pledging securities as collateral. This code states that collateral pledged in this manner shall have the effect of perfecting a security interest in such collateral superior to those of a general creditor. Thus, collateral for cash deposits is considered to be held in the SANDAG name.
The market value of pledged securities must equal at least 110 percent of SANDAG cash deposits. California law also allows institutions to secure SANDAG deposits by pledging first trust deed mortgage notes having a value of 150 percent of SANDAG total cash deposits. SANDAG may waive collateral requirements for deposits that are fully insured up to $250,000 by the Federal Deposit Insurance Corporation. SANDAG, however, has not waived the collateralization requirements.
B. Receivables
Receivables as of June 30, 2020 for the primary government were as follows:
Sales tax -$ 60,094,932$ -$ -$ -$ -$ -$ 60,094,932$ Interest 14,001 2,016,929 - 20,027 37,293 - 147,197 2,235,447 Advance to member -
agencies for local - street improvements - - - 79,670,022 - - - 79,670,022
Grants - - 22,113,477 - 13,647,811 - - 35,761,288 Accounts and other 179,824 - 2,209,114 - 1,752,867 4,336,725 1,348,758 9,827,288
Total receivables 193,825$ 62,111,861$ 24,322,591$ 79,690,049$ 15,437,971$ 4,336,725$ 1,495,955$ 187,588,977$
Governmental Funds Proprietary Funds
General Fund
Commission Sales Tax
Projects Fund
Capital Projects
Fund
Commission Debt Service
Fund
Other Government
FundsReceivables
Total Primary Government
SR 125 Toll Road Fund
Non-Major Funds
Receivables as of June 30, 2020 for ARJIS were $1,272,898 which is comprised of $1,361,835 due from other governments for grants or services provided, net of allowance for doubtful account of $99,882 and $10,945 in interest receivable.
To ensure collection of toll revenue, the SR 125 uses a violation enforcement system capable of identifying vehicle license plates at any operating speed. Persons who fail to pay their tolls may be charged a penalty in addition to the toll. The SR 125 accrues violation revenue in an amount management expects to collect the following fiscal year.
Receivables as of June 30, 2020 reported for the SR 125 were $4,336,725 which is primarily comprised of $4,113,080 violations fines receivable, net of an allowance for doubtful accounts. Gross violation receivables as of June 30, 2020 was $56,383,706 with an estimated uncollectible allowance of $52,270,626.
66

San Diego Association of Governments Notes to the Basic Financial Statements, Continued
For the Fiscal Year Ended June 30, 2020
Similar to the SR 125, the I-15 also issues violation tolls and fines to violators. The I-15 is a high-occupancy toll lane, which allows for carpools and other exempt vehicles to use the roadway without charge. The I-15 reported $6,351,227 violation tolls and fines with 100% allowance for doubtful accounts in FY 2020. The I-15 reported other receivables of $30,660 and $146,443 of interest receivable as well.
C. Capital assets
1. Primary government – governmental activities
Capital asset activity for the primary government-governmental activities for the year ended June 30, 2020 was as follows:
Governmental activities:Beginning
BalanceIncreases Decreases Ending Balance
Capital assets, not being depreciated:Construction-in-progress 1,794,819,222$ 486,812,931$ (209,332,687)$ 2,072,299,466$ Land 19,609,644 - - 19,609,644 Easements 15,950,412 1,053,919 - 17,004,331
Total capital assets, not being depreciated 1,830,379,278 487,866,850 (209,332,687) 2,108,913,441
Capital assets, being depreciated:Infrastructure - 207,314,140 (207,314,140) - Office equipment 225,729 - (6,681) 219,048 Computer equipment 7,891,938 802,128 (370,971) 8,323,095 Equipment and other 871,091 - - 871,091 Vehicles 5,753,548 218,390 (45,329) 5,926,609 Buses 164,713 - - 164,713 Leasehold improvements 192,229 162,500 - 354,729 Buildings 5,090,356 - - 5,090,356 Land improvement 5,275 - - 5,275
Total capital assets, being depreciated 20,194,879 208,497,158 (207,737,121) 20,954,916 , ,
Less accumulated depreciation for:Office equipment (212,704) (4,282) 6,681 (210,305) Computer equipment (7,542,027) (399,852) 370,971 (7,570,908) Equipment and other (431,112) (148,570) - (579,682) Vehicles (1,300,246) (1,136,099) 45,328 (2,391,017) Buses (111,654) (13,726) - (125,380) Buildings (231,684) (101,807) - (333,491) Leasehold improvements (192,229) - - (192,229) Land improvement (440) (1,055) - (1,495)
Total accumulated depreciation (10,022,096) (1,805,391) 422,980 (11,404,507)
Total capital assets, being depreciated, net 10,172,783 206,691,767 (207,314,141) 9,550,409
Governmental activities capital assets, net 1,840,552,061$ 694,558,617$ (416,646,828)$ 2,118,463,850$
67

San Diego Association of Governments Notes to the Basic Financial Statements, Continued
For the Fiscal Year Ended June 30, 2020
Depreciation expense was charged to the functions/programs of the governmental activities of the primary government as follows:
Governmental activities: Totals
General government 391,346$ Transit system improvements 40,065 Sustainable mobility programs and services 1,240,943 Major corridor projects 133,037
Total 1,805,391$
Infrastructure assets, as well as title to the assets, if applicable, were contributed to other governmental agencies responsible for public transportation operations. These contributions primarily represent major corridor and transit improvements as noted below.
Governmental agencyCapital
contributions
North County Transit District 80,969,894$ San Diego Metropolitan Transit System 118,697,988 Caltrans 5,676,466 City of San Diego 126,223 County of San Diego 695,500 City of Encinitas 52,685 The San Diego Foundation 1,095,384
Total 207,314,140$
68

San Diego Association of Governments Notes to the Basic Financial Statements, Continued
For the Fiscal Year Ended June 30, 2020
2. Proprietary fund
Capital asset activity for the proprietary fund for the year ended June 30, 2020 was as follows:
Business-type activities:Beginning
BalanceIncreases Decreases Ending Balance
Capital assets, not being depreciated:Construction-in-progress 14,373,104$ 3,973,859$ -$ 18,346,963$ Land 1,980,000 - - 1,980,000
Total capital assets, not being depreciated 16,353,104 3,973,859 - 20,326,963
Capital assets, being depreciated:Office equipment 263,500 10,241 - 273,741 Computer equipment 1,113,372 - (159,172) 954,200 Vehicles 629,989 26,298 (12,420) 643,867 Equipment and other 168,581 5,686 - 174,267 Internally generated software 199,170 27,506 - 226,676 Toll road 402,903,389 - - 402,903,389 Buildings 4,020,000 - - 4,020,000 Electronic toll collection system 23,097,601 - - 23,097,601
Total capital assets, being depreciated 432,395,602 69,731 (171,592) 432,293,741 , ,
Less accumulated depreciation for:Office equipment (243,396) (8,400) - (251,796) Computer equipment (528,635) (285,267) 159,172 (654,730) Vehicles (330,008) (98,753) 9,522 (419,239) Equipment and other (153,888) (6,403) - (160,291) Internally generated software (183,202) (17,496) - (200,698) Toll road (96,901,581) (13,503,620) - (110,405,201) Buildings (603,000) (80,400) - (683,400) Electronic toll collection system (16,388,911) (2,460,519) - (18,849,430)
Total accumulated depreciation (115,332,621) (16,460,858) 168,694 (131,624,785)
Total capital assets, being depreciated, net 317,062,981 (16,391,127) (2,898) 300,668,956
Proprietary activities capital assets, net 333,416,085$ (12,417,268)$ (2,898)$ 320,995,919$
Depreciation expense was charged to the functions/programs of the business-type activities as follows:
Business-type activities: Totals
SR 125 operations 14,000,339$
Interstate 15 FasTrak operations 2,460,519
Total 16,460,858$
69
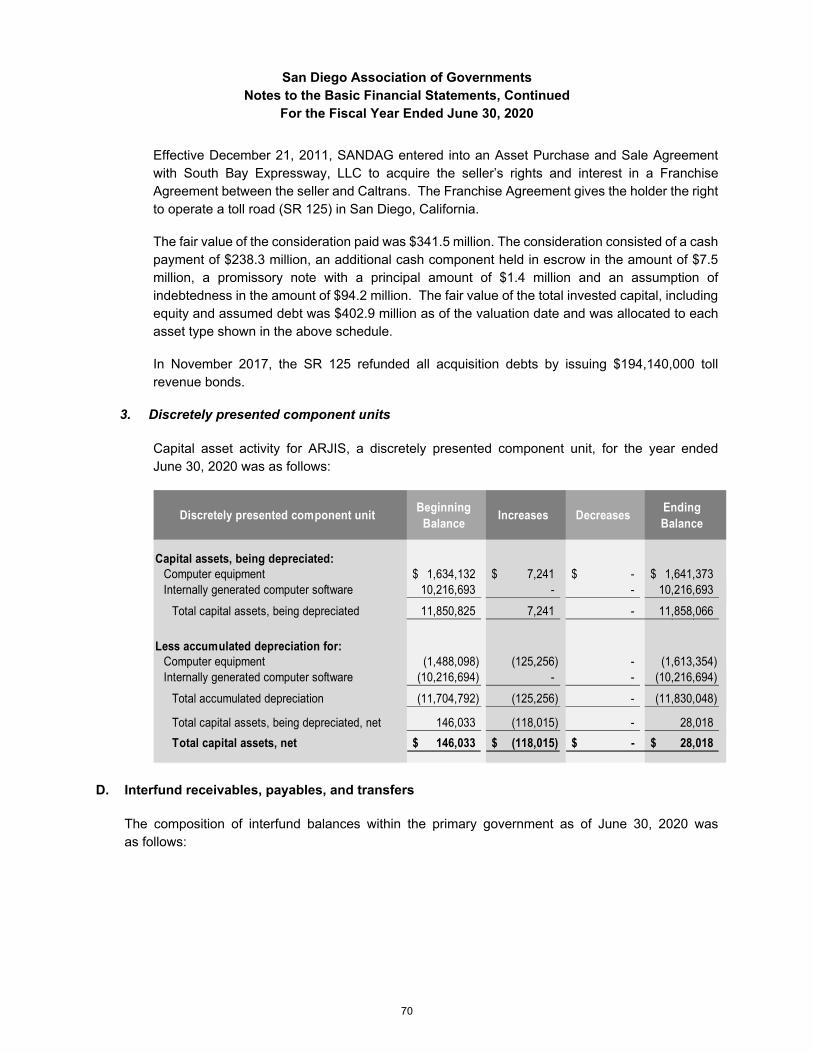
San Diego Association of Governments Notes to the Basic Financial Statements, Continued
For the Fiscal Year Ended June 30, 2020
Effective December 21, 2011, SANDAG entered into an Asset Purchase and Sale Agreement with South Bay Expressway, LLC to acquire the seller’s rights and interest in a Franchise Agreement between the seller and Caltrans. The Franchise Agreement gives the holder the right to operate a toll road (SR 125) in San Diego, California.
The fair value of the consideration paid was $341.5 million. The consideration consisted of a cash payment of $238.3 million, an additional cash component held in escrow in the amount of $7.5 million, a promissory note with a principal amount of $1.4 million and an assumption of indebtedness in the amount of $94.2 million. The fair value of the total invested capital, including equity and assumed debt was $402.9 million as of the valuation date and was allocated to each asset type shown in the above schedule.
In November 2017, the SR 125 refunded all acquisition debts by issuing $194,140,000 toll revenue bonds.
3. Discretely presented component units
Capital asset activity for ARJIS, a discretely presented component unit, for the year ended June 30, 2020 was as follows:
Discretely presented component unitBeginning
BalanceIncreases Decreases
Ending Balance
Capital assets, being depreciated:Computer equipment 1,634,132$ 7,241$ -$ 1,641,373$ Internally generated computer software 10,216,693 - - 10,216,693
Total capital assets, being depreciated 11,850,825 7,241 - 11,858,066 , ,
Less accumulated depreciation for:Computer equipment (1,488,098) (125,256) - (1,613,354) Internally generated computer software (10,216,694) - - (10,216,694)
Total accumulated depreciation (11,704,792) (125,256) - (11,830,048)
Total capital assets, being depreciated, net 146,033 (118,015) - 28,018
Total capital assets, net 146,033$ (118,015)$ -$ 28,018$
D. Interfund receivables, payables, and transfers
The composition of interfund balances within the primary government as of June 30, 2020 was as follows:
70

San Diego Association of Governments Notes to the Basic Financial Statements, Continued
For the Fiscal Year Ended June 30, 2020
1. Due to/from other funds
Nonmajor Government
Funds
Commission Sales Tax
Projects Fund
Capital Projects Fund
General FundSANDAG
Debt Service Fund
Total
General Fund 9,551$ 867,239$ -$ -$ -$ 876,790$
General Services Fund 1,257,517 5,876,192 - - - 7,133,709
Commission Sales Tax
Projects Fund - - 448,094 47,309 - 495,403
Capital Projects Fund 2,601,369 21,450,957 - 2,529,466 46,473,244 73,055,036
Property Management Fund 637,250 - - - - 637,250
Service Bureau Fund 254,524 - - - - 254,524
I-15 FasTrak Fund 519,642 - - - - 519,642
SR 125 Toll Road Fund 511,936 - - 215,324 - 727,260
Total 5,791,789$ 28,194,388$ 448,094$ 2,792,099$ 46,473,244$ 83,699,614$
Due to other funds - Governmental Funds
Du
e f
rom
oth
er
fun
ds
Nonmajor Enterprise
Funds
SR 125 Toll Road Fund
Total
General Fund 3,816$ -$ 3,816$
Capital Projects Fund - 1,363,311 1,363,311
I-15 FasTrak Fund - 47,024 47,024
SR 125 Toll Road Fund 33,515 - 33,515
Total 37,331$ 1,410,335$ 1,447,666$
Due to other funds - Business-Type Funds
Du
e f
rom
oth
er
fun
ds
Due to/from other funds includes the following types of interfund transactions:
Reimbursements represent repayments from the funds responsible for particular expenditures or expenses to the funds that initially paid for them. The reimbursement is reported as expenditures or expenses in the reimbursing fund and a reduction of expenditures or expenses in the fund that initially incurred the expense.
Loans represent amounts provided with a requirement for repayment. Interfund loans are normally reported as interfund receivables (i.e. Due from Other Funds) in lender funds and interfund payables (i.e. Due to Other Funds) in borrower funds. The non-current portions of long-term interfund loans receivable are reported as advances.
2. Due to primary government and due from component unit
ARJIS reported $124,374 as due to SANDAG at June 30, 2020.
3. Transfers in/out
Transfers in and out by fund for the fiscal year ended June 30, 2020 were as follows:
71

San Diego Association of Governments Notes to the Basic Financial Statements, Continued
For the Fiscal Year Ended June 30, 2020
General FundCommission
Sales Tax Projects Fund
Capital Projects Fund
Commission Debt Service
Fund
SANDAG Debt Service Fund
SAFE Fund Total
General Fund -$ 1,068,506$ -$ -$ -$ -$ 1,068,506$
General Services Fund 9,688,662 19,692,969 125,446 - - 1,495,750 31,002,827
Commission Sales Tax
Projects Fund - - - 83,849,089 - - 83,849,089
Capital Projects Fund 130,358 119,393,439 162,058 - 316,384,073 - 436,069,928
Commission Sales Tax -
Debt Service Fund - 132,677,284 - - - - 132,677,284
Total 9,819,020$ 272,832,198$ 287,504$ 83,849,089$ 316,384,073$ 1,495,750$ 684,667,634$
Governmental Funds Transfers Out
Tra
ns
fers
In
SR 125 Toll Road Fund
Interstate 15 FasTrak Fund
Total
General Service Fund -$ 9,402$ 9,402$
Commission Sales Tax
Project Fund - 8,500,000 8,500,000
Capital Projects Fund 5,321,060 - 5,321,060
Total 5,321,060$ 8,509,402$ 13,830,462$
Business-Type Funds Transfers Out
Tra
nsfe
rs In
Transfers from the general fund:
To the general services fund consist of the following items:
$9,112,170 transferred for projects that were budgeted to receive TDA funds.
$576,492 transferred for projects that were budgeted to receive member assessments.
To the capital projects fund consist of the following item:
$130,358 of TDA funds for the financial systems upgrade project.
Transfers from the Commission sales tax projects fund:
To the general fund:
$1,068,507 for one-half of the Board expenses budgeted to receive TransNet funds.
To the general services fund:
$19,692,968 for the TransNet grant program and overall work program projects budgeted to receive TransNet funds.
To the capital projects fund:
72

San Diego Association of Governments Notes to the Basic Financial Statements, Continued
For the Fiscal Year Ended June 30, 2020
$119,393,439 for capital projects budgeted to receive TransNet funds.
To the Commission debt service fund consists of the following items:
Transfer of $132,677,284 in TransNet sales tax revenue for bond and commercial paper principal and interest payments.
Transfers from the capital projects fund totaling $287,504 consist of $125,446 to the general services fund for the State of the Commute project and $162,058 for the financial systems upgrade project.
Transfers from the Commission debt service fund:
To the Commission sales tax projects fund consist of the following items:
$4,150,792 of bond and commercial paper repayments for the County of San Diego and cities of Del Mar, Imperial Beach, La Mesa, National City, Oceanside, and Santee.
$6,588,313 return of TransNet sales tax funds that were advanced to the trustee for debt service payments and returned upon receipt of the 2010 Series A BABs federal subsidy.
$41,627,950 of bond proceeds used to fund TransNet-eligible capital projects.
$2,093,813 of gains from bond escrow restructuring during 2019 bond issuance, which refinanced the 2012 and 2014 bonds.
$29,378,000 of commercial paper proceeds issued to the cities of Imperial Beach, Oceanside and San Diego for TransNet-eligible projects.
$10,221 of debt investment fee allocation.
Transfers from the SANDAG debt service fund of $316,384,073 to the capital projects fund for the design and construction of the Mid-Coast Corridor Transit Project.
Transfers from the SAFE fund of $1,495,750 to the general services fund to match State Freeway Service Patrol operation funds, fund Traveler information systems, and fund Intelligent Transportation System infrastructure projects as permitted under legislation.
Transfers from the I-15 FasTrak fund of $9,402 to the general services fund for a budgeted operating project and $8,500,000 to swap TransNet funds to fund the I-15 Rapid operations and maintenance.
Transfers from the SR 125 fund totaling $5,321,060 to the capital projects fund for the design and construction of the SR11 Otay Mesa East Port of Entry, to match federal funds on the Joint Transportation Operations Center and for the financial system upgrade project.
73

San Diego Association of Governments Notes to the Basic Financial Statements, Continued
For the Fiscal Year Ended June 30, 2020
E. Derivative instruments
SANDAG uses derivative instruments to hedge its exposure to changing interest rates through the use of interest rate swaps. An interest rate swap is the exchange of payments between SANDAG and a counterparty in order to potentially obtain a lower cost of funding than traditional fixed rate bonds, or to hedge interest rate exposure. SANDAG has entered into three pay-fixed, receive-variable interest rate swaps and two basis swaps to produce savings or to result in lower costs than what SANDAG would have paid using fixed-rate debt over the life of the 2008 Series ABCD Bonds.
The following describes the interest rate swaps and evaluates the risks for the swaps in which SANDAG currently participates:
1. 2008 interest rate swaps
Objective. In 2005, SANDAG entered into three forward interest rate swaps for $200 million each in order to hedge the interest rate risk associated with future variable-rate revenue bonds expected to be issued in 2008 by “locking in” a fixed interest rate. The intention of SANDAG in entering into the swaps was to lock in a relatively low cost of funds on a substantial portion of the TransNet Early Action Program (EAP). The variable-rate bonds were issued in March 2008.
On May 23, 2012, SANDAG refunded $151.5 million of the outstanding variable-rate bonds with fixed-rate bonds and terminated the associated interest rate swaps. The low fixed municipal interest rates at that time provided the opportunity for SANDAG to refund the 2013 through 2022 maturities of the Series 2008 variable-rate bonds ($151.5 million in par) and terminate the associated swaps (also equal to $151.5 million in notional amount) without increasing annual debt service. The purpose of this transaction was to reduce variable-rate exposure and swap counterparty risk at no additional cost to SANDAG. The current notional amounts of the swaps are, following the refunding described above, $134.1 million each, totaling $402.3 million.
74

San Diego Association of Governments Notes to the Basic Financial Statements, Continued
For the Fiscal Year Ended June 30, 2020
Objective and terms of hedging derivative instruments
The following table displays the objective and terms of SANDAG hedging derivative instruments outstanding at June 30, 2020 along with the credit rating of the associated counterparty:
Pay-fixed interest rate
swap
Hedge of changes in cash flows on
the 2008 Series A and B bonds
$134,100,000 5/23/2012 4/1/2038
Pay 3.8165%; receive SIFMA
Aa2/A+
Pay-fixed interest rate
swap
Hedge of changes in cash flows on
the 2008 Series B and C bonds
$134,100,000 5/23/2012 4/1/2038
Pay 3.8165%; receive SIFMA
Aa2/AA-
Pay-fixed interest rate
swap
Hedge of changes in cash flows on
the 2008 Series C and D bonds
$134,100,000 5/23/2012 4/1/2038
Pay 3.41%; receive 65%
of USD-LIBOR
Aa2/A+
Counterparty Credit Rating Moody's/S&P
Type ObjectiveNotional Amount
Effective Date
Maturity Date
Terms
Fair values. The fair value balances and notional amount of derivative instruments outstanding at June 30, 2020, classified by type, and the changes in fair value of such derivative instruments for the year ended are as follows:
Classification Amount Classification Amount Notional
Cash flow hedges:Pay-fixed interest rate swaps
Deferred outflows
($37,188,225) Debt ($130,288,295) $402,300,000
Fair Value at June 30, 2020Changes in Fair ValueGovernmental
activities
The fair values of the derivative instruments were estimated by an independent third-party based on mid-market levels as of the close of business on June 30, 2020. The fair values take into consideration the prevailing interest rate environment and the specific terms and conditions of the swaps.
Credit risk. This is the risk that the counterparty will fail to perform under the terms of the agreement. As of June 30, 2020, SANDAG was not exposed to credit risk on these swaps because they had negative fair values. However, should interest rates change and the fair values of the swaps become positive, SANDAG would be exposed to credit risk in the amount of the
75

San Diego Association of Governments Notes to the Basic Financial Statements, Continued
For the Fiscal Year Ended June 30, 2020
swaps’ fair values. Favorable credit ratings of the counterparties (Bank of America and Goldman Sachs Mitsui Marine Derivative Products) mitigate this risk. As of June 30, 2020, Bank of America was rated Aa2 by Moody’s and A+ by Standard & Poor’s; and Goldman Sachs Mitsui Marine Derivative Products was rate Aa2 by Moody’s and AA- by Standard & Poor’s. The ratings are monitored by staff on a weekly basis. In addition, the fair value of the swaps will be fully collateralized by the counterparty with cash or U.S. government securities if the counterparty’s credit quality falls below a rating of Baa2 by Moody’s or BBB by Standard & Poor’s. Collateral would be posted with a third-party custodian.
Interest rate risk. This is the risk that changes in market interest rates will adversely affect the net payment on the swaps. SANDAG is exposed to interest rate risk on its swaps when LIBOR and/or SIFMA decreases causing SANDAG net payment on swaps to increase.
Basis risk. This is the risk of a mismatch between the variable rate received from the counterparty and the variable rate paid on the variable-rate debt issued in 2008. SANDAG is exposed to basis risk should the floating rate that it receives on a swap be less than the actual variable rate SANDAG pays on the bonds. Depending on the magnitude and duration of any basis risk shortfall, the effective fixed rate on the debt will vary. Based on historical experience, the expectation is that the payments received under the agreements will approximate the expected bond payments over the 30-year term of the swaps. Due to the unfavorable market conditions during fiscal year 2020, SANDAG was exposed to basis risk since the variable rate received from the counterparty, was less than the variable rate SANDAG paid on the bonds.
Termination risk and termination payments. This is the risk that the transaction is terminated in a market dictating a termination payment by SANDAG. SANDAG can terminate the swap at the fair value by providing notice to the counterparty, while the counterparty may only terminate the swap upon certain termination events under the terms of the contracts. SANDAG or the counterparties may terminate the swap if the other party fails to perform under the terms of the contracts, such as the failure to make swap payments. If the swap is terminated, the variable-rated demand bond (VRDBs) would no longer be hedged.
SANDAG effectively reduced the ongoing termination risk by refunding $151.5 million in variable-rate bonds and terminating the same amount of the outstanding interest rate swaps in May 2012 under favorable market conditions with low fixed rates. Refunding additional maturities and terminating more of the interest rate swaps would have led to a net increase in debt service under a fixed-rate structure, which was contrary to SANDAG programmatic objectives. Consequently, the reduced amount of variable-rate bonds and interest rate swaps was left in place.
Rollover risk. This is the risk that maturity of the hedging derivative instruments is shorter than the maturity of the associated debt leaving SANDAG unprotected in the future. When these swaps terminate, or in the case of a termination option, if the counterparty exercises its option, SANDAG will be re-exposed to the risks being hedged by the swaps. SANDAG is exposed to rollover risk on the swaps only in the event of a failure to perform under the terms of the contracts by SANDAG or counterparty.
76

San Diego Association of Governments Notes to the Basic Financial Statements, Continued
For the Fiscal Year Ended June 30, 2020
Market access risk. This is the risk that SANDAG will not be able to enter credit markets or that credit will become more costly. The SANDAG financial rating is tied to the credit strength of the sales tax revenue. SANDAG also is exposed to market access risks caused by disruptions in the municipal bond market.
Reset rates paid and received by SANDAG. The range of weekly variable interest rates paid on the 2008 TransNet bonds by SANDAG to the bondholders for the period July 1, 2019 through June 30, 2020 are as follows:
Bondholder Low High
Barclays Bank 0.05% 6.50%
Goldman, Sachs & Co. 0.05% 7.20%
JP Morgan Securities, Inc. 0.05% 4.90%
Stifel, Nicolaus & Company 0.04% 6.50%
Commission Pays
Weekly Reset Rates
Fixed rates are paid by SANDAG to the swap provider counterparties and sixty-five percent of LIBOR or SIFMA is received by SANDAG from the swap provider counterparties.
The following table includes the range of LIBOR rates received for one swap and the range of SIFMA rates received for two swaps; and the fixed rate paid to the swap counterparties from July 1, 2019, through June 30, 2020.
Commission Pays
Low High Low High Fixed
Bank of America 0.11221% 1.56155% N/A N/A 3.410%
Bank of America N/A N/A 0.11862% 2.80548% 3.8165%
Goldman Sachs Mitsui
Marine Derivative Products N/A N/A 0.11862% 2.80548% 3.8165%
Commission Receives 65% LIBOR
Commission Receives SIFMASwap Counterparty
77

San Diego Association of Governments Notes to the Basic Financial Statements, Continued
For the Fiscal Year Ended June 30, 2020
Actual debt service requirements versus the projected debt service on the swap transaction. For the fiscal year ending June 30, 2020, actual debt service was less than projected resulting in less variable-rate payments made on the bonds as compared to the variable-rate payments received from the swap in the amount of $650,876 for fiscal year 2020:
$ %
Bank of America 4,462,896$ 4,572,811$ (109,915)$ -2.4037%
Bank of America 4,867,471 5,117,926 (250,455) -4.8937%
Goldman Sachs Mitsui
Marine Derivative Products 4,827,420 5,117,926 (290,506) -5.6762%
Totals 14,157,787$ 14,808,663$ (650,876)$ -4.3952%
Projected Debt Service
Actual Debt Service
Swap CounterpartyVariance
Over the life of the swaps from the issuance of the bonds through June 30, 2020, the cumulative excess of the variable-rate payments made on the bonds as compared to the variable-rate payments received from the swap counterparties is $2,591,374. This means that the net variable rates that SANDAG is paying on the 2008 TransNet bonds is more than the variable rate that SANDAG is receiving; these rates originally were intended to offset and net to zero.
The total net cost of the program includes liquidity facilities with J.P. Morgan (Series A and B), Bank of America, N.A. (Series C), and State Street Bank and Trust Company (Series D). Standby Bond Purchase Agreement (SBPA) costs at year end for the Series A and B bonds is 39 basis points, the Series C bonds is 35 basis points, and the SBPA cost for the Series D bonds is 34 basis points.
2. 2018 basis rate swaps overlay to the 2008 interest rate swaps
Objective. On March 19, 2009, SANDAG entered into a SIFMA versus LIBOR floating-to-floating or “basis” swap. The combination of the Basis Swaps and the existing 2008 Interest Rate Swaps effectively amended the existing swaps without having to change the existing floating-to-fixed interest rate swaps. This overlay allowed SANDAG to bid out the new transaction to a group of potential counterparties without changing the existing 2008 Interest Rate Swaps. SANDAG entered into a new transaction with Barclays Bank PLC to overlay the terms under two of the 2008 Interest Rate Swaps, with an expected benefit to SANDAG of a substantial reduction in the cost of debt after the effective date of April 1, 2018.
Terms. The notional amounts of the swaps are $145.8 million each in FY 2020. Under two of the 2008 Interest Rate Swaps, SANDAG pays the counterparties a fixed payment of 3.8165 percent and receives 65 percent of LIBOR (through April 2018) and thereafter receives the SIFMA index. The 2018 Basis Rate Swaps overlay these two 2008 Interest Rate Swaps with a payment of the SIFMA index and a receipt of 107.4 percent of LIBOR for the last 20 years of the swap (April 2018 to April 2038).
78

San Diego Association of Governments Notes to the Basic Financial Statements, Continued
For the Fiscal Year Ended June 30, 2020
Fair values. The swaps had a total combined positive fair value of $6,363,787 at fiscal year-end. The fair values of the derivative instruments were estimated by an independent third party based on mid-market levels as of the close of business on June 30, 2020. The fair values take into consideration the prevailing interest rate environment and the specific terms and conditions of the swaps.
Classification Amount Classification Amount Notional
Derivative Instruments:Pay-floating Receive floating interest rate swaps
Investment earnings
($11,408,952) Investment $6,363,787 $291,600,000
Fair Value at June 30, 2020Changes in Fair Value
Governmental activities
Terms and fair value of investment derivative instruments
The following table displays the terms and fair value of the SANDAG investment derivative instruments outstanding at June 30, 2020 along with the credit rating of the associated swap counterparty:
SIFMA Swap Index
107.4% of 3-month
USD-LIBOR3/19/2009 4/1/2018 4/1/2038 $ 3,181,893 $145,800,000 A1/A/A+
SIFMA Swap Index
107.4% of 3-month
USD-LIBOR3/19/2009 4/1/2018 4/1/2038 $ 3,181,894 $145,800,000 A1/A/A+
Total 6,363,787$ 291,600,000$
Counterparty Credit Rating*
Notional Amount
Variable Rate Paid
Variable Rate Received
Trade DateEffective
DateMaturity
DateFair Value
*Moody’s/S&P/Fitch
Credit risk. This is the risk that the counterparty will fail to perform under the terms of the agreements. As of June 30, 2020, SANDAG was exposed to credit risk on these swaps in the amount of $6,363,787 which is the fair value of the derivative instruments net of collateral posted. However, should interest rates change and the fair value of the swaps become negative, SANDAG would not be exposed to any credit risk. The favorable credit rating of the counterparty mitigates this risk.
Collateral. To further mitigate credit risk, under terms of the International Swaps and Derivatives Association, Inc. (ISDA) Master Agreement, dated March 19, 2009, by and between SANDAG and Barclays Bank PLC, upon a demand by either party, collateral may be posted by Barclays to
79

San Diego Association of Governments Notes to the Basic Financial Statements, Continued
For the Fiscal Year Ended June 30, 2020
the SANDAG Trust account or returned to Barclays; dependent upon the valuation amount each day. Collateral can be posted on amounts over $15,000,000 when the minimum daily valuation change is at least $250,000. Interest earned on collateral held by SANDAG is due to Barclays monthly. SANDAG reports collateral holdings, including interest earned, as deposits payable. At June 30, 2020, there was $15,514 reported as deposits payable.
Netting. Under terms of the ISDA Master Agreement, in respect of the same transaction, SANDAG and Barclays may elect a net amount due and payable for the party with the larger aggregate amount over the smaller aggregate amount. SANDAG and Barclays elected the netting option, which resulted in net receipts of $1,648,326 by SANDAG at year end.
Interest rate risk. This is the risk that changes in market interest rates will adversely affect the net payment on the swaps. SANDAG is exposed to interest rate risk on its swaps when LIBOR decreases causing SANDAG net payment on the swaps to increase.
Basis risk. This is the risk of a mismatch between the variable rate received from the counterparty and the variable rate paid on the variable-rate debt issued in 2008. SANDAG is exposed to basis risk should the floating rate that it receives on a swap be less than the actual variable rate SANDAG pays on the bonds. Depending on the magnitude and duration of any basis risk shortfall, the effective fixed rate on the debt will vary. Based on current and historical experience, staff expects the overlay of the SIFMA to LIBOR Basis Rate Swaps to significantly reduce the costs of financing after 2018, assuming a return to normal, or even near to normal trading relationships. Due to the favorable market conditions during fiscal year 2020, SANDAG was not exposed to basis risk since the variable rate received was more than the variable rate paid and amounted to $1,648,326.
Termination risk and termination payments. This is the risk that the transaction is terminated in a market dictating a termination payment by SANDAG. SANDAG can terminate a swap at the fair market value by providing notice to the counterparty, while the counterparty may only terminate the swap upon certain termination events under the terms of the agreement. Given the positive fair value at June 30, 2020, SANDAG was in a favorable termination position relative to the market.
SANDAG Board Policy No. 032: San Diego County Regional Transportation Commission Interest Rate Swap Policy requires a contingency plan to either replace the swaps or fund the termination payments, if any, in the event one or more outstanding swaps are terminated. Should a swap be terminated, the excellent credit rating of SANDAG would allow it to assign the swap to another counterparty. Alternatively, if a swap is terminated and it has a negative fair value, SANDAG could use TransNet sales tax receipts to fund the termination payment.
F. Fair value measurement
SANDAG categorizes its fair value investments within the fair value hierarchy established by GAAP. SANDAG has the following recurring fair value measurements as of June 30, 2020:
80

San Diego Association of Governments Notes to the Basic Financial Statements, Continued
For the Fiscal Year Ended June 30, 2020
Level 1 Level 2 Level 3
Investments by fair value level
U.S. Agencies 195,478,001$ 60,101,103$ 135,376,898$ -$
Corporate Medium-Term Notes 71,531,263 - 71,531,263 -
Supranational Agency Bonds/Notes 24,879,834 - 24,879,834 -
Certificates of Deposit 6,431,654 - 6,431,654 -
Asset-Backed Securities 5,786,654 - 5,786,654 -
Total investments by fair value level 304,107,406 60,101,103 244,006,303 -
Derivative instruments
Interest rate swaps (130,288,295)$ (130,288,295)$ Basis rate swaps 6,363,787 6,363,787
Total derivative instruments (123,924,508)$ (123,924,508)$
Fair Value MeasurementsGeneral Government June 30, 2020
Investment securities classified in Level 1 of the fair value hierarchy are valued using prices quoted in active markets for those securities. Investment securities classified in Level 2 of the fair value hierarchy are valued using a matrix pricing technique. Matrix pricing is used to value securities based on the securities’ relationship to benchmark quoted prices.
Derivative instruments are comprised of three forward interest rate swaps valued at ($130,288,295) and two basis swap overlays valued at $6,363,787.
G. Long-term debt
1. The 2008 Series ABCD bonds
In March 2008, SANDAG issued $600,000,000 of variable-rate bonds to fund some of the major projects identified in the TransNet reauthorization (approved by voters in November 2004) under the TransNet Early Action Program. In June 2012, SANDAG refunded $151,500,000 of the Series 2008 bonds and terminated a corresponding portion of the interest rate swaps relating to the Series 2008 bonds through the issuance of the 2012 Series A tax-exempt bonds.
81

San Diego Association of Governments Notes to the Basic Financial Statements, Continued
For the Fiscal Year Ended June 30, 2020
The principal requirements to maturity for the 2008 Series ABCD bonds are as follows:
2021 -$ 321,840$ 14,338,146$ 14,659,986$
2022 - 321,840 14,338,146 14,659,986
2023 18,600,000 318,120 14,172,418 14,490,538
2024 19,200,000 303,120 13,504,160 13,807,280
2025 20,100,000 287,580 12,811,845 13,099,425
2026-2030 112,500,000 1,182,060 52,661,413 53,843,473
2031-2035 136,200,000 690,840 30,777,296 31,468,136
2036-2038 95,700,000 136,140 6,065,111 6,201,251
Total 402,300,000$ 3,561,540$ 158,668,535$ 162,230,075$
Total InterestInterest on
DebtPrincipal Amount
Maturity (April 1)
Hedging Derivative
Instruments, Net
The bonds bear interest at a variable rate, which is reset weekly. See Note II.E.1 for reset rate ranges for each remarketing agent. The above table incorporates the net receipts/payments of the hedging derivative instruments that are associated with this debt. These amounts assume that current interest rates on variable-rate bonds and the current reference rates of hedging derivative instruments will remain the same for their term. As these rates vary, interest payments on variable-rate bonds and net receipts/payments on the hedging derivative instruments will vary. Refer to Note II.E.1 for additional information regarding the derivative instruments associated with the debt of SANDAG.
Under GASB 88, the 2008 Series ABCD bonds are classified as other debts. Sales tax revenues are pledged as collateral for these bonds. There is no unused line of credit on these bonds. In the event of default, the Commission shall immediately transfer to the Trustee all revenues held by it and the Trustee shall apply all revenues and any other funds then held of thereafter received by the Trustee under any of the provision of the Indenture.
2. The 2010 Series A and B bonds
On November 10, 2010, SANDAG issued $350,000,000 Series 2010 A and B fixed-rate bonds to finance the continued implementation of the TransNet program, principally consisting of transportation facility and public infrastructure improvements within the County of San Diego, to retire $7,316,000 in outstanding commercial paper notes and to pay the costs of issuing the Series 2010 bonds. The Series A BABs totaled $338,960,000 and carry a fixed interest rate of 5.911 percent (net interest rate of 3.991 percent after deducting the BABs federal subsidy) with a maturity date of April 1, 2048. The Series B tax-exempt bonds totaled $11,040,000 with a fixed interest rate of 3.14 percent, based on an interest rate range of 2.00 to 5.00 percent and a maturity date of April 1, 2030.
On February 19, 2020, the Commission fully refunded $4,765,000 of the 2010 Series B bonds with the issuance of the 2020 Bonds.
82

San Diego Association of Governments Notes to the Basic Financial Statements, Continued
For the Fiscal Year Ended June 30, 2020
The principal requirements to maturity for the 2010 Series A bonds, net of the federal subsidy, are as follows:
2021 -$ 13,556,307$
2022 - 13,556,308
2023 - 13,556,308
2024 - 13,556,307
2025 - 13,556,307
2026-2030 - 67,781,536
2031-2035 - 67,781,536
2036-2040 57,975,000 66,644,111
2041-2045 165,580,000 43,443,294
2046-2048 115,405,000 9,346,757
Total 338,960,000$ 322,778,771$
Maturity (April 1, Oct 1)
Principal Amount
Interest Amount
Under GASB 88, the 2010 Series A and B bonds are classified as other debts. Sales tax revenues are pledged as collateral for these bonds. There is no unused line of credit on these bonds. In the event of default, the Commission shall immediately transfer to the Trustee all revenues held by it and the Trustee shall apply all revenues and any other funds then held of thereafter received by the Trustee under any of the provision of the Indenture.
3. The 2012 Series A bonds
On June 14, 2012, SANDAG issued $420,585,000 of 2012 Series A fixed-rate bonds to finance continued implementation of the TransNet program, principally consisting of transportation facility and public infrastructure improvements within the County of San Diego, to refund $151,500,000 of the Series 2008 ABCD bonds, terminate a corresponding portion of the interest rate swaps relating to the Series 2008 ABCD bonds and pay the costs of issuing the 2012 Series A bonds. The 2012 Series A sales tax revenue bonds (limited tax bonds) totaled $420,585,000 and carry a fixed interest rate of 3.703 percent with a maturity date of April 1, 2048.
On December 19, 2019 SANDAG partially refunded $246,910,000 of 2012 Series A bonds with the issuance of the 2019 Series A bonds.
83

San Diego Association of Governments Notes to the Basic Financial Statements, Continued
For the Fiscal Year Ended June 30, 2020
The principal requirements to maturity for the 2012 Series A bonds are as follows:
2021 19,970,000$ 2,046,750$
2022 20,965,000 1,048,250
Total 40,935,000$ 3,095,000$
Maturity (April 1, Oct 1)
Principal Amount
Interest Amount
Under GASB 88, the 2012 Series A bonds are classified as other debts. Sales tax revenues are pledged as collateral for these bonds. There is no unused line of credit on these bonds. In the event of default, the Commission shall immediately transfer to the Trustee all revenues held by it and the Trustee shall apply all revenues and any other funds then held of thereafter received by the Trustee under any of the provision of the Indenture.
4. The 2014 Series A bonds
On September 10, 2014, SANDAG issued $350,000,000 2014 Series A sales tax revenue bonds to finance continued implementation of the TransNet program, principally consisting of transportation facility and public infrastructure improvements within the County of San Diego, to retire $42,725,000 in outstanding commercial paper notes and to pay the costs of issuing the Series 2014 bonds. The 2014 Series A bonds include a premium of $55,305,484 and carry an overall all-in interest rate of 3.85 percent with a maturity date of April 1, 2048.
On December 19, 2019 the Commission partially refunded $155,335,000 of 2014 Series A bonds with the issuance of the 2019 Series A bonds.
The principal requirements to maturity for the 2014 Series A bonds are as follows:
2021 5,580,000$ 8,521,000$
2022 5,860,000 8,242,000
2023 6,155,000 7,949,000
2024 6,460,000 7,641,250
2025 6,785,000 7,318,250
2026-2030 39,350,000 31,151,750
2031-2035 50,230,000 20,279,500
2036-2039 50,000,000 6,402,500
Total 170,420,000$ 97,505,250$
Principal Amount
Interest Amount
Maturity (April 1, Oct 1)
Under GASB 88, the 2014 Series A bonds are classified as other debts. Sales tax revenues are pledged as collateral for these bonds. There is no unused line of credit on these bonds. In the
84

San Diego Association of Governments Notes to the Basic Financial Statements, Continued
For the Fiscal Year Ended June 30, 2020
event of default, the Commission shall immediately transfer to the Trustee all revenues held by it and the Trustee shall apply all revenues and any other funds then held of thereafter received by the Trustee under any of the provision of the Indenture.
5. The 2016 Series A bonds
On August 17, 2016, SANDAG issued $325,000,000 2016 Series A sales tax revenue bonds to finance continued implementation of the TransNet program, principally consisting of transportation facility and public infrastructure improvements within the County of San Diego, to retire $46,445,000 in outstanding commercial paper notes and to pay the costs of issuing the 2016 Series A bonds. The 2016 Series A bonds include a premium of $78.8 million and carry an overall all-in interest rate of 3.283 percent with a maturity date of April 1, 2048.
The principal requirements to maturity for the 2016 Series A bonds are as follows:
2021 5,270,000$ 15,394,000$
2022 5,535,000 15,130,500
2023 5,810,000 14,853,750
2024 6,105,000 14,563,250
2025 6,410,000 14,258,000
2026-2030 37,185,000 66,150,250
2031-2035 47,445,000 55,878,500
2036-2040 60,560,000 42,768,750
2041-2045 77,285,000 26,037,750
2046-2048 56,275,000 5,719,000
Total 307,880,000$ 270,753,750$
Principal Amount
Interest Amount
Maturity (April 1, Oct 1)
Under GASB 88, the 2016 Series A bonds are classified as other debts. Sales tax revenues are pledged as collateral for these bonds. There is no unused line of credit on these bonds. In the event of default, the Commission shall immediately transfer to the Trustee all revenues held by it and the Trustee shall apply all revenues and any other funds then held of thereafter received by the Trustee under any of the provision of the Indenture.
6. The 2017 Transportation Infrastructure Finance and Innovation Act loan (Direct Borrowing)
On June 27, 2017, SANDAG entered into a Transportation Infrastructure Finance and Innovation Act (TIFIA) loan agreement with the United States Department of Transportation, a direct borrowing, to finance continued implementation of the TransNet program for up to $537,484,439 of costs to complete the Mid-Coast Corridor Transit Project. Under terms of the agreement, SANDAG will pay an interest rate of 2.72 percent with anticipated disbursement of loan proceeds in 2021. SANDAG issued short-term financing during the period of project construction and
85

San Diego Association of Governments Notes to the Basic Financial Statements, Continued
For the Fiscal Year Ended June 30, 2020
expects to use the TIFIA loan proceeds to repay the short-term borrowing. At June 30, 2020, there was no outstanding obligation due.
Under GASB 88, the TIFIA loan is classified as a direct borrowing. The full line of credit balance of $537,484,439 is unused at June 30, 2020. Sales tax revenues are pledged as collateral for the loan.
In the event of default, the TIFIA Lender is entitled and empowered to institute any actions or proceedings at law or in equity for the collection of any sums due and unpaid under the TIFIA loan documents, and may prosecute any judgment or final decree against SANDAG and collect in the manner provided by law out of SANDAG’s property the money adjudged or decreed to be payable. The TIFIA Lender will have all the rights and remedies of a creditor, including all rights and remedies, to the extent applicable to the Trust Estate, of a secured creditor under the Uniform Commercial Code and may take other actions necessary or desirable to collect all amounts payable by SANDAG under the loan agreement; provided, however, that any monetary judgment against SANDAG will be payable solely from the Trust Estate or from any other funds made available by SANDAG, in our discretion.
Whenever any Event of Default has occurred and continues, the TIFIA Lender may suspend or debar SANDAG from further participation in any Government program administered by the TIFIA Lender and may notify other departments and agencies of such default.
7. The 2018 Short-Term notes (Series A Limited Tax Bonds)
On April 1, 2018, SANDAG issued $537,480,000 2018 Series A sales tax revenue short-term notes to finance costs associated with the Mid-Coast Corridor Transit Project, in advance of the TIFIA loan, to retire $27,586,000 of outstanding commercial paper notes related to the Mid-Coast Corridor Transit Project, and to pay the costs of issuing the series 2018 short-term notes. The Series A sales tax revenue short-term notes include a premium of $31.6 million and carries an overall all-in interest rate of 1.812% with a maturity date of April 1, 2021.
The principal requirements to maturity for the 2018 Series A short-term notes, are as follows:
2021 537,480,000$ 20,499,200$
Total 537,480,000$ 20,499,200$
Interest Amount
Principal Amount
Maturity (April 1)
Under GASB 88, the 2018 short-term notes are classified as other debts. Sales tax revenues are pledged as collateral for these notes. There is no unused line of credit on these notes. In the event of default, the Commission shall immediately transfer to the Trustee all revenues held by it and the Trustee shall apply all revenues and any other funds then held of thereafter received by the Trustee under any of the provision of the Indenture.
86

San Diego Association of Governments Notes to the Basic Financial Statements, Continued
For the Fiscal Year Ended June 30, 2020
8. The 2019 Series A bonds
On December 19, 2019, SANDAG issued $442,620,000 2019 Series A sales tax revenue bonds to refund $246,910,000 of the 2012 Series A and $155,335,000 of the 2014 Series A bonds, and to pay the costs of issuing the Series 2019 bonds. The 2019 Series A bonds were issued at par and carry an overall all-in interest rate of 3.189 percent with a maturity date of April 1, 2048.
The refunding of the 2012 Series A and 2014 Series A bonds resulted in a reduction in total debt service payments over the next 28 years by $92.7 million and obtained an economic gain (difference between the present values of the debt service payments on the old and new debt) of $63.1 million.
The principal requirements to maturity for the 2019 Series A bonds, are as follows:
Maturity Principal Interest
(April 1, Oct 1) Amount Amount
2021 -$ 13,617,419$
2022 - 13,617,419
2023 6,435,000 13,617,419
2024 6,640,000 13,498,629
2025 6,585,000 13,370,743
2026-2030 34,915,000 64,601,830
2031-2035 41,425,000 59,867,619
2036-2040 71,515,000 53,146,839
2041-2045 163,610,000 34,388,362
2046-2048 111,495,000 7,320,018
Total 442,620,000$ 287,046,297$
Under GASB 88, the 2019 Series A bonds are classified as other debts. Sales tax revenues are pledged as collateral for these bonds. There is no unused line of credit on these bonds. In the event of default, the Commission shall immediately transfer to the Trustee all revenues held by it and the Trustee shall apply all revenues and any other funds then held of thereafter received by the Trustee under any of the provision of the Indenture.
9. The 2020 Series A bonds
On February 19, 2020, SANDAG issued $74,820,000 2020 Series A sales tax revenue bonds to finance the continued implementation of the TransNet program, principally consisting of transportation facility and public infrastructure improvements within the County of San Diego including bicycle and pedestrian facilities, to refund $4,765,000 of the 2010 Series B bonds, and to pay the costs of issuing the 2020 Series A bonds. The 2020 Series A sales tax revenue bonds include a premium of $20,448,312 and carry an overall all-in interest rate of 2.623 percent with a maturity date of April 1, 2048.
87

San Diego Association of Governments Notes to the Basic Financial Statements, Continued
For the Fiscal Year Ended June 30, 2020
The advance refunding of the 2010 Series B bonds resulted in a reduction of total debt service payments over the next 10 years by $922,410 and obtained an economic gain (difference between the present values of the debt service payments on the old and new debt) of $855,551.
The principal requirements to maturity for the 2020 Series A bonds, are as follows:
Maturity Principal Interest(April 1, Oct 1) Amount Amount
2021 1,540,000$ 3,553,750$
2022 1,620,000 3,476,750
2023 1,705,000 3,395,750
2024 1,785,000 3,310,500
2025 1,880,000 3,221,250
2026-2030 10,795,000 14,668,450
2031-2035 10,950,000 11,999,500
2036-2040 13,975,000 8,973,750
2041-2045 17,835,000 5,113,250
2046-2048 12,735,000 1,032,000
Total 74,820,000$ 58,744,950$
Under GASB 88, the 2020 Series A bonds are classified as other debts. Sales tax revenues are pledged as collateral for these bonds. There is no unused line of credit on these bonds. In the event of default, the Commission shall immediately transfer to the Trustee all revenues held by it and the Trustee shall apply all revenues and any other funds then held of thereafter received by the Trustee under any of the provision of the Indenture.
10. The 2019 Series A and B Capital Grant Receipts Revenue Bonds
On August 14, 2019 SANDAG issued $335,000,000 2019 Series A and B Capital Grant Receipts Revenue Green Bonds to finance a portion of the costs of the design and construction of a 10.92 mile extension of the Metropolitan Transit System’s San Diego Trolley Blue Line from the Santa Fe Depot in Downtown, San Diego to the University Town Center Transit Center, also known as the Mid-Coast Corridor Transit Project. The bonds include a premium of $36.0 million with an overall all-in interest rate of 1.91% and a stated maturity date of November 15, 2027.
In September 2016, SANDAG entered into a Full Funding Grant Agreement with the U.S. Department of Transportation, Federal Transit Administration (FTA). Under the Grant Agreement, FTA committed a total of $1,043,380,000 of grant receipts to the Mid-Coast project, of which $430,024,740 has been received by SANDAG. SANDAG expects to receive the remaining balance of $613,355,260 in installments over the next seven years from federal fiscal year (FFY) 2020 to FFY 2026. The 2019 Capital Grant Receipts Revenue bonds are to be fully repaid by grant receipts received from the FTA.
The principal requirements to maturity for the 2019 Series A and B bonds, are as follows:
88

San Diego Association of Governments Notes to the Basic Financial Statements, Continued
For the Fiscal Year Ended June 30, 2020
Maturity Principal Interest(Nov 15, May 15) Amount Amount
2021 -$ 12,750,000$
2022 - 12,750,000
2023 - 12,750,000
2024 48,630,000 11,534,250
2025 51,125,000 9,040,375
2026-2028 235,245,000 11,206,125
Total 335,000,000$ 70,030,750$
Under GASB 88, the 2019 Series AB bonds are classified as other debts. Federal Grant Receipts are pledged as collateral for these bonds. There is no unused line of credit on these bonds. In the event of default, FTA will have all remedies at law and equity, including the right to specific performance, without further Federal financial assistance, and the rights to termination or suspension of the agreement. FTA, upon default, may also demand all federal funds provided to the Grantee for the project be returned.
11. Commercial paper notes (Direct Borrowing)
SANDAG issues tax-exempt Commercial Paper Notes (CPN) to provide interim financing for various TransNet projects including those for construction and acquisition activities and for advance-funding TransNet local street improvement projects, as a low cost and flexible source of capital financing.
At June 30, 2020, SANDAG was authorized to issue up to $100,000,000 aggregate principal CPN, with $100,000,000 in letters of credit in place. Rates paid under the Reimbursement Agreement with Bank of America supporting the CPN are 32 basis points and are set to expire on September 10, 2021. SANDAG CPN are issued with maturity dates ranging from one to 270 days at various interest rates.
During the fiscal year, the balance of notes issued and outstanding was $56,213,000. Interest rates during the current year have varied from 0.22 percent to 1.42 percent, with maturities from 14 days to 118 days. The interest rate on the outstanding amount at June 30, 2020, was 0.22 percent on $56,213,000 of notes, with a maturity of 63 days on $5,000,000, 99 days on $25,046,000, 74 days on $22,367,000 and 118 days on $3,800,000. As such, the outstanding amounts have been classified as current liabilities.
Under the terms of the CPN, maturing principal amounts can be rolled-over by issuing new notes. It is the intention of SANDAG to pay the accrued interest and reissue the principal amounts as they mature; other than any prescheduled principal repayments. Therefore, the principal debt service requirements shown in the table below include expected payments through the date of expiration of the current CPN agreements.
89
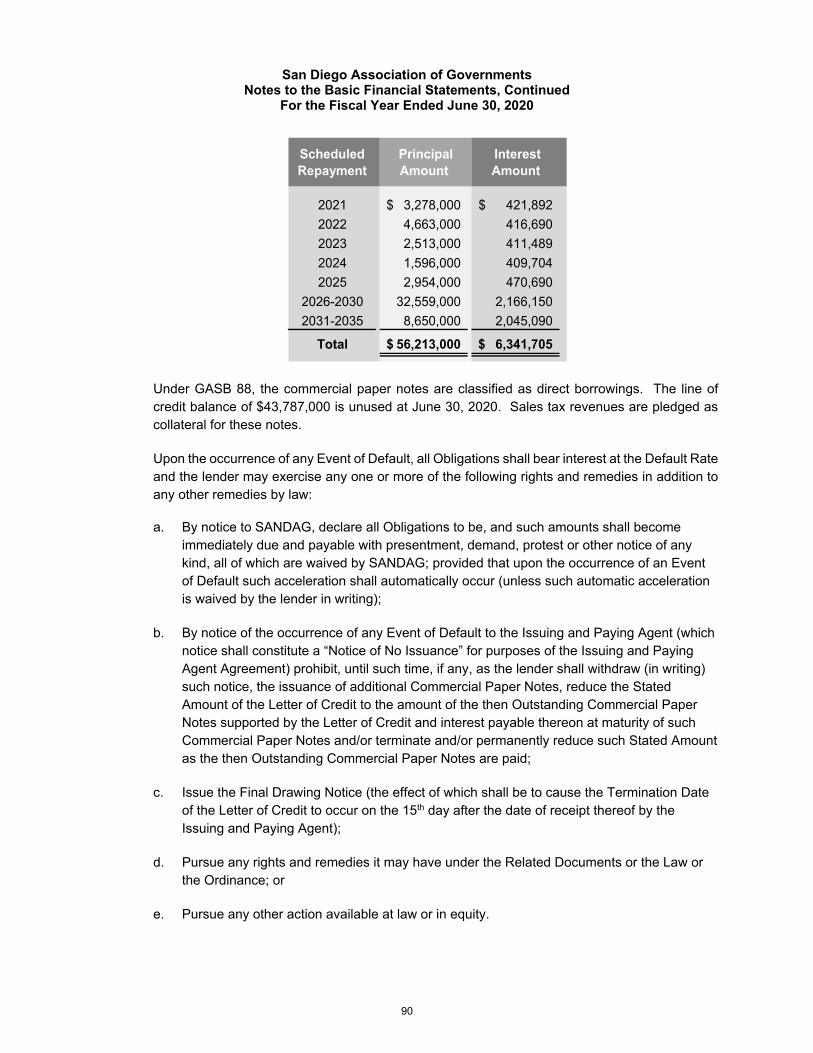
San Diego Association of Governments Notes to the Basic Financial Statements, Continued
For the Fiscal Year Ended June 30, 2020
Scheduled Repayment
Principal Amount
Interest Amount
2021 3,278,000$ 421,892$
2022 4,663,000 416,690
2023 2,513,000 411,489
2024 1,596,000 409,704
2025 2,954,000 470,690
2026-2030 32,559,000 2,166,150
2031-2035 8,650,000 2,045,090
Total 56,213,000$ 6,341,705$
Under GASB 88, the commercial paper notes are classified as direct borrowings. The line of credit balance of $43,787,000 is unused at June 30, 2020. Sales tax revenues are pledged as collateral for these notes.
Upon the occurrence of any Event of Default, all Obligations shall bear interest at the Default Rate and the lender may exercise any one or more of the following rights and remedies in addition to any other remedies by law:
a. By notice to SANDAG, declare all Obligations to be, and such amounts shall become immediately due and payable with presentment, demand, protest or other notice of any kind, all of which are waived by SANDAG; provided that upon the occurrence of an Event of Default such acceleration shall automatically occur (unless such automatic acceleration is waived by the lender in writing);
b. By notice of the occurrence of any Event of Default to the Issuing and Paying Agent (which notice shall constitute a “Notice of No Issuance” for purposes of the Issuing and Paying Agent Agreement) prohibit, until such time, if any, as the lender shall withdraw (in writing) such notice, the issuance of additional Commercial Paper Notes, reduce the Stated Amount of the Letter of Credit to the amount of the then Outstanding Commercial Paper Notes supported by the Letter of Credit and interest payable thereon at maturity of such Commercial Paper Notes and/or terminate and/or permanently reduce such Stated Amount as the then Outstanding Commercial Paper Notes are paid;
c. Issue the Final Drawing Notice (the effect of which shall be to cause the Termination Date of the Letter of Credit to occur on the 15th day after the date of receipt thereof by the Issuing and Paying Agent);
d. Pursue any rights and remedies it may have under the Related Documents or the Law or the Ordinance; or
e. Pursue any other action available at law or in equity.
90

San Diego Association of Governments Notes to the Basic Financial Statements, Continued
For the Fiscal Year Ended June 30, 2020
12. The 2017 Series A Toll Revenue Bonds
In November 2017, SANDAG issued $194,140,000 of 2017 Series A toll revenue bonds to refinance indebtedness incurred by SANDAG in connection with the acquisition of the South Bay Expressway and to pay the cost of issuance of the 2017 Bonds. The 2017 Series A toll revenue bonds included a premium of $38,102,982 and carried an overall all-in interest rate of 3.33 percent with a maturity date of July 1, 2042.
The principal requirements to maturity for the 2017 Series A Toll Revenue Bonds are as follows:
2021 4,535,000$ 9,224,375$
2022 4,765,000 8,991,875
2023 5,010,000 8,747,500
2024 5,265,000 8,490,625
2025 5,535,000 8,220,625
2026 - 2030 32,250,000 36,541,250
2031 - 2035 41,410,000 27,379,250
2036 - 2040 53,180,000 15,614,500
2041 - 2043 34,805,000 2,470,125
Total 186,755,000$ 125,680,125$
Interest Amount
Principal Amount
Maturity (Jan 1, Jul 1)
Under GASB 88, the 2017 Series A toll revenue bonds are classified as other debts. Toll revenues are pledged as collateral for these bonds. There is no unused line of credit on these bonds. In the event of default, the SR 125’s revenue and other funds shall be under the control of and applied by the Trustee under the provision of the Indenture. There is no right of acceleration with respect to the debt.
91

San Diego Association of Governments Notes to the Basic Financial Statements, Continued
For the Fiscal Year Ended June 30, 2020
13. Changes in long-term debts
For the year ended June 30, 2020, long-term debt activity for the governmental activities, was as follows:
July 1, 2019 June 30, 2020Senior lien debt:
2008 bonds 402,300,000$ -$ -$ 402,300,000$ -$
2010 A bonds 338,960,000 - - 338,960,000 -
2010 B bonds 5,515,000 - (5,515,000) - -
2012 bonds 306,545,000 - (265,610,000) 40,935,000 19,970,000
2014 bonds 331,070,000 - (160,650,000) 170,420,000 5,580,000
2016 bonds 312,900,000 - (5,020,000) 307,880,000 5,270,000
2019 bonds - 442,620,000 - 442,620,000 -
2020 bonds - 74,820,000 - 74,820,000 1,540,000
2019 Grant Receipts Rev bonds - 335,000,000 - 335,000,000 -
Premium, net 148,495,956 56,420,837 (67,256,881) 137,659,912 -
Total senior lien debt 1,845,785,956 908,860,837 (504,051,881) 2,250,594,912 32,360,000
Subordinate lien debt:
2018 short-term notes 537,480,000 - - 537,480,000 537,480,000
Premium 18,742,998 - (10,710,285) 8,032,713 -
CPN (direct borrowing) 28,692,000 29,378,000 (1,857,000) 56,213,000 56,213,000
Total subordinate lien debt 584,914,998 29,378,000 (12,567,285) 601,725,713 593,693,000
Total senior and
subordinate lien debt 2,430,700,954 938,238,837 (516,619,166) 2,852,320,625 626,053,000
Other liabilities:
Compensated absences
payable 2,279,416 4,146,010 (3,308,698) 3,116,728 3,116,728
Claims payable 25,000 - (25,000) - -
Total other liabilities 2,304,416 4,146,010 (3,333,698) 3,116,728 3,116,728
Total long-term liabilities 2,433,005,370$ 942,384,847$ (519,952,864)$ 2,855,437,353$ 629,169,728$
Governmental activities Additions ReductionsDue Within One Year
Beginning Balance
Ending Balance
92

San Diego Association of Governments Notes to the Basic Financial Statements, Continued
For the Fiscal Year Ended June 30, 2020
For the year ended June 30, 2020, long-term debt activity for the business-type activities, was as follows:
July 1, 2019 June 30, 2020
2017 Series A toll
revenue bonds 191,070,000$ -$ (4,315,000)$ 186,755,000$ 4,535,000$
Premium 34,061,369 - (2,440,038) 31,621,331 -
Total senior lien bonds 225,131,369 - (6,755,038) 218,376,331 4,535,000
Other liabilities:
Compensated absences
payable 214,587 476,411 (445,714) 245,284 245,284
Claims payable 500,000 - (261,843) 238,157 -
Total other liabilities 714,587 476,411 (707,557) 483,441 245,284
Total long-term liabilities 225,845,956$ 476,411$ (7,462,595)$ 218,859,772$ 4,780,284$
Business-type activities Additions ReductionsDue Within One Year
Beginning Balance
Ending Balance
14. Pledged revenue
SANDAG and its component units have a number of debt issuances outstanding that are collateralized by the pledging of certain revenues. The amount and term of the remainder of these commitments are indicated in the debt service to maturity table presented in the accompanying notes. The future sales tax revenues are pledged for debt service requirements totaling $3,600,622,998 for payments through fiscal year 2048. The future toll revenues are pledged for debt service requirements totaling $186,755,000 for payments through fiscal year 2043.
The following table provides the pledged future revenue information for the debt for which a revenue pledge exists:
Description of Pledged Revenue
Fiscal Year 2020 Amount of Pledged
Revenue
Fiscal Year 2020 Debt Service
Payments
Debt Service as a Percentage of
Pledged Revenue
Sales Tax 313,251,738$ 132,726,480$ 42%
Toll Revenue 26,657,583 13,760,625 52%
93

San Diego Association of Governments Notes to the Basic Financial Statements, Continued
For the Fiscal Year Ended June 30, 2020
H. Transit capital contributions
The fund financial statements report regional transportation improvements, which are current year capital project expenditures. In the government-wide statement of activities, certain expenditures are eliminated and capitalized as capital assets in the statement of net position. During the current year, transit capital funding program revenues are $46,465,874. The program revenues represent the federal funds, state funds, and other local governmental funding for the construction-in-progress projects in the capital projects fund.
I. Risk management
SANDAG has a self-insured retention (deductible) for Bodily Injury and Property Damage Liability (including General Liability and Automobile Liability) claims of $500,000 per occurrence. Amounts in excess of the self-insurance are covered by commercial excess insurance up to $50,000,000. SANDAG purchases “all-risk” insurance for damage to its property up to $19,103,408 for SANDAG main location and off-site construction offices with a per occurrence subject to a deductible of $5,000; and up to $412,804,771 for the SR 125 toll road and acquired property with a per occurrence subject to a deductible of $50,000. In addition, SANDAG has insurance policies for costs arising from employee Workers’ Compensation claims, Auto Property, Mexican Auto Liability, Foreign Liability and Cyber Liability. Employment Practices Liability and Public Official Errors and Omissions Liability insurance are also covered to a maximum of $10,000,000 per occurrence, with excess liability insurance up to $50,000,000.
Claims expenditures and liabilities in connection with these insurance programs are reported when it is probable that a loss has occurred, and the amount of that loss can be reasonably estimated. Liabilities include an amount for claims that have been incurred but not reported. The ultimate amount of losses incurred is dependent on future developments. The amounts reported in the accompanying financial statement have been determined based upon information from SANDAG legal counsel. Claims liability reported as of June 30, 2020 was $238,157. Claim payments have not exceeded insurance coverage for each of the past three fiscal years.
2020 2019
Claims payable, beginning of year 525,000$ 25,000$
Current year claims and changes in estimates ‐ 500,000
Current year claims payments (286,843) ‐
Claims payable, end of year 238,157$ 525,000$
94
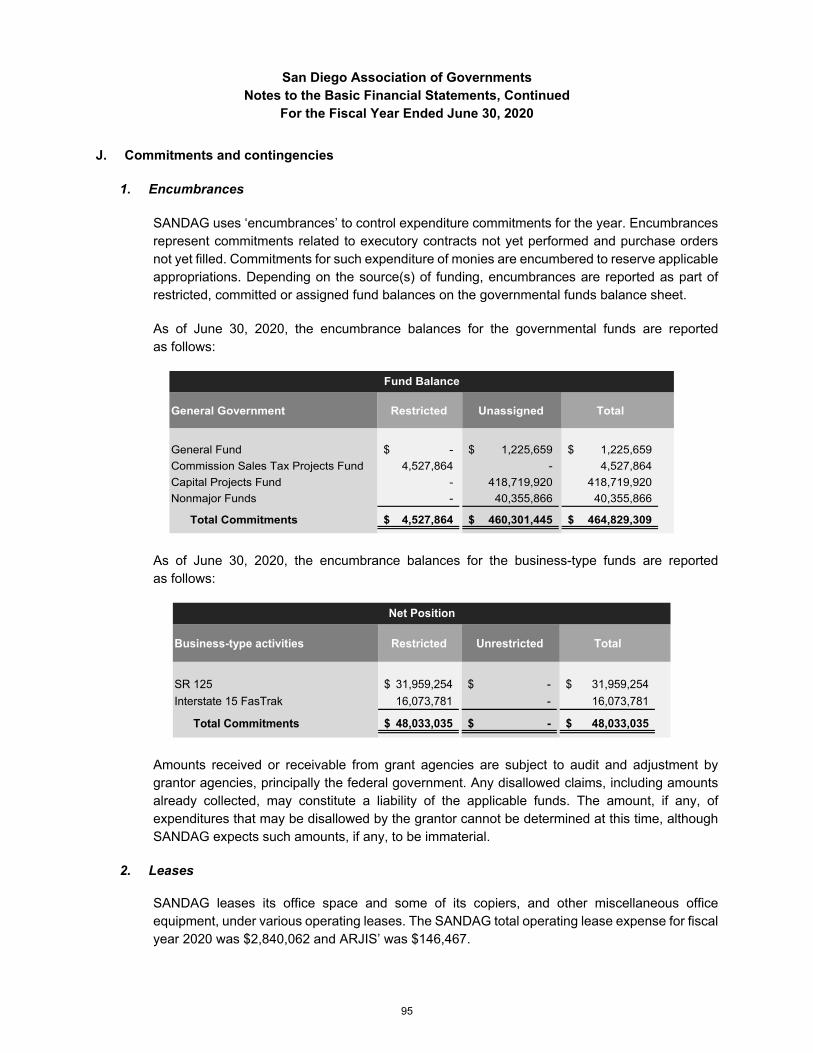
San Diego Association of Governments Notes to the Basic Financial Statements, Continued
For the Fiscal Year Ended June 30, 2020
J. Commitments and contingencies
1. Encumbrances
SANDAG uses ‘encumbrances’ to control expenditure commitments for the year. Encumbrances represent commitments related to executory contracts not yet performed and purchase orders not yet filled. Commitments for such expenditure of monies are encumbered to reserve applicable appropriations. Depending on the source(s) of funding, encumbrances are reported as part of restricted, committed or assigned fund balances on the governmental funds balance sheet.
As of June 30, 2020, the encumbrance balances for the governmental funds are reported as follows:
General Government Restricted Unassigned Total
General Fund -$ 1,225,659$ 1,225,659$
Commission Sales Tax Projects Fund 4,527,864 - 4,527,864
Capital Projects Fund - 418,719,920 418,719,920
Nonmajor Funds - 40,355,866 40,355,866
Total Commitments 4,527,864$ 460,301,445$ 464,829,309$
Fund Balance
As of June 30, 2020, the encumbrance balances for the business-type funds are reported as follows:
Business-type activities Restricted Unrestricted Total
SR 125 31,959,254$ -$ 31,959,254$
Interstate 15 FasTrak 16,073,781 - 16,073,781
Total Commitments 48,033,035$ -$ 48,033,035$
Net Position
Amounts received or receivable from grant agencies are subject to audit and adjustment by grantor agencies, principally the federal government. Any disallowed claims, including amounts already collected, may constitute a liability of the applicable funds. The amount, if any, of expenditures that may be disallowed by the grantor cannot be determined at this time, although SANDAG expects such amounts, if any, to be immaterial.
2. Leases
SANDAG leases its office space and some of its copiers, and other miscellaneous office equipment, under various operating leases. The SANDAG total operating lease expense for fiscal year 2020 was $2,840,062 and ARJIS’ was $146,467.
95

San Diego Association of Governments Notes to the Basic Financial Statements, Continued
For the Fiscal Year Ended June 30, 2020
Minimum annual lease payments under non-cancellable operating leases with terms in excess of one year were as follows:
Fiscal Year SANDAG ARJIS Total
2021 3,513,272$ 170,976$ 3,684,248$
2022 3,628,990 178,464 3,807,454
2023 3,712,846 186,420 3,899,266
2024 938,309 47,112 985,421
Total 11,793,417$ 582,972$ 12,376,389$
Future Minimum Operating Lease Payment
K. Other post-employment benefits (OPEB)
1. Plan description
In March 1986, pursuant to requirements of the state retirement system in which SANDAG participates, SANDAG adopted a policy to provide post-retirement health care benefits to retired employees through the California Public Employees’ Retirement System (CalPERS), an agent multiple-employer benefit plan (the plan) that covers all SANDAG employees and is administered by the California Public Employees’ Retirement System (CalPERS).
Commencing with the January 1, 2009 benefit year, SANDAG provides a fixed dollar amount contribution equal to a maximum of $250 per month per each eligible retiree. The maximum of $250 per month has not been increased in subsequent years, and any future increases would be at the discretion of SANDAG. Eight retirees were grandfathered into their 2007 SANDAG contribution with a 5 percent increase for 2007 and 2008. For these retirees, amounts in excess of the SANDAG fixed dollar contribution will be placed in a tax-free health reimbursement account. In future years, the SANDAG contribution may be subject to the CalPERS minimum required employer contribution ($136 per month in 2019, $139 per month in 2020 and subject to annual adjustments to reflect Medical Portion of CPI).
Eligibility for the SANDAG contribution requires retirement from SANDAG and receipt of pension income under CalPERS while receiving coverage under the CalPERS Health Program. Covered employees who terminate employment with SANDAG prior to meeting CalPERS eligibility for retirement (attainment of at least age 50 and at least 5 years of CalPERS credited service) are not eligible for continuation of medical coverage except as provided under COBRA. An eligible retiree can elect to contribute to the cost of continuing spouse and other eligible dependent coverage at retirement. Surviving spouses are eligible for the SANDAG contribution upon the death of the retiree.
2. Employees covered
As of the June 30, 2019, actuarial valuation, the following current and former employees were covered by the benefit terms under the SANDAG OPEB plan:
96

San Diego Association of Governments Notes to the Basic Financial Statements, Continued
For the Fiscal Year Ended June 30, 2020
Active employees 326
Inactive plan members or beneficiaries
currently receiving benefits 101
Inactive plan members entitled to but not
yet receiving benefits 0
Total 427
3. Contributions
Contributions to retirees are a fixed dollar amount equal to a maximum of $250 per month per each eligible retiree. The exception to this contribution is for eight retirees who were grandfathered into their 2007 SANDAG contribution with an increase in each year thereafter, to maintain a comparable benefit level. The expenditure was recorded when the Actuarially Determined Contribution (ADC) of the employer was paid.
For the fiscal year ended June 30, 2020, total payments of $525,499 were made to the CERBT as follows:
Cash Contributions
Payments to Trust and Estimated
Implied Subsidy
Total Contributions
Primary Government 383,982$ 130,309$ 514,291$
ARJIS 8,368 2,840 11,208
Total 392,350$ 133,149$ 525,499$
Contributions
4. Net OPEB Liability
The SANDAG net OPEB liability was measured as of June 30, 2019, and the total OPEB liability used to calculate the net OPEB liability was determined by an actuarial valuation dated June 30, 2019, based on the following actuarial methods and assumptions:
97

San Diego Association of Governments Notes to the Basic Financial Statements, Continued
For the Fiscal Year Ended June 30, 2020
Discount Rate 6.50%
Inflation 2.50%
Salary Increase 2.75%, in aggregate plus Merit
Investment Rate of Return 6.50%
Mortality Rate Table1Derived using CalPERS' Membership Data for all funds
Pre-Retirement Turnover2Derived using CalPERS' Membership Data for all funds
Healthcare Trend Rate6.5% PPO / 6.5% HMO decreasing to 5.0% PPO / 5.0% HMO
Actuarial Assumptions:
1 The mortality table used was developed based on CalPERS’ specific data. The table includes 20 years of
mortality improvements using Society of Actuaries Scale BB. For more details on this table, please refer to the 2017 experience study report.
2 The Pre-Retirement Turnover table used was developed using the most recent (2017) CalPERS pension plan valuation.
The inflation rate changed from 2.75% to 2.50% and salary increase changed from 3% to 2.75%. There were no events occurring between the measurement date and the reporting date that would have an impact on the OPEB liability.
The long-term expected rate of return on OPEB plan investments was determined using a building-block method in which best-estimate ranges of expected future real rates of return (expected returns, net of OPEB plan investment expense and inflation) are developed for each major asset class. These ranges are combined to produce the long-term expected rate of return by weighting the expected future real rates of return by the target asset allocation percentage and by adding expected inflation.
Best estimates of arithmetic real rates of return for each major asset class included in the OPEB plan’s target asset allocation as of June 30, 2019, are summarized in the following table:
Global Equity 40.0% 5.50%
Global Debt Securities 43.0 2.35
Inflation Assets 5.0 1.50
Commodities 4.0 1.75
REITs 8.0 3.65
Total 100.0
Target Allocation
Long-term expected real rate of return
Asset Class
Long-term expected rate of return is 6.50%.
98
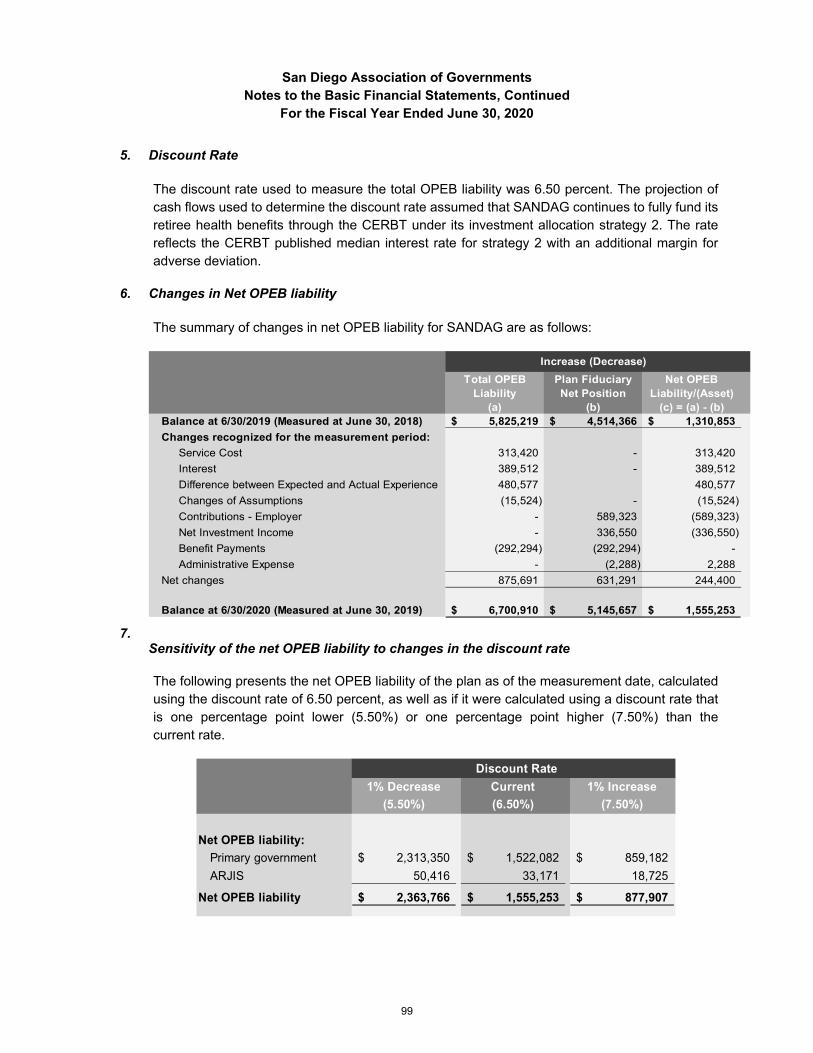
San Diego Association of Governments Notes to the Basic Financial Statements, Continued
For the Fiscal Year Ended June 30, 2020
5. Discount Rate
The discount rate used to measure the total OPEB liability was 6.50 percent. The projection of cash flows used to determine the discount rate assumed that SANDAG continues to fully fund its retiree health benefits through the CERBT under its investment allocation strategy 2. The rate reflects the CERBT published median interest rate for strategy 2 with an additional margin for adverse deviation.
6. Changes in Net OPEB liability
The summary of changes in net OPEB liability for SANDAG are as follows:
7.
Total OPEB Plan Fiduciary Net OPEBLiability Net Position Liability/(Asset)
(a) (b) (c) = (a) - (b)Balance at 6/30/2019 (Measured at June 30, 2018) 5,825,219$ 4,514,366$ 1,310,853$
Changes recognized for the measurement period:
Service Cost 313,420 - 313,420
Interest 389,512 - 389,512
Difference between Expected and Actual Experience 480,577 480,577
Changes of Assumptions (15,524) - (15,524)
Contributions - Employer - 589,323 (589,323)
Net Investment Income - 336,550 (336,550)
Benefit Payments (292,294) (292,294) -
Administrative Expense - (2,288) 2,288
Net changes 875,691 631,291 244,400
Balance at 6/30/2020 (Measured at June 30, 2019) 6,700,910$ 5,145,657$ 1,555,253$
Increase (Decrease)
Sensitivity of the net OPEB liability to changes in the discount rate
The following presents the net OPEB liability of the plan as of the measurement date, calculated using the discount rate of 6.50 percent, as well as if it were calculated using a discount rate that is one percentage point lower (5.50%) or one percentage point higher (7.50%) than the current rate.
1% Decrease Current 1% Increase
(5.50%) (6.50%) (7.50%)
Primary government 2,313,350$ 1,522,082$ 859,182$
ARJIS 50,416 33,171 18,725
2,363,766$ 1,555,253$ 877,907$
Net OPEB liability:
Net OPEB liability
Discount Rate
99

San Diego Association of Governments Notes to the Basic Financial Statements, Continued
For the Fiscal Year Ended June 30, 2020
8. Sensitivity of the net OPEB liability to changes in the healthcare cost trend rates
The following presents the net OPEB liability as of the measurement date, calculated using the current healthcare cost trend rates (HMO and PPO), as well as if it were calculated using rates that are one percentage point lower or one percentage point higher than the current rate.
1% Decrease Current 1% Increase
Net OPEB liability
Primary government 937,676$ 1,522,082$ 2,336,798$
ARJIS 20,435 33,171 50,927
958,111$ 1,555,253$ 2,387,725$
Healthcare Cost Trend Rates
(7.00%HMO / 7.50%PPO
decreasing to 6.00%HMO / 6.00%PPO
Net OPEB liability
(5.50%HMO / 5.50%PPO
decreasing to 4.00%HMO / 4.00%PPO
(6.50%HMO / 6.50%PPO
decreasing to 5.00%HMO / 5.00%PPO
9. OPEB plan fiduciary net position
The CERBT issues a publicly available financial report that includes financial statements and required supplementary information. That report may be obtained from the California Public Employees’ Retirement System, CERBT, P.O. Box 942703, Sacramento, CA 94429-2703.
10. Recognition of deferred outflow and deferred inflows of resources
Gains and losses related to changes in total OPEB liability and fiduciary net position are recognized in OPEB expense systematically over time.
Amounts are first recognized in OPEB expense for the year the gain or loss occurs. The remaining amounts are categorized as deferred outflows and deferred inflows of resources related to OPEB and are to be recognized in future OPEB Expense.
The recognition period differs depending on the source of the gain or loss.
Net difference between projected 5 year straight-line amortizationand actual earnings on OPEB plan investments
All other amounts Straight-line amortization over the expected average remaining service lifetime (EARSL) (10 years at June 30, 2019)
100

San Diego Association of Governments Notes to the Basic Financial Statements, Continued
For the Fiscal Year Ended June 30, 2020
11. OPEB expense and deferred outflows/inflows of resources related to OPEB
For the fiscal year ended June 30, 2020, SANDAG recognized OPEB expense of $440,622 for the plan as follows:
Fiscal Year 2020
Primary Government 436,855$
ARJIS 3,767
Total OPEB expense 440,622$
The primary government reports other amounts for the plan as deferred outflows and deferred inflows of resources related to OPEB as follows:
OPEB contributions subsequent to measurement date 514,291$ -$
Change in proportionate share 55,998 (29,791)
Changes of assumptions - (13,674)
Net difference between projected and actual earnings
on OPEB plan investments 423,294 (25,208)
Total 993,583$ (68,673)$
Deferred Outflows of Resources
Deferred Inflows of Resources
Primary Government
ARJIS reports other amounts for the plan as deferred outflows and deferred inflows of resources related to OPEB as follows:
OPEB contributions subsequent to measurement date 11,208$ -$ Change in proportionate share - (26,209) Change in assumptions - (298)
Difference between expected and actuarial experience 9,225 - on OPEB plan investments - (548)
Total 20,433$ (27,055)$
Deferred Outflows of Resources
Deferred Inflows of Resources
ARJIS
The primary government reported $514,291 and ARJIS reported $11,208 deferred outflows of resources related to employer contributions subsequent to the measurement date which will be recognized as a reduction of the net OPEB liability in the year ending June 30, 2021, for these contributions.
101

San Diego Association of Governments Notes to the Basic Financial Statements, Continued
For the Fiscal Year Ended June 30, 2020
The following amounts reported as deferred outflows/inflows of resources related to OPEB for the primary government that will be recognized in future periods as OPEB expense:
Fiscal Year Ended June 30
Deferred Outflows/(Inflows)
of Resources
2021 45,651$
2022 45,651
2023 50,765
2024 40,991
2025 45,514
Thereafter 182,047
Total 410,619$
The following amounts reported as deferred inflows of resources related to OPEB for ARJIS that will be recognized in future periods as OPEB expense:
Fiscal Year Ended June 30
Deferred Outflows/(Inflows)
of Resources
2021 (7,237)$
2022 (7,237)
2023 (7,123)
2024 (1,194)
2025 992
Thereafter 3,969
Total (17,830)$
L. Pension plan
Qualified permanent and probationary employees are eligible to participate in pension benefits through the California Public Employees’ Retirement System (CalPERS).
1. Plan description
SANDAG and ARJIS, a blended component unit of SANDAG, provide a defined benefit pension plan through the Miscellaneous Plan (the Plan), an agent multiple-employer defined benefit pension plan administered by CalPERS. CalPERS acts as a common investment and administrative agent for its participating public employers within the State of California. An agent multiple-employer plan is one in which the assets of the multiple employers are pooled together for investment purposes, but separate accounts are maintained for each individual employer.
102

San Diego Association of Governments Notes to the Basic Financial Statements, Continued
For the Fiscal Year Ended June 30, 2020
Benefit provisions under the plan are established by state statute and local government resolution. CalPERS issues publicly available reports that include a full description of the pension plans regarding benefit provisions, assumptions, and membership information that can be found on the CalPERS website.
2. Benefits provided
CalPERS provides service retirement and disability benefits, annual cost of living adjustments, and death benefits to plan members, which include public employees and their beneficiaries. SANDAG has three classes of plan members, based on date of hire. Benefits for all plan members are based on years of credited service, equal to one year of full-time employment.
The plan’s provisions and benefits in effect at June 30, 2020, are summarized as follows:
Hire datePrior to 10/27/12
After
10/27/121
On or after
1/1/132
Benefit formula 2.7% @ 55 2% @ 60 2% @ 62
Benefit vesting schedule (# years of service) 5 yrs 5 yrs 5 yrs
Benefit paymentsmonthly for
lifemonthly for
lifemonthly for
life
Retirement age 50 - 55 50 - 60 52 - 62
Monthly benefits, as a % of eligible compensation 2.7% 2.0% 2.0%
Required employee contribution rates 8% 7% 6.25%
Required employer contribution rates 10.320% 10.320% 10.320%
1 Includes those hired on or after January 1, 2013, who are current members of CalPERS (or a reciprocal agency) and have not had a break in service with a CalPERS agency of greater than six months.
2 Applicable to employees who are not members of CalPERS (or a reciprocal system) at the time of hire or have had a break in service greater than six months from a CalPERS agency.
The Plan also provides optional benefits for survivor and disability benefits. The benefit provisions and all other requirements are established by contracts with CalPERS in accordance with the provisions of the Public Employees’ Retirement law.
CalPERS issues an annual audited stand-alone financial report and a copy can be obtained by submitting a written request to CalPERS at P.O. Box 942709, Sacramento, CA 94229-2709 or by visiting its website at calpers.ca.gov.
103

San Diego Association of Governments Notes to the Basic Financial Statements, Continued
For the Fiscal Year Ended June 30, 2020
3. Employees covered by benefit terms
The following employees were covered based on the CalPERS actuarial valuation report dated June 30, 2018:
Active members 337
Transferred members 87
Terminated members 227
Retired members and beneficiaries 131
Total 782
Active to Retired Ratio 2.57%
4. Contributions
All employer contribution rates are actuarially determined annually and become effective July 1 following the notice of change in the rate in accordance with Section 20814(c) of the California Public Employees’ Retirement Law (PERL). The employer and employee contributions are a percentage of the covered payroll, which is based on pensionable earnings. The rates are defined by law and are based on the employer’s benefit formula as determined by periodic actuarial valuations. These contributions are deposited in a fund established for each entity for the purpose of creating actuarial reserves for future benefits. The actuarially determined rate is the estimated amount necessary to finance the costs of benefits earned by employees during the year, with an additional amount to finance any unfunded accrued liability.
For the reporting fiscal year 2020, the required contributions were actuarially determined by the funding valuation reports dated June 30, 2018. The actuarially required contribution rate was 22.099% of covered payroll and actual contributions totaled $6,503,802 for the primary government and $422,505 for ARJIS. This rate includes the mandatory employee contribution rate, as shown in the Benefits Provided table in Note II.L.2, that is currently paid by SANDAG for all eligible members. PEPRA members pay 6.75% of covered-employee payroll which is 60.67% of the total normal cost of 11.126%.
5. Net pension liability
The Plan’s net pension liability was measured as of June 30, 2019, and the total pension liability used to calculate the net pension liability was determined by an actuarial valuation as of June 30, 2018. The total pension liability was rolled forward to determine the June 30, 2019 total pension liability.
104

San Diego Association of Governments Notes to the Basic Financial Statements, Continued
For the Fiscal Year Ended June 30, 2020
6. Actuarial methods and assumptions used to determine total pension liability
The June 30, 2019 (the measurement date), total pension liability was based on the following actuarial methods and assumptions applied to all periods included in the measurement:
Actuarial Assumptions:
Discount Rate 7.15%
Inflation 2.50%
Salary Increase Varies by Entry Age and Service
Investment Rate of Return
Mortality Rate Table1Derived using CalPERS' Membership Data for all Funds
Post Retirement Benefit Increase
Entry Age Normal
7.15% Net of Pension Plan Investment Expenses; includes inflation
Contract COLA up to 2.50% until Purchasing Power Protection Allowance Floor on Purchasing Power applies, 2.50% thereafter
Actuarial Cost Method
1The mortality table used was developed based on CalPERS-specific data. The probabilities of mortality are based on the 2017 CalPERS Experience Study for the period from 1997 to 2015. Pre-retirement and Post-retirement mortality rates include 15 years of projected mortality improvement using 90% of Scale MP-2016 published by the Society of Actuaries. For more details on this table, please refer to the CalPERS Experience Study and Review of Actuarial Assumptions report from December 2017 that can be found on the CalPERS website.
All other actuarial assumptions used in the June 30, 2018 valuation were based on the results of an actuarial experience study for the period from 1997 to 2015, including updates to salary increase, mortality, and retirement rates. The Experience Study report can be accessed on the CalPERS website at calpers.ca.gov under Forms and Publications.
7. Change of assumptions
In 2019, there were no changes of assumptions.
8. Discount rate
The discount rate used to measure the total pension liability was 7.15 percent. The projection of cash flows used to determine the discount rate assumed that contributions from plan members will be made at the current member contribution rates and that contributions from employers will be made at statutorily required rates, actuarially determined. Based on those assumptions, the Plan’s fiduciary net position was projected to be available to make all projected future benefit payments of current plan members. Therefore, the long-term expected rate of return on plan investments was applied to all periods of projected benefit payments to determine the total pension liability.
105

San Diego Association of Governments Notes to the Basic Financial Statements, Continued
For the Fiscal Year Ended June 30, 2020
The long-term expected rate of return on pension plan investments was determined using a building-block method in which expected future real rates of return (expected returns, net of pension plan investment expense and inflation) are developed for each major asset class.
In determining the long-term expected rate of return, CalPERS took into account both short-term and long-term market return expectations as well as the expected pension fund (PERF) cash flows. Using historical returns of all the PERF’s asset classes (which includes the agent plan and two cost-sharing plans or PERF A, B, and C funds), expected compound (geometric) returns were calculated over the short-term (first 10 years) and the long-term (11–60 years) using a building-block approach. Using the expected nominal returns for both short-term and long-term, the present value of benefits was calculated for each PERF fund. The expected rate of return was set by calculating the single equivalent expected return that arrived at the same present value of benefits for cash flows as the one calculated using both short-term and long-term returns. The expected rate of return was then set equal to the single equivalent rate calculated above and rounded down to the nearest one-quarter of one percent.
The table below reflects long-term expected real rate of return by asset class. The rate of return was calculated using the capital market assumptions applied to determine the discount rate and asset allocation. The target allocation shown was adopted by the Board effective on July 1, 2014.
Global Equity 50.0% 4.80% 5.98%
Fixed Income 28.0 1.00 2.62
Inflation Assets - 0.77 1.81
Private Equity 8.0 6.30 7.23
Real Assets 13.0 3.75 4.93
Liquidity 1.0 - (0.92)
Current Target Allocation
Real Return
Years 1 - 102
Real Return
Years 11+3Asset Class1
1 In the System's CAFR, Fixed Income is included in Global Debt Securities; Liquidity is included in Short-term Investments; Inflation Assets are included in both Global Equity Securities and Global Debt Securities.
2 An expected inflation of 2.00% used for this period. 3 An expected inflation of 2.92% used for this period.
9. Subsequent events
There were no subsequent events that would materially affect the results presented in this disclosure.
10. Pension plan fiduciary net position
The plan fiduciary net position (assets) disclosed in the SANDAG GASB report may differ from the plan assets reported in the SANDAG actuarial valuation report due to several reasons. First, CalPERS must keep Reserves for Deficiencies and Fiduciary Self Insurance. These amounts are excluded for rate-setting purposes in the actuarial valuation report while required to
106

San Diego Association of Governments Notes to the Basic Financial Statements, Continued
For the Fiscal Year Ended June 30, 2020
be included for GASB reporting purposes. In addition, differences may result from early Comprehensive Annual Financial Report closing and final reconciled reserves.
11. Changes in net pension liability
The following table provides the aggregate changes in the pension plans’ net pension liabilities of SANDAG for the measurement period of July 1, 2018 to June 30, 2019:
Total Pension Plan Fiduciary Net PensionLiability Net Position Liability/(Asset)
(a) (b) (c) = (a) - (b)
Balance at 6/30/2018 (Valuation Date)1 171,084,267$ 118,407,102$ 52,677,165$
Changes for the year
Service Cost 5,278,647 - 5,278,647
Interest on the Total Pension Liability 12,277,206 - 12,277,206
Differences between Expected and Actual Experience 1,404,207 - 1,404,207
Plan to Plan Resource Movement - 67,310 (67,310)
Contributions from Employer - 5,912,799 (5,912,799)
Contributions from Employees - 2,218,113 (2,218,113)
Net Investment Income2 - 7,858,870 (7,858,870)
Benefit Payments, including Refunds
of Employee Contributions (6,837,259) (6,837,259) -
Administrative Expense - (84,498) 84,498
Other Miscellaneous Income/(Expenses)3 - 274 (274)
Net changes during 2017 - 2018 12,122,801 9,135,609 2,987,192
Balance at 6/30/2019 (Measurement Date)1 183,207,068$ 127,542,711$ 55,664,357$
Increase (Decrease)
1 The fiduciary net position includes receivables for employee service buybacks, deficiency reserves, fiduciary self-
insurance and OPEB expense. 2 Net of administrative expenses. 3 During fiscal year 2017-18, as a result of Government Accounting Standards Board Statement (GASB) No. 75,
Accounting and Financial Reporting for Postemployment Benefits Plans Other than Pensions (GASB 75), CalPERS reported its proportionate share of activity related to postemployment benefits for participation in the State of California’s agent OPEB plan. Accordingly, CalPERS recorded a one-time expense as a result of the adoption of GASB 75.
12. Sensitivity of the net pension liability to changes in the discount rate
The following presents the net pension liability of the Plan, calculated using the discount rate, as well as what the net pension liability would be if it were calculated using a discount rate that is one percentage point lower or one percentage point higher than the current rate:
107

San Diego Association of Governments Notes to the Basic Financial Statements, Continued
For the Fiscal Year Ended June 30, 2020
Discount Rate -1% (6.15%)
Current Discount Rate
(7.15%)
Discount Rate +1
(8.15%)
Primary government 75,832,120$ 52,268,831$ 32,807,120$
ARJIS 4,926,261 3,395,526 2,131,240
80,758,381$ 55,664,357$ 34,938,360$
Plan's Net Pension Liability
Total Net Pension Liability
13. Recognition of gains and losses
Under GASB 68, gains and losses related to changes in total pension liability and fiduciary net position are recognized in pension expense systematically over time.
The first amortized amounts are recognized in pension expense for the year the gain or loss occurs. The remaining amounts are categorized as deferred outflows and deferred inflows of resources related to pensions and are to be recognized in future pension expense.
The amortization period differs depending on the source of the gain or loss:
Net Difference between projected 5 year straight-line amortizationand actual earnings on pension plan investments
All other amounts Straight-line amortization over the expected average service lifetime (EARSL) of all members that are provided with benefits (active, inactive, and retired) as of the beginning of the measurement period
Source Amortization Period
The expected average remaining service lifetime (EARSL) is calculated by dividing the total future service years by the total number of plan participants (active, inactive, and retired).
The EARSL for the plan for the measurement period ending June 30, 2019 is 4.9 years, which was obtained by dividing the total service years of 3,861 (the sum of remaining service lifetimes of the active employees) by 796 (the total number of participants: active, inactive, and retired). Note that inactive employees and retirees have remaining service lifetimes equal to zero. Also note that total future service is based on the members’ probability of decrementing due to an event other than receiving a cash refund.
14. Pension expense and deferred outflows and deferred inflows of resources related to pensions
For the fiscal year ending June 30, 2020 (the reporting period), SANDAG recognized a pension expense of $4,426,832 for the plan as follows:
108

San Diego Association of Governments Notes to the Basic Financial Statements, Continued
For the Fiscal Year Ended June 30, 2020
Fiscal Year 2020
Primary government 3,709,690$
ARJIS 717,142
Total pension expense 4,426,832$
Deferred outflows of resources and deferred inflows of resources represent the unamortized portion of changes to net pension liability to be recognized in future periods in a systematic and rational manner.
The following are the sources of deferred outflows of resources and deferred inflows of resources for the primary government as of the measurement date of June 30, 2019:
Changes of assumptions 2,980,631$ (845,280)$
Differences between expected and actual experience 1,622,814 (546,211)
Change in proportionate share 1,226,014 (1,393,939)
Employer contributions for fiscal year 2020 6,503,802 -
Net difference between projected and actual earnings
on pension plan investments - (646,210)
Total 12,333,261$ (3,431,640)$
Deferred Outflows of Resources
Deferred Inflows of Resources
The following are the sources of deferred outflows of resources and deferred inflows of resources for ARJIS as of the measurement date of June 30, 2019:
Changes of assumptions 193,630$ (54,912)$
Differences between expected and actual experience 105,423 (35,483)
Change in proportionate share 343,076 (175,151)
Employer contributions for fiscal year 2020 422,505 -
Net difference between projected and actual earnings
on pension plan investments - (41,980)
Total 1,064,634$ (307,526)$
Deferred Outflows of Resources
Deferred Inflows of Resources
The deferred outflows of resources of the primary government related to pension resulting from employer contributions subsequent to the measurement date of June 30, 2019, totaling
109
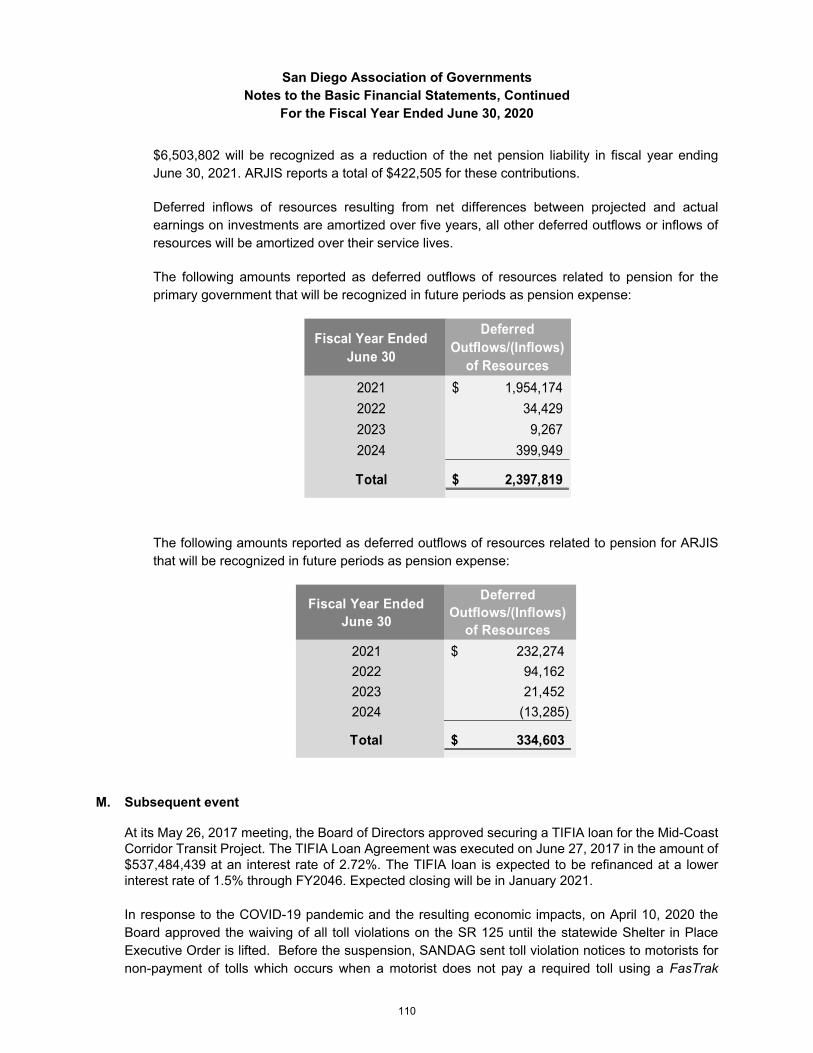
San Diego Association of Governments Notes to the Basic Financial Statements, Continued
For the Fiscal Year Ended June 30, 2020
$6,503,802 will be recognized as a reduction of the net pension liability in fiscal year ending June 30, 2021. ARJIS reports a total of $422,505 for these contributions.
Deferred inflows of resources resulting from net differences between projected and actual earnings on investments are amortized over five years, all other deferred outflows or inflows of resources will be amortized over their service lives.
The following amounts reported as deferred outflows of resources related to pension for the primary government that will be recognized in future periods as pension expense:
Fiscal Year Ended June 30
Deferred Outflows/(Inflows)
of Resources
2021 1,954,174$
2022 34,429
2023 9,267
2024 399,949
Total 2,397,819$
The following amounts reported as deferred outflows of resources related to pension for ARJIS that will be recognized in future periods as pension expense:
Fiscal Year Ended June 30
Deferred Outflows/(Inflows)
of Resources
2021 232,274$
2022 94,162
2023 21,452
2024 (13,285)
Total 334,603$
M. Subsequent event
At its May 26, 2017 meeting, the Board of Directors approved securing a TIFIA loan for the Mid-Coast Corridor Transit Project. The TIFIA Loan Agreement was executed on June 27, 2017 in the amount of $537,484,439 at an interest rate of 2.72%. The TIFIA loan is expected to be refinanced at a lower interest rate of 1.5% through FY2046. Expected closing will be in January 2021.
In response to the COVID-19 pandemic and the resulting economic impacts, on April 10, 2020 the Board approved the waiving of all toll violations on the SR 125 until the statewide Shelter in Place Executive Order is lifted. Before the suspension, SANDAG sent toll violation notices to motorists for non-payment of tolls which occurs when a motorist does not pay a required toll using a FasTrak
110

San Diego Association of Governments Notes to the Basic Financial Statements, Continued
For the Fiscal Year Ended June 30, 2020
account, online, or at a cash and credit card machine located on the roadway. The suspension of toll violations by SANDAG, as well as the reduction in traffic caused by the COVID-19 pandemic, has led to a 10% decrease in total SR 125 revenues.
Under Section 6.03 of the Master Indenture for the South Bay Expressway Toll Revenue Bonds, SANDAG covenants that it shall at all times establish, levy, maintain and collect tolls in connection with the toll road sufficient to produce net revenue in each fiscal year equal to or in excess of 150% of the annual debt service in such fiscal year on all outstanding first senior lien obligations (the “Coverage Ratio”). Though traffic has begun to slowly recover since March 2020, SANDAG estimates that, based on current conditions, SR 125 will generate net revenues at levels that will not permit SANDAG to comply with the Coverage Ratio as of June 30, 2021. Although SANDAG may not be able to comply with the Coverage Ratio covenant, SANDAG has a healthy reserve through years of operations to meet operation and maintenance expenditures.
The failure of toll rates to yield an amount sufficient to achieve the Coverage Ratio is not deemed to constitute an event of default resulting in an acceleration of debt. In the event SANDAG cannot meet the Coverage Ratio covenant, then as soon as practicable SANDAG will employ a Traffic Consultant to review and analyze the operations of the SR 125 and submit to the Board. Within 180 days after the end of the fiscal year in question, a written report which shall include the actions that the Traffic Consultant recommends should be taken by SANDAG with respect to:
1. Revising the toll rates as permitted by law
2. Altering SANDAG’s methods of operations
3. Taking other action projected to produce the amount required to comply with the Coverage Ratio
In an effort to enhance SANDAG’s ability to comply with the Coverage Ratio, on December 18, 2020, the Board approved a staff recommendation to prospectively reinstate the enforcement and collection of toll violations on SR 125 and resuming the practice of placing vehicle registration holds with the California Department of Motor Vehicles for overdue tolls.
111

This page intentionally left blank.
112

REQUIRED SUPPLEMENTARY INFORMATION
113

This page intentionally left blank.
114

San Diego Association of Governments Required Supplementary Information
For the Fiscal Year Ended June 30, 2020
A. Other Post-Employment Benefits (OPEB) Plan:
Schedule of Change in Net OPEB Liability And Related Ratios
Last Ten Years1
Measurement Period 2019 2018 2017
TOTAL OPEB LIABILITY
Service cost 313,420$ 305,032$ 286,416$
Interest 389,512 364,794 342,733
Changes of Benefit Terms - - -
Difference between expected and actual experience 480,577 - -
Changes of assumptions (15,524) - -
Benefit payments, including refunds of employee contributions (292,294) (303,569) (313,176)
Net change in total OPEB liability 875,691 366,257 315,973
Total OPEB liability - beginning 5,825,219 5,458,962 5,142,989
Total OPEB liability - ending 6,700,910$ 5,825,219$ 5,458,962$
PLAN FIDUCIARY NET POSITION
Contributions - employer 589,323$ 607,674$ 605,463$
Investment income 336,550 248,428 257,936
Benefit payments, including refunds of employee contributions (292,294) (303,569) (313,176)
Administrative expense (2,288) (2,155) (1,871)
Other expense - (5,250) -
Net change in fiduciary net position 631,291 545,128 548,352
Plan fiduciary net position - beginning 4,514,366 3,969,238 3,420,886
Plan fiduciary net position - ending 5,145,657$ 4,514,366$ 3,969,238$
Plan net OPEB liability - ending 1,555,253$ 1,310,853$ 1,489,724$
Plan fiduciary net position as a percentage of the total OPEB liability 76.79% 77.50% 72.71%
Covered employee payroll 28,718,832$ 26,864,803$ 26,677,526$
Plan net OPEB liability as a percentage of covered employee payroll 5.42% 4.88% 5.58%
Notes to Schedule
Changes in Assumptions: In 2019, inflation rate decreased from 2.75% to 2.50%. Salary increase changed from 3% to 2.75%.
1 Ten years has not been presented as Governmental Accounting Standards Board 75 was implemented for the
fiscal year ended June 30, 2018.
115

San Diego Association of Governments Required Supplementary Information, Continued
For the Fiscal Year Ended June 30, 2020
Schedule of OPEB Contributions Last Ten Years2
Actuarially Determined Contribution 525,499$ 515,120$ 514,196$
Contributions in Relation to the Actuarially Determined
Contribution (525,499) (515,120) (514,196)
Contribution Deficiency (Excess) -$ -$ -$
Covered Employee Payroll 31,342,592$ 28,718,832$ 26,864,803$
Contributions as a Percentage of Covered Employee Payroll 1.677% 1.794% 1.914%
Fiscal Year 2020
Fiscal Year 2019
Fiscal Year 2018
Notes to Schedule
The actuarial methods and assumptions used to set the actuarially determined contributions for fiscal year 2020 were from the June 30, 2019 actuarial valuations.
2 Ten years has not been presented as Governmental Accounting Standards Board 75 was implemented for the
fiscal year ended June 30, 2018.
116

San Diego Association of Governments Required Supplementary Information, Continued
For the Fiscal Year Ended June 30, 2020
Actuarial Cost Method Entry Age Normal
Asset Valuation Method Market Value
Inflation 2.50%
Salary Increases 2.75% per annum, in aggregate
Minimum Contribution 4% per year
Investment Rate of Return 6.50% per year; assumes SANDAG invests in the CERBT asset allocation Strategy 2 with an additional margin for adverse deviation
Medical Trend Rates Medical costs are adjusted in future years 6.5% (PPO) and 6.5% (HMO) then decreasing to 5.0% (PPO) and 5.0% (HMO)
Retirement Age CalPERS pension plan experience study. According to the following retirement tables:
Miscellaneous Tier 1: 2.7 @ 55Miscellaneous Tier 2: 2.0 @ 60Miscellaneous Tier 3: 2.0 @ 62
Methods and Assumptions
117

San Diego Association of Governments Required Supplementary Information
For the Fiscal Year Ended June 30, 2020
B. Pension Plan:
Schedule of Change in Net Pension Liability And Related Ratios
Last Ten Years3
2018 - 2019 2017 - 2018 2016 - 2017 2015 - 2016 2014 - 2015 2013 - 2014
TOTAL PENSION LIABILITY
Service cost 5,278,647$ 5,162,090$ 5,144,459$ 4,534,280$ 4,304,754$ 4,383,941$
Interest 12,277,206 11,458,443 10,789,583 10,232,734 9,525,794 8,721,625
Difference between expected & actual expe 1,404,207 982,989 (1,672,371) 329,995 2,226,555 -
Changes of assumptions - (1,592,648) 9,126,001 - (2,367,470) -
Benefit payments, including refunds of
employee contributions (6,837,259) (6,426,314) (5,530,744) (5,236,629) (4,831,911) (4,554,501)
Net change in total pension liability 12,122,801 9,584,560 17,856,928 9,860,380 8,857,722 8,551,065
Total pension liability - beginning 171,084,267 161,499,707 143,642,779 133,782,399 124,924,677 116,373,612
Total pension liability - ending 183,207,068$ 171,084,267$ 161,499,707$ 143,642,779$ 133,782,399$ 124,924,677$
PLAN FIDUCIARY NET POSITION
Contributions - employer 5,912,799$ 5,162,576$ 5,024,322$ 4,683,435$ 4,608,038$ 4,174,170$
Contributions - employee 2,218,113 2,068,605 2,107,922 1,991,758 1,899,740 2,766,681
Investment income 7,858,870 9,308,839 11,041,124 490,271 2,067,607 13,463,922
Administrative expense (84,498) (169,795) (142,422) (57,649) (106,721) (111,112)
Benefit payments, including refunds of
employee contributions (6,837,259) (6,426,314) (5,530,744) (5,236,629) (4,831,911) (4,554,501)
Other changes in fiduciary net position - (177,639) (447) 12 (214,517) -
Other miscellaneous income/(expense)1 67,584 (322,443) - - - -
Net change in fiduciary net position 9,135,609 9,443,829 12,499,755 1,871,198 3,422,236 15,739,160
Plan fiduciary net position - beginning2 118,407,102 108,963,273 96,463,518 94,592,320 91,170,084 75,430,924
Plan fiduciary net position - ending 127,542,711$ 118,407,102$ 108,963,273$ 96,463,518$ 94,592,320$ 91,170,084$
Plan net pension liability - ending 55,664,357$ 52,677,165$ 52,536,434$ 47,179,261$ 39,190,079$ 33,754,593$
Plan fiduciary net position as a percentage
of the total pension liability 69.62% 69.21% 67.47% 67.16% 70.71% 72.98%
Covered payroll 28,718,832$ 26,864,803$ 26,677,526$ 25,634,081$ 24,147,581$ 23,828,423$
Plan net pension liability
as a percentage of covered payroll 193.83% 196.08% 196.93% 184.05% 162.29% 141.66%
Measurement Period
Notes to Schedule
Benefit Changes: The figures above do not include any liability impact that may have resulted from plan changes which occurred after June 30, 2018 valuation date. This applies for voluntary benefit changes as well as any offers of two years additional service credit.
Changes in Assumptions: In 2019, there were no changes. In 2018, demographic assumptions and inflation rate were changed in accordance to the CalPERS Experience Study and Review of Actuarial Assumptions
3 Ten years has not been presented as Governmental Accounting Standards Board 68 was implemented for the
fiscal year ended June 30, 2015.
118

San Diego Association of Governments Required Supplementary Information, Continued
For the Fiscal Year Ended June 30, 2020
December 2017. There were no changes in discount rate. In 2017, the discount rate reduced from 7.65 percent to 7.15 percent. In 2016, there were no changes. In 2015, amounts reported reflect an adjustment of the discount rate from 7.5 percent (net of administrative expense) to 7.65 percent (without a reduction for pension plan administrative expense). In 2014, amounts reported were based on the 7.5 percent discount rate.
1 During Fiscal Year 2017 - 2018, as a result of Governmental Accounting Standards Board Statement (GASB) No. 75, Accounting and Financial Reporting for Postemployment Benefit Plans Other than Pensions (GASB 75), CalPERS reported its proportionate share of activity related to postemployment benefits for participation in the State of California’s agent OPEB plan. Accordingly, CalPERS recorded a one-time expense as a result of the adoption of GASB 75.
Additionally, CalPERS employees participate in various State of California agent pension plans during Fiscal Year 2017 – 2018, CalPERS recorded a correction to previously reported financial statements to properly reflect its proportionate share of activity related to pensions in accordance with GASB Statement No. 68, Accounting and Financial Reporting for Pensions (GASB 68).
2 Includes any beginning of year adjustment.
Schedule of Plan Contributions Last Ten Years4
Actuarially Determined Contribution 6,926,307$ 5,914,235$ 5,164,886$ 5,024,322$ 4,683,435$ 4,608,038$ 4,174,170$
Contributions in Relation to the
Actuarially Determined Contribution (6,926,307) (5,914,235) (5,164,886) (5,024,322) (4,683,435) (4,608,038) (4,174,170)
Contribution Deficiency (Excess) -$ -$ -$ -$ -$ -$ -$
Covered Payroll 31,342,592$ 28,718,832$ 26,864,803$ 26,677,526$ 25,634,081$ 24,147,581$ 23,828,423$
Contributions as a Percentage
of Covered Payroll 22.099% 20.594% 19.225% 18.834% 18.270% 19.083% 17.518%
Fiscal Year 2020
Fiscal Year 2019
Fiscal Year 2015
Fiscal Year 2014
Fiscal Year 2016
Fiscal Year 2017
Fiscal Year 2018
Notes to Schedule
The actuarial methods and assumptions used to set the actuarially determined contributions for fiscal year 2020 were from the June 30, 2017, public agency valuations.
4 Ten years has not been presented as Governmental Accounting Standards Board 68 was implemented for the
fiscal year ended June 30, 2015.
119

San Diego Association of Governments Required Supplementary Information, Continued
For the Fiscal Year Ended June 30, 2020
Actuarial Cost Method Entry Age Normal
Amortization Method/Period For details, see June 30, 2016, Funding Valuation Report
Asset Valuation Method Market Value of Assets. For details, see June 30, 2016 Funding Valuation Report.
Inflation 2.75%
Salary Increases Varies by Entry Age and Service
Payroll Growth 3.00%
Investment Rate of Return7.375% net of Pension Plan Investment and Administrative Expenses; includes inflation.
Retirement Age The probabilities of retirement are based on the 2014 CalPERS Experience Study for the period from 1997 to 2011.
Methods and Assumptions
120

San Diego Association of GovernmentsSchedule of Revenues, Expenditures and Changes in Fund Balances - Budget and Actual
General Fund
For the year ended June 30, 2020
Actual Variance with
Original Final Amounts Final Budget
REVENUES
Local Transportation Development Act sales tax funds 7,951,987$ 7,951,987$ 7,951,987$ -$
Member agency assessments 1,094,852 1,094,852 1,094,852 -
Other revenues - - 110,409 110,409
Investment earnings - - 578,011 578,011
Total revenues 9,046,839 9,046,839 9,735,259 688,420
EXPENDITURES
Current:
General government 60,606,404 61,505,270 54,579,269 6,926,001
Cost recovery (59,498,204) (59,498,204) (54,385,304) (5,112,900)
Total expenditures 1,108,200 2,007,066 193,965 1,813,101
REVENUES OVER
(UNDER) EXPENDITURES 7,938,639 7,039,773 9,541,294 2,501,521
OTHER FINANCING SOURCES (USES)
Transfers in 372,500 1,271,366 1,068,506 (202,860)
Transfers out (14,636,253) (11,461,416) (9,819,020) 1,642,396
Total other financing sources (uses) (14,263,753) (10,190,050) (8,750,514) 1,439,536
Net change in fund balances (6,325,114)$ (3,150,277)$ 790,780 3,941,057$
FUND BALANCES
Beginning of year 19,060,190
End of year 19,850,970$
See accompanying Notes to Required Supplementary Information.
Budgeted Amounts
121
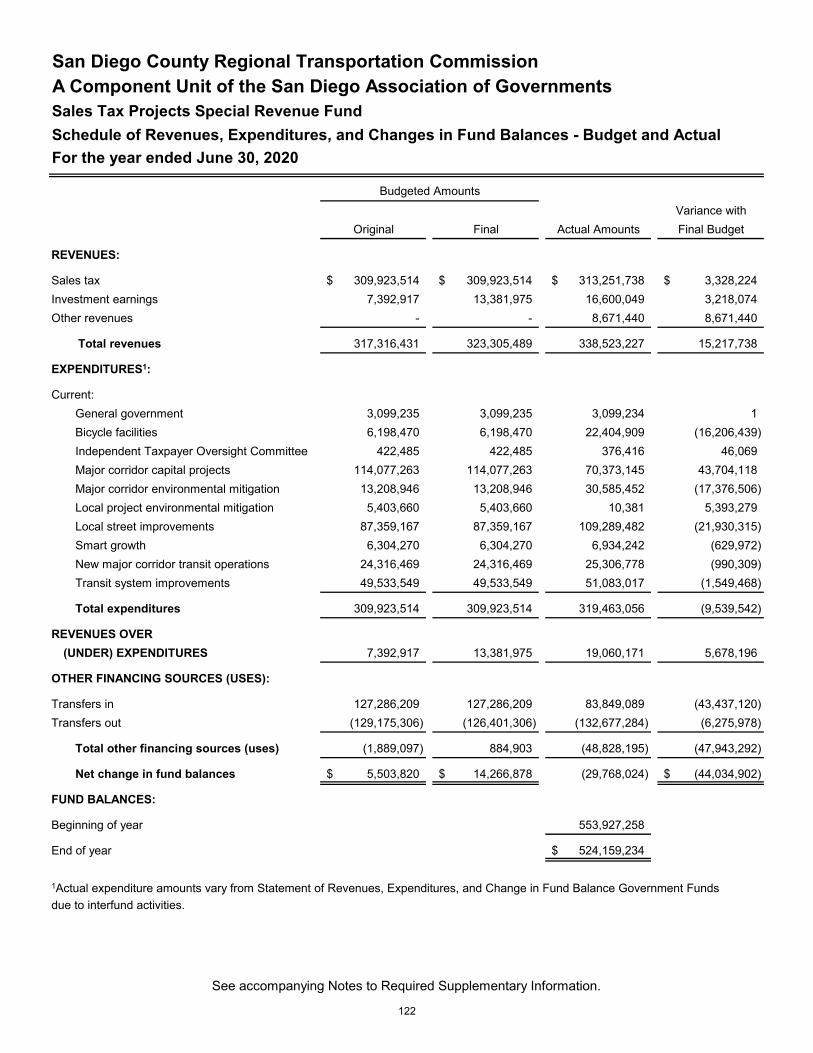
San Diego County Regional Transportation CommissionA Component Unit of the San Diego Association of GovernmentsSales Tax Projects Special Revenue Fund
Schedule of Revenues, Expenditures, and Changes in Fund Balances - Budget and Actual
For the year ended June 30, 2020
Variance with
Original Final Actual Amounts Final Budget
309,923,514$ 309,923,514$ 313,251,738$ 3,328,224$
7,392,917 13,381,975 16,600,049 3,218,074
- - 8,671,440 8,671,440
317,316,431 323,305,489 338,523,227 15,217,738
REVENUES:
Sales tax Investment earnings Other revenues
Total revenues
EXPENDITURES1:
Current:
General government 3,099,235 3,099,235 3,099,234 1
Bicycle facilities 6,198,470 6,198,470 22,404,909 (16,206,439)
Independent Taxpayer Oversight Committee 422,485 422,485 376,416 46,069
Major corridor capital projects 114,077,263 114,077,263 70,373,145 43,704,118
Major corridor environmental mitigation 13,208,946 13,208,946 30,585,452 (17,376,506)
Local project environmental mitigation 5,403,660 5,403,660 10,381 5,393,279
Local street improvements 87,359,167 87,359,167 109,289,482 (21,930,315)
Smart growth 6,304,270 6,304,270 6,934,242 (629,972)
New major corridor transit operations 24,316,469 24,316,469 25,306,778 (990,309)
Transit system improvements 49,533,549 49,533,549 51,083,017 (1,549,468)
Total expenditures 309,923,514 309,923,514 319,463,056 (9,539,542)
REVENUES OVER
(UNDER) EXPENDITURES 7,392,917 13,381,975 19,060,171 5,678,196
OTHER FINANCING SOURCES (USES):
Transfers in 127,286,209 127,286,209 83,849,089 (43,437,120)
Transfers out (129,175,306) (126,401,306) (132,677,284) (6,275,978)
Total other financing sources (uses) (1,889,097) 884,903 (48,828,195) (47,943,292)
Net change in fund balances 5,503,820$ 14,266,878$ (29,768,024) (44,034,902)$
FUND BALANCES:
Beginning of year 553,927,258
End of year 524,159,234$
1Actual expenditure amounts vary from Statement of Revenues, Expenditures, and Change in Fund Balance Government Funds due to interfund activities.
Budgeted Amounts
See accompanying Notes to Required Supplementary Information.
122

San Diego Association of Governments Notes to Required Supplementary Information
For the Fiscal Year Ended June 30, 2020
A. Budgetary information
Formal budget integration is employed as a management control device for the general fund, special revenue funds, the debt service fund, and the capital project fund. Budgets are adopted on a basis consistent with generally accepted accounting principles. The general fund, special revenue funds, and capital project fund have legally adopted annual program budgets.
After the annual program budget is adopted, the SANDAG Board of Directors (Board) can legally amend the budget at any time during the fiscal year to incorporate new grants or contracts which may become available during the year. Management can legally amend or transfer appropriations between programs or projects within the adopted or amended budget, once the budget has been approved, up to a maximum of $300,000 with monthly reporting of these delegated budget amendments to the Board. However, management may not exceed the authorization of any individual fund. The fund level is the legal level of control (the expenditure level on which expenditures may not legally exceed appropriations) for each budget for which data are presented in the annual financial report.
For the San Diego County Regional Transportation Commission sales tax projects special revenue fund, the annual program budget is based on expected sales tax revenue receipts. The expenditures budget reflects the appropriate program split in accordance the TransNet Extension Ordinance based on those expected sales tax revenue receipts. After the annual budget is adopted, the Board can legally amend the budget at any time during the fiscal year to incorporate changes in expected sales tax revenues.
Encumbrances represent commitments related to unperformed contracts for goods or services. Encumbrance accounting, under which purchase orders, contracts, and other commitments for the expenditure of resources are recorded to reserve that portion of the applicable appropriation, is utilized in the governmental funds. For budgeting purposes, encumbrances lapse at year end and may be reappropriated in the following year.
B. Additional appropriations or amendments
1. General fund
A portion of the general fund revenue is transferred to the general services fund to fund Overall Work Plan projects. Due to carryover of FY 2020 funds for delayed projects in the general services fund, the budgeted transfers out of the general fund decreased by $3,175,000 and budgeted expenditures in the general fund increased by $898,900 due to information technology costs as a result of the COVID-19 pandemic stay at home order.
2. San Diego County Regional Transportation Commission Sales Tax Projects fund
The Commission sales tax projects fund ended the year with $9,539,542 of expenditures in excess of appropriations, which is mainly the result of bond proceeds used for local street improvements and environmental mitigation program projects; and large payments of sales tax to bicycle facilities and transit system improvements. This fund is budgeted based on estimated sales tax revenues and does not include the use of debt proceeds or unspent revenue received in prior years.
123

This page intentionally left blank.
124

SUPPLEMENTARY INFORMATION
125

This page intentionally left blank.
126

San Diego Association of GovernmentsCombining Balance Sheet
Nonmajor Governmental Funds
June 30, 2020
Totals
General
Services SAFE
Fund Fund 2020
ASSETS
Cash and investments 1,509,907$ 9,734,201$ 11,244,108$
Accounts receivable 490,011 - 490,011
Prepaid items and other assets 311,770 2,585 314,355
Interest receivable - 37,293 37,293
Due from other funds 7,133,709 - 7,133,709
Due from other governments 14,380,341 530,326 14,910,667
Total assets 23,825,738$ 10,304,405$ 34,130,143$
LIABILITIES
Accounts payable 6,309,558$ 93,365$ 6,402,923$
Accrued liabilities 27,517 - 27,517
Retentions payable 1,338,157 - 1,338,157
Due to other funds 4,524,721 1,267,068 5,791,789
Due to other governments 5,776,509 257,601 6,034,110
Unearned revenue 2,123,818 - 2,123,818
Total liabilities 20,100,280 1,618,034 21,718,314
DEFERRED INFLOWS OF RESOURCES
Unavailable revenue 8,758,434 - 8,758,434
Total deferred inflows of resources 8,758,434 - 8,758,434
FUND BALANCES
Nonspendable:
Prepaid Items 311,770 2,585 314,355
Total nonspendable 311,770 2,585 314,355
Restricted for:
Freeway emergency service - 8,683,786 8,683,786
Total restricted - 8,683,786 8,683,786
Unassigned (5,344,746) - (5,344,746)
Total fund balances (deficit) (5,032,976) 8,686,371 3,653,395
Total liabilities, deferred inflow of resources and fund balances 23,825,738$ 10,304,405$ 34,130,143$
Special Revenue Funds
127

San Diego Association of GovernmentsCombining Statement of Revenues, Expenditures and Changes in Fund Balances Nonmajor Governmental Funds
For the year ended June 30, 2020
Totals
General
Services SAFE
Fund Fund 2020
REVENUES
Federal funds 19,127,470$ -$ 19,127,470$
State funds 7,566,002 - 7,566,002
Other local governmental funding 1,299,364 - 1,299,364
SAFE program revenue - 2,947,341 2,947,341
Member agency assessments 225,951 - 225,951
Investment earnings - 171,254 171,254
Total revenues 28,218,787 3,118,595 31,337,382
EXPENDITURES
Current:
Modeling and research 9,983,140 - 9,983,140
Criminal justice 1,103,957 - 1,103,957
Sustainable development 16,337,124 - 16,337,124
Sustainable mobility programs and services 19,500,160 - 19,500,160
Internal and external coordination 7,123,096 - 7,123,096
SAFE program - 1,520,134 1,520,134
Bicycle facilities 359,167 - 359,167
Smart growth 8,799,807 - 8,799,807
Transit system improvements 1,203,064 - 1,203,064
Total expenditures 64,409,515 1,520,134 65,929,649
REVENUES OVER (UNDER) EXPENDITURES (36,190,728) 1,598,461 (34,592,267)
OTHER FINANCING SOURCES (USES)
Transfers in 31,012,229 - 31,012,229
Transfers out - (1,495,750) (1,495,750)
Total other financing sources (uses) 31,012,229 (1,495,750) 29,516,479
Net change in fund balances (5,178,499) 102,711 (5,075,788)
FUND BALANCES (DEFICIT)
Beginning of year 145,523 8,583,660 8,729,183
End of year (5,032,976)$ 8,686,371$ 3,653,395$
Special Revenue Funds
128

San Diego Association of GovernmentsCombining Statement of Net Position
Nonmajor Proprietary Funds
June 30, 2020
Service Bureau SourcePoint Interstate 15 FasTrak Property Management 2020
ASSETS
Current assets:
Cash and cash equivalents - unrestricted -$ 204,344$ 36,896,689$ -$ 37,101,033$
Cash and cash equivalents - restricted - 9,271 - - 9,271
Accounts receivable 194,110 - 30,660 782,252 1,007,022
Prepaid items and other assets - - 3,760 2,033 5,793
Interest receivable - 754 146,443 - 147,197
Due from other funds 254,524 - 566,666 637,250 1,458,440
Due from other governments 135,698 - 206,038 - 341,736
Total current assets 584,332 214,369 37,850,256 1,421,535 40,070,492
Noncurrent assets:
Non-depreciable assets - - 6,153,226 - 6,153,226
Depreciable assets, net of accumulated depreciation - - 4,248,173 - 4,248,173
Total noncurrent assets - 10,401,399 - 10,401,399
Total assets 584,332 214,369 48,251,655 1,421,535 50,471,891
LIABILITIES
Current liabilities:
Accounts payable 55,040 1,500 855,207 14,837 926,584
Retentions payable - - 105,486 - 105,486
Due to other funds - 200 37,131 - 37,331
Due to other governments 229,404 - 543,495 - 772,899
Transponder deposits payable - - 4,048 - 4,048
Security deposit - - - 31,867 31,867
Unearned revenue - - 1,182,590 - 1,182,590
Total current liabilities 284,444 1,700 2,727,957 46,704 3,060,805
Total liabilities 284,444 1,700 2,727,957 46,704 3,060,805
NET POSITION
Net investment in capital assets - - 10,112,996 - 10,112,996
Restricted for:
Restricted - iCommute - 9,071 - - 9,071
Toll road operations and improvement - - 35,410,702 - 35,410,702
Property management - - - 1,374,831 1,374,831
Unrestricted 299,888 203,598 - - 503,486
Total net position 299,888$ 212,669$ 45,523,698$ 1,374,831$ 47,411,086$
Nonmajor Funds
TotalsBusiness-type Activities-Enterprise Funds
129

San Diego Association of GovernmentsCombining Statement of Revenues, Expenses and Changes in Fund Net Position
Nonmajor Proprietary Funds
For the year ended June 30, 2020
Totals
Service Bureau SourcePoint Interstate 15 FasTrak Property Management 2020
OPERATING REVENUES
Service Bureau transportation modeling service fees 390,227$ -$ -$ -$ 390,227$
SourcePoint charges for service and promotions - 4,416 - - 4,416
Interstate 15 FasTrak permit revenue - - 11,425,005 - 11,425,005
Interstate 15 FasTrak fines and forfeitures revenue - - 88,094 - 88,094
Total operating revenues 390,227 4,416 11,513,099 - 11,907,742
OPERATING EXPENSES
SourcePoint iCommute operating expenses - 6,065 - - 6,065
Interstate 15 FasTrak operating expenses - - 4,079,409 - 4,079,409
Payroll and other compensation 240,865 - 1,134,909 - 1,375,774
Administrative costs - 5,445 32,855 - 38,300
Professional services 69,378 - 1,150,391 - 1,219,769
Depreciation - - 2,460,519 - 2,460,519
Total operating expenses 310,243 11,510 8,858,083 - 9,179,836
Operating income (loss) 79,984 (7,094) 2,655,016 - 2,727,906
NONOPERATING REVENUES (EXPENSES)
Rental income (expense) - - - 825,650 825,650
Interest income (expense) - 3,593 801,359 - 804,952
Total nonoperating revenues (expenses) - 3,593 801,359 825,650 1,630,602
INCOME (LOSS) BEFORE CONTRIBUTIONS AND TRANSFERS 79,984 (3,501) 3,456,375 825,650 4,358,508
Transfers out - - (8,509,402) - (8,509,402)
Total transfers - - (8,509,402) - (8,509,402)
CHANGE IN FUND NET POSITION 79,984 (3,501) (5,053,027) 825,650 (4,150,894)
NET POSITION
Beginning of year 219,904 216,170 50,576,725 549,181 51,561,980
End of year 299,888$ 212,669$ 45,523,698$ 1,374,831$ 47,411,086$
Business-type Activities-Enterprise Funds
Nonmajor Funds
130

San Diego Association of GovernmentsCombining Statement of Cash Flows
Nonmajor Proprietary Funds
For the year ended June 30, 2020
Totals
Service Bureau SourcePoint Interstate 15 FasTrak Property Management 2020
CASH FLOWS FROM OPERATING ACTIVITIES
Receipts from customers and users 260,791$ 14,416$ 11,607,795$ -$ 11,883,002$
Payments for employee salaries and benefits (144,542) - (1,134,909) - (1,279,451)
Payments for operations (180,081) (12,010) (5,555,757) - (5,747,848)
Net cash provided by (used for) operating activities (63,832) 2,406 4,917,129 - 4,855,703
CASH FLOWS FROM CAPITAL FINANCING ACTIVITIES
Acquisition and construction of capital assets - - (2,017,414) (2,017,414)
Net cash provided by (used for) capital financing and related activities - - (2,017,414) - (2,017,414)
CASH FLOWS FROM NONCAPITAL FINANCING ACTIVITIES
Transfer from (to) governmental funds 63,832 (1,050) (11,543,175) (11,480,393)
Net cash provided by (used for) noncapital financing activities 63,832 (1,050) (11,543,175) - (11,480,393)
CASH FLOWS FROM INVESTING ACTIVITIES
Receipts from rent - - - 672,592 672,592
Payment made for rental property - - - (672,592) (672,592)
Interest received on investment - 4,759 1,067,903 - 1,072,662
Net cash provided by (used for) investing activities - 4,759 1,067,903 - 1,072,662
Net increase (decrease) in cash and investments - 6,115 (7,575,557) - (7,569,442)
Cash and cash equivalents, beginning of year - 207,500 44,472,246 - 44,679,746
Cash and cash equivalents, end of year -$ 213,615$ 36,896,689$ -$ 37,110,304$
RECONCILIATION OF OPERATING INCOME (LOSS) TO NET CASH
PROVIDED BY (USED FOR) OPERATING ACTIVITIES
Operating income (loss) 79,984$ (7,094)$ 2,655,016$ -$ 2,727,906$
Adjustments to reconcile net cash provided by (used for) operating activities:
Depreciation - - 2,460,519 - 2,460,519
(Increase) decrease in:
Accounts receivable (143,010) 10,000 182,376 - 49,366
Due from other governments (50,258) - 309,889 - 259,631
Increase (decrease) in:
Accounts payable 55,041 (500) (869,707) - (815,166)
Retentions payable - - 26,412 - 26,412
Due to other governments (5,589) - 183,596 - 178,007
Unearned revenue - - (30,972) - (30,972)
Total adjustments (143,816) 9,500 2,262,113 - 2,127,797
Net cash provided by (used for) operating activities (63,832)$ 2,406$ 4,917,129$ -$ 4,855,703$
NONCASH INVESTING, CAPITAL AND FINANCING ACTIVITIES
Capital asset purchase in accounts payable -$ -$ 182,917$ -$ 182,917$
Business-type Activities-Enterprise Funds
Nonmajor Funds
131

San Diego Association of GovernmentsSchedule of Revenues, Expenditures and Changes in Fund Balances - Budget and Actual Capital Projects Fund
For the year ended June 30, 2020
Actual Variance with
Original Final Amounts Final Budget
REVENUES
Federal funds 207,839,000$ 215,763,000$ 12,588,774$ (203,174,226)$
State funds 157,884,000 163,138,000 27,368,748 (135,769,252)
Local Transportation Development Act sales tax funds 2,766,000 4,483,000 2,188,641 (2,294,359)
Other governmental funding 42,751,000 55,968,000 6,628,748 (49,339,252)
Total revenues 411,240,000 439,352,000 48,774,911 (390,577,089)
EXPENDITURES
Current:
Regional transportation improvements 925,727,000 955,203,000 493,168,391 462,034,609
Total expenditures 925,727,000 955,203,000 493,168,391 462,034,609
REVENUES OVER
(UNDER) EXPENDITURES (514,487,000) (515,851,000) (444,393,480) 71,457,520
OTHER FINANCING SOURCES (USES)
Transfers in 514,487,000 515,851,000 441,390,988 (74,460,012)
Transfers out - - (287,504) (287,504)
Total other financing sources (uses) 514,487,000 515,851,000 441,103,484 (74,747,516)
Net change in fund balances -$ -$ (3,289,996) (3,289,996)$
FUND BALANCES (DEFICIT)
Beginning of year (601,432)
End of year (3,891,428)$
Budgeted Amounts1
1 Several transportation projects are completed in partnership with other governmental agencies. The TransNet Early Action Program (EAP) portion of the SANDAG Capital Budget is prepared in collaboration with Caltrans, the Metropolitan Transit System, and other governmental agencies in an effort to report, track, and monitor EAP projects on a combined, entire project level and the budgets include all funds received and spent by SANDAG and the other agencies. However, actuals are recorded and presented for funds directly received and spent by SANDAG and do not incorporate funds received and spent by others.
132

San Diego County Regional Transportation CommissionA Component Unit of the San Diego Association of GovernmentsCommercial Paper and Sales Tax Revenue Bonds Debt Service Fund
Schedule of Revenues, Expenditures, and Changes in Fund Balances - Budget and Actual
For the year ended June 30, 2020
Variance with
Original Final Actual Amounts Final Budget
REVENUES:
Investment earnings -$ -$ 3,401,768$ 3,401,768$
Debt repayments from other governments - - 4,150,792 4,150,792
Federal funds 6,479,618 6,479,618 6,588,313 108,695
Other revenues - - 2,093,813 2,093,813
Total revenues 6,479,618 6,479,618 16,234,686 9,755,068
EXPENDITURES:
Current:
Debt service:
Principal retirement 29,785,000 31,642,000 31,642,000 -
Debt issuance costs - - 854,744 (854,744)
Interest and other charges 78,360,946 134,709,321 99,827,008 34,882,313
Payments to refunding escrow agent - - 4,240,102 (4,240,102)
Total expenditures 108,145,946 166,351,321 136,563,853 29,787,468
REVENUES OVER
(UNDER) EXPENDITURES (101,666,328) (159,871,703) (120,329,167) 39,542,536
OTHER FINANCING
SOURCES (USES):
Transfers in 108,145,946 551,101,261 132,677,284 418,423,977
Transfers out (127,286,209) (127,286,209) (83,849,089) (43,437,120)
Commercial paper issued - - 29,378,000 (29,378,000)
Bonds issued - - 517,440,000 (517,440,000)
Premium on bonds issued - - 20,448,312 (20,448,312)
Payments to refunding escrow agent - (406,145,000) (446,044,046) 39,899,046
Total other financing
sources (uses) (19,140,263) 17,670,052 170,050,461 (152,380,409)
Net change in fund balances (120,806,591)$ (142,201,651)$ 49,721,294 191,922,945$
FUND BALANCES:
Beginning of year 102,592,899
End of year 152,314,193$
Budgeted Amounts
133

San Diego Association of GovernmentsSchedule of Revenues, Expenditures, and Changes in Fund Balances - Budget and Actual
San Diego Association of Governments Debt Service Fund
For the year ended June 30, 2020
Actual Variance with
Original Final Amounts Final Budget
REVENUES
Federal funds -$ -$ -$ -$
Investment earnings - - 3,587,633 (3,587,633)
Debt repayments from other governments - - -
Total revenues - - 3,587,633 (3,587,633)
EXPENDITURES
Current:
Debt service:
Principal retirement - - - -
Debt issuance costs - - 1,564,502 (1,564,502)
Interest and other charges - - 9,597,917 (9,597,917)
Total expenditures - - 11,162,419 (11,162,419)
REVENUES OVER
(UNDER) EXPENDITURES - - (7,574,786) (14,750,052)
OTHER FINANCING SOURCES (USES)
Transfers in - - - -
Transfers out - - (316,384,073) (316,384,073)
Bonds issued - - 335,000,000 335,000,000
Premium on bonds issued - - 35,972,526 35,972,526
Total other financing sources (uses) - - 54,588,453 54,588,453
Net change in fund balances -$ -$ 47,013,667 39,838,401$
FUND BALANCES
Beginning of year -
End of year 47,013,667$
Budgeted Amounts
134

San Diego Association of GovernmentsSchedule of Revenues, Expenditures and Changes in Fund Balances - Budget and Actual General Services Fund
For the year ended June 30, 2020
Actual Variance with
Original Final Amounts Final Budget
REVENUES
Federal funds 26,356,302$ 26,802,302$ 19,127,470$ (7,674,832)$
State funds 13,893,679 14,173,959 7,566,002 (6,607,957)
Other local governmental funding 3,326,746 3,420,512 1,299,364 (2,121,148)
Member agency assessments 225,953 225,953 225,951 (2)
Other revenues - - - -
Total revenues 43,802,680 44,622,726 28,218,787 (16,403,939)
EXPENDITURES
Current:
Modeling and research 13,290,140 12,302,213 9,983,140 2,319,073
Criminal justice 1,132,102 1,435,986 1,103,957 332,029
Sustainable development 11,956,963 17,537,617 16,337,124 1,200,493
Smart mobility programs and services 29,596,904 28,873,869 19,500,160 9,373,709
Internal and external coordination 9,259,765 8,152,092 7,123,096 1,028,996
Bicycle facilities 1,086,369 1,086,369 359,167 727,202
Smart growth 13,049,855 13,049,855 8,799,807 4,250,048
Transit system improvements 2,229,783 2,229,783 1,203,064 1,026,719
Total expenditures 81,601,881 84,667,784 64,409,515 20,258,269
REVENUES OVER
(UNDER) EXPENDITURES (37,799,201) (40,045,058) (36,190,728) 3,854,330
OTHER FINANCING SOURCES (USES)
Transfers in 37,799,201 40,045,058 31,012,229 (9,032,829)
Total other financing sources (uses) 37,799,201 40,045,058 31,012,229 (9,032,829)
Net change in fund balances -$ -$ (5,178,499) (5,178,499)$
FUND BALANCES (DEFICIT)
Beginning of year 145,523
End of year (5,032,976)$
Budgeted Amounts
135

San Diego Association of GovernmentsSchedule of Revenues, Expenditures and Changes in Fund Balances - Budget and Actual SAFE Program Fund
For the year ended June 30, 2020
Actual Variance with
Original Final Amounts Final Budget
REVENUES
SAFE program revenue 4,299,000$ 4,299,000$ 2,947,341$ (1,351,659)$
Investment earnings - - 171,254 171,254
Total revenues 4,299,000 4,299,000 3,118,595 (1,180,405)
EXPENDITURES
Current:
SAFE program expense 1,761,663 1,779,556 1,520,134 259,422
Total expenditures 1,761,663 1,779,556 1,520,134 259,422
REVENUES OVER
(UNDER) EXPENDITURES 2,537,337 2,519,444 1,598,461 (920,983)
OTHER FINANCING SOURCES (USES)
Transfers out (2,801,826) (2,748,331) (1,495,750) 1,252,581
Total other financing sources (uses) (2,801,826) (2,748,331) (1,495,750) 1,252,581
Net change in fund balances (264,489)$ (228,887)$ 102,711 331,598$
FUND BALANCES
Beginning of year 8,583,660
End of year 8,686,371$
Budgeted Amounts
136

This page intentionally left blank.
137

STATISTICAL SECTION
This part of the San Diego Association of Governments (SANDAG) Comprehensive Annual Financial
Report (CAFR) presents detailed information as a context for understanding what the information in the
financial statements, note disclosures, and required supplementary information says about SANDAG’s
overall financial health.
Contents Page
Financial Trends 139These schedules contain trend information to help the reader understand how SANDAG’s
financial performance and well-being changed over time.
Revenue Capacity 145These schedules contain information to help the reader assess SANDAG’s most significant
local revenue source, the sales tax.
Debt Capacity 148These schedules present information to help the reader assess the affordability of SANDAG’s
current levels of outstanding debt and SANDAG’s ability to issue additional debt in the future.
Demographic and Economic Information 151These schedules offer demographic and economic indicators to help the reader understand
the environment within which SANDAG’s financial activities take place.
Operating Information 153These schedules contain service and infrastructure data to help the reader understand how
the information in the SANDAG CAFR relates to the services SANDAG provides and the
activities it performs.
Sources: Unless otherwise noted, the information in these schedules is derived from the CAFR for the
relevant year.
138

San Diego Association of GovernmentsNet Position by Component
Last Ten Fiscal Years
(accrual basis of accounting)
2011 2012 2013 2014 2015 2016 2017 2018 2019 2020
Governmental activities
Net investment in capital assets 194,300,002$ 144,582,596$ 212,369,791$ 287,100,514$ 223,634,536$ 9,168,262$ 15,558,636$ 445,646,687$ 601,533,597$ 803,549,001$
Restricted for:
Mid-coast project - - - - - - - - - 34,085,951
Debt service 26,892,891 10,314,653 64,135,550 28,414,519 32,633,420 39,337,425 42,315,044 44,561,875 47,604,345 63,669,996
Environmental mitigation 1,203,086 1,208,689 1,210,668 1,207,152 1,209,443 1,119,056 1,124,533 1,123,928 1,159,810 1,177,237
Freeway emergency service - - - - - - - 8,279,175 8,582,301 8,683,786
Unrestricted (deficit) 183,072,505 (35,541,644) (181,431,527) (257,431,467) (324,466,756) (77,096,184) (67,760,582) (623,955,231) (540,848,703) (870,635,557)
Total governmental activities net position 405,468,484$ 120,564,294$ 96,284,482$ 59,290,718$ (66,989,357)$ (27,471,441)$ (8,762,369)$ (124,343,566)$ 118,031,350$ 40,530,414$
Business-type activities
Net investment in capital assets -$ 255,259,406$ 240,433,508$ 224,324,646$ 211,156,058$ 195,346,143$ 179,758,457$ 111,360,673$ 105,093,201$ 102,412,780$
Restricted for:
Debt service - 1,866,486 448 986 1,397 2,133 3,624 16,940,865 18,285,521 18,476,695
Major maintenance post-acquisition - 4,540,504 15,761,136 28,505,216 43,823,810 58,640,048 69,230,054 37,153,023 47,037,264 47,197,962
Project revenue - 142,000 79,004 261,009 429,952 3,152,752 7,099,391 28,955,820 32,062,084 34,285,520
Toll road operations and improvements - - - 7,479,433 12,798,483 19,699,661 26,454,909 31,179,457 39,888,725 35,410,702
Customer prepaid - - - - - - - 172,395 137,148 69,404
iCommute - - - - - - - 9,744 12,636 9,071
Property management - - - - - - 38,563 35,564 549,181 1,374,831
Unrestricted (deficit) 2,611,579 (56,693,496) (53,302,771) (58,324,897) (62,056,526) (62,030,737) (63,176,668) 397,238 423,438 503,486
Total business-type activities net position 2,611,579$ 205,114,900$ 202,971,325$ 202,246,393$ 206,153,174$ 214,810,000$ 219,408,330$ 226,204,779$ 243,489,198$ 239,740,451$
Primary government
Net investment in capital assets 194,300,002$ 399,842,002$ 452,803,299$ 511,425,160$ 434,790,594$ 204,514,405$ 195,317,093$ 557,007,360$ 706,626,798$ 905,961,781$
Restricted for:
Mid-coast project - - - - - - - - - 34,085,951
Debt service 26,892,891 12,181,139 64,135,998 28,415,505 32,634,817 39,339,558 42,318,668 61,502,740 65,889,866 82,146,691
Environmental mitigation 1,203,086 1,208,689 1,210,668 1,207,152 1,209,443 1,119,056 1,124,533 1,123,928 1,159,810 1,177,237
Major maintenance post-acquisition - 4,540,504 15,761,136 28,505,216 43,823,810 58,640,048 69,230,054 37,153,023 47,037,264 47,197,962
Project revenue - 142,000 79,004 261,009 429,952 3,152,752 7,099,391 28,955,820 32,062,084 34,285,520
Toll road operations and improvements - - - 7,479,433 12,798,483 19,699,661 26,454,909 31,179,457 39,888,725 35,410,702
Customer prepaid - - - - - - - 172,395 137,148 69,404
Freeway emergency service - - - - - - - 8,279,175 8,582,301 8,683,786
iCommute - - - - - - - 9,744 12,636 9,071
Property management - - - - - - 38,563 35,564 549,181 1,374,831
Unrestricted (deficit) 185,684,084 (92,235,140) (234,734,298) (315,756,364) (386,523,282) (139,126,921) (130,937,250) (623,557,993) (540,425,265) (870,132,071)
Total primary government net position 408,080,063$ 325,679,194$ 299,255,807$ 261,537,111$ 139,163,817$ 187,338,559$ 210,645,961$ 101,861,213$ 361,520,548$ 280,270,865$
Source: Finance Department
139

San Diego Association of GovernmentsChange in Net Position
Last Ten Fiscal Years
(accrual basis of accounting)
2011 2012 2013 2014 2015 2016 2017 2018 1 2019 2020
Expenses
Governmental activities:
General government, net of cost recovery 4,340,560$ (50,395)$ (75,055)$ (486,437)$ (34,313)$ 1,916,776$ 668,106$ 365,593$ 286,736$ 1,811,022$
Modeling and research 2,945,543 3,906,142 4,458,732 4,545,222 5,102,366 6,212,388 8,198,683 6,437,020 6,724,948 9,983,140
Criminal justice 1,322,882 1,635,255 1,521,582 1,495,834 1,303,563 1,214,864 1,524,153 1,021,489 1,101,009 1,103,957
Planning and forecasting 5,626,008 4,708,816 4,212,706 4,394,795 - - - - - -
Sustainable development 1,640,795 1,269,411 1,304,160 1,003,906 6,806,436 6,765,168 5,275,752 8,172,047 9,449,673 16,337,124
Sustainable mobility programs and services 46,513,217 46,418,002 47,366,426 21,247,297 18,332,743 18,012,242 20,898,685 17,112,585 22,305,301 21,612,236
Intermodal planning and implementation 1,554,009 2,602,205 2,114,127 1,528,526 1,296,930 - - - - -
Internal and external coordination 4,506,081 7,078,166 5,773,179 5,353,344 5,524,869 6,016,306 6,707,729 6,914,668 7,223,524 7,123,096
SAFE program - - 11,216,566 1,600,183 1,669,308 1,436,053 1,631,813 1,870,670 1,589,922 1,520,134
Bicycle facilities 1,108,513 192,495 71,080 1,990,728 2,186,253 2,446,815 2,772,067 880,943 894,799 365,593
Independent Taxpayer Oversight Committee 85,510 356,159 83,071 96,017 367,036 98,320 100,853 365,953 368,376 376,416
Major corridor capital projects 16,217,358 542,364 126,155 141,223 2,886,200 564,642 1,932,128 165,400 - 157,915
Major corridor environmental mitigation 3,239 4,264 - 20,306 23,708 12,172 23,857 8,879 7,979 15,124
Local project environmental mitigation 33,793 1,744 34,019 7,824 8,100 10,845 20,181 14,275 10,002 10,381
Local street improvements 33,306,399 86,880,721 66,153,631 52,452,895 73,431,440 110,896,814 83,303,412 86,085,711 76,138,673 79,726,182
Smart growth 934,701 1,821,384 1,783,732 2,525,948 4,168,356 5,680,797 3,224,585 5,596,218 2,698,814 8,809,836
New major corridor transit operations 862,901 1,912,773 606,497 2,509,523 11,850,929 11,794,749 11,521,508 12,033,896 16,255,635 19,797,658
Transit system improvements 34,556,716 37,632,167 39,679,702 40,266,354 43,217,224 44,659,647 46,459,496 46,247,104 49,741,390 51,033,075
Transit capital contributions 125,806,324 246,284,582 244,093,156 303,556,952 350,041,508 129,905,775 261,986,096 389,693,612 186,145,897 214,437,991
Interest on long-term debt 36,988,739 46,908,631 58,602,402 57,551,894 70,639,904 71,181,207 85,266,788 78,563,591 87,163,728 86,709,311
Cost of debt issuance - 6,256,132 - - - - - - - -
Total governmental activities expenses 318,353,288 496,361,018 489,125,868 501,802,334 598,822,560 418,825,580 541,515,892 661,549,654 468,106,406 520,930,191
Business-type activities:
Service Bureau 312,016 490,289 504,167 548,715 344,081 513,539 496,667 496,080 287,561 310,243
SourcePoint - - - - - - - 16,565 12,998 11,510
Interstate 15 FasTrak 3,702,804 5,094,168 6,092,062 6,582,099 6,764,023 7,191,848 7,738,446 8,499,225 7,871,335 8,858,083
State Route 125 Toll Road - 12,013,407 29,911,481 30,380,940 30,117,602 30,647,549 33,745,657 33,940,919 33,836,049 33,470,990
Total business-type activities expenses 4,014,820 17,597,864 36,507,710 37,511,754 37,225,706 38,352,936 41,980,770 42,952,789 42,007,943 42,650,826
Total primary government expenses 322,368,108$ 513,958,882$ 525,633,578$ 539,314,088$ 636,048,266$ 457,178,516$ 583,496,662$ 704,502,443$ 510,114,349$ 563,581,017$
140

San Diego Association of GovernmentsChange in Net Position
Last Ten Fiscal Years
(accrual basis of accounting)
2011 2012 2013 2014 2015 2016 2017 2018 1 2019 2020
Program Revenues
Governmental activities:
Charges for services:
General government 547,426$ 547,426$ 565,386$ 547,425$ 547,426$ 547,424$ 547,426$ 547,426$ 547,424$ 1,094,852$
Transit support activities 1,106,349 1,208,837 1,184,459 - - - - - - -
Criminal justice 200,000 199,999 200,001 200,000 200,001 200,001 200,000 213,999 219,608 225,951
SAFE program - - 1,614,190 2,757,111 2,787,196 2,896,366 2,954,988 2,694,729 3,252,355 2,947,341
Operating grants and contributions 62,912,360 65,142,256 78,195,117 34,298,223 33,680,470 31,489,804 32,714,717 34,414,426 39,970,028 40,211,436
Capital grants and contributions 91,481,754 114,897,279 112,147,740 150,652,714 175,682,343 132,821,561 202,046,295 174,146,558 331,973,062 46,465,874
Total governmental activities program revenues 156,247,889 181,995,797 193,906,893 188,455,473 212,897,436 167,955,156 238,463,426 212,017,138 375,962,477 90,945,454
Business-type activities:
Charges for services:
Service Bureau 332,478 534,763 547,760 639,983 384,544 559,527 524,076 531,285 313,877 390,227
SourcePoint - - - - - - - 226,362 11,880 4,416
Interstate 15 FasTrak 4,005,920 4,786,063 6,141,283 6,449,971 10,156,279 12,216,848 12,992,560 13,510,720 14,597,256 11,513,099
State Route 125 Toll Road - 15,134,831 26,134,191 29,764,264 32,031,279 35,075,079 37,618,422 41,748,531 41,628,570 37,883,290
Total business-type activities program revenues 4,338,398 20,455,657 32,823,234 36,854,218 42,572,102 47,851,454 51,135,058 56,016,898 56,551,583 49,791,032
Total primary government program revenues 160,586,287$ 202,451,454$ 226,730,127$ 225,309,691$ 255,469,538$ 215,806,610$ 289,598,484$ 268,034,036$ 432,514,060$ 140,736,486$
Net (expense)/revenue
Governmental activities (162,105,399)$ (314,365,221)$ (295,218,975)$ (313,376,861)$ (385,925,124)$ (250,870,424)$ (303,052,466)$ (449,532,516)$ (92,143,929)$ (429,984,737)$
Business-type activities 323,578 2,857,793 (3,684,476) (657,536) 5,346,396 9,498,518 9,154,288 13,064,109 14,543,640 7,140,206
Total primary government net expense (161,781,821)$ (311,507,428)$ (298,903,451)$ (314,034,397)$ (380,578,728)$ (241,371,906)$ (293,898,178)$ (436,468,407)$ (77,600,289)$ (422,844,531)$
General Revenues and Other Change in Net Position
Governmental activities:
Local TransNet sales tax funds 223,939,663$ 239,071,064$ 249,520,133$ 261,732,291$ 270,482,476$ 276,383,787$ 286,965,955$ 302,364,081$ 303,529,448$ 313,251,738$
Local Transportation Development Act sales tax funds 7,012,535 7,488,972 8,135,581 9,932,385 11,284,888 12,144,169 15,635,044 10,200,837 11,472,988 10,140,628
Investment earnings (loss) 14,321,473 (6,984,702) 12,212,398 4,604,966 10,894,328 550,944 14,043,487 15,120,087 18,552,398 12,735,311
Other revenues 35,625 32,336 64,454 9,832 3,582 173,282 53,972 53,195 532,730 2,525,662
Transfers in (out) (10,427) (210,146,639) (1,492,360) 103,622 (2,086,871) 1,136,158 5,063,080 7,694,442 431,281 13,830,462
Total governmental activities 245,298,869 29,461,031 268,440,206 276,383,096 290,578,403 290,388,340 321,761,538 335,432,642 334,518,845 352,483,801
Business-type activities:
Investment earnings 14,108 (10,501,111) 37,141 36,226 201,842 294,466 468,559 1,532,640 2,658,443 2,115,859
Other revenues - - 11,400 - - - 38,563 - 513,617 825,650
Transfers in (out) 10,427 210,146,639 1,492,360 (103,622) 2,086,871 (1,136,158) (5,063,080) (7,694,442) (431,281) (13,830,462)
Total business-type activities 24,535 199,645,528 1,540,901 (67,396) 2,288,713 (841,692) (4,555,958) (6,161,802) 2,740,779 (10,888,953)
Total primary government 245,323,404$ 229,106,559$ 269,981,107$ 276,315,700$ 292,867,116$ 289,546,648$ 317,205,580$ 329,270,840$ 337,259,624$ 341,594,848$
Change in net position
Governmental activities 83,193,470$ (284,904,190)$ (26,778,769)$ (36,993,765)$ (95,346,721)$ 39,517,916$ 18,709,072$ (114,099,874)$ 242,374,916$ (77,500,936)$
Business-type activities 348,113 202,503,321 (2,143,575) (724,932) 7,635,109 8,656,826 4,598,330 6,902,307 17,284,419 (3,748,747)
Total primary government 83,541,583$ (82,400,869)$ (28,922,344)$ (37,718,697)$ (87,711,612)$ 48,174,742$ 23,307,402$ (107,197,567)$ 259,659,335$ (81,249,683)$
Source: Finance Department
1 Beginning in 2018, SourcePoint was classified as a blended component unit of SANDAG and was included in business-type activities.
Note: Certain amounts from prior years have been reclassified in order to present comparable results.
141

San Diego Association of GovernmentsFund Balances of Governmental Funds
Last Ten Fiscal Years
(modified accrual basis of accounting)
2011 2012 2013 2014 2015
General fund
Reserved -$ -$ -$ -$ -$
Unreserved - - - - -
Nonspendable 44,896 113,560 59,670 465,189 191,813
Assigned 263,449 376,736 - - -
Unassigned 6,204,099 9,132,124 11,542,244 13,817,185 14,670,176
All other governmental funds
Reserved -$ -$ -$
Unreserved, reported in:
Special revenue funds - - - 1,917
Capital projects fund - - -
Debt service fund - - -
Nonspendable, reported in:
Special revenue funds 508 1,182,899 315 7,129,070 24,403
Capital projects fund 25,832,151 19,451,327 8,737,107 3,814,294
Restricted, reported in:
Special revenue funds 380,945,586 447,198,151 422,030,465 509,764,607 580,925,918
Debt service fund 436,660,863 393,359,255 291,362,816 62,883,888 231,030,381
Assigned, reported in:
Special revenue funds 1,089,608 366,605 -
Capital projects fund 17,044,959 - - (10,095,000)
Unassigned, reported in:
Special revenue funds 1,738,947 (3,258,178) (1,074,869) (3,058,296)
Capital projects fund - - (14,079,322) (22,651,697)
Total all other governmental funds 863,312,622$ 858,300,059$ 706,976,512$ 569,684,482$ 790,085,003$
2016 2017 2018 2019 2020
General fund
Nonspendable 107,893$ 256,879$ 371,896$ 239,183$ 409,812$
Restricted - - 4,771,795 6,705,300 8,182,701
Committed - - 7,990,000 5,812,000 5,302,000
Assigned - - 140,460 293,625 -
Unassigned 13,128,367 16,435,274 3,846,604 6,010,082 5,956,457
Total general fund 13,236,260$ 16,692,153$ 17,120,755$ 19,060,190$ 19,850,970$
All other governmental funds
Nonspendable, reported in:
Special revenue funds 150,835$ 125,131$ 232,555$ 102,432$ 360,121$
Capital projects fund 5,769,471 256,119 272,330 6,676,335 3,500,044
Restricted, reported in:
Special revenue funds 567,247,729 489,563,141 438,673,832 562,554,009 532,797,254
Debt service fund 69,088,189 225,652,427 413,051,537 102,592,899 199,327,860
Unassigned, reported in:
Special revenue funds (1,955,396) (5,301,881) (3,069,879) - (5,344,746)
Capital projects fund (10,295,468) (4,892,812) (8,161,334) (7,277,766) (7,391,472)
Total all other governmental funds 630,005,360$ 705,402,125$ 840,999,041$ 664,647,909$ 723,249,061$
Source: Finance Department
Fiscal Year
142

San Diego Association of GovernmentsChange in Fund Balances of Governmental Funds
Last Ten Fiscal Years
(modified accrual basis of accounting)
2011 2012 2013 2014 2015 2016 2017 2018 2019 2020
Revenues
Federal funds 58,782,786$ 65,491,578$ 62,203,796$ 97,537,254$ 58,992,094$ 109,641,390$ 199,748,046$ 141,139,315$ 339,203,641$ 38,304,557$
State funds 50,665,783 81,143,207 74,185,732 89,207,154 94,902,014 40,544,354 15,741,066 55,524,721 26,189,801 34,934,750
Local TransNet sales tax funds 223,939,663 239,071,064 249,520,133 261,732,291 270,482,476 276,383,787 286,965,955 302,364,081 303,529,448 313,251,738
Local Transportation Development Act sales tax funds 7,012,535 7,488,972 8,135,581 9,932,385 11,284,888 12,144,169 15,635,044 10,200,837 11,472,988 10,140,628
Other local governmental funding 6,451,622 5,982,868 10,517,389 5,347,828 41,345,625 23,076,654 20,646,249 10,997,231 9,887,819 7,778,112
Prepaid fare media sales revenue 31,954,282 28,764,525 27,178,362 - - - - - - -
SAFE program revenue - - 1,614,190 2,757,111 2,787,196 2,896,366 2,954,988 2,694,729 3,252,355 2,947,341
Member agency assessments 747,426 747,425 747,427 747,425 747,427 747,425 747,426 761,425 767,032 1,320,803
Investment earnings 4,661,340 5,149,714 4,338,235 6,411,023 7,057,123 10,059,633 7,615,586 11,603,006 24,977,950 24,338,715
Debt repayments from other governments 1,430,353 943,177 1,624,727 1,593,525 1,729,969 1,879,752 1,806,954 1,519,755 1,990,505 4,150,792
Other revenues 611,701 596,467 4,708,500 185,844 89,642 278,598 185,787 53,195 532,730 2,525,662
Total revenues 386,257,491 435,378,997 444,774,072 475,451,840 489,418,454 477,652,128 552,047,101 536,858,295 721,804,269 439,693,098
Expenditures
Current:
General government 31,551,416 29,908,171 36,081,584 40,237,955 40,232,641 41,834,324 44,077,916 44,806,974 49,672,055 54,579,269
Cost recovery (28,897,881) (30,048,643) (36,320,981) (40,829,605) (39,803,511) (40,055,697) (43,552,068) (45,001,058) (49,867,533) (54,385,304)
Modeling and research 2,945,543 3,961,210 4,404,320 4,520,203 5,088,282 6,203,055 8,194,350 6,478,846 6,700,639 9,983,140
Criminal justice 1,322,882 1,635,255 1,521,582 1,495,834 1,303,563 1,214,864 1,524,153 1,021,489 1,101,009 1,103,957
Planning and forecasting 5,626,008 4,708,816 4,212,706 4,394,795 - - - - - -
Sustainable development 1,640,795 1,269,411 1,304,160 1,033,906 6,806,436 6,765,168 5,275,752 8,172,047 9,449,673 16,337,124
Sustainable mobility programs and services 46,561,518 45,016,226 47,420,104 21,159,246 19,015,421 18,084,006 18,629,735 20,037,889 23,161,705 19,500,160
Intermodal planning and implementation 1,554,009 2,602,205 2,114,127 1,528,526 1,296,930 - - - - -
Internal and external coordination 4,506,081 7,078,166 5,773,179 5,353,344 5,524,869 6,016,306 6,707,729 6,914,668 7,223,524 7,123,096
SAFE program - - 11,216,566 1,600,183 1,669,308 1,436,053 1,631,813 1,870,670 1,589,922 1,520,134
143

San Diego Association of GovernmentsChange in Fund Balances of Governmental Funds
Last Ten Fiscal Years
(modified accrual basis of accounting)
2011 2012 2013 2014 2015 2016 2017 2018 2019 2020
Bicycle facilities 1,108,513$ 192,495$ 71,080$ 1,990,728$ 2,186,253$ 2,446,815$ 2,772,067$ 880,943$ 894,799$ 365,593$
Independent Taxpayer Oversight Committee 85,510 356,159 83,071 96,017 367,036 98,320 100,853 365,953 368,376 376,416
Major corridor capital projects 16,217,358 542,364 126,155 141,223 2,886,200 564,642 1,932,128 165,400 - 157,915
Major corridor environmental mitigation 3,239 4,264 - 20,306 23,708 12,172 23,857 8,879 7,979 15,124
Local project environmental mitigation 33,793 1,744 34,019 7,824 8,100 10,845 20,181 14,275 10,002 10,381
Local street and road improvements 33,306,399 94,061,810 78,188,231 61,583,853 76,691,415 113,647,914 85,032,205 87,149,711 79,555,673 109,104,182
Smart growth 934,701 1,821,384 1,783,732 2,525,948 4,168,356 5,680,797 3,224,585 5,596,218 2,698,814 8,809,836
New major corridor transit operations 862,901 1,912,773 606,497 2,509,523 11,850,929 11,794,749 11,521,508 12,033,896 16,255,635 19,797,658
Transit system improvements 34,556,716 37,632,167 39,679,702 40,266,354 43,217,224 44,659,647 46,459,496 46,247,104 49,741,390 51,033,075
Regional transportation improvements1 157,934,729 282,966,853 325,735,127 427,710,598 362,366,104 371,790,100 531,402,710 664,502,130 567,507,977 493,168,391
Debt service:
Principal retirement 20,048,000 165,460,000 20,260,000 16,585,000 60,050,000 22,455,000 72,510,000 55,906,000 29,754,000 31,642,000
Debt issuance costs 2,864,732 2,296,858 - - 553,594 - 1,284,951 1,557,833 - 2,419,246
Interest and other charges 33,107,476 69,284,878 53,909,872 56,961,271 66,587,190 72,279,578 83,332,849 87,552,444 104,238,608 109,424,925
Total expenditures 367,874,438 722,664,566 598,204,833 650,893,032 672,090,048 686,938,658 882,106,770 1,006,282,311 900,064,247 882,086,318
Excess of revenues over (under) expenditures 18,383,053 (287,285,569) (153,430,761) (175,441,192) (182,671,594) (209,286,530) (330,059,669) (469,424,016) (178,259,978) (442,393,220)
Other financing sources (uses)
Transfers in 309,509,142 592,295,624 409,359,665 637,648,946 492,307,822 573,094,870 667,372,977 1,023,074,533 714,636,727 698,498,096
Transfers out (309,519,569) (784,295,624) (409,350,914) (637,545,324) (492,294,556) (571,958,712) (662,279,212) (1,015,380,091) (714,205,446) (684,667,634)
Commercial paper issued - 921,000 1,579,000 40,726,000 1,999,000 46,445,000 - 28,650,000 3,417,000 29,378,000
Bonds issued 350,000,000 420,585,000 - - 350,000,000 - 325,000,000 537,480,000 - 852,440,000
Premium on bonds issued 849,368 55,876,982 - - 55,305,483 - 78,818,562 31,625,092 - 56,420,838
Total other financing sources (uses) 350,838,941 285,382,982 1,587,751 40,829,622 407,317,749 47,581,158 408,912,327 605,449,534 3,848,281 952,069,300
Net change in fund balances 369,221,994$ (1,902,587)$ (151,843,010)$ (134,611,570)$ 224,646,155$ (161,705,372)$ 78,852,658$ 136,025,518$ (174,411,697)$ 509,676,080$
Capitalized assets 31,250,957$ 17,150,864$ 80,208,142$ 124,034,459$ 1,010,399$ 241,979,576$ 269,822,127$ 278,617,416$ 383,849,571$ 277,911,789$
Debt service as a percentage of noncapital
expenditures2 15.79% 33.27% 14.32% 13.96% 18.87% 21.29% 25.45% 19.71% 25.96% 23.35%
Source: Finance Department
1Beginning in 2016, Regional transportation improvements replaced Capital outlay.
2Debt service ratio is calculated by dividing total debt service expenditures by total expenditures and capitalized assets.
Note: Certain amounts from prior years have been reclassified in order to present comparable results.
144

San Diego Association of GovernmentsTax Revenues by Source, Governmental Funds
Last Ten Fiscal Years
(modified accrual basis of accounting)
Fiscal Year Sales Tax
2011 223,939,663
2012 239,071,064
2013 249,520,133
2014 261,732,291
2015 270,482,476
2016 276,383,787
2017 286,965,955
2018 302,364,081
2019 303,529,448
2020 313,251,738
Source: Finance Department
145

San Diego Association of GovernmentsDirect and Overlapping Sales Tax Rates
Last Ten Fiscal Years
Fiscal
Year County of San Diego2
2011 0.50% 8.75%
2012 0.50% 7.75%
2013 0.50% 8.00%
2014 0.50% 8.00%
2015 0.50% 8.00%
2016 0.50% 8.00%
2017 0.50% 7.75%
2018 0.50% 7.75%
2019 0.50% 7.75%
20203 0.50% 7.75%
Chula Vista 8.75%
Del Mar 8.75%
El Cajon 8.25%
La Mesa 8.50%
National City 8.75%
Vista 8.25%
Oceanside 8.25%
3 Rates Effective 7/1/20
TransNet Sales Tax
Proposition A1
Source: California Department of Tax and Fee Administration
1 TransNet sales tax was extended another 40 years to 2048 in 2004 under Proposition A.
2 The following seven cities within the County of San Diego have a sales tax rate other than 7.75%:
146
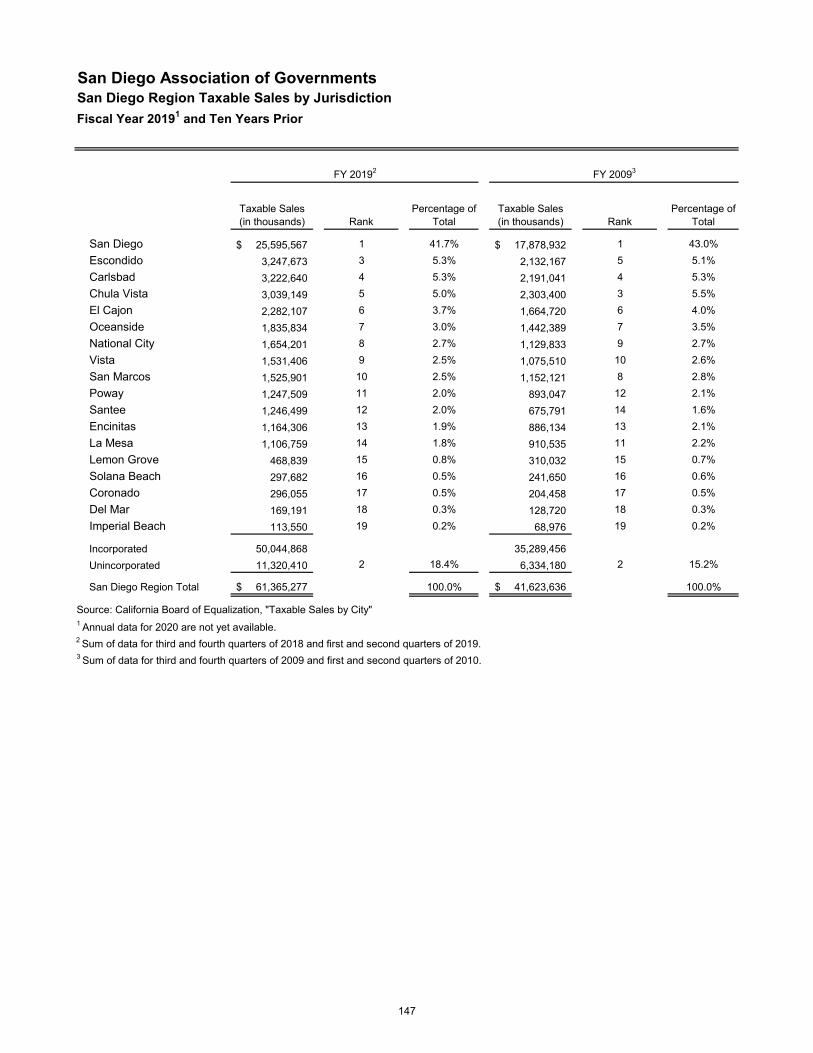
San Diego Association of GovernmentsSan Diego Region Taxable Sales by Jurisdiction
Fiscal Year 20191 and Ten Years Prior
Taxable Sales (in thousands) Rank
Percentage of Total
Taxable Sales (in thousands) Rank
Percentage of Total
San Diego 25,595,567$ 1 41.7% 17,878,932$ 1 43.0%
Escondido 3,247,673 3 5.3% 2,132,167 5 5.1%
Carlsbad 3,222,640 4 5.3% 2,191,041 4 5.3%
Chula Vista 3,039,149 5 5.0% 2,303,400 3 5.5%
El Cajon 2,282,107 6 3.7% 1,664,720 6 4.0%
Oceanside 1,835,834 7 3.0% 1,442,389 7 3.5%
National City 1,654,201 8 2.7% 1,129,833 9 2.7%
Vista 1,531,406 9 2.5% 1,075,510 10 2.6%
San Marcos 1,525,901 10 2.5% 1,152,121 8 2.8%
Poway 1,247,509 11 2.0% 893,047 12 2.1%
Santee 1,246,499 12 2.0% 675,791 14 1.6%
Encinitas 1,164,306 13 1.9% 886,134 13 2.1%
La Mesa 1,106,759 14 1.8% 910,535 11 2.2%
Lemon Grove 468,839 15 0.8% 310,032 15 0.7%
Solana Beach 297,682 16 0.5% 241,650 16 0.6%
Coronado 296,055 17 0.5% 204,458 17 0.5%
Del Mar 169,191 18 0.3% 128,720 18 0.3%
Imperial Beach 113,550 19 0.2% 68,976 19 0.2%
Incorporated 50,044,868 35,289,456
Unincorporated 11,320,410 2 18.4% 6,334,180 2 15.2%
San Diego Region Total 61,365,277$ 100.0% 41,623,636$ 100.0%
Source: California Board of Equalization, "Taxable Sales by City"1 Annual data for 2020 are not yet available.2 Sum of data for third and fourth quarters of 2018 and first and second quarters of 2019. 3 Sum of data for third and fourth quarters of 2009 and first and second quarters of 2010.
FY 20192 FY 20093
147

San Diego Association of GovernmentsRatios of Outstanding Debt by Type
Last Ten Fiscal Years
Total Percentage Debt
Fiscal Revenue Short-Term Commercial TIFIA Toll Revenue Primary of Personal Per
Year Bonds Bonds Paper Total Notes Bonds Total Government Income1 Capita1
2011 916,463,741 - 34,000,000 950,463,741 - - - 950,463,741 0.563% 304
2012 1,228,392,144 - 33,821,000 1,262,213,144 95,629,359 - 95,629,359 1,357,842,503 0.777% 429
2013 1,208,152,472 - 33,989,000 1,242,141,472 100,572,988 - 100,572,988 1,342,714,460 0.751% 419
2014 1,191,472,800 - 73,001,000 1,264,473,800 159,790,992 - 159,790,992 1,424,264,792 0.760% 440
2015 1,578,319,665 - 30,440,000 1,608,759,665 160,299,501 - 160,299,501 1,769,059,166 0.905% 541
2016 1,554,507,253 - 75,000,000 1,629,507,253 161,363,534 - 161,363,534 1,790,870,787 0.903% 545
2017 1,928,648,386 - 26,750,000 1,955,398,386 164,765,823 - 164,765,823 2,120,164,209 1.061% 641
2018 1,882,812,559 567,116,301 26,614,000 2,476,542,860 - 3 230,697,785 230,697,785 2,707,240,645 1.344% 812
2019 1,845,785,956 556,222,998 28,692,000 2,430,700,954 - 225,131,369 225,131,369 2,655,832,323 1.319% 795
2020 1,884,918,254 545,512,713 56,213,000 2,486,643,967 - 218,376,331 218,376,331 2,705,020,298 1.254% 2 809
Source: Finance Department
Note: Details regarding the outstanding debt can be found in the Notes to the Basic Financial Statements, Note II.H.
1 See the Schedule of Demographic and Economic Statistics for personal income and population data.
2 Used the most recent data available (2019).
3 The SR 125 TIFIA Notes were repaid in fiscal year 2018.
Governmental Business-type
Activities Activities
Sales Tax Revenue
148

San Diego Association of GovernmentsPledged-Revenue Coverage
Last Ten Fiscal Years
Fiscal Sales Tax
Year Revenue Principal Interest Principal Interest Principal Interest Principal Interest Coverage
2011 223,939,663 12,160,000 29,792,943 - - 572,000 381,768 12,732,000 30,174,711 5.22
2012 239,071,064 164,360,000 42,798,432 - - 1,100,000 737,393 165,460,000 43,535,825 1.14
2013 249,520,133 18,640,000 50,723,216 - - 1,620,000 584,452 20,260,000 51,307,668 3.49
2014 261,732,291 15,080,000 54,038,836 - - 1,505,000 370,577 16,585,000 54,409,413 3.69
2015 270,482,476 15,490,000 63,254,010 - - 1,835,000 401,719 17,325,000 63,655,729 3.34
2016 276,383,787 20,570,000 70,123,201 - - 1,885,000 415,880 22,455,000 70,539,081 2.97
2017 286,965,955 24,260,000 80,450,441 - - 1,805,000 581,493 26,065,000 81,031,934 2.68
2018 302,364,081 27,120,000 84,878,338 - - 1,200,000 788,060 28,320,000 85,666,398 2.65
2019 303,529,448 28,504,000 101,809,081 - - 1,250,000 959,990 29,754,000 102,769,071 2.29
2020 313,251,738 29,785,000 100,754,710 - - 1,857,000 329,770 31,642,000 101,084,480 2.36
Source: Finance Department
Note: Details regarding the outstanding debt can be found in the Notes to the Basic Financial Statements, Note II.G.
Debt Service Debt Service Debt Service Debt Service
Sales Tax Revenue
Bonds Short-Term Notes Commercial Paper Total
149

San Diego Association of GovernmentsPledged-Revenue Coverage - SR 125 Toll Road
Last Eight Fiscal Years
2013 2014 2015 2016 2017 2018 2019 2020
SR 125 Project revenue 26,134,191$ 29,743,159$ 31,951,777$ 35,346,500$ 38,049,829$ 42,826,499$ 43,485,397$ 39,194,197$
Less: Operating and
maintenance costs (8,172,275) (8,768,921) (8,914,720) (11,384,338) (11,540,125) (10,980,405) (12,805,257) (12,536,614)
Net available revenue 17,961,916$ 20,974,238$ 23,037,057$ 23,962,162$ 26,509,704$ 31,846,094$ 30,680,140$ 26,657,583$
TIFIA Pledged-Revenue Coverage1
Net available revenue 17,961,916 20,974,238 23,037,057 23,962,162 26,509,704 31,846,094 30,680,140 26,657,583
Debt service
Principal 135,018 656,988 1,468,175 1,140,315 637,212 - - -
Interest 3,541,164 3,533,930 3,482,998 3,664,849 3,886,914 - - -
Total debt service 3,676,182$ 4,190,918$ 4,951,173$ 4,805,164$ 4,524,126$ -$ -$ -$
Coverage 4.89 5.00 4.65 4.99 5.86 n/a n/a n/a
First Subordinate Obligation Pledged-Revenue Coverage1
Net available revenue 17,961,916 20,974,238 23,037,057 23,962,162 26,509,704 31,846,094 30,680,140 26,657,583
Less:
TIFIA debt service (3,676,182) (4,190,918) (4,951,173) (4,805,164) (4,524,126) - - -
Major maintenance
reserve fund deposits (10,865,173) (5,684,084) (12,727,141) (15,572,916) (16,485,768) (14,602,762) - -
Adjusted net available revenue 3,420,561$ 11,099,236$ 5,358,743$ 3,584,082$ 5,499,810$ 17,243,332$ 30,680,140$ 26,657,583$
Debt service
Principal 1,044,422 528,080 - - - - - -
Interest 316,883 2,674,226 2,649,982 2,649,982 2,649,982 662,495 - -
Total debt service 1,361,305$ 3,202,306$ 2,649,982$ 2,649,982$ 2,649,982$ 662,495$ -$ -$
Coverage 2.51 3.47 2.02 1.35 2.08 26.03 n/a n/a
Bond Pledged-Revenue Coverage
Net available revenue 17,961,916 20,974,238 23,037,057 23,962,162 26,509,704 31,846,094 30,680,140 26,657,583
Debt servicePrincipal - - - - - 3,070,000 4,315,000 4,535,000 Interest - - - - - 5,913,294 9,553,500 9,337,750
Total debt service -$ -$ -$ -$ -$ 8,983,294$ 13,868,500$ 13,872,750$
Coverage 0.00 0.00 0.00 0.00 0.00 3.55 2.21 1.92
Source: Finance DepartmentNote: Details regarding the outstanding debt can be found in the Notes to the Basic Financial Statements, Note II.H.
SR 125 toll road was acquired by SANDAG in fiscal year 2012.1 The TIFIA and First Subordinate obligations were defeased in fiscal year 2018.
Fiscal Year
150

San Diego Association of GovernmentsDemographic and Economic Statistics
Last Ten Available Calendar Years1
Per
Capita
Calendar Personal Median Unemployment
Year Population2 Personal Income3 Income3 Age4 Rate5
2010 3,095,313 163,181,429 52,574 34.7 10.8%
2011 3,125,264 168,897,450 53,793 34.8 10.3%
2012 3,161,750 174,695,138 54,939 34.9 9.1%
2013 3,201,417 178,784,447 55,584 35.1 7.8%
2014 3,235,142 187,455,171 57,557 35.3 6.4%
2015 3,267,992 195,550,333 59,438 35.6 5.2%
2016 3,287,279 198,220,222 59,755 35.9 4.7%
2017 3,309,626 199,808,783 59,864 36.1 4.0%
2018 3,333,128 201,410,076 59,974 36.4 3.3%
2019 3,340,312 215,773,539 64,428 35.6 3.2%
Source: Data compiled by SANDAG Service Bureau
Notes: Year-to-year variation for Educational Attainment and Poverty are the result of both actual change and sampling error. Personal Income and Per Capita Personal Income were inflation-adjusted to 2019 dollars. Median Age for 2020 and Personal Income and Per Capita Personal Income for 2019 were estimated using the prior year's growth rate.
1 Data for 2020 is not yet available, therefore, 2019 data is the most current year provided.2 California Department of Finance, "January Population and Housing Estimates";
3 U.S. Bureau of Economic Analysis (BEA), Regional Economic Accounts "Local Area Personal Income Accounts," Table CA5N; Bureau of Labor Statistics (BLS), retrieved from FRED, Chained Consumer Price Index (CPI), "Series CUUSA424SA0."
4 SANDAG Preliminary Estimates, Vintage 2019 (2011-2019), SANDAG Estimates, Vintage 20010 (2005-2010); 4 California Employment Development Department (EDD), Local Area Unemployment Statistics (LAUS), Annual Average;
151

San Diego Association of GovernmentsSan Diego Region Employment by IndustryCalendar Year 20191 and Nine Years Prior
Industry TypeAnnual
Employment% of Total
EmploymentAnnual
Employment% of Total
Employment
Agriculture 9,600 0.6% 10,500 0.8%
Natural Resources and Mining 400 0.0% 400 0.0%
Construction 84,000 5.6% 55,400 4.4%
Manufacturing 115,100 7.6% 95,700 7.6%
Wholesale Trade 44,200 2.9% 41,900 3.3%
Retail Trade 145,400 9.6% 130,700 10.4%
Transportation, Warehousing and Utilities 34,400 2.3% 26,500 2.1%
Information 23,500 1.6% 25,100 2.0%
Financial Activities 76,400 5.0% 67,200 5.4%Professional and Business Services 256,600 17.0% 203,300 16.3%
Educational and Health Services 216,000 14.3% 164,600 13.2%
Leisure and Hospitality 202,400 13.4% 153,200 12.2%
Other Services 55,800 3.7% 46,100 3.7%
Government (civilian) 249,600 16.5% 230,500 18.4%
Total, All Industries 1,513,400 100.0% 1,251,100 100.0%
Source: California Employment Development Department, Labor Market Information Division, March 2019 Benchmark.
20191 2010
Note: Employment figures may not add up to totals due to rounding.1 Data for 2020 is not yet available; therefore, 2019 data is provided.
152

San Diego Association of GovernmentsOperating Indicators: Employees by Functional Department
Last Ten Fiscal Years
Functional Department 2011 2012 2013 2014 2015 2016 2017 2018 2019 2020
Regular Full-Time Equivalent (FTE) Employees: 1
Administration/Organization Effectiveness 33 32 33 33 33 35 34 35 36 29
Contracts and Grants - - - - - - - - - 23
Strategic Communications - - - - - 9 9 9 9 28
Finance 17 16 17 17 15 16 16 16 16 18
Executive 21 30 32 31 31 15 11 12 12 16
Office of the Independent Auditor - - - - - - - - - 2
Technical Services 49 49 53 55 55 54 49 51 51 27
Transportation Planning 31 31 35 35 35 36 39 36 36 34
Data management and Operations - - - 4 4 20 26 26 28 69
ARJIS (3) - - - - - - - - - 17
TransNet Department - - - - 9 8 8 8 8 11
Mobility Management and Project Implementation 46 41 42 40 37 29 30 29 29 46
Total Regular FTE Employees 197 199 212 215 219 222 222 222 225 320
Limited Term FTE Employees: 2
Administration - 1 4 4 13 15 17 16 20 -
Contracts and Grants - - - - - - - - - 1Communications - - - - - 9 8 8 8 -
Finance - - 1 1 1 1 2 2 1 2
Executive 5 9 7 7 12 3 2 2 3 -
Technical Services 4 4 9 9 10 10 10 10 14 -
Transportation Planning - - - - - - - - - 3
Land Use and Transportation Planning 8 7 9 9 7 6 6 6 8 -
Data management and Operations - - - - 1 2 4 4 7 1
ARJIS - - - - - - - - - 2
TransNet Department - - - - 1 2 2 2 2 -
Mobility Management and Project Implementation 6 6 4 4 6 5 4 5 4 -
Total Limited Term FTE Employees 23 27 34 34 51 53 55 55 67 9
Toll Operations Personnel (TOP) FTE Employees:
Operations - 52 51 51 47 50 50 50 65 63
Finance - - - - 4 4 4 4 4 4
Total Toll Operations Personnel (TOP)
FTE Employees - 52 51 51 51 54 54 54 69 67
Temporary, Interns, Part-time, or
Seasonal (TIPS) Employees:3
Administration/Organization Effectiveness - 4 3 4 4 4 4 4 1 2
Contracts and Grants - - - - - - - - - 2
Communications - - - - - 4 5 5 5 8
Finance - - - - 1 4 1 1 - -
Executive 4 3 4 4 4 4 2 5 2 1
Office of the Independent Auditor - - - - - - - - - 2
Technical Services 11 9 9 9 15 15 6 9 17 4
Land Use and Transportation Planning 13 8 14 16 18 18 16 16 11 10
Data management and Operations - - - 1 5 5 5 6 1 17
TransNet Department - - - - 2 2 2 2 1 2
Mobility Management and Project Implementation 9 13 13 13 5 4 4 4 2 8
Total TIPS Employees 37 37 43 47 54 60 45 52 40 56
Total Employees 257 315 340 347 375 389 376 383 401 452
Note: Contracts and grants were included in Administration, ARJIS was included in Technical services in the prior years; Office of the Independent Auditor was formed in FY 20. All other variances comparing to the prior years are due to the agency reorganization.
Fiscal Year
1 Regular positions make up the core Board of Director authorized positions. Most regular positions are full-time.2 Limited Term positions are considered part of the contingent workforce, hired to fill a short-term need for additional staff. Most Limited Term positions are full-time positions authorized for a term of one year.
3 TIPS positions are determined by the number of authorized positions on the active payroll as of June 30 each year. TIPS employees are part of the contingent workforce, the majority of which are interns working on a part-time basis.Note: The number of government employees is more appropriately represented by functional department than the functional levels used in the government-wide statement of activities due to the cross functional nature of SANDAG’s employees and activities. Individual employees generally work on several functions.
Note: Operating indicators of demand or level of service by functions used in the government-wide statement of activities are not available due to the nature of functional services provided by SANDAG, a special-purpose government.
153

San Diego Association of GovernmentsCapital Asset Statistics by Program
Last Ten Fiscal Years
2011 2012 2013 2014 2015
Functions/Programs
Transit capital funding - construction-in-progress (CIP)
Major improvements - light rail transit 18,549,163$ -$ -$ 24,186$ 123,725$
Major improvements - bus 3,053,173 6,596,210 19,889,933 21,723,804 20,830,535
Operations capital - light rail transit 6,524,570 1,933,123 3,299,086 2,644,422 152,432
Major corridor projects 346,482,102 381,020,889 434,535,412 581,750,439 561,353,084
Operations capital - SANDAG 33,718,421 727,253 829,468 1,337,743 2,197,159
Major improvements - SANDAG 1,956,243 38,603,773 42,658,106 12,865,882 22,183,660
Goods movement projects 10,874,326 17,314,284 25,124,387 24,601,264 49,090,652
Total transit capital funding - CIP 421,157,998 446,195,532 526,336,392 644,947,739 655,931,247
Capital assets
Transit capital contributions - land 5,241,439 5,241,439 5,241,439 5,241,439 5,241,439
General government 207,301 169,239 237,256 258,070 370,868
Modeling and research - 55,068 35,048 28,025 13,941
Smart mobility programs and services activities 8,272,769 369,093 388,378 334,719 276,997
Major Corridor Capital Projects 5,147,169 4,044,204
Transit System Improvements 315,811 404,675
Total capital assets 434,879,507$ 452,030,371$ 532,238,513$ 656,272,972$ 666,283,371$
2016 2017 2018 2019 2020
Functions/Programs
Transit capital funding - construction-in-progress (CIP)
Major improvements - light rail transit -$ 104,122$ -$ -$ -$
Major improvements - bus 56,947,198 22,735,116 7,192,862 7,250,021 7,351,979
Operations capital - light rail transit 35,550 66,836 138,150 809,811 953,907
Major corridor projects 799,180,616 1,083,592,246 1,345,361,329 1,694,333,308 1,942,710,104
Operations capital - SANDAG 2,358,602 2,720,640 1,791,005 3,089,932 381,542
Major improvements - SANDAG 34,710,936 47,212,160 63,249,252 81,831,954 113,397,348
Goods movement projects 5,861,783 6,095,318 7,198,362 7,504,196 7,504,587
Total transit capital funding - CIP 899,094,685 1,162,526,438 1,424,930,960 1,794,819,221 2,072,299,465
Capital assets
Transit capital contributions - land 5,241,439 7,979,613 6,829,613 19,609,643 19,609,643
Transit capital contributions - easements - - 15,950,412 15,950,412 17,004,331
Transit capital contributions - building - 4,837,918 4,740,510 -
General government 342,908 273,354 335,902 3,235,567 3,802,166
Modeling and research 4,608 275 - -
Smart mobility programs and services activities 384,921 509,006 178,204 2,038,480 970,597
Major Corridor Capital Projects 2,941,239 1,838,274 3,656,758 4,858,672 4,725,635
Transit System Improvements 253,147 120,196 80,131 40,066 -
Total capital assets 908,262,947$ 1,178,085,074$ 1,456,702,490$ 1,840,552,061$ 2,118,411,838$
Source: Finance Department
Fiscal Year
Fiscal Year
154

This page intentionally left blank.
155