2020 Results and 2021 business plan
36
2020 Results and 2021 business plan 22nd June, 2021
Transcript of 2020 Results and 2021 business plan
2020 Results and 2021 business plan
22nd June, 2021
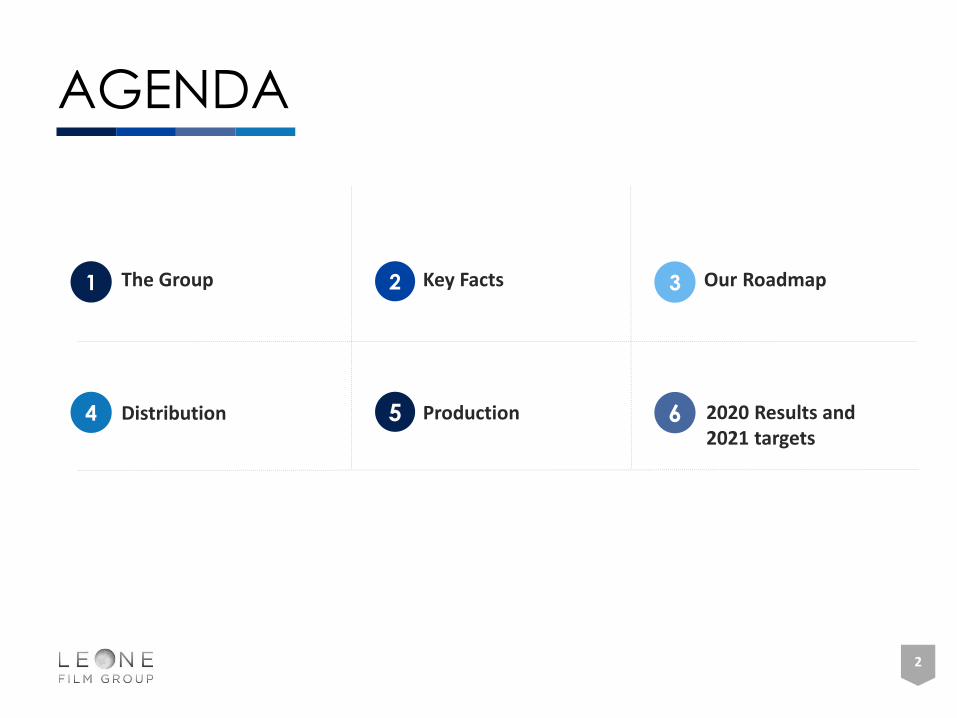
AGENDA
2
1 The Group 3 Our Roadmap
Production
2 Key Facts
Distribution4 65 2020 Results and 2021 targets
1. THE GROUP
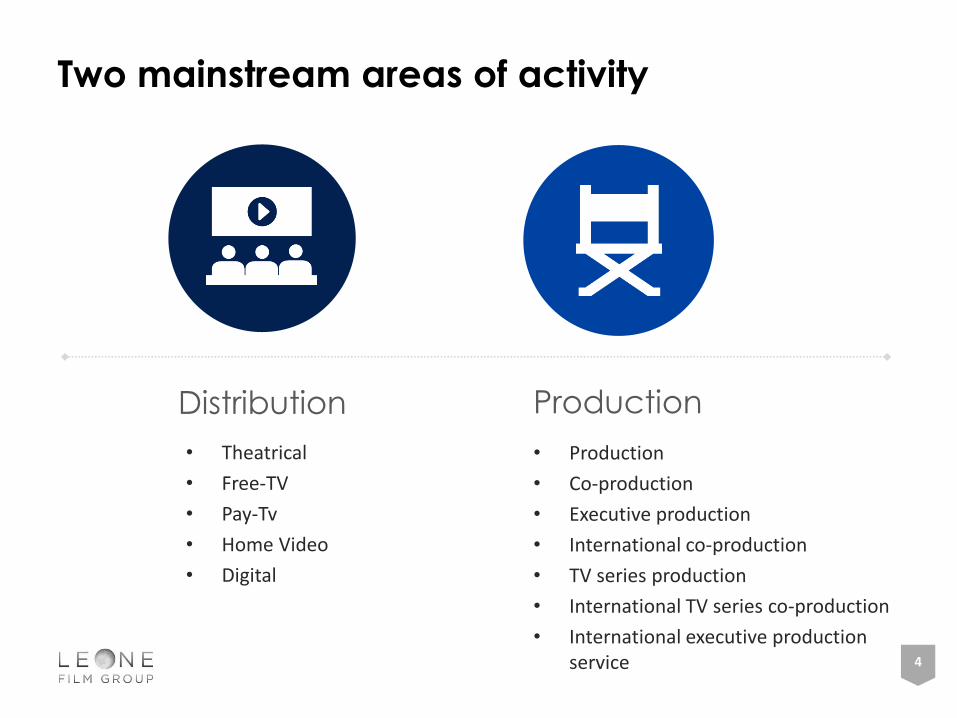
• Theatrical
• Free-TV
• Pay-Tv
• Home Video
• Digital
Distribution Production
Two mainstream areas of activity
4
• Production
• Co-production
• Executive production
• International co-production
• TV series production
• International TV series co-production
• International executive production service
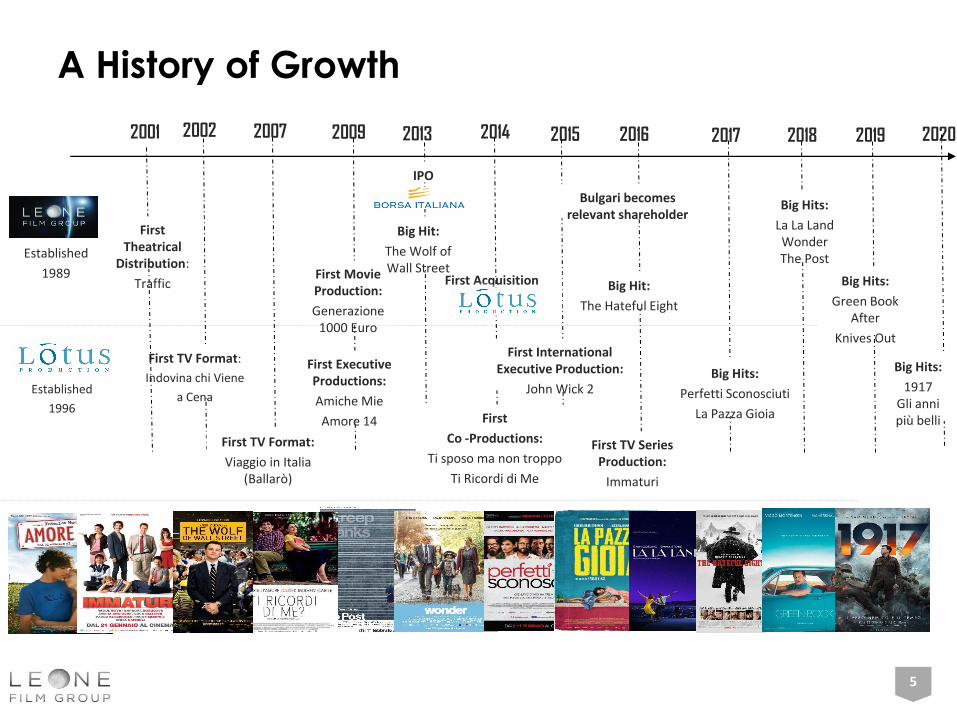
First Acquisition
A History of Growth
5
2002 2007 2009 2014 2015 2016 2017
Established
1989
Established
1996
2013
First TV Format:
Indovina chi Viene
a Cena
First TV Format:
Viaggio in Italia (Ballarò)
First Movie Production:
Generazione1000 Euro
First Executive Productions:
Amiche Mie
Amore 14 First
Co -Productions:
Ti sposo ma non troppo
Ti Ricordi di Me
First International Executive Production:
John Wick 2
Bulgari becomes relevant shareholder
First TV Series Production:
Immaturi
Big Hit:
The Hateful Eight
Big Hit:
The Wolf of Wall Street
IPO
Big Hits:
Perfetti Sconosciuti
La Pazza Gioia
2018
Big Hits:
La La LandWonderThe Post
2019
Big Hits:
Green BookAfter
Knives Out
2020
Big Hits:
1917Gli annipiù belli
2001
First Theatrical
Distribution:
Traffic
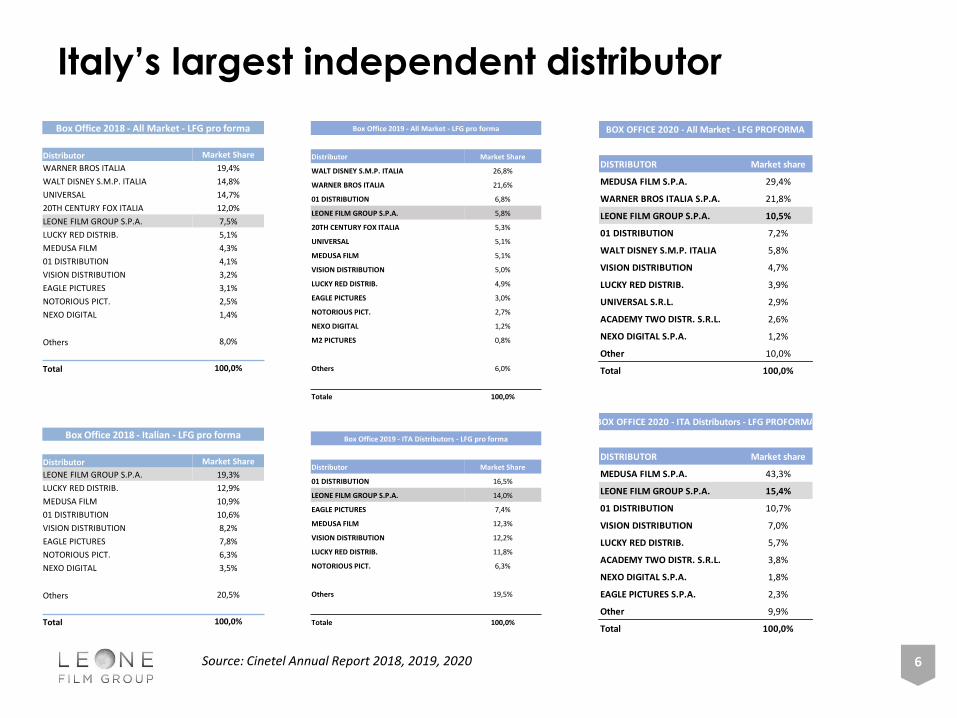
Box Office 2019 - All Market - LFG pro forma
Distributor Market Share
WALT DISNEY S.M.P. ITALIA 26,8%
WARNER BROS ITALIA 21,6%
01 DISTRIBUTION 6,8%
LEONE FILM GROUP S.P.A. 5,8%
20TH CENTURY FOX ITALIA 5,3%
UNIVERSAL 5,1%
MEDUSA FILM 5,1%
VISION DISTRIBUTION 5,0%
LUCKY RED DISTRIB. 4,9%
EAGLE PICTURES 3,0%
NOTORIOUS PICT. 2,7%
NEXO DIGITAL 1,2%
M2 PICTURES 0,8%
Others 6,0%
Totale 100,0%
Box Office 2019 - ITA Distributors - LFG pro forma
Distributor Market Share
01 DISTRIBUTION 16,5%
LEONE FILM GROUP S.P.A. 14,0%
EAGLE PICTURES 7,4%
MEDUSA FILM 12,3%
VISION DISTRIBUTION 12,2%
LUCKY RED DISTRIB. 11,8%
NOTORIOUS PICT. 6,3%
Others 19,5%
Totale 100,0%
Box Office 2018 - All Market - LFG pro forma
Distributor Market Share
WARNER BROS ITALIA 19,4%
WALT DISNEY S.M.P. ITALIA 14,8%
UNIVERSAL 14,7%
20TH CENTURY FOX ITALIA 12,0%
LEONE FILM GROUP S.P.A. 7,5%
LUCKY RED DISTRIB. 5,1%
MEDUSA FILM 4,3%
01 DISTRIBUTION 4,1%
VISION DISTRIBUTION 3,2%
EAGLE PICTURES 3,1%
NOTORIOUS PICT. 2,5%
NEXO DIGITAL 1,4%
Others 8,0%
Total 100,0%
Box Office 2018 - Italian - LFG pro forma
Distributor Market Share
LEONE FILM GROUP S.P.A. 19,3%
LUCKY RED DISTRIB. 12,9%
MEDUSA FILM 10,9%
01 DISTRIBUTION 10,6%
VISION DISTRIBUTION 8,2%
EAGLE PICTURES 7,8%
NOTORIOUS PICT. 6,3%
NEXO DIGITAL 3,5%
Others 20,5%
Total 100,0%
Italy’s largest independent distributor
6Source: Cinetel Annual Report 2018, 2019, 2020
DISTRIBUTOR Market share
MEDUSA FILM S.P.A. 29,4%
WARNER BROS ITALIA S.P.A. 21,8%
LEONE FILM GROUP S.P.A. 10,5%
01 DISTRIBUTION 7,2%
WALT DISNEY S.M.P. ITALIA 5,8%
VISION DISTRIBUTION 4,7%
LUCKY RED DISTRIB. 3,9%
UNIVERSAL S.R.L. 2,9%
ACADEMY TWO DISTR. S.R.L. 2,6%
NEXO DIGITAL S.P.A. 1,2%
Other 10,0%
Total 100,0%
DISTRIBUTOR Market share
MEDUSA FILM S.P.A. 43,3%
LEONE FILM GROUP S.P.A. 15,4%
01 DISTRIBUTION 10,7%
VISION DISTRIBUTION 7,0%
LUCKY RED DISTRIB. 5,7%
ACADEMY TWO DISTR. S.R.L. 3,8%
NEXO DIGITAL S.P.A. 1,8%
EAGLE PICTURES S.P.A. 2,3%
Other 9,9%
Total 100,0%
BOX OFFICE 2020 - All Market - LFG PROFORMA
BOX OFFICE 2020 - ITA Distributors - LFG PROFORMA
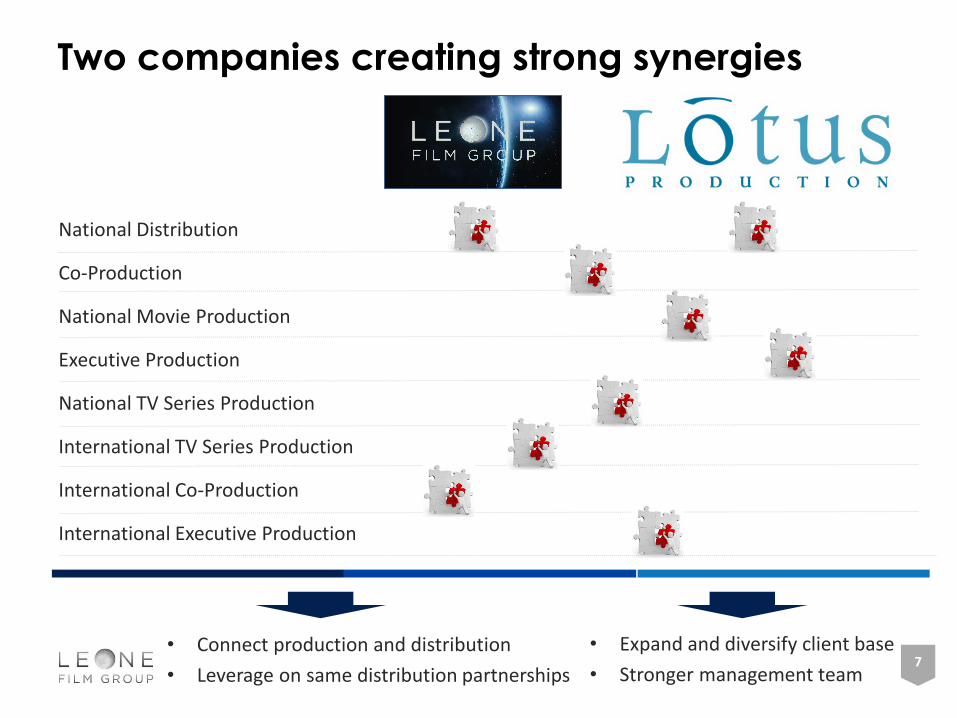
Two companies creating strong synergies
7
National Distribution
Co-Production
National Movie Production
Executive Production
National TV Series Production
International TV Series Production
International Co-Production
International Executive Production
• Expand and diversify client base
• Stronger management team
• Connect production and distribution
• Leverage on same distribution partnerships
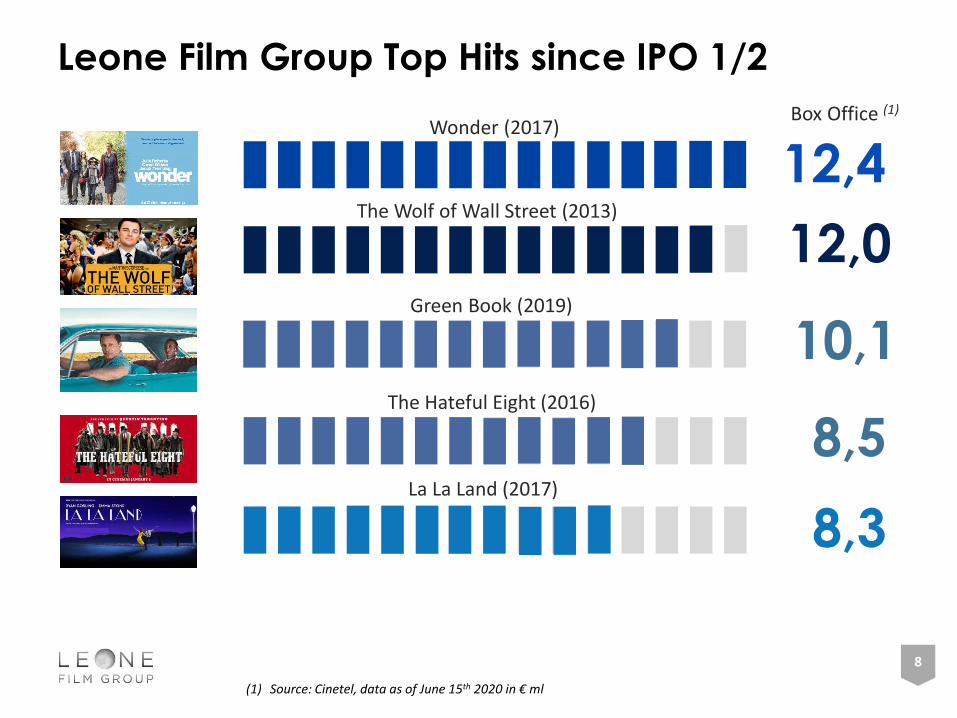
The Hateful Eight (2016)
Leone Film Group Top Hits since IPO 1/2
8
The Wolf of Wall Street (2013)
La La Land (2017)
12,0
8,5
8,3
12,4Wonder (2017)
(1) Source: Cinetel, data as of June 15th 2020 in € ml
Box Office (1)
Green Book (2019)
10,1
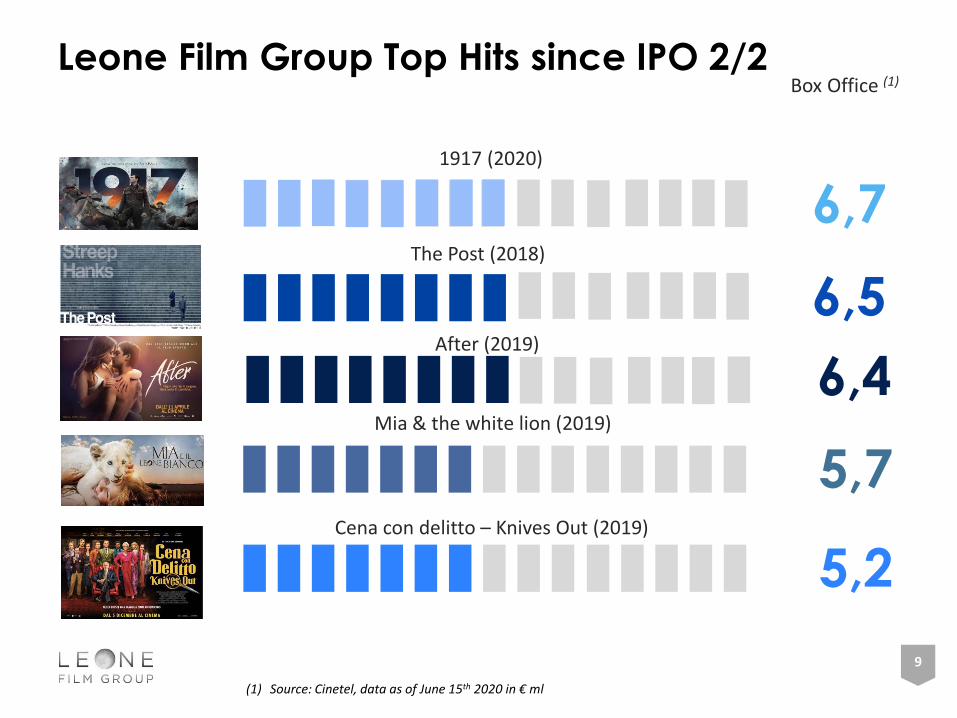
Leone Film Group Top Hits since IPO 2/2
9
After (2019)
6,4
6,5The Post (2018)
Box Office (1)
Mia & the white lion (2019)
5,7
6,71917 (2020)
Cena con delitto – Knives Out (2019)
5,2
(1) Source: Cinetel, data as of June 15th 2020 in € ml
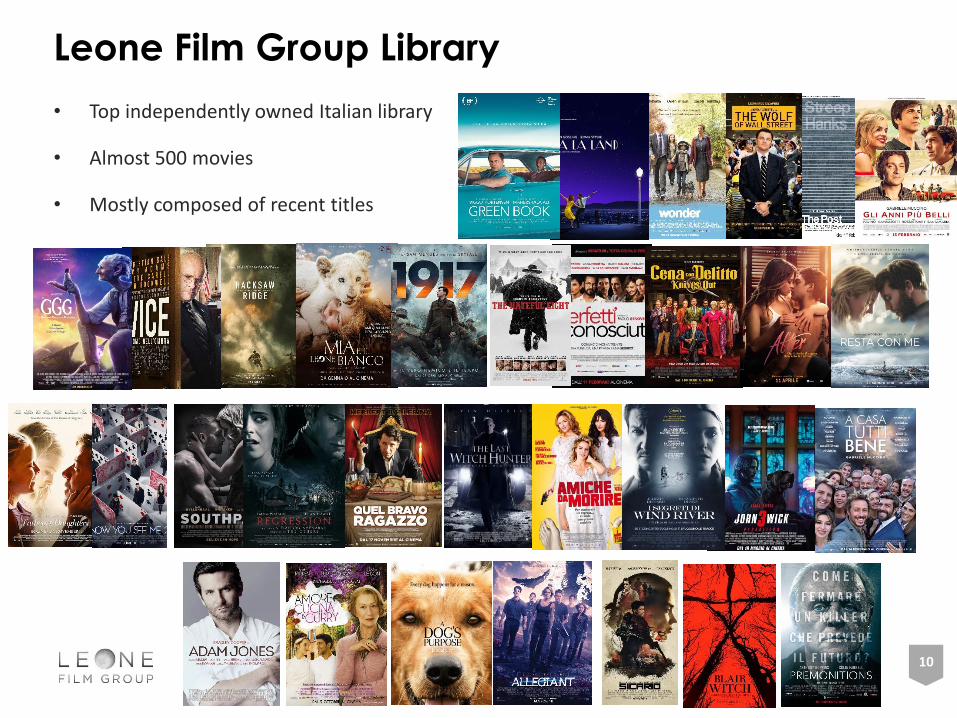
Leone Film Group Library
10
• Top independently owned Italian library
• Almost 500 movies
• Mostly composed of recent titles
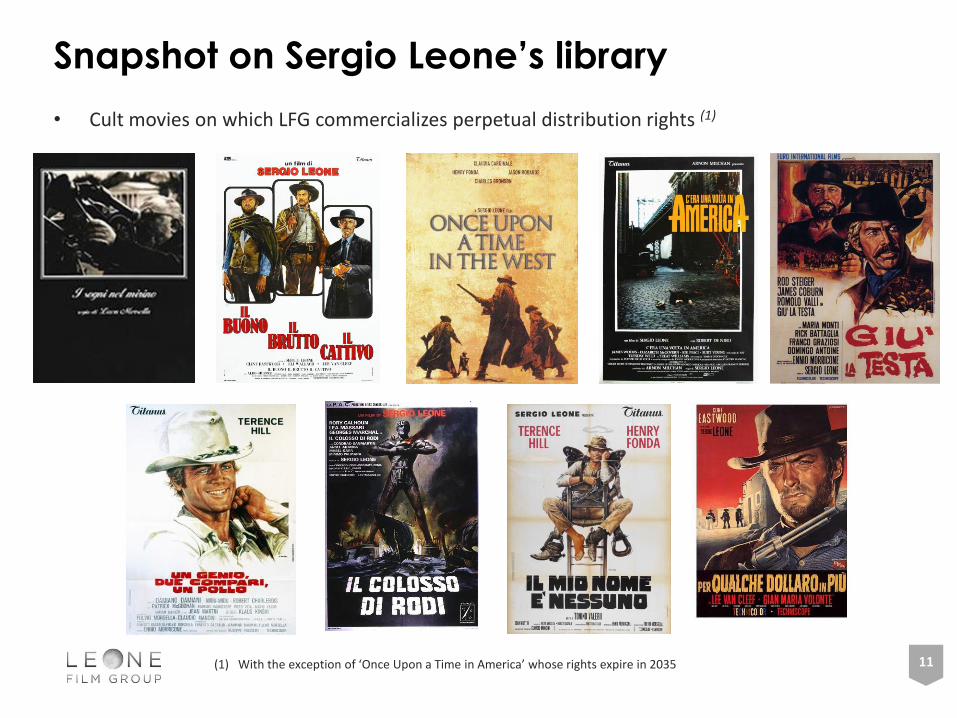
Snapshot on Sergio Leone’s library
11
• Cult movies on which LFG commercializes perpetual distribution rights (1)
(1) With the exception of ‘Once Upon a Time in America’ whose rights expire in 2035
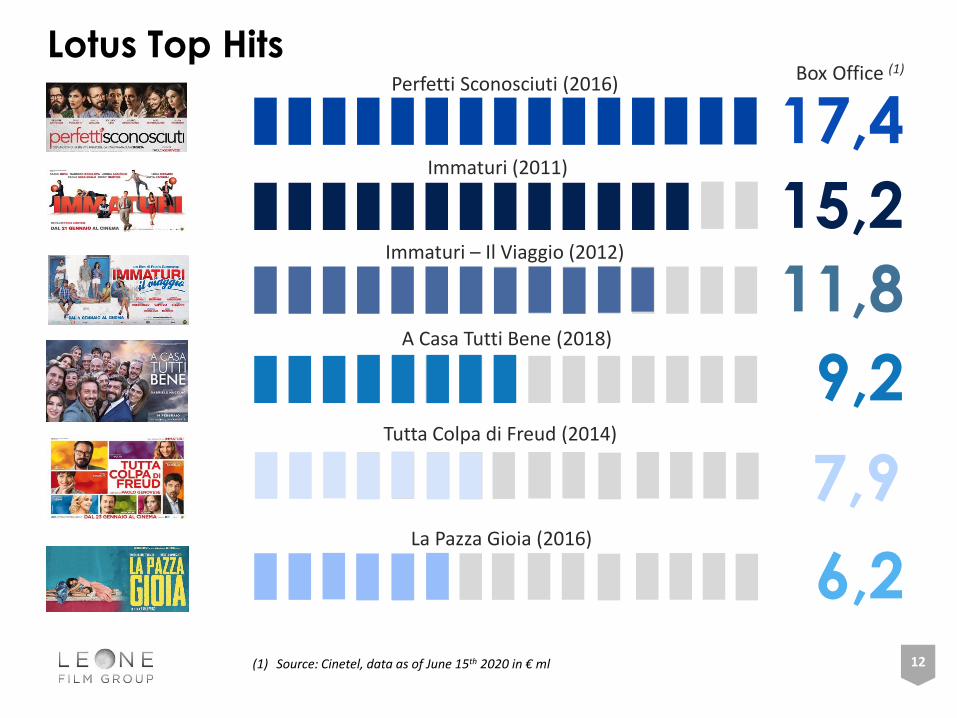
Lotus Top Hits
Immaturi (2011)
Immaturi – Il Viaggio (2012)
A Casa Tutti Bene (2018)
La Pazza Gioia (2016)
15,2
11,8
9,2
6,2
17,4Perfetti Sconosciuti (2016)
12
Tutta Colpa di Freud (2014)
7,9
Box Office (1)
(1) Source: Cinetel, data as of June 15th 2020 in € ml
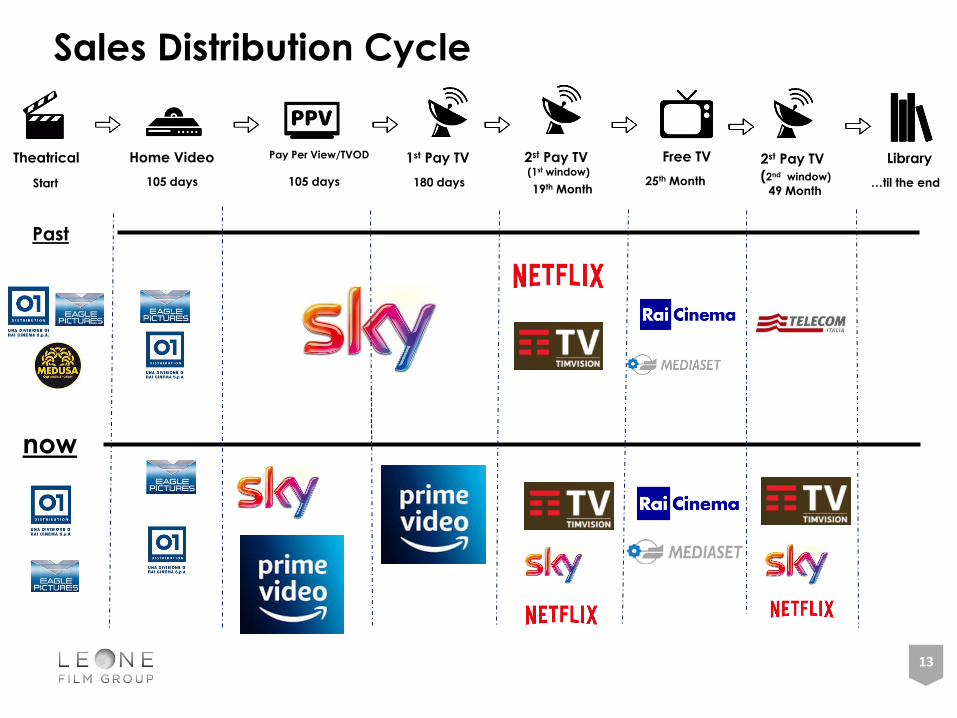
Sales Distribution Cycle
13
Theatrical Home Video Pay Per View/TVOD 1st Pay TV Free TV
Past
now
Library
Start 105 days …til the end105 days 180 days19th Month
2st Pay TV(1st window)
25th Month 49 Month
2st Pay TV (2nd window)
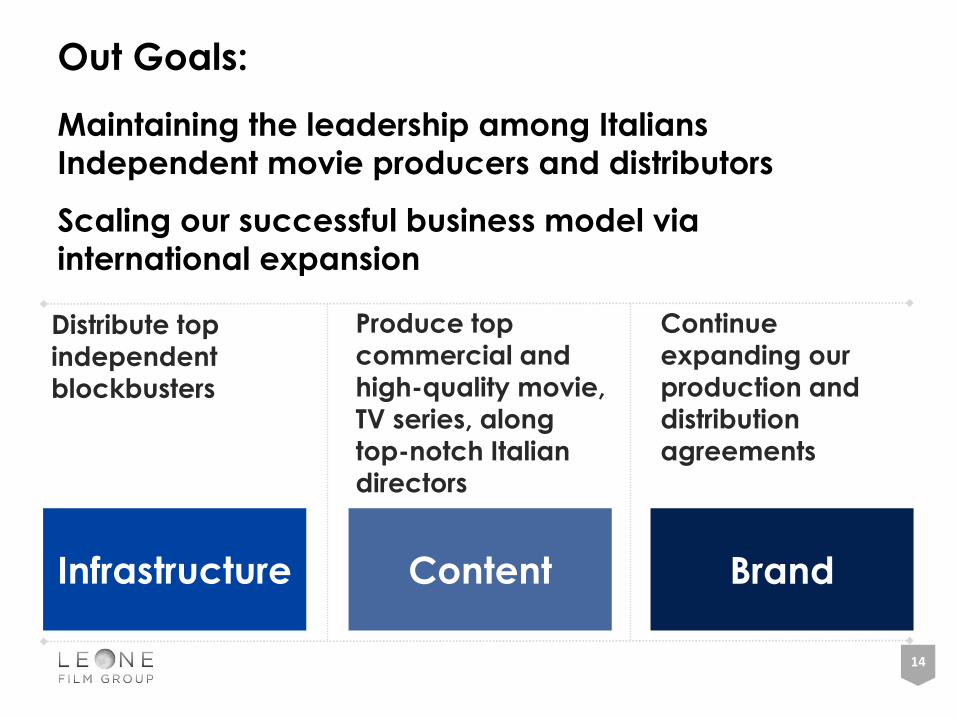
Maintaining the leadership among Italians
Independent movie producers and distributors
Scaling our successful business model via
international expansion
Distribute top
independent
blockbusters
Produce top
commercial and
high-quality movie, TV series, along
top-notch Italian
directors
Continue
expanding our
production and distribution
agreements
BrandContentInfrastructure
14
Out Goals:
2. KEY FACTS
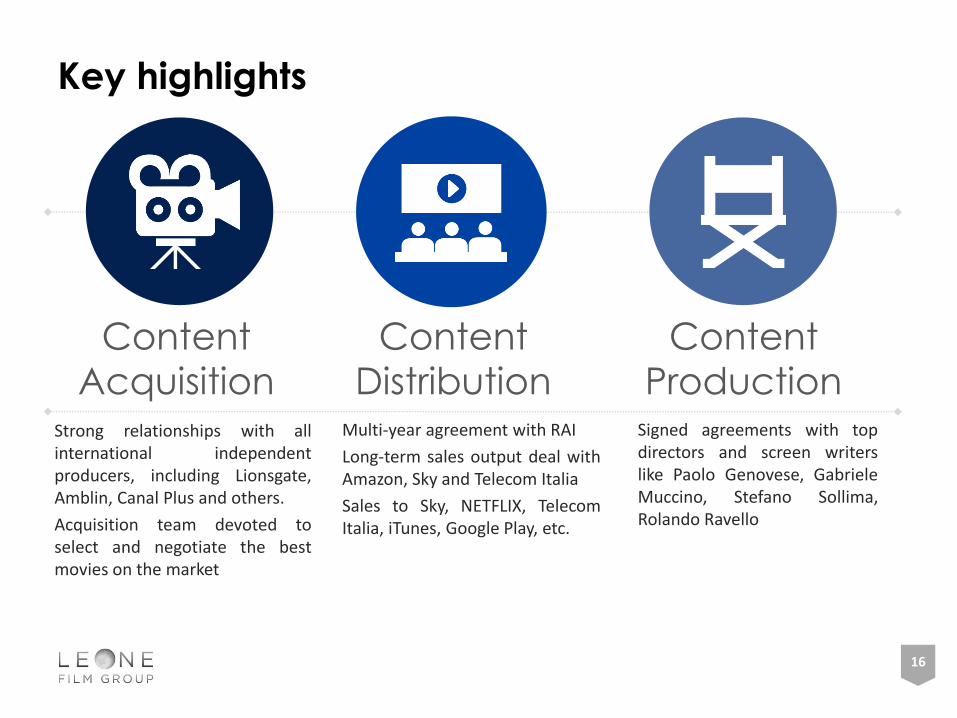
Strong relationships with allinternational independentproducers, including Lionsgate,Amblin, Canal Plus and others.
Acquisition team devoted toselect and negotiate the bestmovies on the market
Content
Acquisition
Content
Distribution
Content
Production
Key highlights
Multi-year agreement with RAI
Long-term sales output deal withAmazon, Sky and Telecom Italia
Sales to Sky, NETFLIX, TelecomItalia, iTunes, Google Play, etc.
Signed agreements with topdirectors and screen writerslike Paolo Genovese, GabrieleMuccino, Stefano Sollima,Rolando Ravello
16
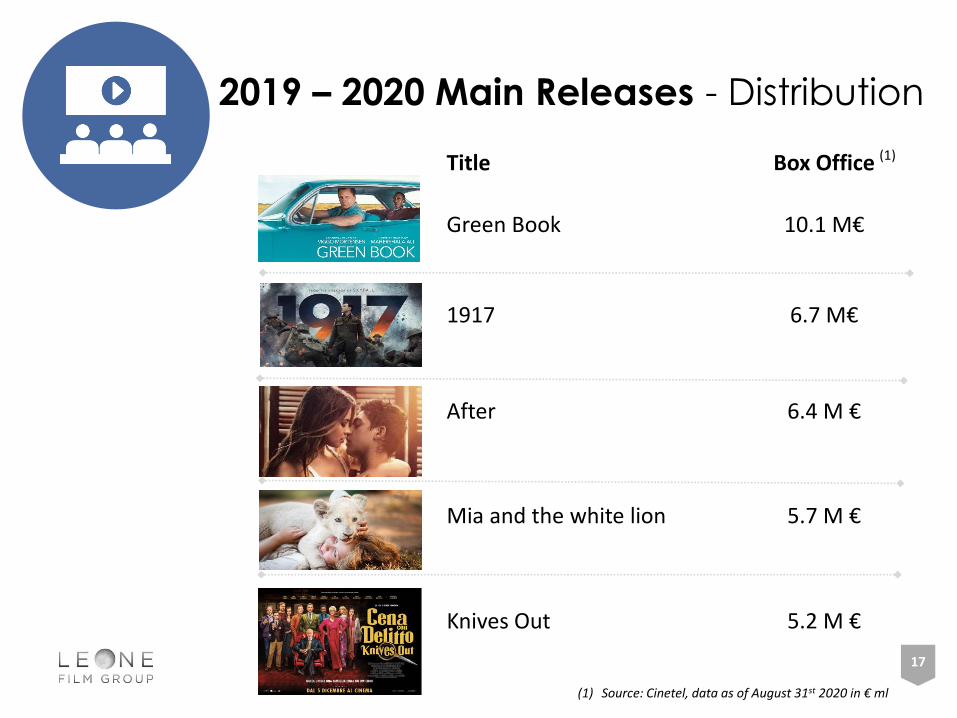
2019 – 2020 Main Releases - Distribution
Title Box Office
Green Book 10.1 M€
1917 6.7 M€
After 6.4 M €
Mia and the white lion 5.7 M €
Knives Out 5.2 M €
17
(1)
(1) Source: Cinetel, data as of August 31st 2020 in € ml
3. OUR ROADMAP
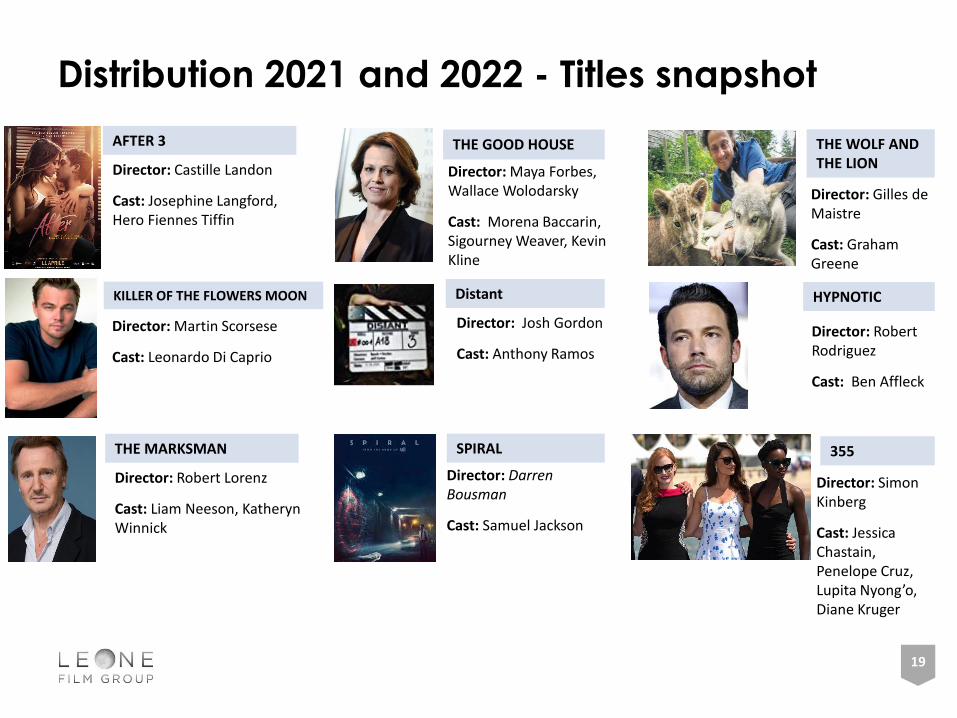
Distant
Director: Josh Gordon
Cast: Anthony Ramos
THE MARKSMAN
Director: Robert Lorenz
Cast: Liam Neeson, Katheryn Winnick
Distribution 2021 and 2022 - Titles snapshot
AFTER 3
Director: Castille Landon
Cast: Josephine Langford, Hero Fiennes Tiffin
KILLER OF THE FLOWERS MOON
Director: Martin Scorsese
Cast: Leonardo Di Caprio
SPIRAL
Director: Darren Bousman
Cast: Samuel Jackson
19
THE GOOD HOUSE
Director: Maya Forbes, Wallace Wolodarsky
Cast: Morena Baccarin, Sigourney Weaver, Kevin Kline
THE WOLF AND THE LION
Director: Gilles de Maistre
Cast: Graham Greene
HYPNOTIC
Director: Robert Rodriguez
Cast: Ben Affleck
355
Director: Simon Kinberg
Cast: Jessica Chastain, Penelope Cruz, Lupita Nyong’o, Diane Kruger
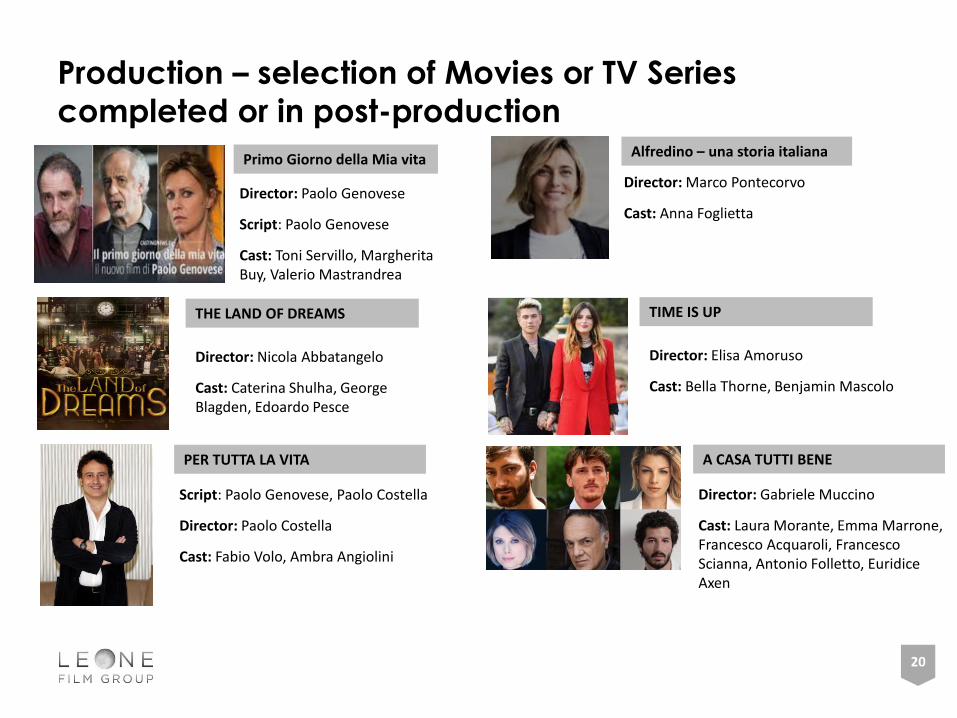
Production – selection of Movies or TV Series
completed or in post-production
THE LAND OF DREAMS
Director: Nicola Abbatangelo
Cast: Caterina Shulha, George Blagden, Edoardo Pesce
20
Primo Giorno della Mia vita
Director: Paolo Genovese
Script: Paolo Genovese
Cast: Toni Servillo, Margherita Buy, Valerio Mastrandrea
PER TUTTA LA VITA
Script: Paolo Genovese, Paolo Costella
Director: Paolo Costella
Cast: Fabio Volo, Ambra Angiolini
Alfredino – una storia italiana
Director: Marco Pontecorvo
Cast: Anna Foglietta
TIME IS UP
Director: Elisa Amoruso
Cast: Bella Thorne, Benjamin Mascolo
A CASA TUTTI BENE
Director: Gabriele Muccino
Cast: Laura Morante, Emma Marrone, Francesco Acquaroli, Francesco Scianna, Antonio Folletto, Euridice Axen

4. DISTRIBUTION
5. DISTRIBUTION
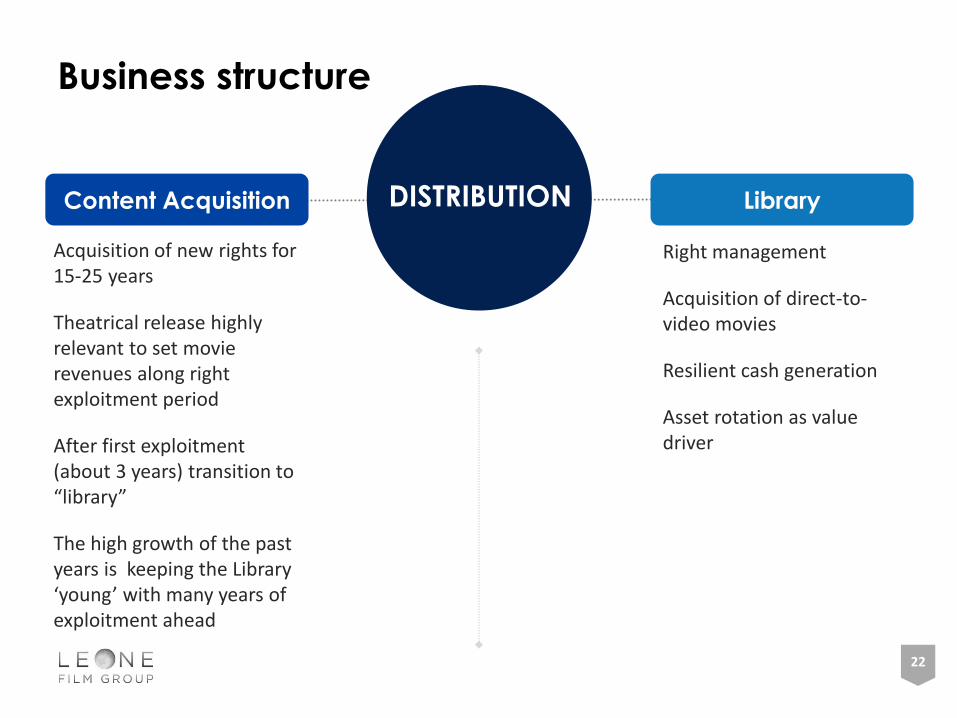
Business structure
Acquisition of new rights for 15-25 years
Theatrical release highly relevant to set movie revenues along right exploitment period
After first exploitment(about 3 years) transition to “library”
The high growth of the past years is keeping the Library ‘young’ with many years of exploitment ahead
LibraryContent Acquisition DISTRIBUTION
Right management
Acquisition of direct-to-video movies
Resilient cash generation
Asset rotation as value driver
22
23
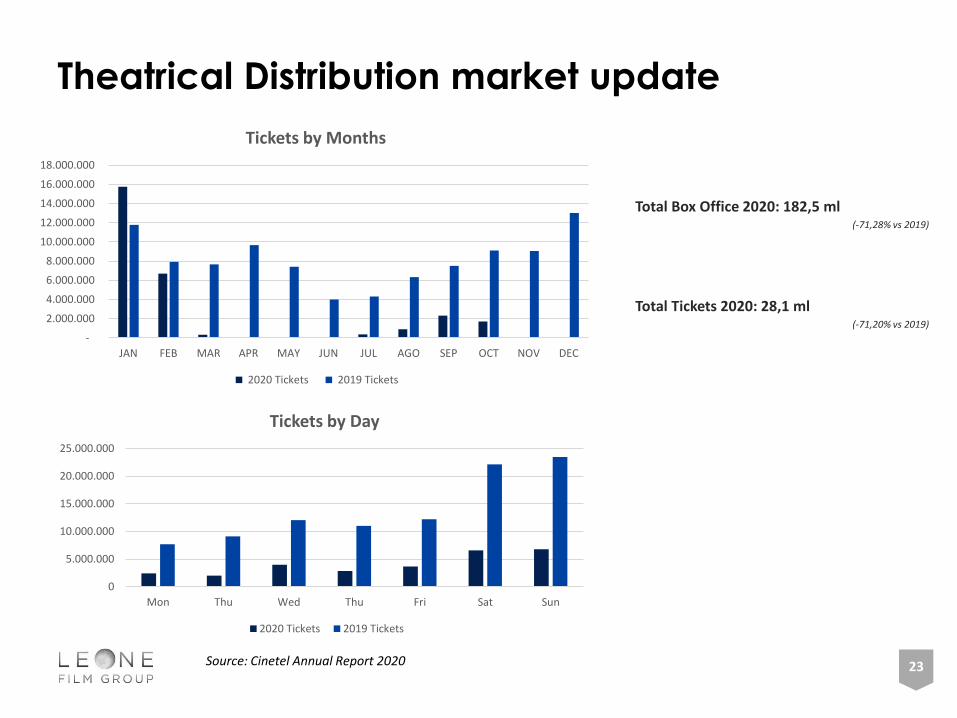
Theatrical Distribution market update
Total Box Office 2020: 182,5 ml(-71,28% vs 2019)
Total Tickets 2020: 28,1 ml(-71,20% vs 2019)
Source: Cinetel Annual Report 2020
-
2.000.000
4.000.000
6.000.000
8.000.000
10.000.000
12.000.000
14.000.000
16.000.000
18.000.000
JAN FEB MAR APR MAY JUN JUL AGO SEP OCT NOV DEC
Tickets by Months
2020 Tickets 2019 Tickets
0
5.000.000
10.000.000
15.000.000
20.000.000
25.000.000
Mon Thu Wed Thu Fri Sat Sun
Tickets by Day
2020 Tickets 2019 Tickets

5. PRODUCTION
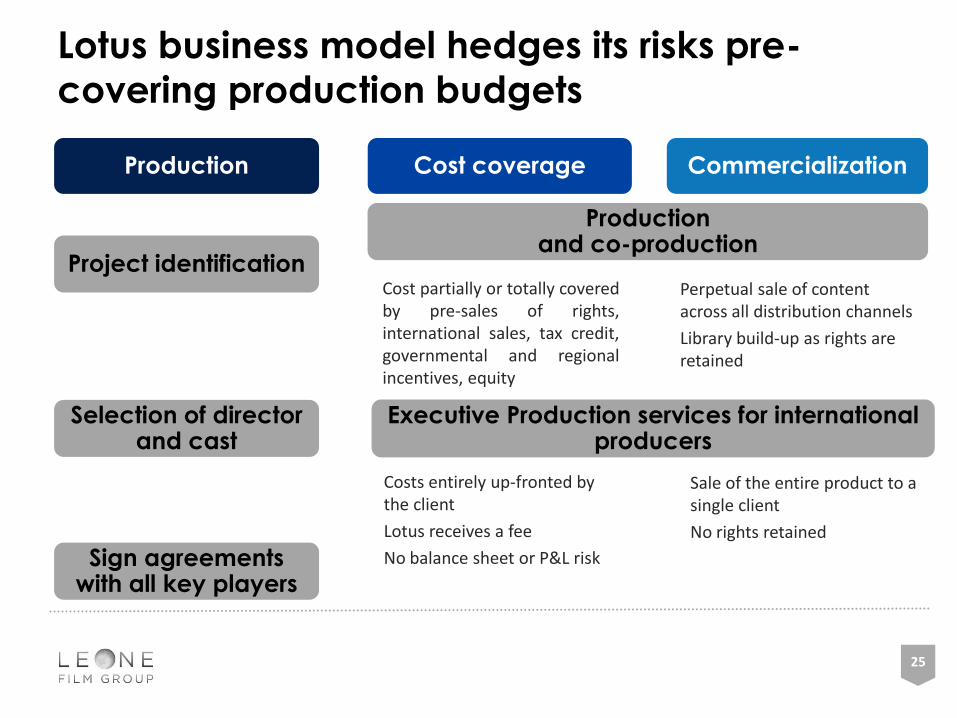
Lotus business model hedges its risks pre-
covering production budgets
Production and co-production
Perpetual sale of content across all distribution channels
Library build-up as rights are retained
CommercializationCost coverageProduction
Costs entirely up-fronted by the client
Lotus receives a fee
No balance sheet or P&L risk
Sale of the entire product to a single client
No rights retained
Cost partially or totally coveredby pre-sales of rights,international sales, tax credit,governmental and regionalincentives, equity
25
Project identification
Selection of director and cast
Sign agreements with all key players
Executive Production services for international producers
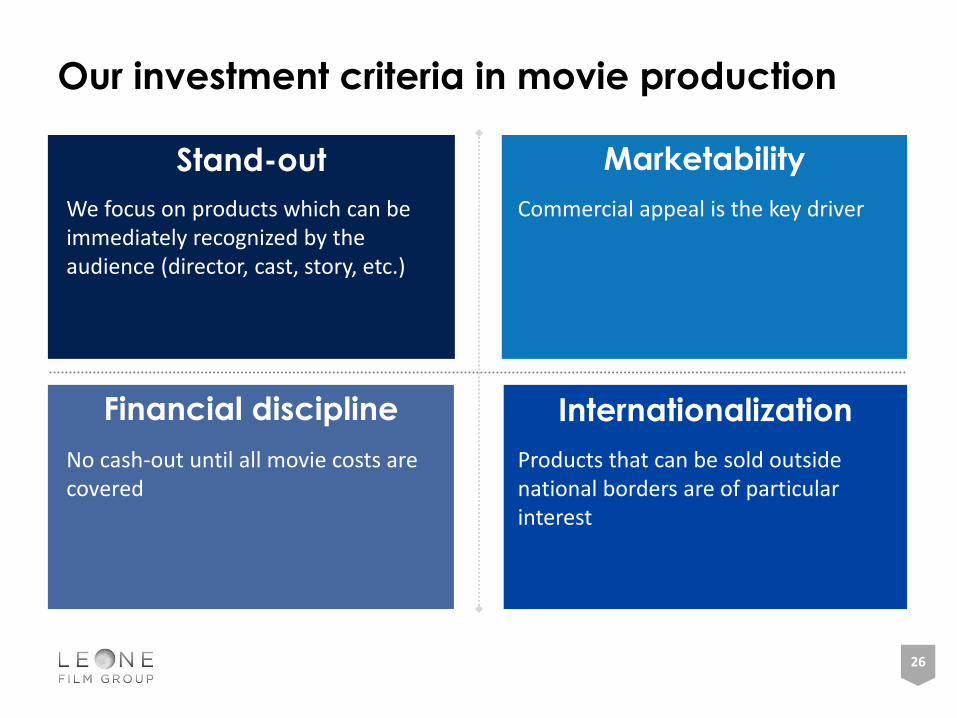
Our investment criteria in movie production
26
Stand-out Marketability
Financial discipline Internationalization
We focus on products which can be immediately recognized by the audience (director, cast, story, etc.)
Commercial appeal is the key driver
No cash-out until all movie costs are covered
Products that can be sold outside national borders are of particular interest
6. 2020 RESULTS AND 2021
TARGETS
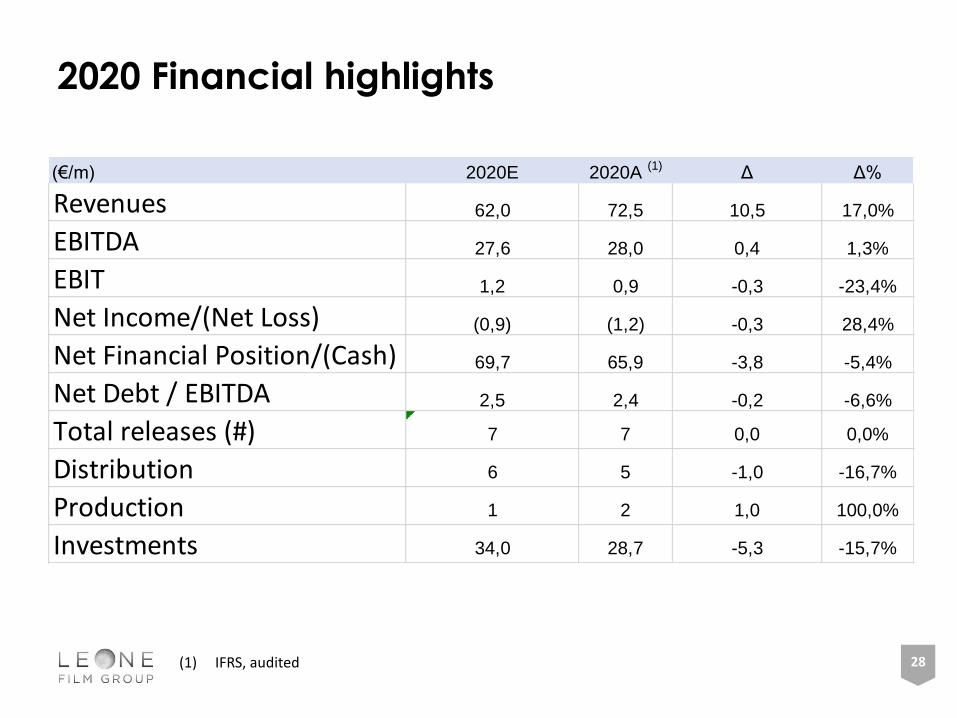
2020 Financial highlights
28(1) IFRS, audited
(€/m) 2020E 2020A (1)
Δ Δ%
Revenues 62,0 72,5 10,5 17,0%
EBITDA 27,6 28,0 0,4 1,3%
EBIT 1,2 0,9 -0,3 -23,4%
Net Income/(Net Loss) (0,9) (1,2) -0,3 28,4%
Net Financial Position/(Cash) 69,7 65,9 -3,8 -5,4%
Net Debt / EBITDA 2,5 2,4 -0,2 -6,6%
Total releases (#) 7 7 0,0 0,0%
Distribution 6 5 -1,0 -16,7%
Production 1 2 1,0 100,0%
Investments 34,0 28,7 -5,3 -15,7%
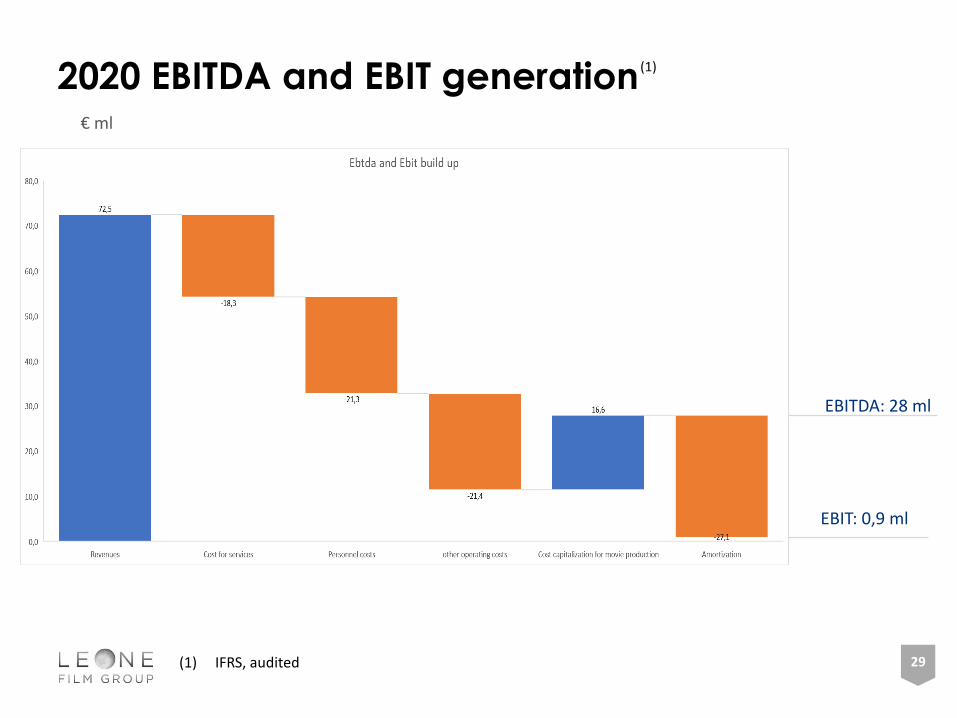
2020 EBITDA and EBIT generation
29
EBITDA: 28 ml
EBIT: 0,9 ml
€ ml
(1) IFRS, audited
(1)
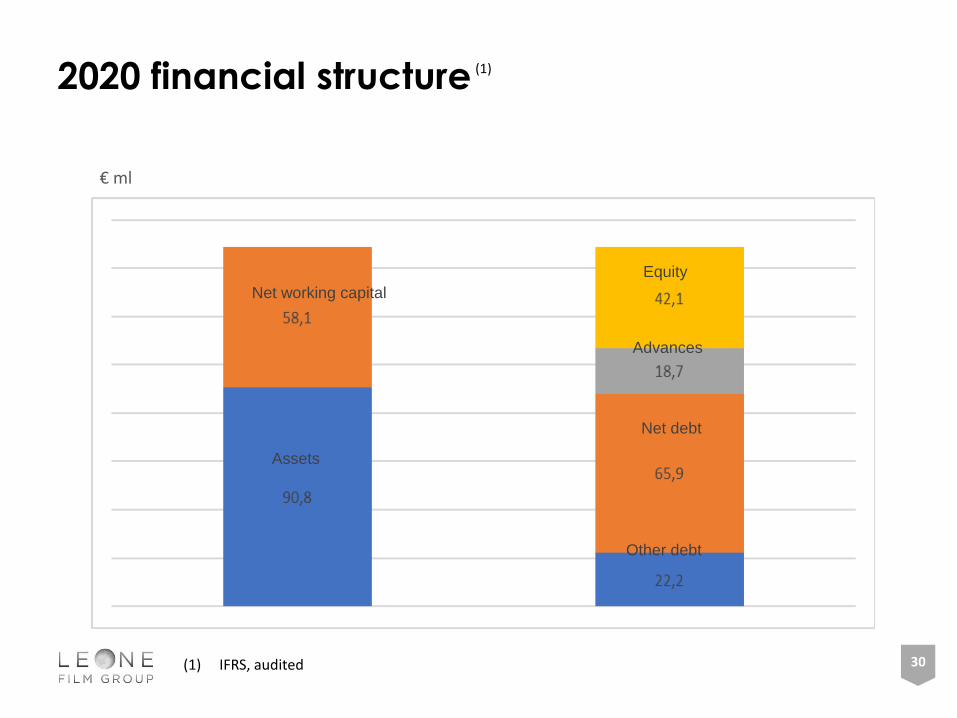
2020 financial structure
30(1) IFRS, audited
€ ml
(1)
Assets
Net working capital
Equity
Advances
Net debt
Other debt
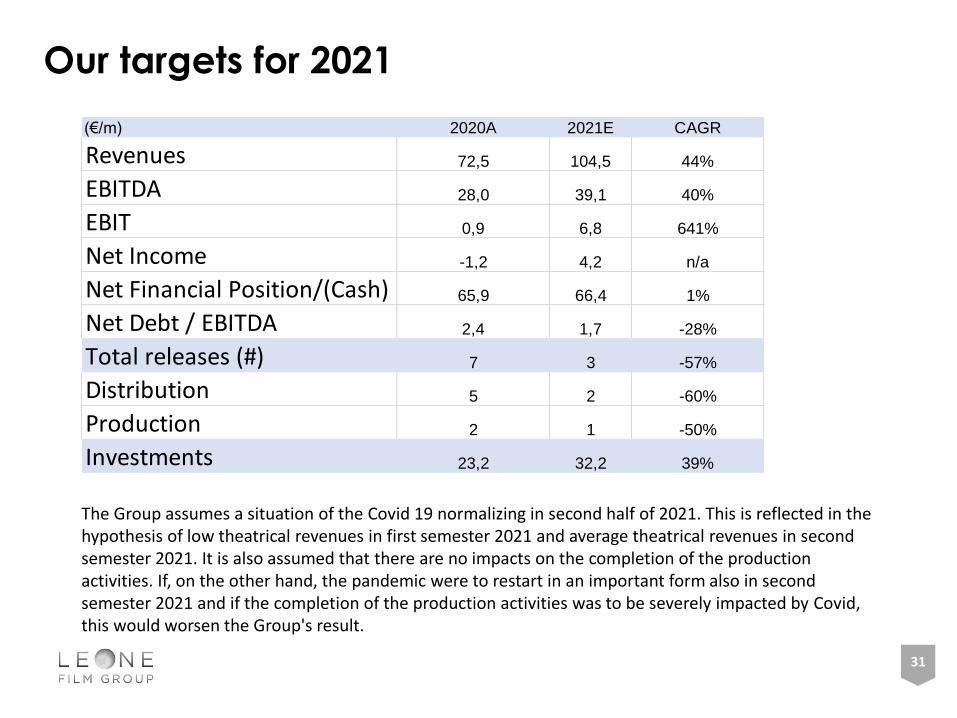
Our targets for 2021
31
The Group assumes a situation of the Covid 19 normalizing in second half of 2021. This is reflected in the hypothesis of low theatrical revenues in first semester 2021 and average theatrical revenues in second semester 2021. It is also assumed that there are no impacts on the completion of the production activities. If, on the other hand, the pandemic were to restart in an important form also in second semester 2021 and if the completion of the production activities was to be severely impacted by Covid, this would worsen the Group's result.
(€/m) 2020A 2021E CAGR
Revenues 72,5 104,5 44%
EBITDA 28,0 39,1 40%
EBIT 0,9 6,8 641%
Net Income -1,2 4,2 n/a
Net Financial Position/(Cash) 65,9 66,4 1%
Net Debt / EBITDA 2,4 1,7 -28%
Total releases (#) 7 3 -57%
Distribution 5 2 -60%
Production 2 1 -50%
Investments 23,2 32,2 39%
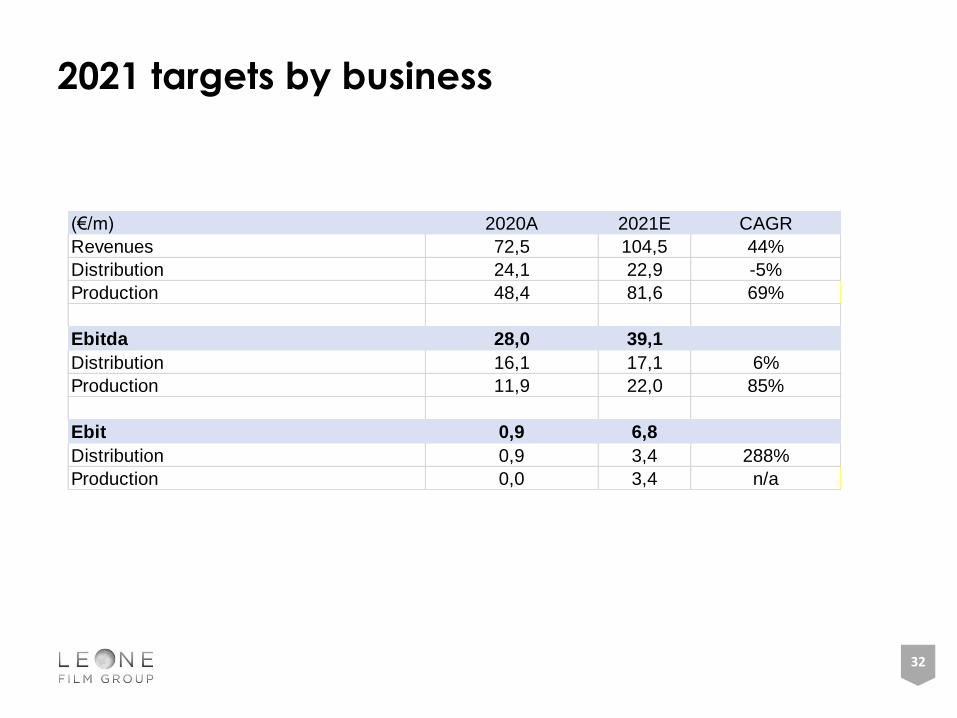
2021 targets by business
32
(€/m) 2020A 2021E CAGR
Revenues 72,5 104,5 44%
Distribution 24,1 22,9 -5%
Production 48,4 81,6 69%
Ebitda 28,0 39,1
Distribution 16,1 17,1 6%
Production 11,9 22,0 85%
Ebit 0,9 6,8
Distribution 0,9 3,4 288%
Production 0,0 3,4 n/a
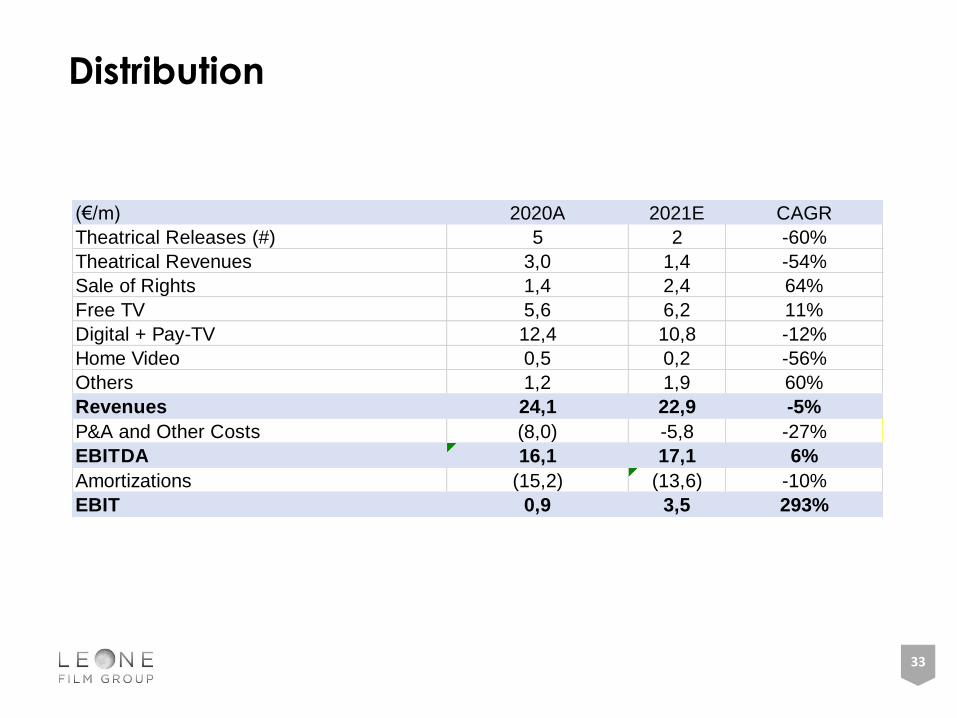
Distribution
33
(€/m) 2020A 2021E CAGR
Theatrical Releases (#) 5 2 -60%
Theatrical Revenues 3,0 1,4 -54%
Sale of Rights 1,4 2,4 64%
Free TV 5,6 6,2 11%
Digital + Pay-TV 12,4 10,8 -12%
Home Video 0,5 0,2 -56%
Others 1,2 1,9 60%
Revenues 24,1 22,9 -5%
P&A and Other Costs (8,0) -5,8 -27%
EBITDA 16,1 17,1 6%
Amortizations (15,2) (13,6) -10%
EBIT 0,9 3,5 293%
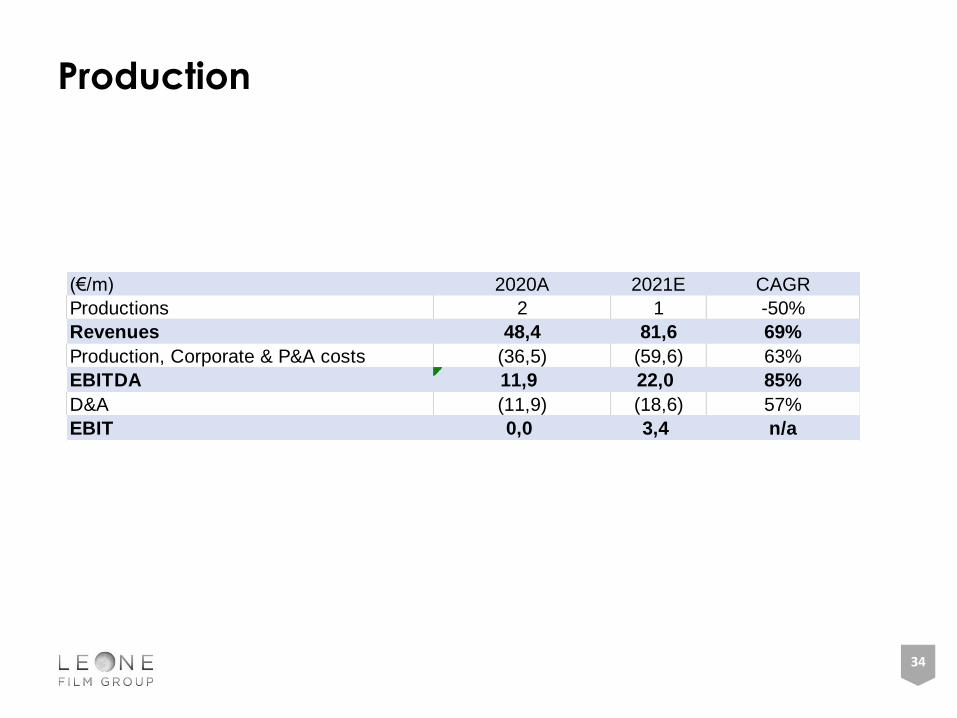
Production
34
(€/m) 2020A 2021E CAGR
Productions 2 1 -50%
Revenues 48,4 81,6 69%
Production, Corporate & P&A costs (36,5) (59,6) 63%
EBITDA 11,9 22,0 85%
D&A (11,9) (18,6) 57%
EBIT 0,0 3,4 n/a
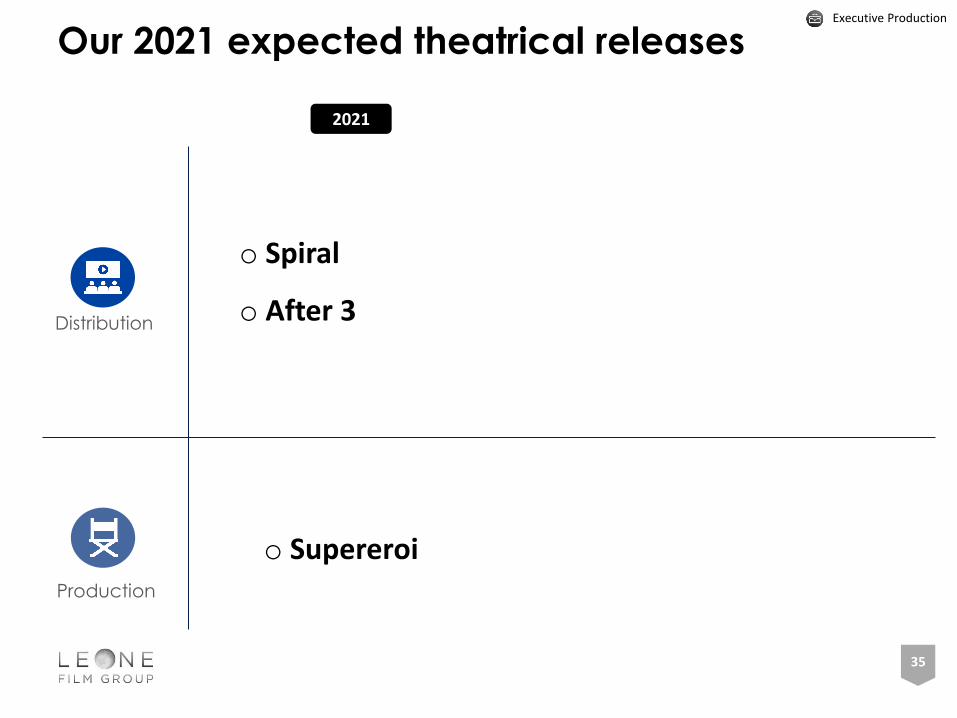
Our 2021 expected theatrical releases
35
2021
Distribution
Production
Executive Production
o Spiral
o After 3
o Supereroi
DISCLAIMER
This presentation contains certain forward-looking statements that reflect
Leone Film Group S.p.A. (“LFG”) management’s current views with respect to
future events and financial and operational performance of the company and
its subsidiaries. These forward-looking statements are based on LFG’s current
expectations and projections about future events. Because these forward-
looking statements are subject to risks and uncertainties, actual future results
or performance may differ materially from those expressed in or implied by
these statements due to any number of different factors, many of which are
beyond the ability of LFG to control or estimate precisely, including changes in
the regulatory environment, future market developments and other risks.
You are cautioned not to place undue reliance on the forward-looking
statements contained herein, which are made only as of the date of this
presentation. LFG does not undertake any obligation to publicly release any
updates or revisions to any forward-looking statements to reflect events or
circumstances after the date of this presentation. This presentation does not
constitute a recommendation regarding the securities of LFG.