7 SEPTEMBER 2021 Interim results 2021
28
For Institutional Use Only – Not for Public Distribution Interim results 2021 David Layton, CEO | Hans Ploos van Amstel, CFO | Sarah Brewer, Co-Head Client Solutions 7 SEPTEMBER 2021 Resilient Infrastructure Group | Private Infrastructure
Transcript of 7 SEPTEMBER 2021 Interim results 2021

For Institutional Use Only – Not for Public Distribution
Interim results 2021David Layton, CEO | Hans Ploos van Amstel, CFO | Sarah Brewer, Co-Head Client Solutions
7 SEPTEMBER 2021
Resilient Infrastructure Group | Private Infrastructure

How we deliver sustainable growth
2
Transformational investing
David Layton
Bespoke client solutionsSarah Brewer
Sustainable returns
Hans Ploos
USD 13 billion invested
USD 11 billion realized
Thematic investment drives pipeline
USD 12 billion raised
9% AuM growth
Confident outlook for 2021
Strong performance fees in H1
Stable EBIT margin at 62%
Strong net profit growth
Source: Partners Group (2021).
INTERIM RESULTS 2021

Table of contents
3
1 Investments
2 Clients
3 Financials
INTERIM RESULTS 2021

Strong investment and divestment activity amid robust demand for market-leading businesses and real assets
4
Equity
Prim.
Sec.
Investments1 (in USD billion) Portfolio realizations2 (in USD billion)
H1 H1
H1 H1H1
H1
H2H2
H2
H2
H2
2016 2017 2018 2019 2020 H1 2021
11.7
13.6
21.7
17.0
10.3
13.1
H1 H1
H1
H1H1
H1
H2 H2
H2
H2H2
H2
2016 2017 2018 2019 2020 H1 2021
10.2
11.8
13.4
11.011.8
10.5
1 Figures include add-on investments but exclude syndication partner investments.2 Figures include realizations from Partners Group's direct as well as portfolio assets (primaries and secondaries). Source: Partners Group (2021).
INVESTMENTS

Private equity
USD 77 billionInvested in private equity1
21.7%Net IRR on direct investments2
>200 Private equity professionals
For illustrative purposes only. Source: Partners Group (2021). Past performance is not indicative of future results. There is no assurance that similar results will be achieved. There is no assurance thatsimilar investments will be made. 1 As of 30 June 2021 and includes syndication partner investment commitments. 2 Since inception as of 30 June 2021. Figures represent private equity directinvestments (excluding early-stage venture), where Partners Group's role is lead or joint lead, that Partners Group made on behalf of its clients. All cash flows and valuations have been converted to USDusing fixed exchange rates as of report date of the track record. Model net returns assume Partners Group standard management and performance fees. Management fee 1.50% for direct investments.Performance fee 20% for direct investments over 8% preferred return. The model net figures do not include the impact of other possible factors such as any taxes incurred by investors, organizationalexpenses typically incurred at the start of the investment program, search fee, admin fees, ongoing operating costs or expenses incurred by the investment program (e.g. audit, hedging) or cash drag. Theperformance presented reflects model performance and does not represent performance that any investor actually attained. 3 Software Product Engineering Services.
Select growth themeswhere we avoid cyclicality and
focus on stable sectors
Physical therapy Health & Life
Top five US independent outpatient physical therapy
services provider
Software PES3
TechnologyResidential services
Services
Future agriculture Goods & Products
Leading software development company
providing experience design & digital
engineering services
Leader in residential property management and
support services for owners and tenants
Leading developer, manufacturer and supplier
of differentiated crop lifecycle management
solutions
SELECTED INVESTMENT SUB-SECTORS THAT EXHIBIT TRANSFORMATIVE GROWTH THEMESKEY INVESTMENT PILLARS
Platform companies where we buy add-on firms
to grow the platform
Asset transformationby enhancing business models and operations
5INVESTMENTS

Private debt
For illustrative purposes only. Source: Partners Group (2021). Past performance is not indicative of future results. There is no assurance that similar results will be achieved. There is no assurance thatsimilar investments will be made. 1 As of 30 June 2021 and includes investments executed for short term loans, broadly syndicated loans and cash management. 2 Since inception as of as of 30 June2021. Figures represent Private Debt investments, that Partners Group made on behalf of its clients. All cash flows and valuations have been converted to USD using fixed exchange rates as of reportdate of the track record. Model net returns assume Partners Group standard management and performance fees and is based on outstanding principal amount. Management fee 0.65% for first lieninvestments, 1.50% for second lien and 1.50% mezzanine investments. Performance fee 7.5% for first lien investments over 4.0% preferred return, 15.0% for second lien investments over 7.0%preferred return and 15.0% for mezzanine investments over 7.0% preferred return. The model net figures do not include the impact of other possible factors such as any taxes incurred by investors,organizational expenses typically incurred at the start of the investment program, search fee, admin fees, ongoing operating costs or expenses incurred by the investment program (e.g. audit, hedging) orcash drag. The performance presented reflects model performance and does not represent performance that any investor actually attained.
6.2%Net IRR on direct investments2
Senior Syndicated Debt Senior Direct Second Lien Direct
INVESTMENT STRATEGIES
Private Equity style due diligence
Conscious focus on non-cyclical industries
Helping companies position for future growth
Less liquidMore liquid
KEY INVESTMENT PILLARS
6
USD 38 billionInvested private debt1
6.5%Net IRR on direct investments2
>90 Private debt professionals
INVESTMENTS

SELECTED INVESTMENT SUB-SECTORS THAT EXHIBIT TRANSFORMATIVE GROWTH THEMES
Private real estate
For illustrative purposes only. Source: Partners Group (2021). Past performance is not indicative of future results. There is no assurance that similar results will be achieved. There is no assurance thatsimilar investments will be made. 1 As of 30 June 2021 and includes syndication partner investment commitments. 2 Figures represent a subset of only partially and fully realized special situations-related investments which would qualify for allocation to PG RE Opportunities 2019 program on behalf of Partners Group's clients as of 30 June 2021. All cash flows and valuations have been convertedto USD using fixed exchange rates as of report date of the track record. Model net returns assume Partners Group standard management and performance fees. Management fee 1.50% for direct andreal estate opportunities strategy investments, 1.25% for secondary (non real estate opportunities strategy) investments and 0.75% for primary investments. Performance fee 20% for direct and realestate opportunities strategy investments, 10% for secondary (non real estate opportunities strategy) investments and 10% for primary investments over 8% preferred return. The model net figures donot include the impact of other possible factors such as any taxes incurred by investors, organizational expenses typically incurred at the start of the investment program, search fee, admin fees, ongoingoperating costs or expenses incurred by the investment program (e.g. audit, hedging) or cash drag. The performance presented reflects model performance and does not represent performance that anyinvestor actually attained.
Residential Office
Acquisition of eleven geographically diversified industrial properties and
two development opportunities across the US
Recapitalization of seven residential assets in
Copenhagen, Denmark
Acquisition of eleven class-A, ESG-compliant, newly developed
office properties in Krakow and Wroclaw, Poland
Select growth themesthrough research and
relative value
Source off-marketthrough our industry
network
Drive value creationat asset level to enhance
NOI growth
Logistics
KEY INVESTMENT PILLARS
7
USD 22 billionInvested in private real estate1
11.6%Net IRR on direct investments2
>70 Real estate professionals
INVESTMENTS

Private infrastructure
14.4%Net IRR on direct investments2
For illustrative purposes only. Source: Partners Group (2021). Past performance is not indicative of future results. There is no assurance that similar results will be achieved. There is no assurance thatsimilar investments will be made. 1 As of 30 June 2021 and includes syndication partner investment commitments. 2 Since inception as of 30 June 2021. Figures represent Infrastructure Directsinvestments, that Partners Group made on behalf of its clients. Cross-over deals are partially included in the infrastructure track record based on pro-rata allocations to PG Infrastructure products. Allcash flows and valuations have been converted to USD using fixed exchange rates as of report date of the track record. Model net returns assume Partners Group standard management andperformance fees. Management fee 1.50% for direct investments, Performance fee 20% for direct investments over 8% preferred return. The model net figures do not include the impact of otherpossible factors such as any taxes incurred by investors, organizational expenses typically incurred at the start of the investment program, search fee, admin fees, ongoing operating costs or expensesincurred by the investment program (e.g. audit, hedging) or cash drag. The performance presented reflects model performance and does not represent performance that any investor actually attained.
Renewable energy Water management New mobility
Large-scale renewable energy platform with 1.2GW
capacity in Australia
Platform to develop, build, acquire, own and operate decentralized water infrastructure
assets in the U.S. and Canada
Pan-European leader in electronic toll collection
based in Italy
Building corewhere strong fundamentals
support demand
Platform expansion offers the opportunity
to develop scale
Operational value creationthrough growth and
efficiency improvements
SELECTED INVESTMENT SUB-SECTORS THAT EXHIBIT TRANSFORMATIVE GROWTH THEMESKEY INVESTMENT PILLARS
8
USD 14 billionInvested in private infrastructure1
14.4%Net IRR on direct investments2
>80 Infrastructure professionals
INVESTMENTS

Our ESG progress and achievements in H1 2021
9
Source: Partners Group (2021).
• Further optimize data collection and improve reporting efforts to stay ahead of regulatory requirements
• Ensure that every lead direct portfolio company has a dedicated ESG responsible at board and management level
ESG transparency
ESG investment themes
ESG value creation
Improvement of sustainability
communication
Development of stakeholder
impact program
Development of diversity &
inclusion strategy
Launch of education for sustainable
development program
Decarbonization Access to telecommunications
Water accessSustainable
infrastructure
INVESTMENTS

11
119
20
06
20
07
20
08
20
09
20
10
20
11
20
12
20
13
20
14
20
15
20
16
20
17
20
18
20
19
20
20
H1
20
21
IPO
Sustainable AuM growth across asset classes by capitalizing on thematic trends
10
Total assets under management1 (in USD billion)
59bnPrivateequity
26bnPrivate
debt
17bnPrivate
real estate
16bnPrivate
infrastructure
Note: assets under management exclude discontinued public alternative investment activities and divested affiliated companies held up to 2013.1 Partners Group aims to mirror the fee basis for its various programs and mandates when calculating AuM. For further information please refer to the 2021 Interim Report, "Key definitions and alternative performance metrics (APM)", on page 23, available for download at www.partnersgroup.com/financialreports. Source: Partners Group (2021).
INVESTMENTS

Table of contents
11
1 Investments
2 Clients
3 Financials
INTERIM RESULTS 2021

AuM by region (as of 30 June 2021)
AuM stem from a broad range of international clients
12
Switzerland15%
Germany & Austria
16%
France & Benelux6%
Southern Europe3%Scandinavia
3%
Great Britain & Ireland
20%
North America18%
South America2%
Middle East3%
Asia7%
Australia7%
USD119 billion
AuM by client type (as of 30 June 2021)
Public pension funds & SWFs
23%
Corporate & other pension funds
28%
Insurance companies
10%
Asset managers, family offices,
banks & others20%
Distribution partners / private
individuals19%
USD119 billion
Source: Partners Group (2021).
CLIENTS

AuM well-diversified across programs and structures
13
1 Assets under management as of 30 June 2021. Mandates AuM include commitments by select mandate clients into traditional programs; therefore, the corresponding amount is not included within the AuM category "traditional client programs". Source: Partners Group (2021).
Breakdown by program structure1Breakdown by private market programs and mandates1
Evergreenprograms (26%)
USD 119 billion
(~300 programs & mandates)
Traditionalclient programs
35%
USD119 billion
Bespokeclient solutions
65%
Evergreenprograms (27%)
CLIENTS

58%43%
32%
24%
10%
20%
13%
2008 2020
AuM diversified across clients and their asset class investments
14
AuM by client concentration (as of 30 June 2021) Number of asset classes per client1 (as of 31 December 2020)
1 Figures are calculated as total client AuM split by the number of Private Markets asset classes held by the client through Partners Group traditional products and mandates, excluding collateralized loan obligations and syndication vehicles as well as evergreen products.
57%42%
1 asset class
2 asset classes
3 asset classes4 asset classes
Invested in more than one asset class
Largest client 3% Top 2-5 clients
7%Top 6-10 clients
6%Top 11-20 clients
7%>900 other institutions
77%
USD119 billion
# of clients 3xUSD AuM 6x
CLIENTS

57
7483
94
109
2017 2018 2019 2020 2021
Outlook 2021 confirmed
15
AuM, client demand and other effects (in USD billion)
Due to rounding, some totals may not correspond with the sum of the separate figures.1 Tail-downs & redemptions: tail-downs consist of maturing investment programs (typically closed-ended structures); redemptions stem from evergreen programs. 2 Other consists of performance and investment program changes from select programs. Source: Partners Group (2021).
-4.0
+15.0
-5.6
-1.2FX & other2+6.2
FX & other2
+1.4FX & other2
-7.1
+15.7
-8.1
+16.5+16.0
+7.1FX & other2
19 - 22
Full-year 2021 expectations
Client demand
Tail-downs & redemptions1~ -9.5
+/- FX & other2
(no guidance provided)
Total AuM=
CLIENTS

Table of contents
16
1 Investments
2 Clients
3 Financials
INTERIM RESULTS 2021

390
702
H1 20 H1 21
623
1’130
H1 20 H1 21
567
688
H1 20 H1 21
Higher management fees and significant performance fees supported by strong exits
17
H1 2021 financial highlights
EBIT(in CHF million)
In line with revenue growth
Management fees1
(in CHF billion)
Strong increase due to AuM growth and late
management fees
Revenues2
(in CHF million)
Exit activity has translated into significant performance fee growth
+21%
EBIT margin(in %)
Target EBIT margin reconfirmed3
+81%
1 Management fees and other revenues, net, and other operating income. 2 Revenues from management services, net, including other operating income. 3 Partners Group has a 60% EBIT margin target for newly generated management fees and all performance fees. Source: Partners Group (2021).
+80%
56
442 Perf. fees
62.7% 62.1%
H1 20 H1 21
stable
FINANCIALS

Revenues underpinned by stable, contractually recurring management fees
18
Revenues1 (in CHF million)
H1 2019 H1 2020 H1 2021
682
Revenues1
69 Performance fees
Management fees2
1 Revenues from management services, net, including other operating income.2 Management fees and other revenues, net, and other operating income.Source: Partners Group (2021).
Other revenues from management services & other operating income
442(39%)
688(61%)
623
552(81%)
130(19%)
51
74
56(9%)
567(91%)
42
1'130
FINANCIALS

Management fees are expected to continue to be the main source of revenues
19
Management fees2
2006-2015 H1 2021 full-year 2022
1 Assuming that the market is favorable to exits, Partners Group expects to continue to generate significant performance fees from the underlying client portfolios due to the visibility that it has on the life cycles of its programs.2 Management fees and other revenues, net, and other operating income.Source: Partners Group (2021).
Outlook on performance fees
~90%
61%
70-80%
~10% 20-30%
40-45%1
full-year 2021expected
Performance fees139%
FINANCIALS

Top 124%
Top 216%
Top 3-519%
Top 6-1011%
Top 11-2014%
Rest (>60)16%
Performance fees are well diversified across programs and assets
20
CHF442m
1 For H1 2021.Source: Partners Group (2021).
Contribution by investment programs & mandates1
Top 115%
Top 28%
Top 38%
Top 42%
Top 52%
More than 60 direct assets
and hundreds of portfolio assets
65%
CHF442m
Our investment programs are highly diversified through our portfolio management approach
Contribution by single assets1
FINANCIALS

611
1822 24
2831
37
43 4550
57
74
83
94
109
119
16 1343 39 34 64
294
372324
473
266
442
0
100
200
300
400
500
600
700
800
2005 2006 2007 2008 2009 2010 2011 2012 2013 2014 2015 2016 2017 2018 2019 2020 H12021
0
20
40
60
80
100
120
H1
Performance fee potential is expected to grow in line with AuM over time
21
Note: assuming that the market is favorable to exits, Partners Group expects to continue to generate significant performance fees from the underlying client portfolios due to the visibility that it has on the life cycles of its programs.Source: Partners Group (2021).
2026+
~20-30% of total
revenuesPerformance fees (in CHF million)
AuM (in USD billion)
H1
H1
H1
H1H1
AuM and performance fee development
Past AuM……translates into future
performance fee potential
FINANCIALS
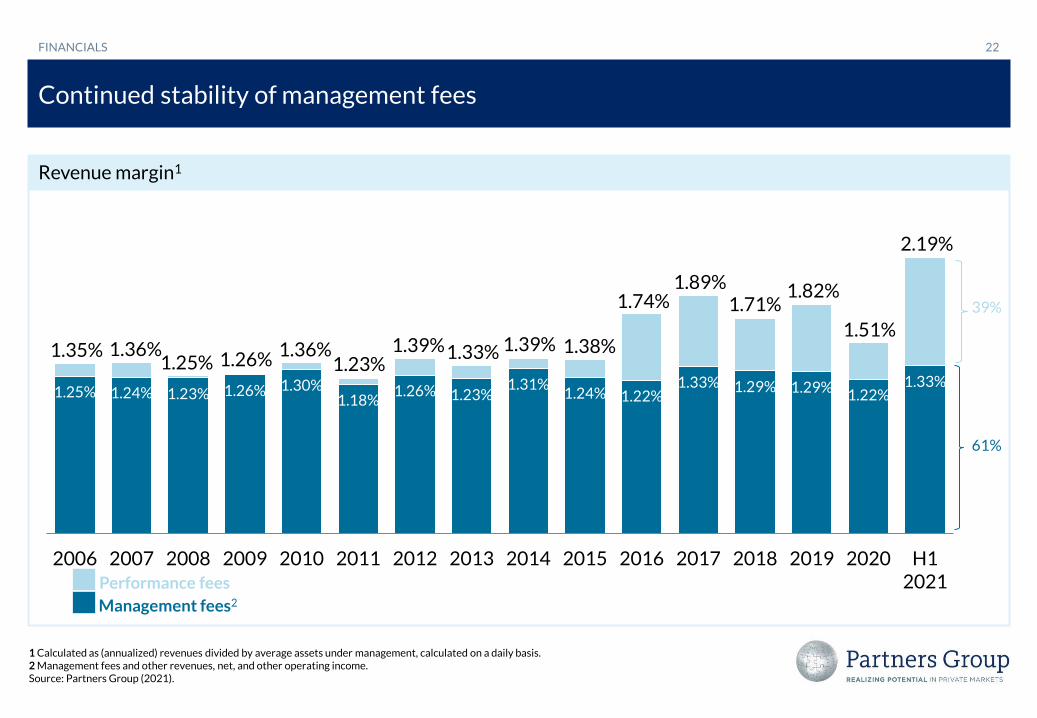
1.25% 1.24% 1.23% 1.26% 1.30%1.18%
1.26% 1.23%1.31%
1.24% 1.22%1.33% 1.29% 1.29%
1.22%1.33%
2006 2007 2008 2009 2010 2011 2012 2013 2014 2015 2016 2017 2018 2019 2020 H12021
Continued stability of management fees
22
Management fees2
Performance fees
1.35% 1.36%1.25% 1.26%
1.36%1.23%
1.39% 1.39%1.33% 1.38%
1 Calculated as (annualized) revenues divided by average assets under management, calculated on a daily basis. 2 Management fees and other revenues, net, and other operating income.Source: Partners Group (2021).
Revenue margin1
1.74%1.89%
39%
61%
1.71%1.82%
1.51%
2.19%
FINANCIALS

Costs grew in line with revenues
23
Note: revenues include management fees and other revenues, net, performance fees, net, and other operating income. Performance-fee-related personnel expenses are calculated on an up to 40% operating cost-income ratio on revenues stemming from performance fees. Source: Partners Group (2021).
Revenues, costs and EBIT development (in CHF million)
H1 2020 H1 2021
Revenues 623 +81% 1’130
Total operating costs, of which -232 +84% -428
Personnel expenses -178 +114% -382Personnel expenses (non-performance fee-related) -156 +38% -216
Personnel expenses (performance fee-related) -22 7.6x -166
Other operating expenses -35 -24% -27
Depreciation & amortization -19 +1% -19
EBIT 390 +80% 702EBIT margin 62.7% -0.6%-points 62.1%
Average FTEs 1'492 0% 1’487
FINANCIALS
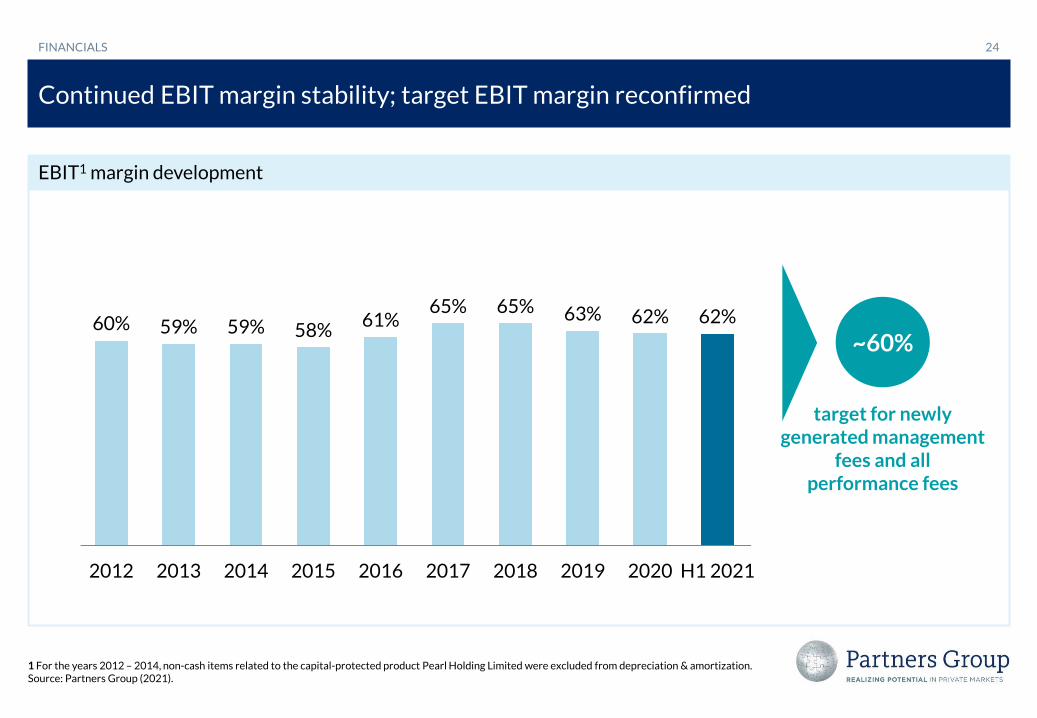
Continued EBIT margin stability; target EBIT margin reconfirmed
24
1.06
EBIT1 margin development
60% 59% 59% 58%61%
65% 65% 63% 62% 62%
0%
10%
20%
30%
40%
50%
60%
70%
80%
2012 2013 2014 2015 2016 2017 2018 2019 2020 H1 2021
target for newly generated management
fees and all performance fees
~60%
1 For the years 2012 – 2014, non-cash items related to the capital-protected product Pearl Holding Limited were excluded from depreciation & amortization.Source: Partners Group (2021).
FINANCIALS

Currency exposure in H1 2021
As a globally active firm, we have a diversified FX exposure
25
Note: all figures are based on estimates and the currency denomination of underlying programs. 1 Includes management fees and other revenues, net, and other operating income. 2 Includes non-performance fee-related expenses, other operating expenses as well as depreciation and amortization.Source: Partners Group (2021).
EUR46%
USD39%
GBP9%
Others6%
AuM ≈Management
fees1 ≠
EUR4%
USD22%
CHF45%
GBP14%
SGD10%
Others5%
Costs2
Management fees and operating costs are affected by currency movements against the CHF,while performance fees and performance fee-related expenses are largely EBIT margin-neutral
FINANCIALS

Strong balance sheet and liquidity
26
1 Revenues include management fees and other revenues, net, performance fees, net, and other operating income. 2 Management fees and other revenues, net, and other operating income. 3 Total operating costs include personnel expenses, other operating costs as well as depreciation and amortization. 4 Cash and cash equivalents (CHF 432 million) and short-term loans (CHF 1'117 million), net of debt (CHF 799 million) as of 30 June 2021. 5 Financial investments (CHF 745 million), investments in associates (CHF 23 million) and net assets/liabilities held for sale (CHF 36 million) as of 30 June 2021. Abbreviations: EPS = earnings per share. Source: Partners Group (2021).
Key financials (in CHF million, except for per share data in CHF)
0.8CHF billion
in own investments5
0.8CHF billion
net liquidity4
56%return on
equity
2.2CHF billion
equity
Balance sheet (as of 30 June 2021)
H1 2020 H1 2021
Revenues1, of which 623 +81% 1'130Management fees2 567 +21% 688
Performance fees 56 7.6x 442
Total operating costs3 -232 +84% -428
EBIT 390 +80% 702
EBIT margin 62.7% 62.1%
Financial result -24 51
Income tax expenses -53 -123
Profit 313 +101% 629
Diluted EPS 11.65 23.50
FINANCIALS

Contacts
27
Zugerstrasse 576341 Baar-ZugSwitzerlandT +41 41 784 60 00
Shareholder relations contact:Philip SauerT +41 41 784 66 60Email: [email protected]
Media relations contact:Jenny BlinchT +44 207 575 25 71Email: [email protected]
ZUG | DENVER | HOUSTON | TORONTO | NEW YORK | SÃO PAULO | LONDON | GUERNSEY | PARIS | LUXEMBOURG | MILAN | MUNICH | DUBAI | MUMBAI | SINGAPORE | MANILA | SHANGHAI | SEOUL | TOKYO | SYDNEY

6 September 2021 16:51
Disclaimer
NEITHER THE INFORMATION IN THIS DOCUMENT NOR ANY RELATED MATERIALS MAY BE TAKEN OR TRANSMITTED INTO THE UNITED STATES OR DISTRIBUTED OR REDISTRIBUTED, DIRECTLY OR INDIRECTLY, IN THE UNITED STATES, AUSTRALIA, CANADA OR JAPAN.
This presentation is strictly confidential to the recipient and has been prepared by Partners Group Holding AG (the "Company") solely for information purposes and use at the presentation to the respective recipient ("Presentation"). All sources, which have not been otherwise credited, have been derived from Partners Group. The information contained herein consists of slides solely for use at the Presentation. By attending such Presentation, you agree to be bound by the following terms.
Figures provided have been rounded for presentation purposes and in certain instances rounding anomalies may arise.
This Presentation may not be reproduced, retransmitted or further distributed to the press or any other person or published, in whole or in part, for any purpose. Failure to comply with this restriction may constitute a violation of applicable securities laws. This Presentation does not constitute or form part of and should not be construed as, an offer to sell or issue or the solicitation of an offer to buy or acquire securities of the Company in any jurisdiction or an inducement to enter into investment activity. No part of this Presentation, nor the fact of its distribution, should form the basis of, or be relied on in connection with, any contract or commitment or investment decision whatsoever. This Presentation does not constitute a prospectus or a similar communication within the meaning of articles 35 et seqq. and 69 of the Swiss Federal Act on Financial Services ("FinSA") or a listing prospectus within the meaning of the listing rules of the SIX Swiss Exchange.
Neither the Presentation nor any copy of it may be taken or transmitted into the United States of America, its territories or possessions, or distributed, directly or indirectly, in the United States of America, its territories or possessions. Any failure to comply with this restriction may constitute a violation of U.S. securities laws. The Presentation is not an offer of securities for sale in the United States. The Company's securities may not be offered or sold in the United States except pursuant to an exemption from, or transaction not subject to, the registration requirements of the Securities Act.
Additional restrictions may apply according to applicable securities laws of other jurisdictions, including, without limitation, the European Union, Canada, Australia and Japan.
The information contained in this Presentation has not been independently verified. The Company is not under any obligation to update or keep current the information contained herein. Accordingly, no representation or warranty or undertaking, express or implied, is given by or on behalf of the Company or any of their respective members, directors, officers, agents or employees or any other person as to, and no reliance should be placed on, the accuracy, completeness or fairness of the information or opinions contained herein. Nothing herein shall be relied upon as a promise or representation as to past or future performance. Neither the Company nor any of their respective members, directors, officers or employees nor any other person accepts any liability whatsoever for any loss howsoever arising from any use of this Presentation or its contents or otherwise arising in connection with the Presentation.
This Presentation includes forward-looking statements, beliefs or opinions, including statements with respect to plans, objectives, goals, strategies, estimated market sizes and opportunities which are based on current beliefs, expectations and projections about future events. The words "believe," "expect," "anticipate," "intends," "estimate," "forecast," "project," "will," "may," "should" and similar expressions identify forward-looking statements. The forward-looking statements in this Presentation are based upon various assumptions, many of which are based, in turn, upon further assumptions, including, without limitation, management’s examination of data available from third parties. Although the Company believes that these assumptions were reasonable when made, these assumptions are inherently subject to significant uncertainties and contingencies which are difficult or impossible to predict and are beyond its control, and the Company may not achieve or accomplish these expectations, beliefs or projections. Neither the Company nor any of its members, directors, officers, agents, employees or advisers intend or have any duty or obligation to supplement, amend, update or revise any of the forward-looking statements contained in this Presentation. The information and opinions contained herein are provided as at the date of the Presentation and are subject to change without notice.
IMPORTANT NOTICE 28