2017 PDAC Convention
37
THE GOLD DEVELOPMENT COMPANY for the 21 st Century TSX, NYSE MKT: NG | novagold.com | March 2017
-
Upload
novagold -
Category
Investor Relations
-
view
410 -
download
2
Transcript of 2017 PDAC Convention

THE GOLD DEVELOPMENT COMPANY for the 21st Century
TSX, NYSE MKT: NG | novagold.com | March 2017
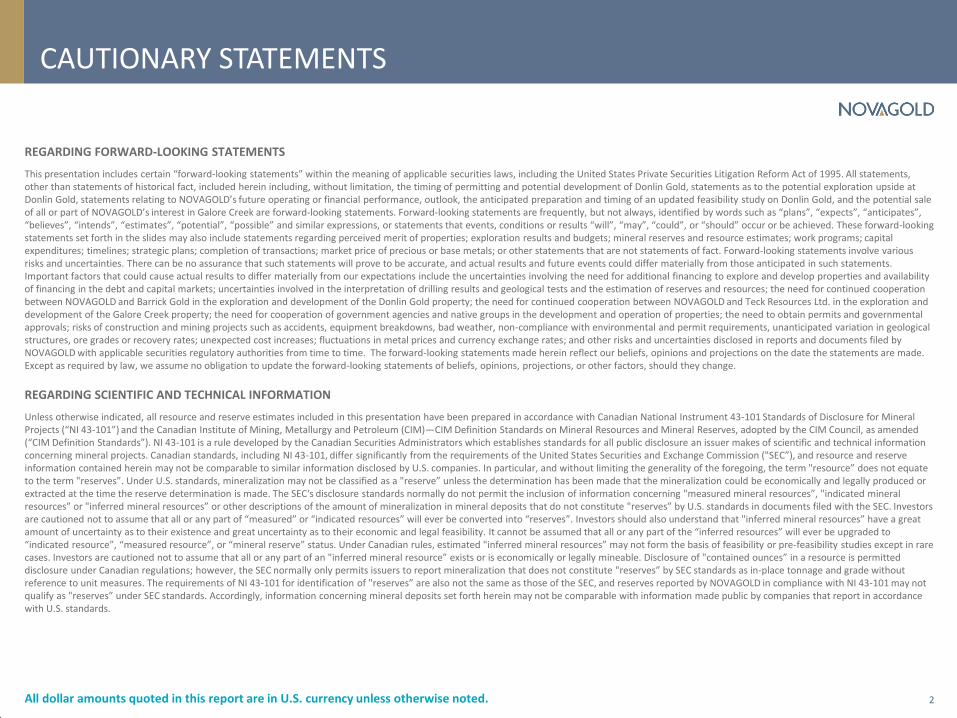
CAUTIONARY STATEMENTS
2 All dollar amounts quoted in this report are in U.S. currency unless otherwise noted.
REGARDING FORWARD-LOOKING STATEMENTS
This presentation includes certain “forward-looking statements” within the meaning of applicable securities laws, including the United States Private Securities Litigation Reform Act of 1995. All statements, other than statements of historical fact, included herein including, without limitation, the timing of permitting and potential development of Donlin Gold, statements as to the potential exploration upside at Donlin Gold, statements relating to NOVAGOLD’s future operating or financial performance, outlook, the anticipated preparation and timing of an updated feasibility study on Donlin Gold, and the potential sale of all or part of NOVAGOLD’s interest in Galore Creek are forward-looking statements. Forward-looking statements are frequently, but not always, identified by words such as “plans”, “expects”, “anticipates”, “believes”, “intends”, “estimates”, “potential”, “possible” and similar expressions, or statements that events, conditions or results “will”, “may”, “could”, or “should” occur or be achieved. These forward-looking statements set forth in the slides may also include statements regarding perceived merit of properties; exploration results and budgets; mineral reserves and resource estimates; work programs; capital expenditures; timelines; strategic plans; completion of transactions; market price of precious or base metals; or other statements that are not statements of fact. Forward-looking statements involve various risks and uncertainties. There can be no assurance that such statements will prove to be accurate, and actual results and future events could differ materially from those anticipated in such statements. Important factors that could cause actual results to differ materially from our expectations include the uncertainties involving the need for additional financing to explore and develop properties and availability of financing in the debt and capital markets; uncertainties involved in the interpretation of drilling results and geological tests and the estimation of reserves and resources; the need for continued cooperation between NOVAGOLD and Barrick Gold in the exploration and development of the Donlin Gold property; the need for continued cooperation between NOVAGOLD and Teck Resources Ltd. in the exploration and development of the Galore Creek property; the need for cooperation of government agencies and native groups in the development and operation of properties; the need to obtain permits and governmental approvals; risks of construction and mining projects such as accidents, equipment breakdowns, bad weather, non-compliance with environmental and permit requirements, unanticipated variation in geological structures, ore grades or recovery rates; unexpected cost increases; fluctuations in metal prices and currency exchange rates; and other risks and uncertainties disclosed in reports and documents filed by NOVAGOLD with applicable securities regulatory authorities from time to time. The forward-looking statements made herein reflect our beliefs, opinions and projections on the date the statements are made. Except as required by law, we assume no obligation to update the forward-looking statements of beliefs, opinions, projections, or other factors, should they change.
REGARDING SCIENTIFIC AND TECHNICAL INFORMATION
Unless otherwise indicated, all resource and reserve estimates included in this presentation have been prepared in accordance with Canadian National Instrument 43-101 Standards of Disclosure for Mineral Projects (“NI 43-101”) and the Canadian Institute of Mining, Metallurgy and Petroleum (CIM)—CIM Definition Standards on Mineral Resources and Mineral Reserves, adopted by the CIM Council, as amended (“CIM Definition Standards”). NI 43-101 is a rule developed by the Canadian Securities Administrators which establishes standards for all public disclosure an issuer makes of scientific and technical information concerning mineral projects. Canadian standards, including NI 43-101, differ significantly from the requirements of the United States Securities and Exchange Commission ("SEC”), and resource and reserve information contained herein may not be comparable to similar information disclosed by U.S. companies. In particular, and without limiting the generality of the foregoing, the term "resource” does not equate to the term "reserves”. Under U.S. standards, mineralization may not be classified as a "reserve” unless the determination has been made that the mineralization could be economically and legally produced or extracted at the time the reserve determination is made. The SEC's disclosure standards normally do not permit the inclusion of information concerning "measured mineral resources”, "indicated mineral resources” or "inferred mineral resources” or other descriptions of the amount of mineralization in mineral deposits that do not constitute "reserves” by U.S. standards in documents filed with the SEC. Investors are cautioned not to assume that all or any part of “measured” or “indicated resources” will ever be converted into “reserves”. Investors should also understand that "inferred mineral resources” have a great amount of uncertainty as to their existence and great uncertainty as to their economic and legal feasibility. It cannot be assumed that all or any part of the “inferred resources” will ever be upgraded to “indicated resource”, “measured resource”, or “mineral reserve” status. Under Canadian rules, estimated "inferred mineral resources” may not form the basis of feasibility or pre-feasibility studies except in rare cases. Investors are cautioned not to assume that all or any part of an "inferred mineral resource” exists or is economically or legally mineable. Disclosure of "contained ounces” in a resource is permitted disclosure under Canadian regulations; however, the SEC normally only permits issuers to report mineralization that does not constitute "reserves” by SEC standards as in-place tonnage and grade without reference to unit measures. The requirements of NI 43-101 for identification of "reserves” are also not the same as those of the SEC, and reserves reported by NOVAGOLD in compliance with NI 43-101 may not qualify as "reserves” under SEC standards. Accordingly, information concerning mineral deposits set forth herein may not be comparable with information made public by companies that report in accordance with U.S. standards.
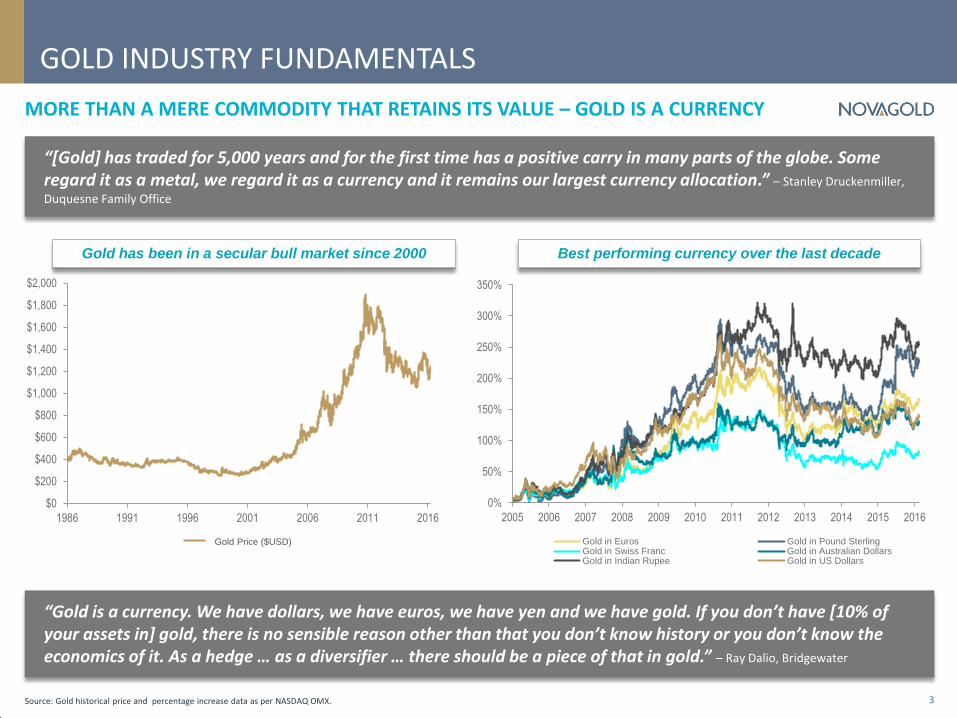
GOLD INDUSTRY FUNDAMENTALS
MORE THAN A MERE COMMODITY THAT RETAINS ITS VALUE – GOLD IS A CURRENCY
3 Source: Gold historical price and percentage increase data as per NASDAQ OMX.
Gold Price ($USD)
Gold has been in a secular bull market since 2000 Best performing currency over the last decade
$0
$200
$400
$600
$800
$1,000
$1,200
$1,400
$1,600
$1,800
$2,000
1986 1991 1996 2001 2006 2011 2016
0%
50%
100%
150%
200%
250%
300%
350%
2005 2006 2007 2008 2009 2010 2011 2012 2013 2014 2015 2016
Gold in Euros Gold in Pound SterlingGold in Swiss Franc Gold in Australian DollarsGold in Indian Rupee Gold in US Dollars
“[Gold] has traded for 5,000 years and for the first time has a positive carry in many parts of the globe. Some regard it as a metal, we regard it as a currency and it remains our largest currency allocation.” – Stanley Druckenmiller,
Duquesne Family Office
“Gold is a currency. We have dollars, we have euros, we have yen and we have gold. If you don’t have [10% of your assets in] gold, there is no sensible reason other than that you don’t know history or you don’t know the economics of it. As a hedge … as a diversifier … there should be a piece of that in gold.” – Ray Dalio, Bridgewater
$1,000
$1,100
$1,200
$1,300
$1,400
79
84
89
94
99
104
Jan-
14
Mar
-14
May
-14
Aug
-14
Oct
-14
Jan-
15
Mar
-15
Jun-
15
Aug
-15
Nov
-15
Jan-
16
Apr
-16
Jun-
16
Sep
-16
Nov
-16
Jan-
17
A SAFE HAVEN THAT HAS WITHSTOOD THE TEST OF TIME
GOLD INDUSTRY FUNDAMENTALS
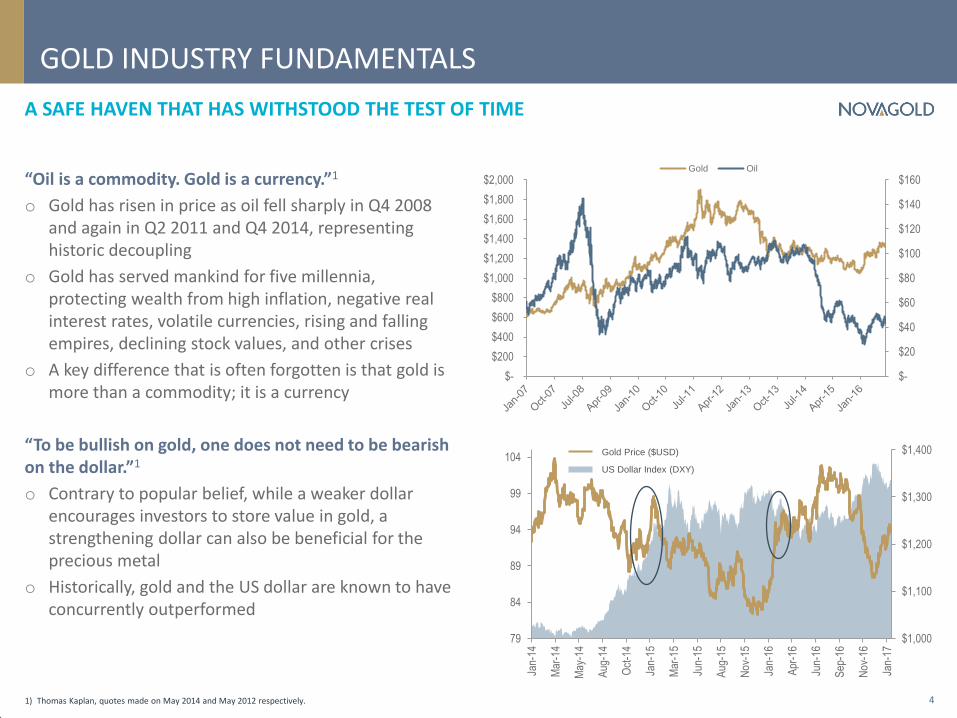
“Oil is a commodity. Gold is a currency.”1
o Gold has risen in price as oil fell sharply in Q4 2008 and again in Q2 2011 and Q4 2014, representing historic decoupling
o Gold has served mankind for five millennia, protecting wealth from high inflation, negative real interest rates, volatile currencies, rising and falling empires, declining stock values, and other crises
o A key difference that is often forgotten is that gold is more than a commodity; it is a currency
“To be bullish on gold, one does not need to be bearish on the dollar.”1
o Contrary to popular belief, while a weaker dollar encourages investors to store value in gold, a strengthening dollar can also be beneficial for the precious metal
o Historically, gold and the US dollar are known to have concurrently outperformed
4
Gold Price ($USD)
US Dollar Index (DXY)
1) Thomas Kaplan, quotes made on May 2014 and May 2012 respectively.
$-
$20
$40
$60
$80
$100
$120
$140
$160
$-
$200
$400
$600
$800
$1,000
$1,200
$1,400
$1,600
$1,800
$2,000Gold Oil

In Tonnes
60
65
70
75
80
85
90
95
100
Go
ld p
rod
uct
ion
(Mo
z)
Annual World Gold Production
SUPPLY – GLOBAL GOLD PRODUCTION PEAK
GOLD INDUSTRY FUNDAMENTALS
5
o Global gold output growth has been contracting
o Current production rates are not sustainable
o Steep global production cliff is looming
1) MINING.com article published August 8, 2016 by Frank Holmes titled “The last known gold deposit”. 2) Global estimated production based on major gold producing properties are derived by S&P Global Market Intelligence analysts when a company does not report actual or forecast property production figures.
New mines are making small
contributions to global production1
Source: SNL Metals & Mining, an offering of S&P Global Market Intelligence2
“It’s not a matter of if or even when the production cliff will happen... It’s really a matter of how companies will respond.” – Steve Parsons, National Bank Financial
$0
$2,000
$4,000
$6,000
$8,000
$10,000
$12,000
2007 2008 2009 2010 2011 2012 2013 2014 2015 2016
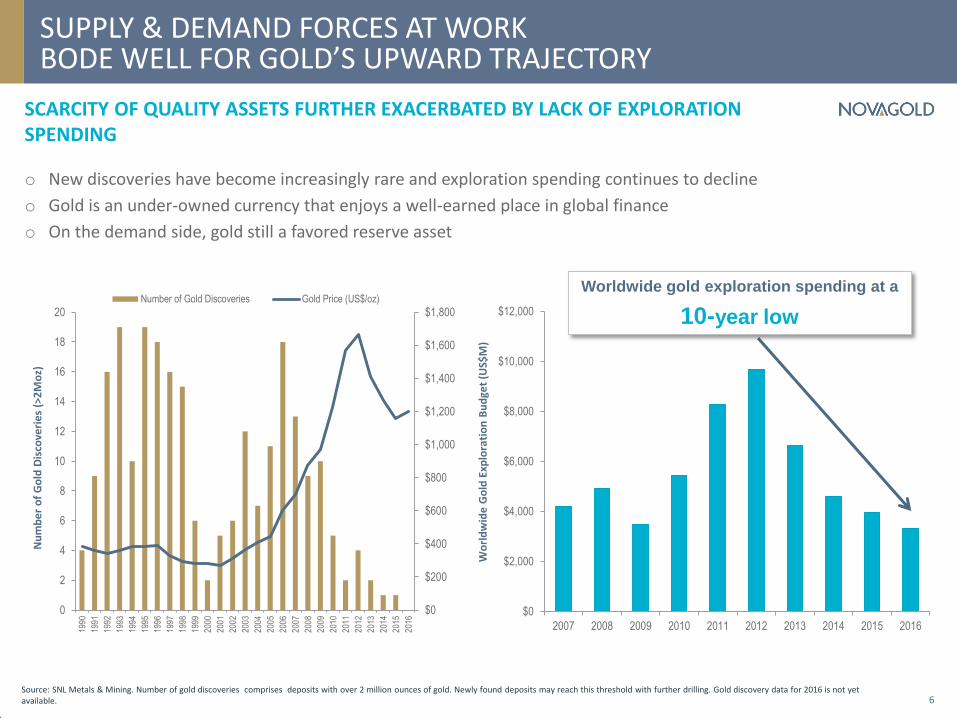
SCARCITY OF QUALITY ASSETS FURTHER EXACERBATED BY LACK OF EXPLORATION SPENDING
SUPPLY & DEMAND FORCES AT WORK BODE WELL FOR GOLD’S UPWARD TRAJECTORY
6
o New discoveries have become increasingly rare and exploration spending continues to decline
o Gold is an under-owned currency that enjoys a well-earned place in global finance
o On the demand side, gold still a favored reserve asset
$0
$200
$400
$600
$800
$1,000
$1,200
$1,400
$1,600
$1,800
0
2
4
6
8
10
12
14
16
18
20
1990
1991
1992
1993
1994
1995
1996
1997
1998
1999
2000
2001
2002
2003
2004
2005
2006
2007
2008
2009
2010
2011
2012
2013
2014
2015
2016
Number of Gold Discoveries Gold Price (US$/oz)
Nu
mb
er
of
Go
ld D
isco
veri
es
(>2
Mo
z)
Source: SNL Metals & Mining. Number of gold discoveries comprises deposits with over 2 million ounces of gold. Newly found deposits may reach this threshold with further drilling. Gold discovery data for 2016 is not yet available.
Wo
rld
wid
e G
old
Exp
lora
tio
n B
ud
get
(US$
M)
Worldwide gold exploration spending at a
10-year low

A DEVELOPMENT-STAGE COMPANY WITH TWO PROJECTS OF EXCEPTIONAL SCALE, QUALITY, AND JURISDICTIONAL SAFETY
WHAT MAKES NOVAGOLD UNIQUE?
DONLIN GOLD
50/50 with Barrick
Poised to be one of the largest gold producers in the world
Location: Southwest Alaska
GALORE CREEK
50/50 with Teck
Potential to be one of the largest and lowest cost copper mines in Canada
Location: Northern British Columbia
7
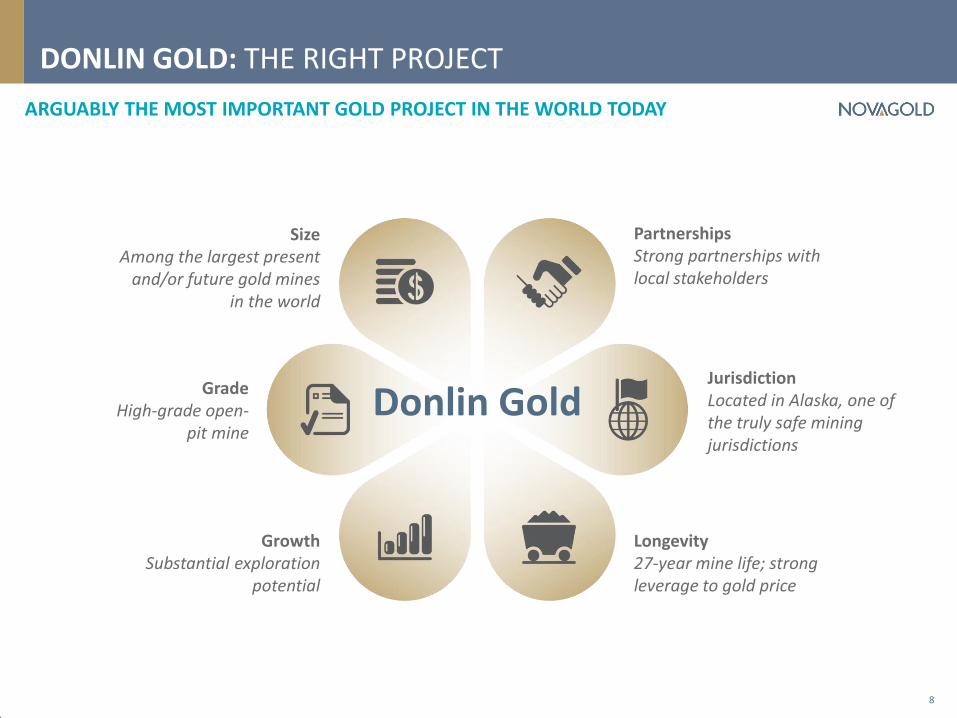
DONLIN GOLD: THE RIGHT PROJECT
ARGUABLY THE MOST IMPORTANT GOLD PROJECT IN THE WORLD TODAY
8
Size Among the largest present
and/or future gold mines in the world
Partnerships Strong partnerships with local stakeholders
Longevity 27-year mine life; strong leverage to gold price
Growth Substantial exploration
potential
Grade High-grade open-
pit mine
Jurisdiction Located in Alaska, one of the truly safe mining jurisdictions
Donlin Gold
39.0
15.7
9.6 9.5
6.7 6.5 6.4 5.3 5.2 4.5 4.5 4.0 4.0
3.0
0.0
5.0
10.0
15.0
20.0
25.0
30.0
35.0
40.0
45.0
Donlin Gold Livengood Brucejack Blackwater Meliadine Hardrock Rainy River Back River Volta Grande Hope Bay Buritica Haile Dublin Gulch Coffee
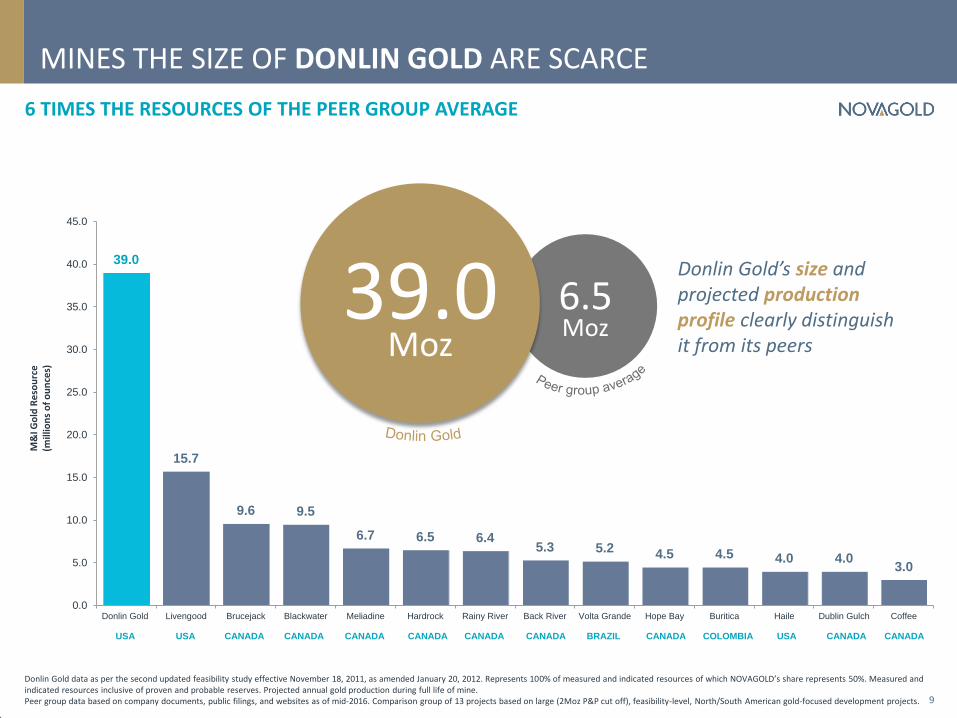
MINES THE SIZE OF DONLIN GOLD ARE SCARCE
6 TIMES THE RESOURCES OF THE PEER GROUP AVERAGE
9
Donlin Gold’s size and projected production profile clearly distinguish it from its peers
Donlin Gold data as per the second updated feasibility study effective November 18, 2011, as amended January 20, 2012. Represents 100% of measured and indicated resources of which NOVAGOLD’s share represents 50%. Measured and indicated resources inclusive of proven and probable reserves. Projected annual gold production during full life of mine. Peer group data based on company documents, public filings, and websites as of mid-2016. Comparison group of 13 projects based on large (2Moz P&P cut off), feasibility-level, North/South American gold-focused development projects.
M&
I Go
ld R
eso
urc
e
(mill
ion
s o
f o
un
ces)
USA USA CANADA CANADA COLOMBIA CANADA CANADA CANADA BRAZIL CANADA CANADA USA CANADA CANADA
6.5 Moz
39.0 Moz
1.102
0.58
0.41 0.40 0.37
0.28 0.25 0.24 0.21 0.21 0.20
0.18 0.17 0.13
1.501
0.00
0.20
0.40
0.60
0.80
1.00
1.20
1.40
1.60
Donlin Gold Livengood Blackwater Brucejack Meliadine Hardrock Buritica Rainy River Back River Volta Grande Coffee Hope Bay Dublin Gulch Haile
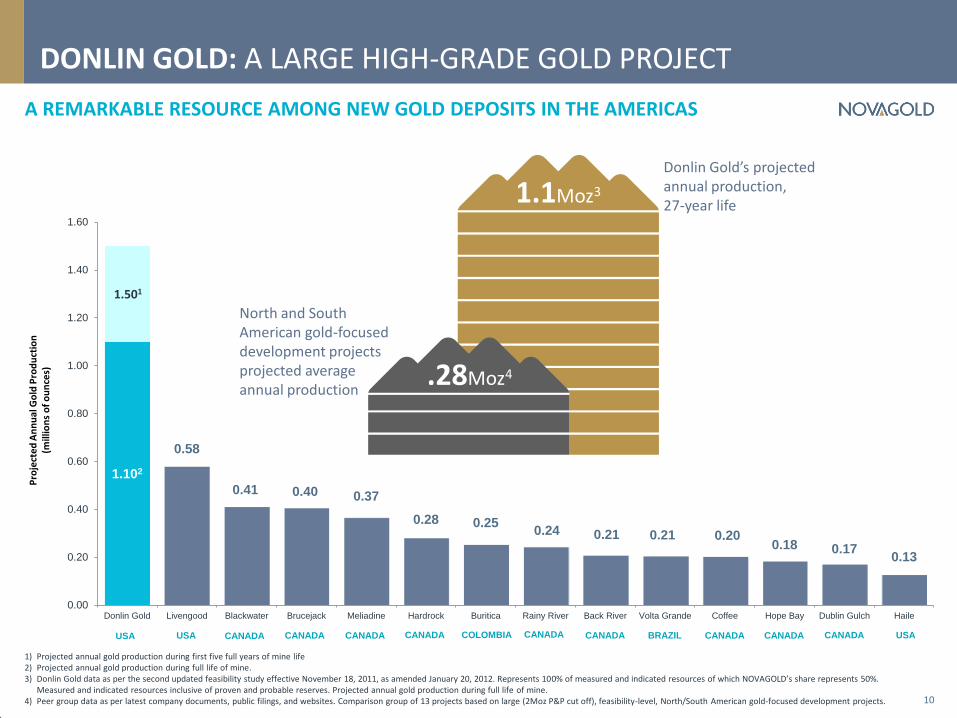
DONLIN GOLD: A LARGE HIGH-GRADE GOLD PROJECT
A REMARKABLE RESOURCE AMONG NEW GOLD DEPOSITS IN THE AMERICAS
10
Pro
ject
ed
An
nu
al G
old
Pro
du
ctio
n
(mill
ion
s o
f o
un
ces)
1) Projected annual gold production during first five full years of mine life 2) Projected annual gold production during full life of mine. 3) Donlin Gold data as per the second updated feasibility study effective November 18, 2011, as amended January 20, 2012. Represents 100% of measured and indicated resources of which NOVAGOLD’s share represents 50%.
Measured and indicated resources inclusive of proven and probable reserves. Projected annual gold production during full life of mine. 4) Peer group data as per latest company documents, public filings, and websites. Comparison group of 13 projects based on large (2Moz P&P cut off), feasibility-level, North/South American gold-focused development projects.
USA USA CANADA CANADA COLOMBIA CANADA CANADA CANADA BRAZIL CANADA CANADA USA CANADA CANADA
1.1Moz3
.28Moz4
Donlin Gold’s projected annual production, 27-year life
North and South American gold-focused development projects projected average annual production
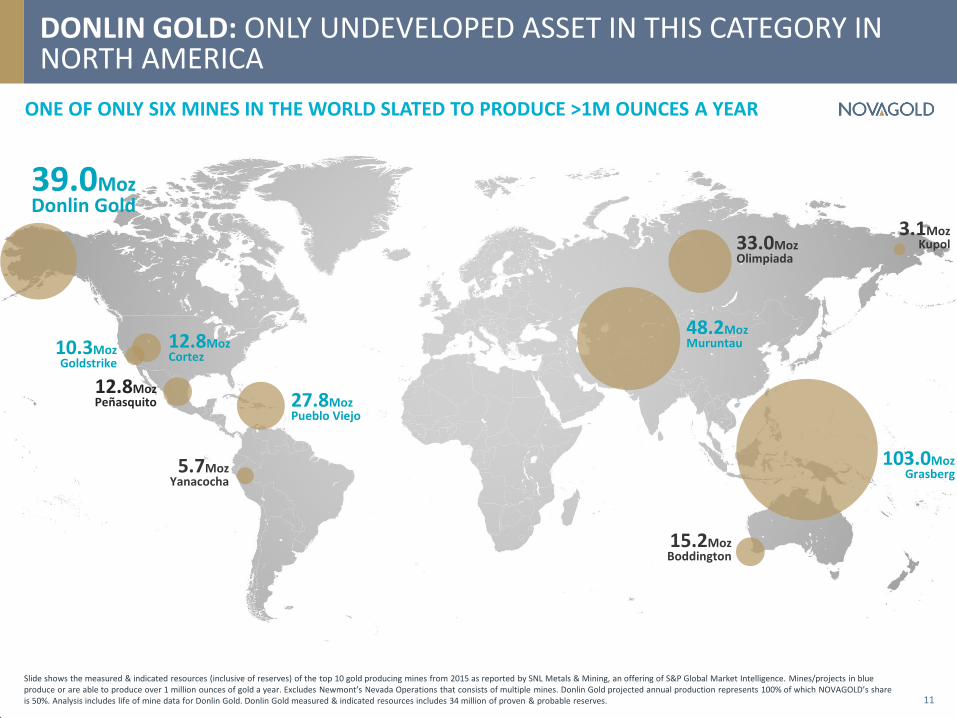
DONLIN GOLD: ONLY UNDEVELOPED ASSET IN THIS CATEGORY IN NORTH AMERICA
ONE OF ONLY SIX MINES IN THE WORLD SLATED TO PRODUCE >1M OUNCES A YEAR
11
Slide shows the measured & indicated resources (inclusive of reserves) of the top 10 gold producing mines from 2015 as reported by SNL Metals & Mining, an offering of S&P Global Market Intelligence. Mines/projects in blue produce or are able to produce over 1 million ounces of gold a year. Excludes Newmont’s Nevada Operations that consists of multiple mines. Donlin Gold projected annual production represents 100% of which NOVAGOLD’s share is 50%. Analysis includes life of mine data for Donlin Gold. Donlin Gold measured & indicated resources includes 34 million of proven & probable reserves.
39.0Moz Donlin Gold
12.8Moz Peñasquito 27.8Moz
Pueblo Viejo
5.7Moz Yanacocha
48.2Moz Muruntau
103.0Moz Grasberg
15.2Moz Boddington
12.8Moz Cortez
10.3Moz Goldstrike
33.0Moz Olimpiada
3.1Moz Kupol

See “Cautionary Note Concerning Reserve & Resource Estimates” and “Reserve & Resource Base” with footnotes in the appendix. 1) 2015 average grade of open-pit and underground deposits with gold as primary commodity and over 1 Moz in measured and indicated resources, sourced from SNL Metals & Mining. 2) Donlin Gold data as per the second updated feasibility study effective November 18, 2011, as amended January 20, 2012. Represents 100% of measured and indicated resources of which NOVAGOLD’s share is 50%. Measured and
indicated resources are inclusive of proven and probable reserves.
World Average Grade1
1.12g/t
Donlin Gold Average Grade2
2.24g/t
DONLIN GOLD: DOUBLE THE GRADE OF THE AVERAGE GOLD DEPOSIT IN THE WORLD
AMONG THE WORLD’S MOST SIGNIFICANT AND HIGHEST-GRADE GOLD DEPOSITS
12
Industry average grades are declining and sources for emerging production are increasingly scarce
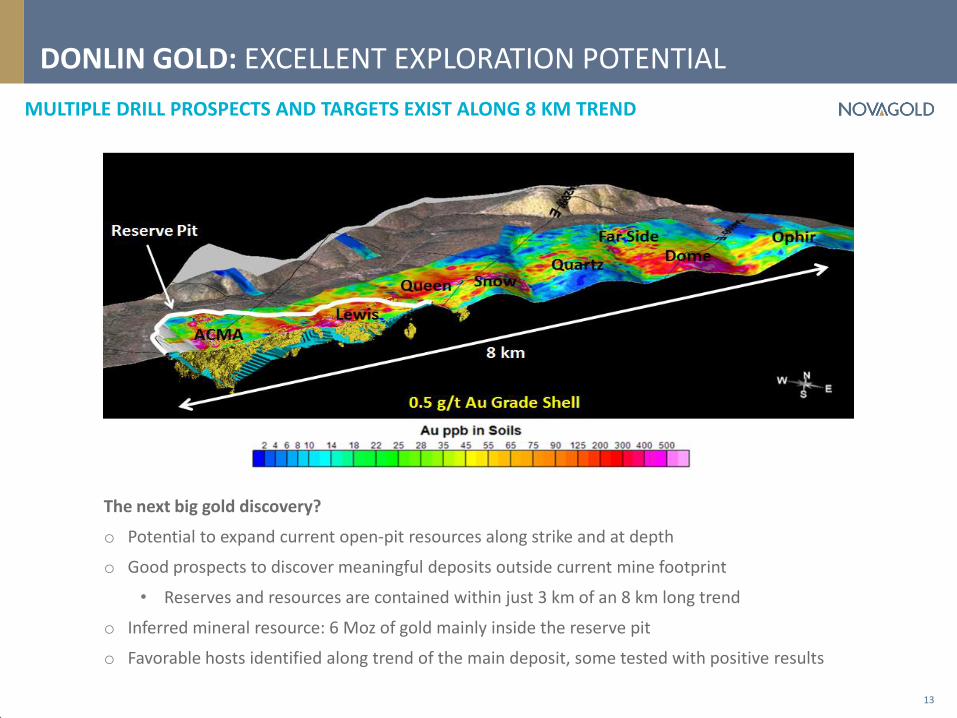
MULTIPLE DRILL PROSPECTS AND TARGETS EXIST ALONG 8 KM TREND
DONLIN GOLD: EXCELLENT EXPLORATION POTENTIAL
13
The next big gold discovery?
o Potential to expand current open-pit resources along strike and at depth
o Good prospects to discover meaningful deposits outside current mine footprint
• Reserves and resources are contained within just 3 km of an 8 km long trend
o Inferred mineral resource: 6 Moz of gold mainly inside the reserve pit
o Favorable hosts identified along trend of the main deposit, some tested with positive results
$6.2
$8.2
$11.6
$14.6
$19.2
$27.0
0.0
5.0
10.0
15.0
20.0
25.0
30.0
$1,200 $1,300 $1,500 $1,700 $2,000 $2,500
NPV at 5% NPV at 0%
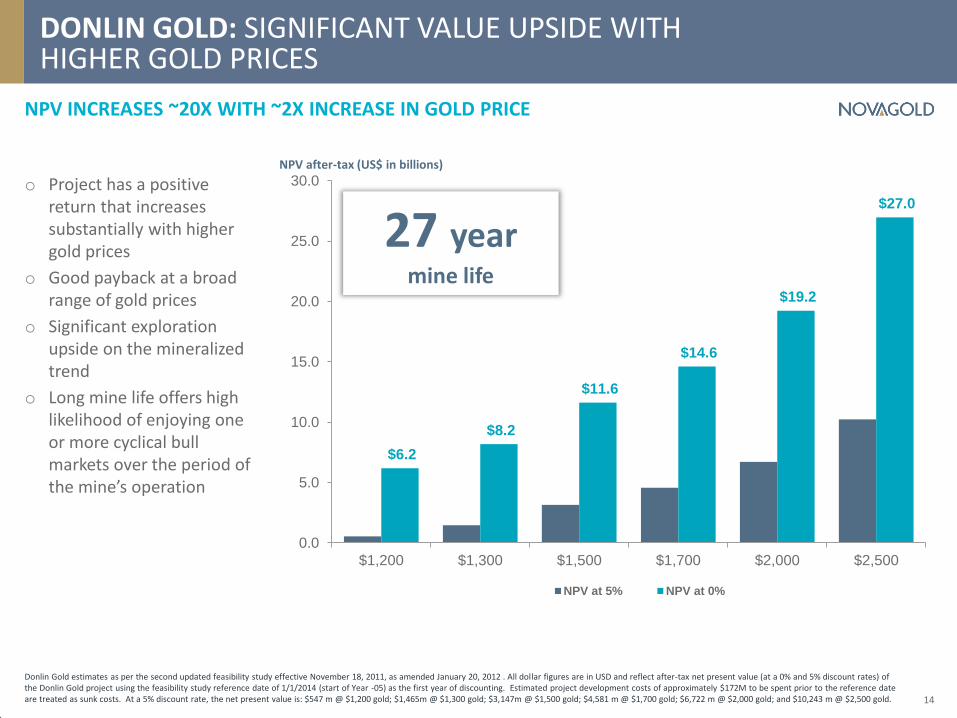
NPV INCREASES ~20X WITH ~2X INCREASE IN GOLD PRICE
DONLIN GOLD: SIGNIFICANT VALUE UPSIDE WITH HIGHER GOLD PRICES
o Project has a positive return that increases substantially with higher gold prices
o Good payback at a broad range of gold prices
o Significant exploration upside on the mineralized trend
o Long mine life offers high likelihood of enjoying one or more cyclical bull markets over the period of the mine’s operation
14
Donlin Gold estimates as per the second updated feasibility study effective November 18, 2011, as amended January 20, 2012 . All dollar figures are in USD and reflect after-tax net present value (at a 0% and 5% discount rates) of the Donlin Gold project using the feasibility study reference date of 1/1/2014 (start of Year -05) as the first year of discounting. Estimated project development costs of approximately $172M to be spent prior to the reference date are treated as sunk costs. At a 5% discount rate, the net present value is: $547 m @ $1,200 gold; $1,465m @ $1,300 gold; $3,147m @ $1,500 gold; $4,581 m @ $1,700 gold; $6,722 m @ $2,000 gold; and $10,243 m @ $2,500 gold.
27 year mine life
NPV after-tax (US$ in billions)
LOCATION, LOCATION, LOCATION
DONLIN GOLD: LEVERAGE IN A PLACE WHERE YOU CAN KEEP THE REWARDS
15
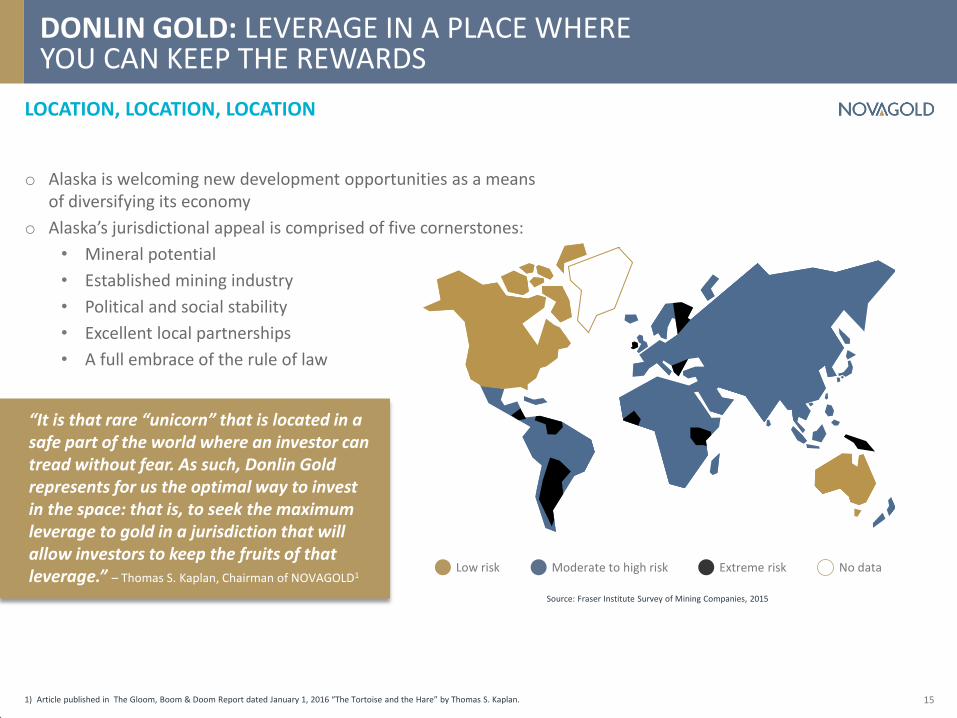
o Alaska is welcoming new development opportunities as a means of diversifying its economy
o Alaska’s jurisdictional appeal is comprised of five cornerstones:
• Mineral potential
• Established mining industry
• Political and social stability
• Excellent local partnerships
• A full embrace of the rule of law
1) Article published in The Gloom, Boom & Doom Report dated January 1, 2016 “The Tortoise and the Hare” by Thomas S. Kaplan.
“It is that rare “unicorn” that is located in a safe part of the world where an investor can tread without fear. As such, Donlin Gold represents for us the optimal way to invest in the space: that is, to seek the maximum leverage to gold in a jurisdiction that will allow investors to keep the fruits of that leverage.” – Thomas S. Kaplan, Chairman of NOVAGOLD1
Source: Fraser Institute Survey of Mining Companies, 2015
Low risk Moderate to high risk Extreme risk No data
“The reason for Andy Cole’s, the newly Barrick-appointed general manager, and our enthusiasm about Donlin Gold is because we all realize just what a special project it is... All of those attributes located in a place that respects the rule of law, make Donlin Gold not only “special” but “unique,” particularly in light of our bullish view on gold.” – Thomas S. Kaplan, Chairman of NOVAGOLD2
BARRICK AND NOVAGOLD ARE WORKING TOGETHER TO OPTIMIZE AND ENHANCE THE PROJECT
DONLIN GOLD: PARTNERS SHARED MINDSET TO ENHANCE VALUE AND BUILD OPTIONALITY
16
2016 ACHIEVEMENTS:
o Updating geologic interpretation in resource model
o Assessed development optimization scenarios
o Appointed new General Manager
2017 PRIORITIES:
o Advance Donlin Gold through permitting toward a future construction decision
o Optimization studies to further enhance project value and minimize initial capital costs: • Assessing alternative project development scenarios including more selective mining methods • Evaluating innovative technologies, logistics & automation • Potential third-party participation in infrastructure development
o Exploration drilling to confirm further potential
1) NOVAGOLD 2015 Annual Report. 2) NOVAGOLD 2016 Annual Report.
“The Donlin Gold project has the potential to become a world class asset for Barrick and for our partner NOVAGOLD. We would like nothing more than to see this potential realized... The goal is to ensure the project can meet our investment criteria at prevailing gold prices when permitting at Donlin Gold is complete.” – Kelvin Dushnisky, President of Barrick Gold1
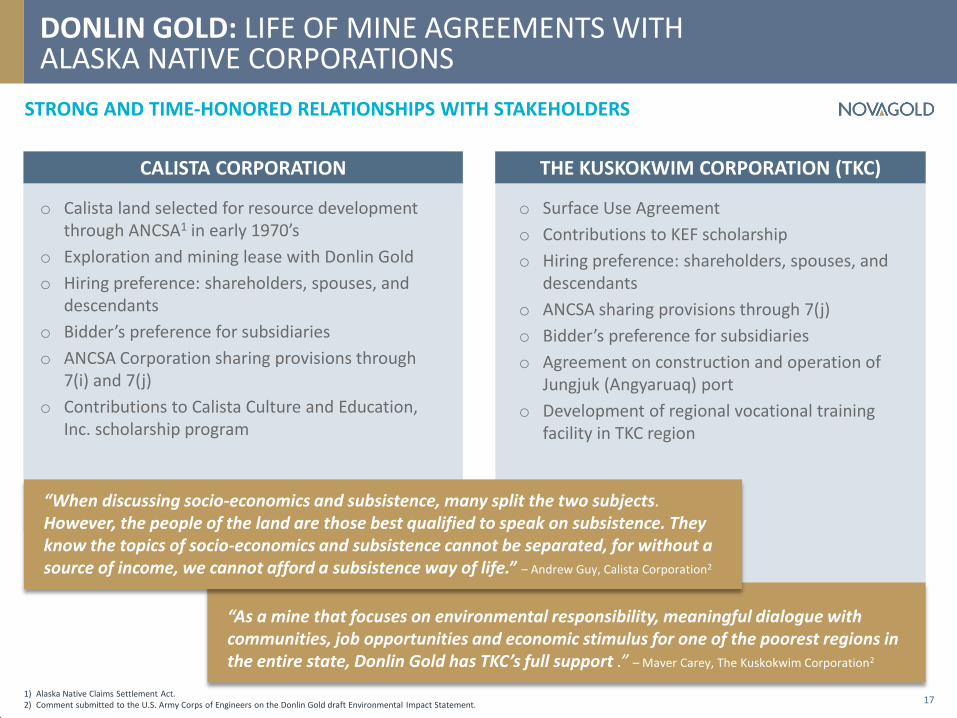
o Calista land selected for resource development through ANCSA1 in early 1970’s
o Exploration and mining lease with Donlin Gold
o Hiring preference: shareholders, spouses, and descendants
o Bidder’s preference for subsidiaries
o ANCSA Corporation sharing provisions through 7(i) and 7(j)
o Contributions to Calista Culture and Education, Inc. scholarship program
DONLIN GOLD: LIFE OF MINE AGREEMENTS WITH ALASKA NATIVE CORPORATIONS
o Surface Use Agreement
o Contributions to KEF scholarship
o Hiring preference: shareholders, spouses, and descendants
o ANCSA sharing provisions through 7(j)
o Bidder’s preference for subsidiaries
o Agreement on construction and operation of Jungjuk (Angyaruaq) port
o Development of regional vocational training facility in TKC region
STRONG AND TIME-HONORED RELATIONSHIPS WITH STAKEHOLDERS
17 1) Alaska Native Claims Settlement Act. 2) Comment submitted to the U.S. Army Corps of Engineers on the Donlin Gold draft Environmental Impact Statement.
CALISTA CORPORATION THE KUSKOKWIM CORPORATION (TKC)
“As a mine that focuses on environmental responsibility, meaningful dialogue with communities, job opportunities and economic stimulus for one of the poorest regions in the entire state, Donlin Gold has TKC’s full support .” – Maver Carey, The Kuskokwim Corporation2
“When discussing socio-economics and subsistence, many split the two subjects. However, the people of the land are those best qualified to speak on subsistence. They know the topics of socio-economics and subsistence cannot be separated, for without a source of income, we cannot afford a subsistence way of life.” – Andrew Guy, Calista Corporation2
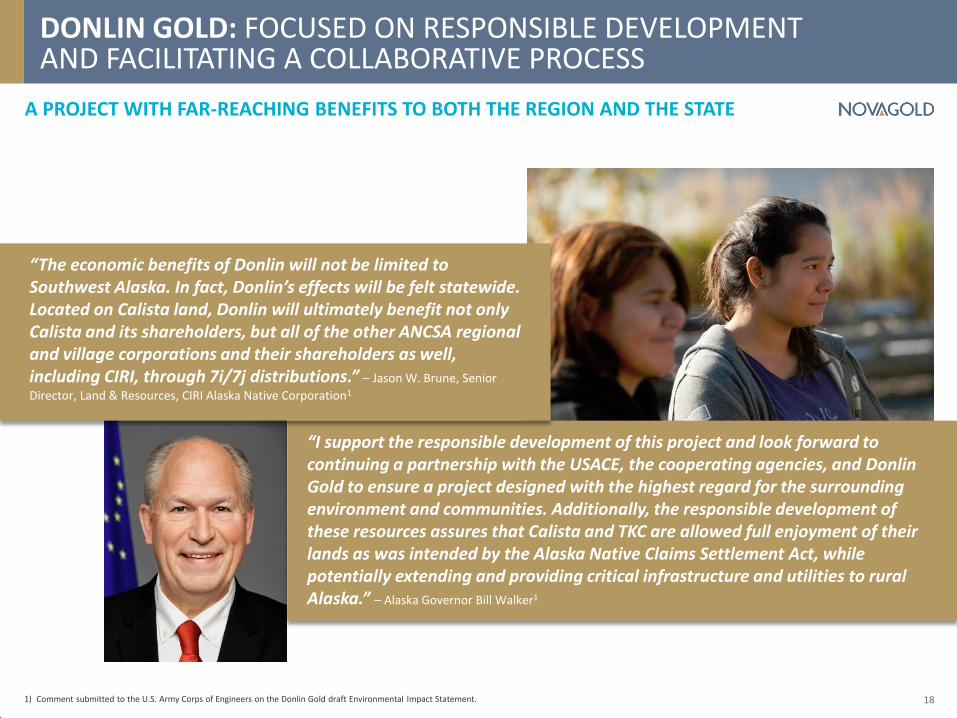
DONLIN GOLD: FOCUSED ON RESPONSIBLE DEVELOPMENT AND FACILITATING A COLLABORATIVE PROCESS
A PROJECT WITH FAR-REACHING BENEFITS TO BOTH THE REGION AND THE STATE
18 1) Comment submitted to the U.S. Army Corps of Engineers on the Donlin Gold draft Environmental Impact Statement.
“I support the responsible development of this project and look forward to continuing a partnership with the USACE, the cooperating agencies, and Donlin Gold to ensure a project designed with the highest regard for the surrounding environment and communities. Additionally, the responsible development of these resources assures that Calista and TKC are allowed full enjoyment of their lands as was intended by the Alaska Native Claims Settlement Act, while potentially extending and providing critical infrastructure and utilities to rural Alaska.” – Alaska Governor Bill Walker1
“The economic benefits of Donlin will not be limited to Southwest Alaska. In fact, Donlin’s effects will be felt statewide. Located on Calista land, Donlin will ultimately benefit not only Calista and its shareholders, but all of the other ANCSA regional and village corporations and their shareholders as well, including CIRI, through 7i/7j distributions.” – Jason W. Brune, Senior
Director, Land & Resources, CIRI Alaska Native Corporation1
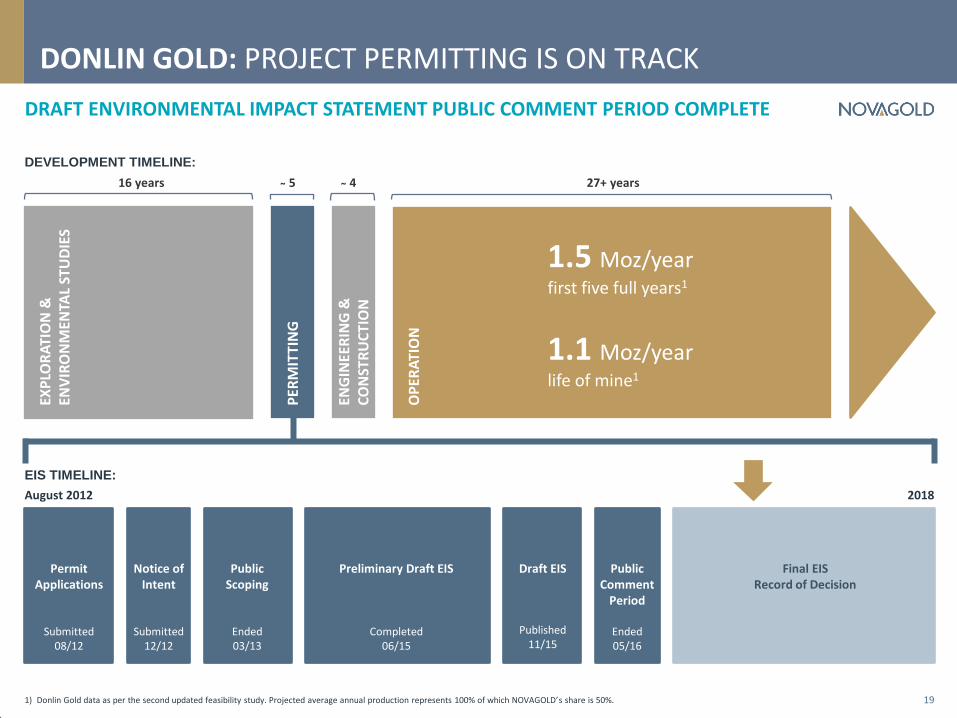
DONLIN GOLD: PROJECT PERMITTING IS ON TRACK
DRAFT ENVIRONMENTAL IMPACT STATEMENT PUBLIC COMMENT PERIOD COMPLETE
19 1) Donlin Gold data as per the second updated feasibility study. Projected average annual production represents 100% of which NOVAGOLD’s share is 50%.
Public Scoping
Ended 03/13
Draft EIS
Published 11/15
Final EIS Record of Decision
Preliminary Draft EIS
Completed 06/15
Public Comment
Period
Ended 05/16
Notice of Intent
Submitted 12/12
August 2012 2018
Permit Applications
Submitted 08/12
EIS TIMELINE:
16 years 4 27+ years
EXP
LOR
ATI
ON
&
ENV
IRO
NM
ENTA
L ST
UD
IES
PER
MIT
TIN
G
ENG
INEE
RIN
G &
C
ON
STR
UC
TIO
N
OP
ERA
TIO
N
1.5 Moz/year first five full years1
1.1 Moz/year life of mine1
5
DEVELOPMENT TIMELINE:
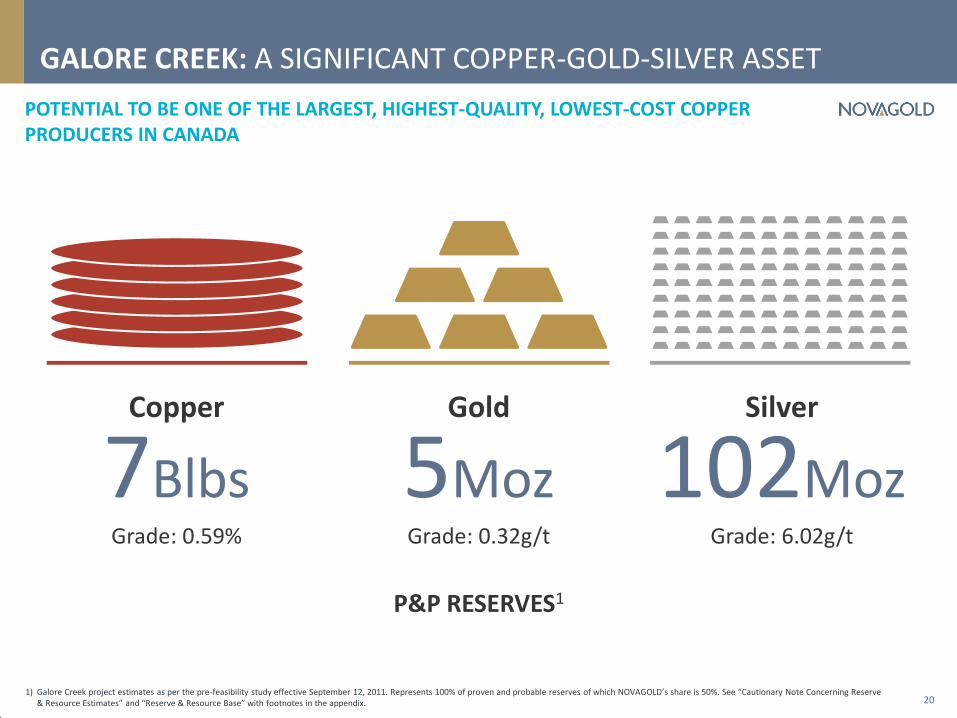
GALORE CREEK: A SIGNIFICANT COPPER-GOLD-SILVER ASSET
POTENTIAL TO BE ONE OF THE LARGEST, HIGHEST-QUALITY, LOWEST-COST COPPER PRODUCERS IN CANADA
20 1) Galore Creek project estimates as per the pre-feasibility study effective September 12, 2011. Represents 100% of proven and probable reserves of which NOVAGOLD’s share is 50%. See “Cautionary Note Concerning Reserve
& Resource Estimates” and “Reserve & Resource Base” with footnotes in the appendix.
Gold
5Moz Grade: 0.32g/t
Silver
102Moz Grade: 6.02g/t
Copper
7Blbs Grade: 0.59%
P&P RESERVES1
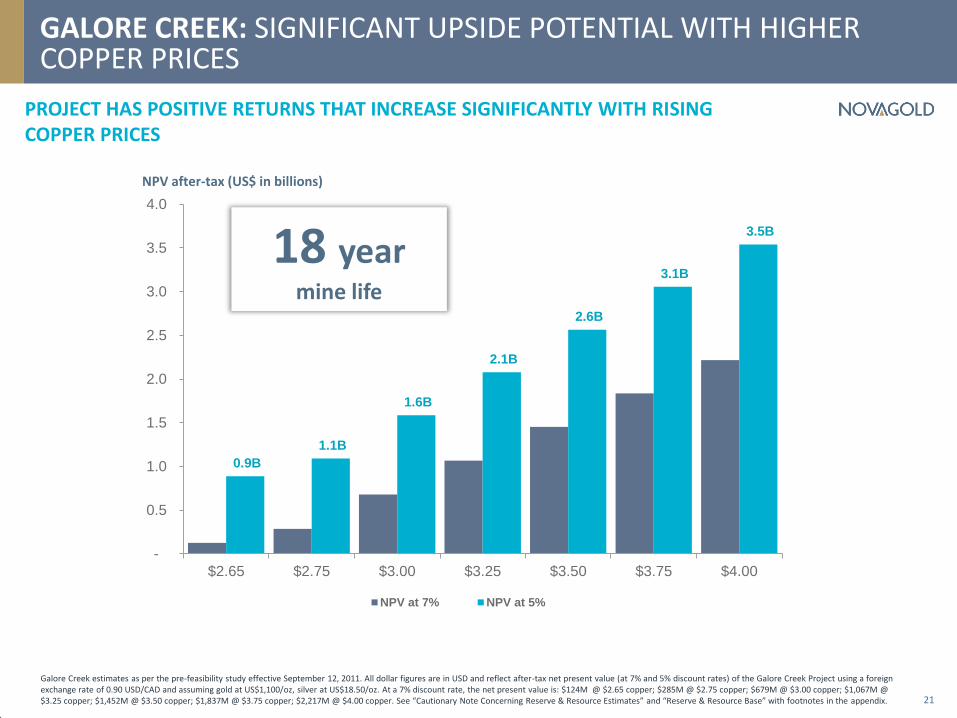
GALORE CREEK: SIGNIFICANT UPSIDE POTENTIAL WITH HIGHER COPPER PRICES
PROJECT HAS POSITIVE RETURNS THAT INCREASE SIGNIFICANTLY WITH RISING COPPER PRICES
21
0.9B
1.1B
1.6B
2.1B
2.6B
3.1B
3.5B
-
0.5
1.0
1.5
2.0
2.5
3.0
3.5
4.0
$2.65 $2.75 $3.00 $3.25 $3.50 $3.75 $4.00
NPV at 7% NPV at 5%
NPV after-tax (US$ in billions)
Galore Creek estimates as per the pre-feasibility study effective September 12, 2011. All dollar figures are in USD and reflect after-tax net present value (at 7% and 5% discount rates) of the Galore Creek Project using a foreign exchange rate of 0.90 USD/CAD and assuming gold at US$1,100/oz, silver at US$18.50/oz. At a 7% discount rate, the net present value is: $124M @ $2.65 copper; $285M @ $2.75 copper; $679M @ $3.00 copper; $1,067M @ $3.25 copper; $1,452M @ $3.50 copper; $1,837M @ $3.75 copper; $2,217M @ $4.00 copper. See “Cautionary Note Concerning Reserve & Resource Estimates” and “Reserve & Resource Base” with footnotes in the appendix.
18 year mine life
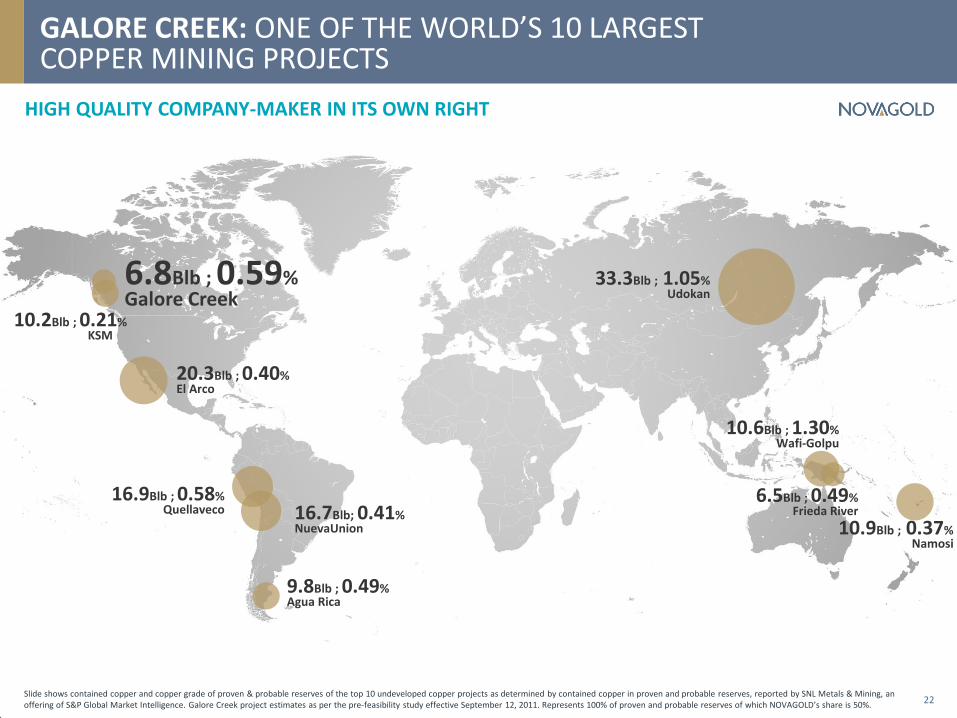
GALORE CREEK: ONE OF THE WORLD’S 10 LARGEST COPPER MINING PROJECTS
HIGH QUALITY COMPANY-MAKER IN ITS OWN RIGHT
22
Slide shows contained copper and copper grade of proven & probable reserves of the top 10 undeveloped copper projects as determined by contained copper in proven and probable reserves, reported by SNL Metals & Mining, an offering of S&P Global Market Intelligence. Galore Creek project estimates as per the pre-feasibility study effective September 12, 2011. Represents 100% of proven and probable reserves of which NOVAGOLD’s share is 50%.
6.8Blb ; 0.59% Galore Creek
33.3Blb ; 1.05% Udokan
10.6Blb ; 1.30% Wafi-Golpu
10.9Blb ; 0.37% Namosi
16.7Blb; 0.41% NuevaUnion
16.9Blb ; 0.58% Quellaveco
20.3Blb ; 0.40% El Arco
10.2Blb ; 0.21% KSM
9.8Blb ; 0.49% Agua Rica
6.5Blb ; 0.49% Frieda River
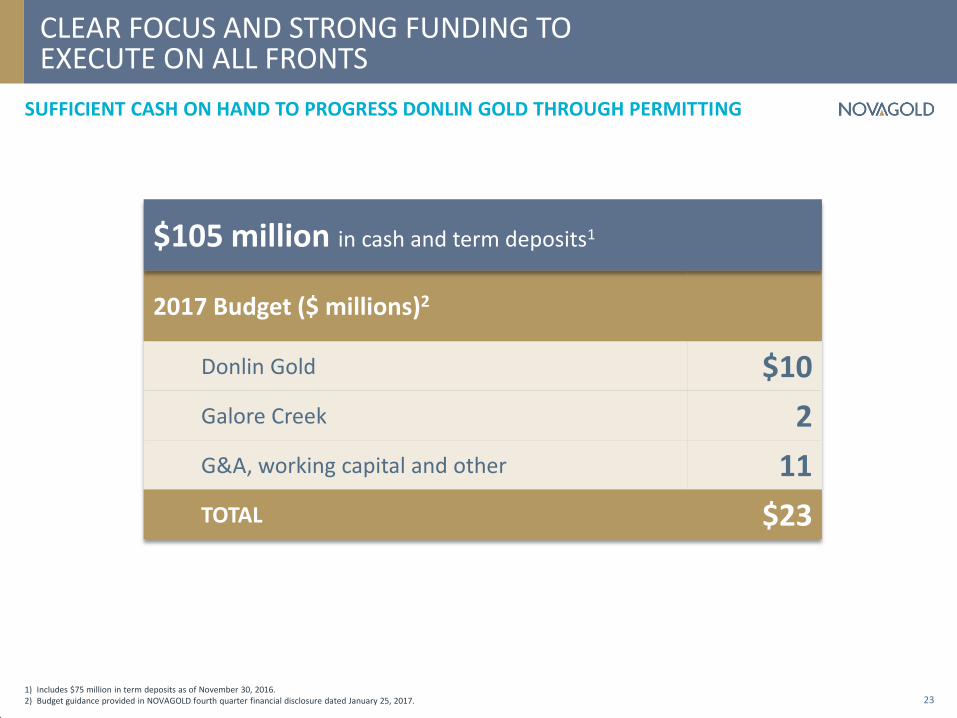
CLEAR FOCUS AND STRONG FUNDING TO EXECUTE ON ALL FRONTS
SUFFICIENT CASH ON HAND TO PROGRESS DONLIN GOLD THROUGH PERMITTING
23
2017 Budget ($ millions)2
Donlin Gold $10
Galore Creek 2
G&A, working capital and other 11
TOTAL $23
1) Includes $75 million in term deposits as of November 30, 2016. 2) Budget guidance provided in NOVAGOLD fourth quarter financial disclosure dated January 25, 2017.
$105 million in cash and term deposits1
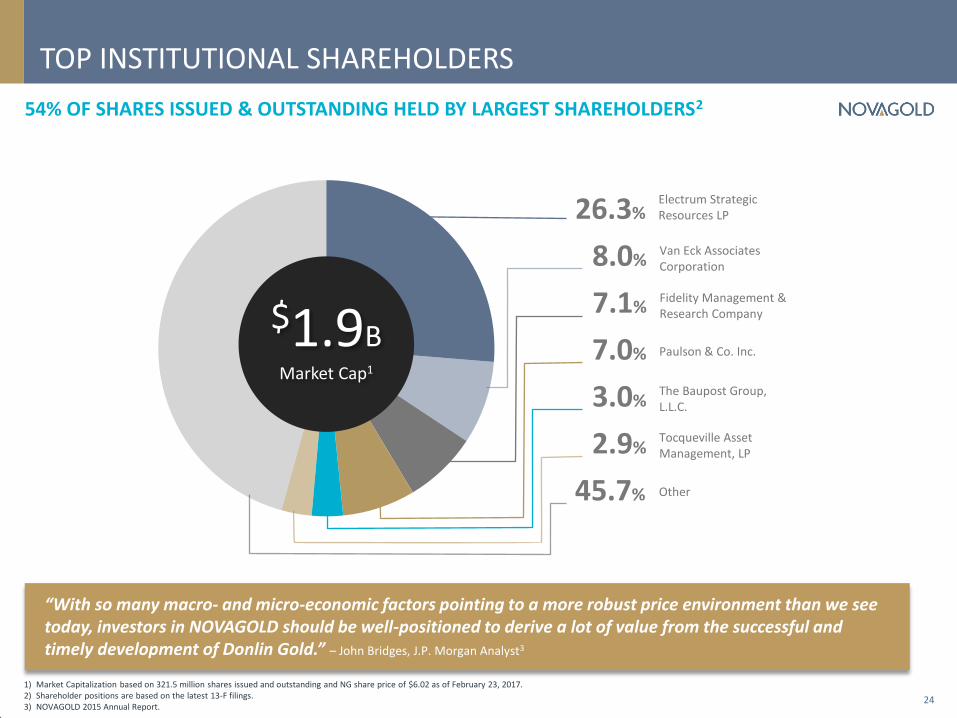
TOP INSTITUTIONAL SHAREHOLDERS
54% OF SHARES ISSUED & OUTSTANDING HELD BY LARGEST SHAREHOLDERS2
24
1) Market Capitalization based on 321.5 million shares issued and outstanding and NG share price of $6.02 as of February 23, 2017. 2) Shareholder positions are based on the latest 13-F filings. 3) NOVAGOLD 2015 Annual Report.
Electrum Strategic Resources LP 26.3%
Van Eck Associates Corporation 8.0%
Fidelity Management & Research Company 7.1%
Paulson & Co. Inc. 7.0%
The Baupost Group, L.L.C. 3.0%
Tocqueville Asset Management, LP 2.9%
Other 45.7%
$1.9B Market Cap1
“With so many macro- and micro-economic factors pointing to a more robust price environment than we see today, investors in NOVAGOLD should be well-positioned to derive a lot of value from the successful and timely development of Donlin Gold.” – John Bridges, J.P. Morgan Analyst3
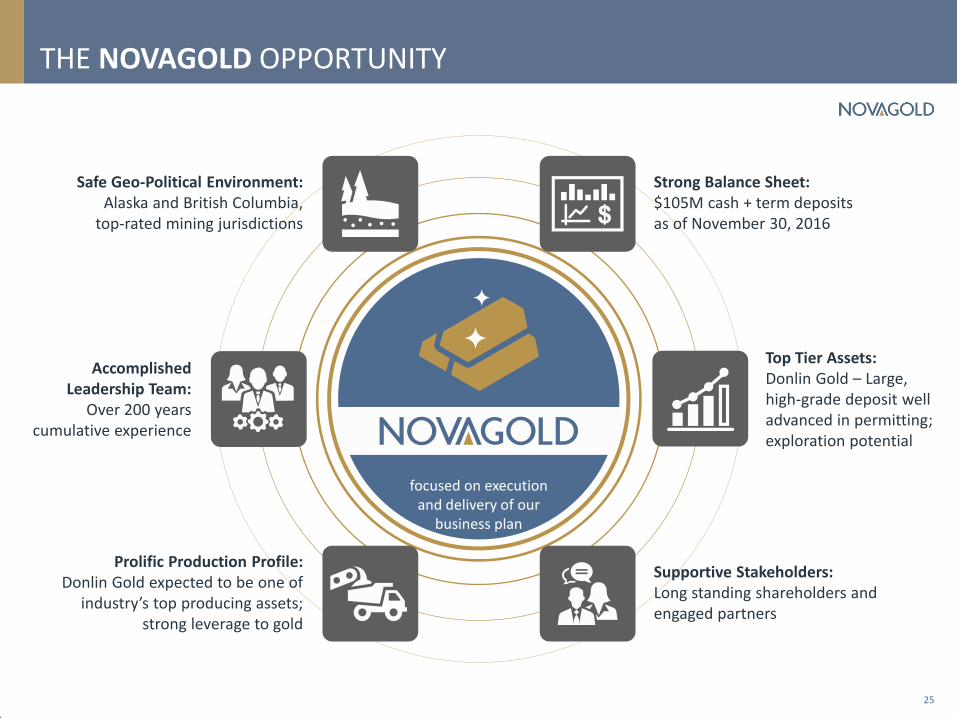
THE NOVAGOLD OPPORTUNITY
25
Safe Geo-Political Environment: Alaska and British Columbia,
top-rated mining jurisdictions
Accomplished Leadership Team:
Over 200 years cumulative experience
Prolific Production Profile: Donlin Gold expected to be one of
industry’s top producing assets; strong leverage to gold
Supportive Stakeholders: Long standing shareholders and engaged partners
Strong Balance Sheet: $105M cash + term deposits as of November 30, 2016
Top Tier Assets: Donlin Gold – Large, high-grade deposit well advanced in permitting; exploration potential
focused on execution and delivery of our
business plan
APPENDIX
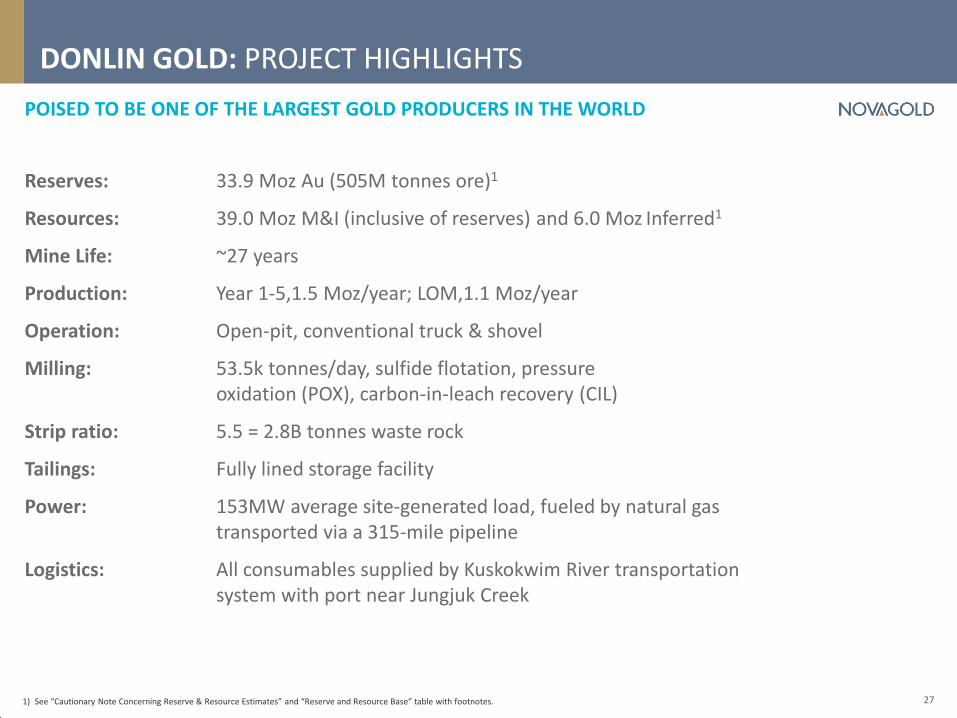
POISED TO BE ONE OF THE LARGEST GOLD PRODUCERS IN THE WORLD
DONLIN GOLD: PROJECT HIGHLIGHTS
27
Reserves: 33.9 Moz Au (505M tonnes ore)1
Resources: 39.0 Moz M&I (inclusive of reserves) and 6.0 Moz Inferred1
Mine Life: ~27 years
Production: Year 1-5,1.5 Moz/year; LOM,1.1 Moz/year
Operation: Open-pit, conventional truck & shovel
Milling: 53.5k tonnes/day, sulfide flotation, pressure oxidation (POX), carbon-in-leach recovery (CIL)
Strip ratio: 5.5 = 2.8B tonnes waste rock
Tailings: Fully lined storage facility
Power: 153MW average site-generated load, fueled by natural gas transported via a 315-mile pipeline
Logistics: All consumables supplied by Kuskokwim River transportation system with port near Jungjuk Creek
1) See “Cautionary Note Concerning Reserve & Resource Estimates” and “Reserve and Resource Base” table with footnotes.
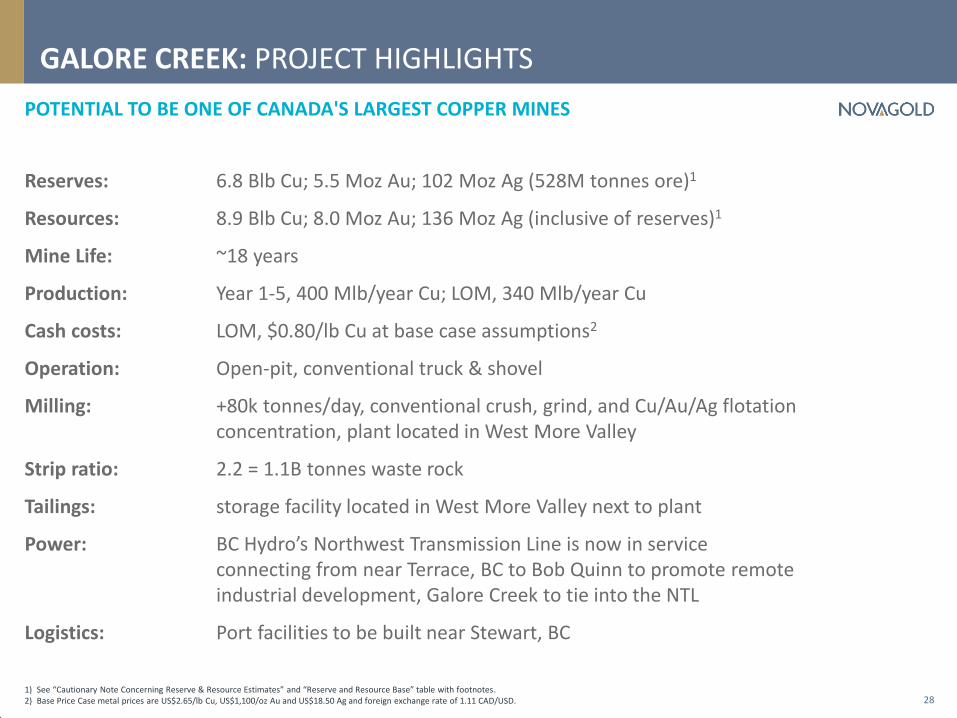
POTENTIAL TO BE ONE OF CANADA'S LARGEST COPPER MINES
GALORE CREEK: PROJECT HIGHLIGHTS
28
Reserves: 6.8 Blb Cu; 5.5 Moz Au; 102 Moz Ag (528M tonnes ore)1
Resources: 8.9 Blb Cu; 8.0 Moz Au; 136 Moz Ag (inclusive of reserves)1
Mine Life: ~18 years
Production: Year 1-5, 400 Mlb/year Cu; LOM, 340 Mlb/year Cu
Cash costs: LOM, $0.80/lb Cu at base case assumptions2
Operation: Open-pit, conventional truck & shovel
Milling: +80k tonnes/day, conventional crush, grind, and Cu/Au/Ag flotation concentration, plant located in West More Valley
Strip ratio: 2.2 = 1.1B tonnes waste rock
Tailings: storage facility located in West More Valley next to plant
Power: BC Hydro’s Northwest Transmission Line is now in service connecting from near Terrace, BC to Bob Quinn to promote remote industrial development, Galore Creek to tie into the NTL
Logistics: Port facilities to be built near Stewart, BC
1) See “Cautionary Note Concerning Reserve & Resource Estimates” and “Reserve and Resource Base” table with footnotes. 2) Base Price Case metal prices are US$2.65/lb Cu, US$1,100/oz Au and US$18.50 Ag and foreign exchange rate of 1.11 CAD/USD.
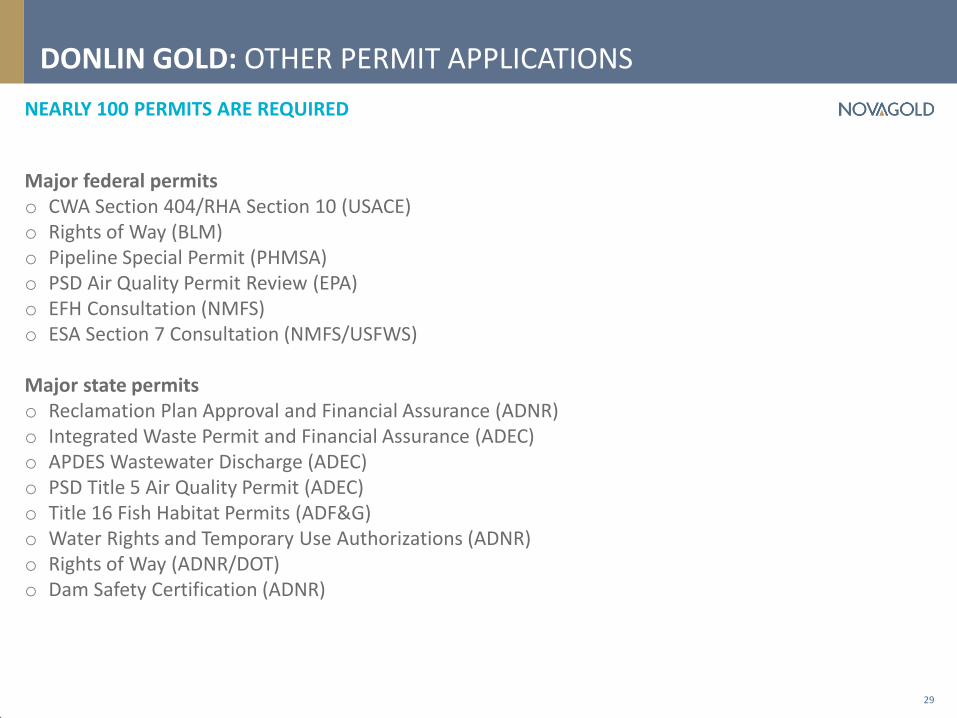
NEARLY 100 PERMITS ARE REQUIRED
DONLIN GOLD: OTHER PERMIT APPLICATIONS
29
Major federal permits o CWA Section 404/RHA Section 10 (USACE) o Rights of Way (BLM) o Pipeline Special Permit (PHMSA) o PSD Air Quality Permit Review (EPA) o EFH Consultation (NMFS) o ESA Section 7 Consultation (NMFS/USFWS) Major state permits o Reclamation Plan Approval and Financial Assurance (ADNR) o Integrated Waste Permit and Financial Assurance (ADEC) o APDES Wastewater Discharge (ADEC) o PSD Title 5 Air Quality Permit (ADEC) o Title 16 Fish Habitat Permits (ADF&G) o Water Rights and Temporary Use Authorizations (ADNR) o Rights of Way (ADNR/DOT) o Dam Safety Certification (ADNR)
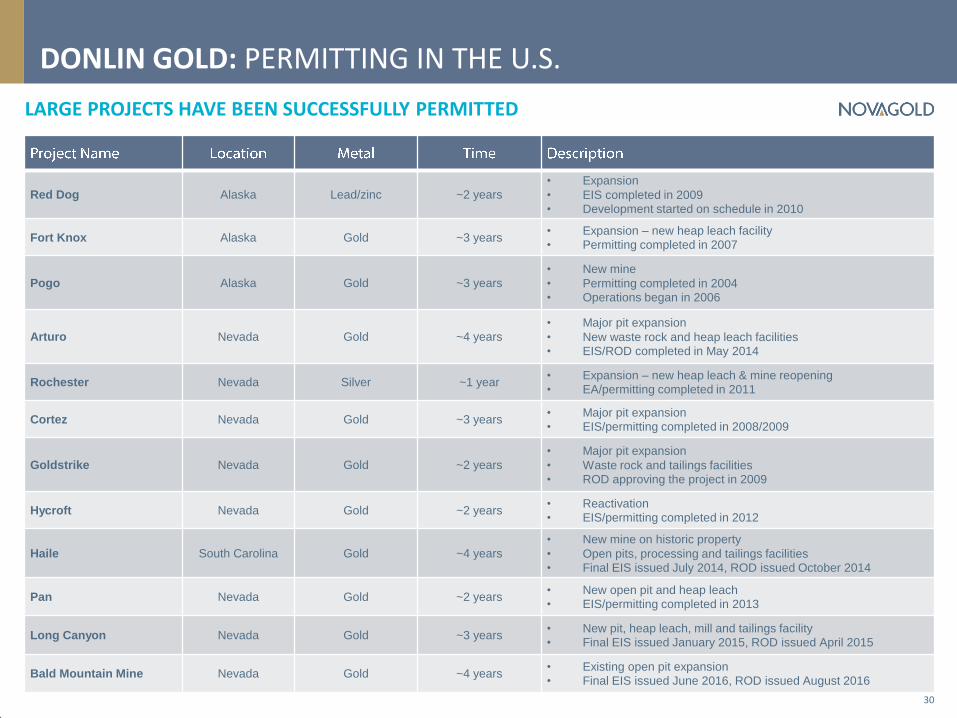
DONLIN GOLD: PERMITTING IN THE U.S.
LARGE PROJECTS HAVE BEEN SUCCESSFULLY PERMITTED
30
Red Dog Alaska Lead/zinc ~2 years • Expansion
• EIS completed in 2009
• Development started on schedule in 2010
Fort Knox Alaska Gold ~3 years • Expansion – new heap leach facility
• Permitting completed in 2007
Pogo Alaska Gold ~3 years • New mine
• Permitting completed in 2004
• Operations began in 2006
Arturo Nevada Gold ~4 years • Major pit expansion
• New waste rock and heap leach facilities
• EIS/ROD completed in May 2014
Rochester Nevada Silver ~1 year • Expansion – new heap leach & mine reopening
• EA/permitting completed in 2011
Cortez Nevada Gold ~3 years • Major pit expansion
• EIS/permitting completed in 2008/2009
Goldstrike Nevada Gold ~2 years • Major pit expansion
• Waste rock and tailings facilities
• ROD approving the project in 2009
Hycroft Nevada Gold ~2 years • Reactivation
• EIS/permitting completed in 2012
Haile South Carolina Gold ~4 years • New mine on historic property
• Open pits, processing and tailings facilities
• Final EIS issued July 2014, ROD issued October 2014
Pan Nevada Gold ~2 years • New open pit and heap leach
• EIS/permitting completed in 2013
Long Canyon Nevada Gold ~3 years • New pit, heap leach, mill and tailings facility
• Final EIS issued January 2015, ROD issued April 2015
Bald Mountain Mine Nevada Gold ~4 years • Existing open pit expansion
• Final EIS issued June 2016, ROD issued August 2016
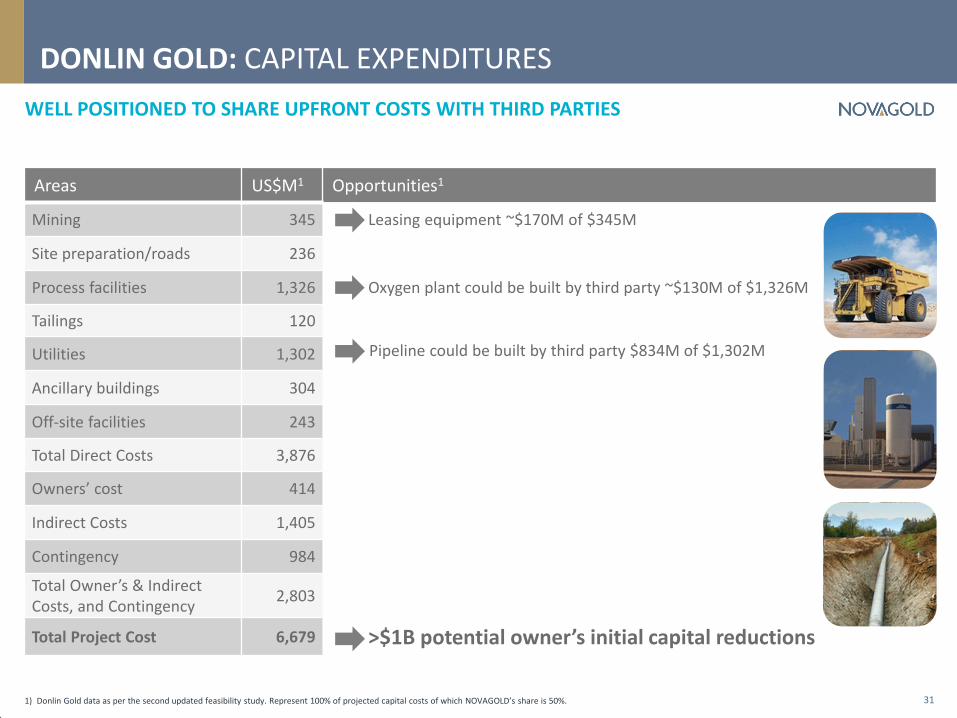
DONLIN GOLD: CAPITAL EXPENDITURES
WELL POSITIONED TO SHARE UPFRONT COSTS WITH THIRD PARTIES
31
Areas US$M1 Opportunities1
Mining 345 Leasing equipment ~$170M of $345M
Site preparation/roads 236
Process facilities 1,326 Oxygen plant could be built by third party ~$130M of $1,326M
Tailings 120
Utilities 1,302
Ancillary buildings 304
Off-site facilities 243
Total Direct Costs 3,876
Owners’ cost 414
Indirect Costs 1,405
Contingency 984
Total Owner’s & Indirect Costs, and Contingency
2,803
Total Project Cost 6,679 >$1B potential owner’s initial capital reductions
Pipeline could be built by third party $834M of $1,302M
1) Donlin Gold data as per the second updated feasibility study. Represent 100% of projected capital costs of which NOVAGOLD’s share is 50%.
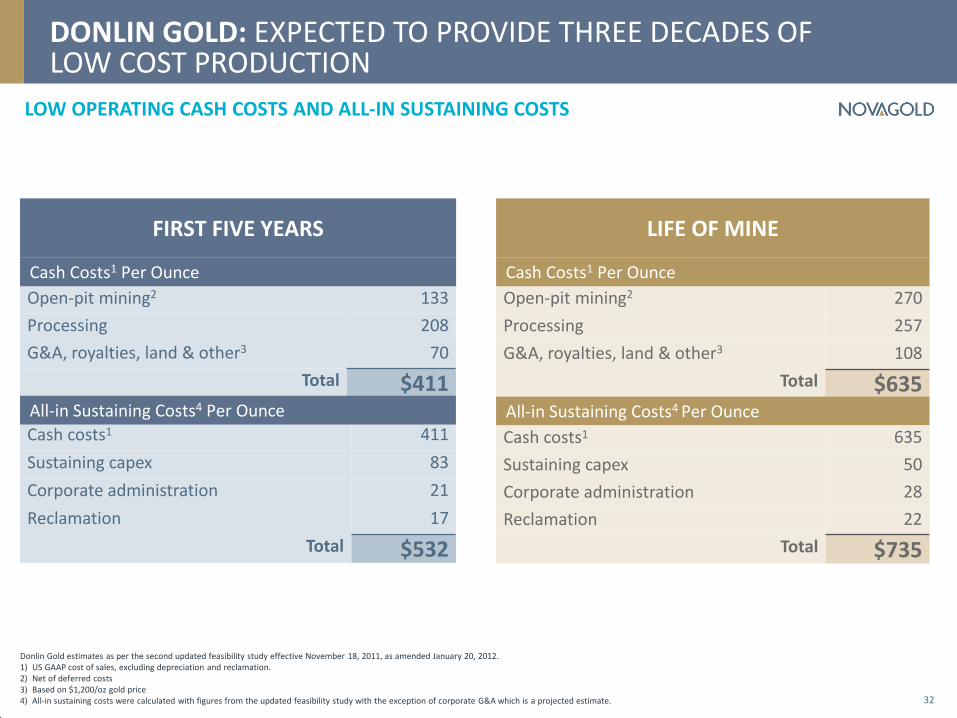
DONLIN GOLD: EXPECTED TO PROVIDE THREE DECADES OF LOW COST PRODUCTION
LOW OPERATING CASH COSTS AND ALL-IN SUSTAINING COSTS
Open-pit mining2 270
Processing 257
G&A, royalties, land & other3 108
Total $635
Open-pit mining2 133
Processing 208
G&A, royalties, land & other3 70
Total $411
Cash Costs1 Per Ounce
FIRST FIVE YEARS
Donlin Gold estimates as per the second updated feasibility study effective November 18, 2011, as amended January 20, 2012. 1) US GAAP cost of sales, excluding depreciation and reclamation. 2) Net of deferred costs 3) Based on $1,200/oz gold price 4) All-in sustaining costs were calculated with figures from the updated feasibility study with the exception of corporate G&A which is a projected estimate.
All-in Sustaining Costs4 Per Ounce
Cash costs1 635
Sustaining capex 50
Corporate administration 28
Reclamation 22
Total $735
Cash costs1 411
Sustaining capex 83
Corporate administration 21
Reclamation 17
Total $532
LIFE OF MINE
Cash Costs1 Per Ounce
All-in Sustaining Costs4 Per Ounce
32
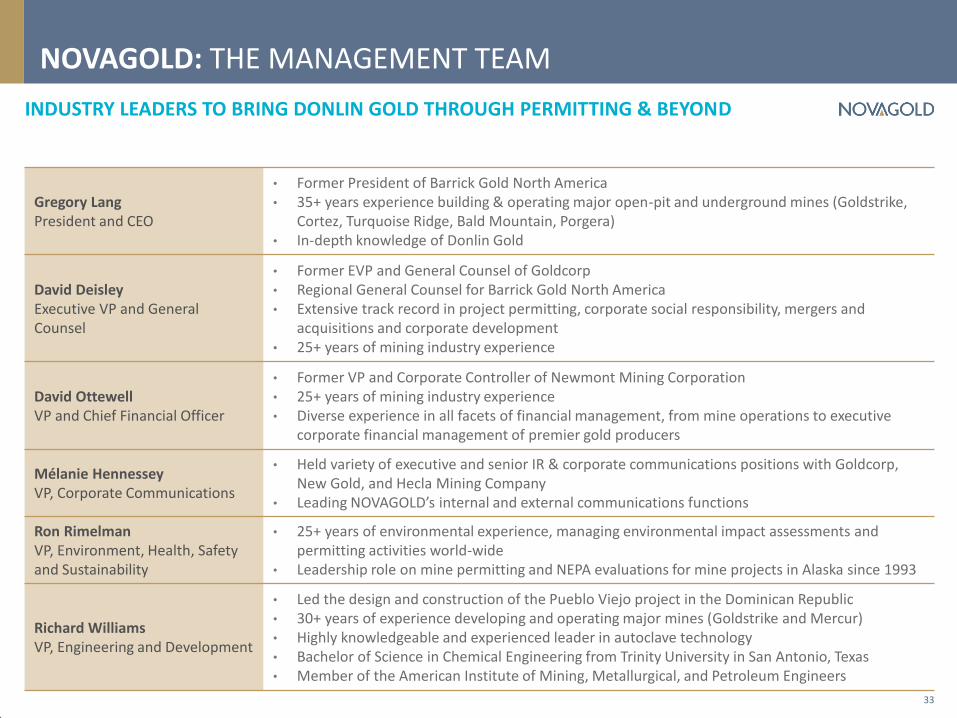
NOVAGOLD: THE MANAGEMENT TEAM
INDUSTRY LEADERS TO BRING DONLIN GOLD THROUGH PERMITTING & BEYOND
33
Gregory Lang President and CEO
• Former President of Barrick Gold North America • 35+ years experience building & operating major open-pit and underground mines (Goldstrike,
Cortez, Turquoise Ridge, Bald Mountain, Porgera) • In-depth knowledge of Donlin Gold
David Deisley Executive VP and General Counsel
• Former EVP and General Counsel of Goldcorp • Regional General Counsel for Barrick Gold North America • Extensive track record in project permitting, corporate social responsibility, mergers and
acquisitions and corporate development • 25+ years of mining industry experience
David Ottewell VP and Chief Financial Officer
• Former VP and Corporate Controller of Newmont Mining Corporation • 25+ years of mining industry experience • Diverse experience in all facets of financial management, from mine operations to executive
corporate financial management of premier gold producers
Mélanie Hennessey VP, Corporate Communications
• Held variety of executive and senior IR & corporate communications positions with Goldcorp, New Gold, and Hecla Mining Company
• Leading NOVAGOLD’s internal and external communications functions
Ron Rimelman VP, Environment, Health, Safety and Sustainability
• 25+ years of environmental experience, managing environmental impact assessments and permitting activities world-wide
• Leadership role on mine permitting and NEPA evaluations for mine projects in Alaska since 1993
Richard Williams VP, Engineering and Development
• Led the design and construction of the Pueblo Viejo project in the Dominican Republic • 30+ years of experience developing and operating major mines (Goldstrike and Mercur) • Highly knowledgeable and experienced leader in autoclave technology • Bachelor of Science in Chemical Engineering from Trinity University in San Antonio, Texas • Member of the American Institute of Mining, Metallurgical, and Petroleum Engineers

NOVAGOLD: THE BOARD OF DIRECTORS
Dr. Thomas Kaplan Chairman
• Chairman and CIO of The Electrum Group LLC, a privately held natural resources investment management company that controls a diversified portfolio of precious and base metals assets
Sharon Dowdall • Former Chief Legal Officer and Corporate Secretary with Franco-Nevada, transforming an
industry pioneer into one of the most successful precious metals enterprises in the world
Dr. Marc Faber • A well-known commentator and author on global investing, publisher of The Gloom, Boom &
Doom Report
Greg Lang President and CEO
• Former President of Barrick Gold North America, 35 years experience building & operating major mines with intimate knowledge of Donlin Gold
Gil Leathley • Senior Advisor to the Company’s President and CEO, former Senior Vice President and Chief
Operating Officer of the Company
Igor Levental • President of The Electrum Group LLC, former VP of Homestake Mining and International Corona
Corp.
Kalidas Madhavpeddi • Overseas Chief Executive Officer of China Moly Corp. Former Executive with Phelps Dodge
Gerald McConnell • Former Chairman and CEO of NOVAGOLD, CEO of Namibia Rare Earths Inc.
Clynton Nauman • CEO of Alexco Resources, formerly with Viceroy Gold and Kennecott Minerals
Rick Van Nieuwenhuyse • CEO of Trilogy Metals, founder and former CEO of NOVAGOLD
Anthony Walsh • Former President and Chief Executive Officer of Miramar Mining Corporation, which in 2007
was sold to Newmont Mining Corporation
34
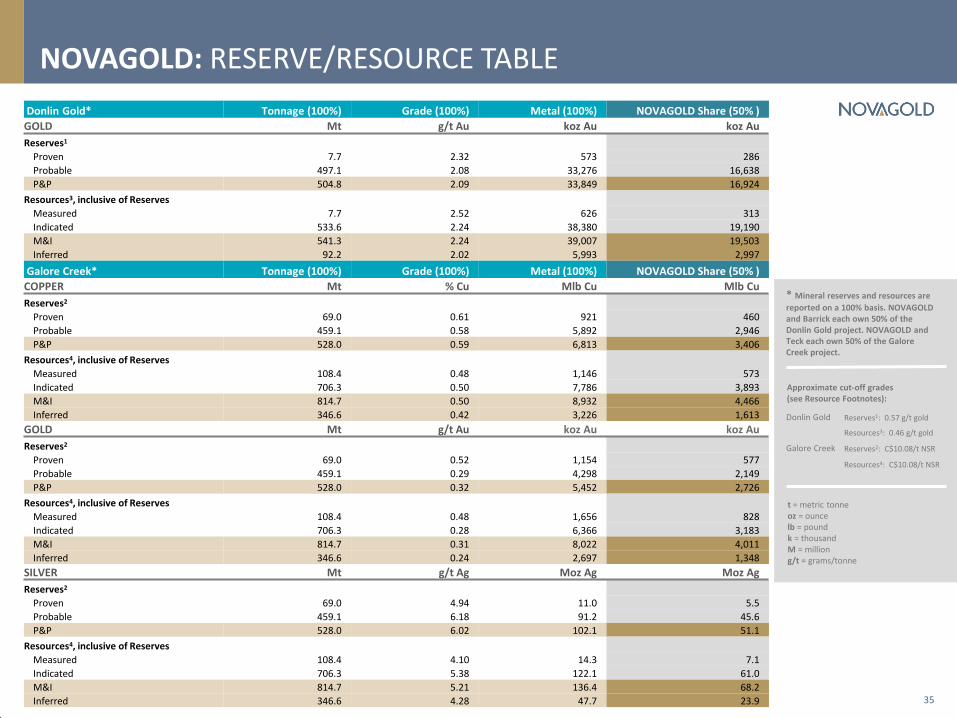
NOVAGOLD: RESERVE/RESOURCE TABLE
35
* Mineral reserves and resources are
reported on a 100% basis. NOVAGOLD and Barrick each own 50% of the Donlin Gold project. NOVAGOLD and Teck each own 50% of the Galore Creek project.
t = metric tonne oz = ounce lb = pound k = thousand M = million g/t = grams/tonne
Approximate cut-off grades (see Resource Footnotes):
Donlin Gold Reserves1: 0.57 g/t gold
Resources3: 0.46 g/t gold
Galore Creek Reserves2: C$10.08/t NSR
Resources4: C$10.08/t NSR
Donlin Gold* Tonnage (100%) Grade (100%) Metal (100%) NOVAGOLD Share (50% )
GOLD Mt g/t Au koz Au koz Au
Reserves1
Proven 7.7 2.32 573 286
Probable 497.1 2.08 33,276 16,638
P&P 504.8 2.09 33,849 16,924
Resources3, inclusive of Reserves
Measured 7.7 2.52 626 313
Indicated 533.6 2.24 38,380 19,190
M&I 541.3 2.24 39,007 19,503
Inferred 92.2 2.02 5,993 2,997
Galore Creek* Tonnage (100%) Grade (100%) Metal (100%) NOVAGOLD Share (50% )
COPPER Mt % Cu Mlb Cu Mlb Cu
Reserves2
Proven 69.0 0.61 921 460
Probable 459.1 0.58 5,892 2,946
P&P 528.0 0.59 6,813 3,406
Resources4, inclusive of Reserves
Measured 108.4 0.48 1,146 573
Indicated 706.3 0.50 7,786 3,893
M&I 814.7 0.50 8,932 4,466
Inferred 346.6 0.42 3,226 1,613
GOLD Mt g/t Au koz Au koz Au
Reserves2
Proven 69.0 0.52 1,154 577
Probable 459.1 0.29 4,298 2,149
P&P 528.0 0.32 5,452 2,726
Resources4, inclusive of Reserves
Measured 108.4 0.48 1,656 828
Indicated 706.3 0.28 6,366 3,183
M&I 814.7 0.31 8,022 4,011
Inferred 346.6 0.24 2,697 1,348
SILVER Mt g/t Ag Moz Ag Moz Ag
Reserves2
Proven 69.0 4.94 11.0 5.5
Probable 459.1 6.18 91.2 45.6
P&P 528.0 6.02 102.1 51.1
Resources4, inclusive of Reserves
Measured 108.4 4.10 14.3 7.1
Indicated 706.3 5.38 122.1 61.0
M&I 814.7 5.21 136.4 68.2
Inferred 346.6 4.28 47.7 23.9
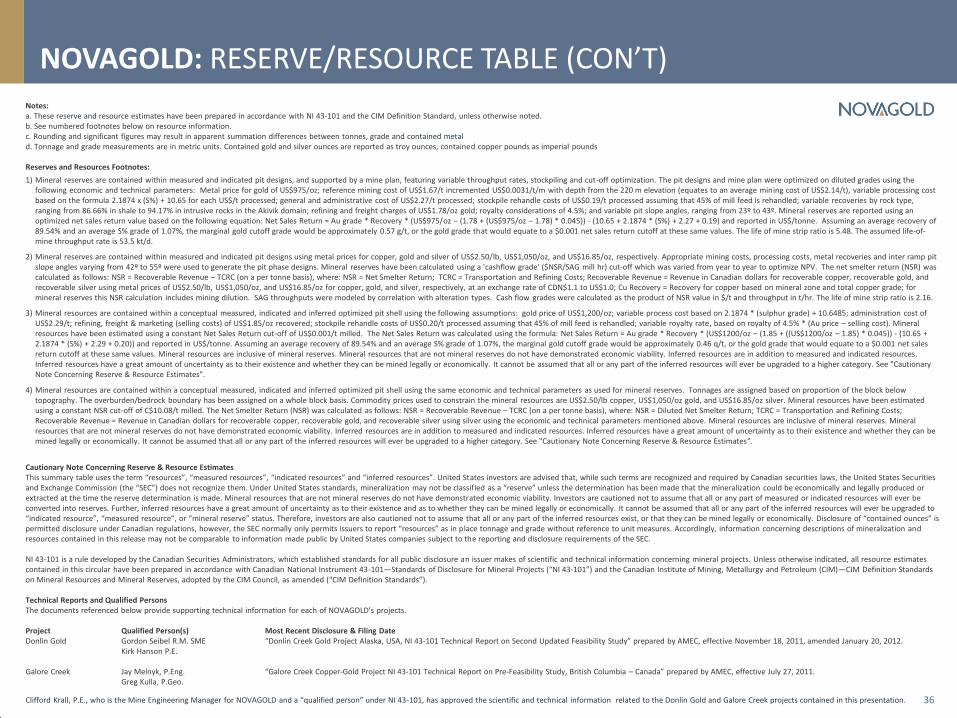
Notes: a. These reserve and resource estimates have been prepared in accordance with NI 43-101 and the CIM Definition Standard, unless otherwise noted. b. See numbered footnotes below on resource information. c. Rounding and significant figures may result in apparent summation differences between tonnes, grade and contained metal d. Tonnage and grade measurements are in metric units. Contained gold and silver ounces are reported as troy ounces, contained copper pounds as imperial pounds Reserves and Resources Footnotes:
1) Mineral reserves are contained within measured and indicated pit designs, and supported by a mine plan, featuring variable throughput rates, stockpiling and cut-off optimization. The pit designs and mine plan were optimized on diluted grades using the following economic and technical parameters: Metal price for gold of US$975/oz; reference mining cost of US$1.67/t incremented US$0.0031/t/m with depth from the 220 m elevation (equates to an average mining cost of US$2.14/t), variable processing cost based on the formula 2.1874 x (S%) + 10.65 for each US$/t processed; general and administrative cost of US$2.27/t processed; stockpile rehandle costs of US$0.19/t processed assuming that 45% of mill feed is rehandled; variable recoveries by rock type, ranging from 86.66% in shale to 94.17% in intrusive rocks in the Akivik domain; refining and freight charges of US$1.78/oz gold; royalty considerations of 4.5%; and variable pit slope angles, ranging from 23º to 43º. Mineral reserves are reported using an optimized net sales return value based on the following equation: Net Sales Return = Au grade * Recovery * (US$975/oz – (1.78 + (US$975/oz – 1.78) * 0.045)) - (10.65 + 2.1874 * (S%) + 2.27 + 0.19) and reported in US$/tonne. Assuming an average recovery of 89.54% and an average S% grade of 1.07%, the marginal gold cutoff grade would be approximately 0.57 g/t, or the gold grade that would equate to a $0.001 net sales return cutoff at these same values. The life of mine strip ratio is 5.48. The assumed life-of-mine throughput rate is 53.5 kt/d.
2) Mineral reserves are contained within measured and indicated pit designs using metal prices for copper, gold and silver of US$2.50/lb, US$1,050/oz, and US$16.85/oz, respectively. Appropriate mining costs, processing costs, metal recoveries and inter ramp pit slope angles varying from 42º to 55º were used to generate the pit phase designs. Mineral reserves have been calculated using a 'cashflow grade' ($NSR/SAG mill hr) cut-off which was varied from year to year to optimize NPV. The net smelter return (NSR) was calculated as follows: NSR = Recoverable Revenue – TCRC (on a per tonne basis), where: NSR = Net Smelter Return; TCRC = Transportation and Refining Costs; Recoverable Revenue = Revenue in Canadian dollars for recoverable copper, recoverable gold, and recoverable silver using metal prices of US$2.50/lb, US$1,050/oz, and US$16.85/oz for copper, gold, and silver, respectively, at an exchange rate of CDN$1.1 to US$1.0; Cu Recovery = Recovery for copper based on mineral zone and total copper grade; for mineral reserves this NSR calculation includes mining dilution. SAG throughputs were modeled by correlation with alteration types. Cash flow grades were calculated as the product of NSR value in $/t and throughput in t/hr. The life of mine strip ratio is 2.16.
3) Mineral resources are contained within a conceptual measured, indicated and inferred optimized pit shell using the following assumptions: gold price of US$1,200/oz; variable process cost based on 2.1874 * (sulphur grade) + 10.6485; administration cost of US$2.29/t; refining, freight & marketing (selling costs) of US$1.85/oz recovered; stockpile rehandle costs of US$0.20/t processed assuming that 45% of mill feed is rehandled; variable royalty rate, based on royalty of 4.5% * (Au price – selling cost). Mineral resources have been estimated using a constant Net Sales Return cut-off of US$0.001/t milled. The Net Sales Return was calculated using the formula: Net Sales Return = Au grade * Recovery * (US$1200/oz – (1.85 + ((US$1200/oz – 1.85) * 0.045)) - (10.65 + 2.1874 * (S%) + 2.29 + 0.20)) and reported in US$/tonne. Assuming an average recovery of 89.54% and an average S% grade of 1.07%, the marginal gold cutoff grade would be approximately 0.46 q/t, or the gold grade that would equate to a $0.001 net sales return cutoff at these same values. Mineral resources are inclusive of mineral reserves. Mineral resources that are not mineral reserves do not have demonstrated economic viability. Inferred resources are in addition to measured and indicated resources. Inferred resources have a great amount of uncertainty as to their existence and whether they can be mined legally or economically. It cannot be assumed that all or any part of the inferred resources will ever be upgraded to a higher category. See "Cautionary Note Concerning Reserve & Resource Estimates".
4) Mineral resources are contained within a conceptual measured, indicated and inferred optimized pit shell using the same economic and technical parameters as used for mineral reserves. Tonnages are assigned based on proportion of the block below topography. The overburden/bedrock boundary has been assigned on a whole block basis. Commodity prices used to constrain the mineral resources are US$2.50/lb copper, US$1,050/oz gold, and US$16.85/oz silver. Mineral resources have been estimated using a constant NSR cut-off of C$10.08/t milled. The Net Smelter Return (NSR) was calculated as follows: NSR = Recoverable Revenue – TCRC (on a per tonne basis), where: NSR = Diluted Net Smelter Return; TCRC = Transportation and Refining Costs; Recoverable Revenue = Revenue in Canadian dollars for recoverable copper, recoverable gold, and recoverable silver using silver using the economic and technical parameters mentioned above. Mineral resources are inclusive of mineral reserves. Mineral resources that are not mineral reserves do not have demonstrated economic viability. Inferred resources are in addition to measured and indicated resources. Inferred resources have a great amount of uncertainty as to their existence and whether they can be mined legally or economically. It cannot be assumed that all or any part of the inferred resources will ever be upgraded to a higher category. See "Cautionary Note Concerning Reserve & Resource Estimates".
Cautionary Note Concerning Reserve & Resource Estimates This summary table uses the term “resources”, “measured resources”, “indicated resources” and “inferred resources”. United States investors are advised that, while such terms are recognized and required by Canadian securities laws, the United States Securities and Exchange Commission (the “SEC”) does not recognize them. Under United States standards, mineralization may not be classified as a “reserve” unless the determination has been made that the mineralization could be economically and legally produced or extracted at the time the reserve determination is made. Mineral resources that are not mineral reserves do not have demonstrated economic viability. Investors are cautioned not to assume that all or any part of measured or indicated resources will ever be converted into reserves. Further, inferred resources have a great amount of uncertainty as to their existence and as to whether they can be mined legally or economically. It cannot be assumed that all or any part of the inferred resources will ever be upgraded to “indicated resource”, “measured resource”, or “mineral reserve” status. Therefore, investors are also cautioned not to assume that all or any part of the inferred resources exist, or that they can be mined legally or economically. Disclosure of “contained ounces” is permitted disclosure under Canadian regulations, however, the SEC normally only permits issuers to report “resources” as in place tonnage and grade without reference to unit measures. Accordingly, information concerning descriptions of mineralization and resources contained in this release may not be comparable to information made public by United States companies subject to the reporting and disclosure requirements of the SEC. NI 43-101 is a rule developed by the Canadian Securities Administrators, which established standards for all public disclosure an issuer makes of scientific and technical information concerning mineral projects. Unless otherwise indicated, all resource estimates contained in this circular have been prepared in accordance with Canadian National Instrument 43-101—Standards of Disclosure for Mineral Projects (“NI 43-101”) and the Canadian Institute of Mining, Metallurgy and Petroleum (CIM)—CIM Definition Standards on Mineral Resources and Mineral Reserves, adopted by the CIM Council, as amended (“CIM Definition Standards”). Technical Reports and Qualified Persons The documents referenced below provide supporting technical information for each of NOVAGOLD's projects. Project Qualified Person(s) Most Recent Disclosure & Filing Date Donlin Gold Gordon Seibel R.M. SME “Donlin Creek Gold Project Alaska, USA, NI 43-101 Technical Report on Second Updated Feasibility Study” prepared by AMEC, effective November 18, 2011, amended January 20, 2012. Kirk Hanson P.E. Galore Creek Jay Melnyk, P.Eng. “Galore Creek Copper-Gold Project NI 43-101 Technical Report on Pre-Feasibility Study, British Columbia – Canada” prepared by AMEC, effective July 27, 2011. Greg Kulla, P.Geo.
Clifford Krall, P.E., who is the Mine Engineering Manager for NOVAGOLD and a “qualified person” under NI 43-101, has approved the scientific and technical information related to the Donlin Gold and Galore Creek projects contained in this presentation.
NOVAGOLD: RESERVE/RESOURCE TABLE (CON’T)
36
NOVAGOLD RESOURCES INC. Suite 720 – 789 West Pender Street Vancouver, BC Canada V6C 1H2 T 604 669 6227 TF 1 866 669 6227 F 604 669 6272 www.novagold.com [email protected]
Mélanie Hennessey VP, Corporate Communications [email protected]
Erin O’Toole Senior Stakeholder Relations Specialist [email protected]
CONTACT US
37