2017 CAGNY Conference - s21.q4cdn.com · 2017 CAGNY Conference ... earnings, foreign currencies,...
78
2017 CAGNY Conference Benno Dorer Chairman and Chief Executive Officer February 22 nd , 2017
Transcript of 2017 CAGNY Conference - s21.q4cdn.com · 2017 CAGNY Conference ... earnings, foreign currencies,...

2017 CAGNY Conference
Benno Dorer Chairman and
Chief Executive Officer
February 22nd, 2017

Safe Harbor Except for historical information, matters discussed in this presentation, including statements about the success of the Company’s
future volume, sales, costs, cost savings, earnings, foreign currencies, and foreign currency exchange rates, cash flows, plans,
objectives, expectations, growth or profitability, are forward-looking statements based on management’s estimates, assumptions
and projections. Important factors that could affect performance and cause results to differ materially from management’s
expectations are described in the Company’s most recent Form 10-K filed with the SEC, as updated from time to time in the
Company's SEC filings. Those factors include, but are not limited to, risks related to competition in the Company’s markets;
economic conditions and financial market volatility; the Company’s ability to drive sales growth and increase market share;
international operations, including price controls, foreign currency fluctuations, labor claims and labor unrest, potential harm and
liabilities from use, storage and transportation of chlorine in certain markets and discontinuation of operations in Venezuela;
volatility and increases in commodity, energy and other costs; supply disruptions; dependence on key customers; government
regulations; political, legal and tax risks; information technology security breaches or cyber attacks; risks relating to acquisitions,
new ventures and divestitures; the success of the Company’s business strategies and products; product liability claims, labor claims
and other legal proceedings; the Company’s business reputation; environmental matters; the Company’s ability to assert and
defend its intellectual property rights; and the impacts of potential stockholder activism.
The Company may also use non-GAAP financial measures, which could differ from reported results using Generally Accepted
Accounting Principles (GAAP). The most directly comparable GAAP financial measures and reconciliation to non-GAAP financial
measures are set forth in the Appendix hereto, the Supplemental Schedules of the Company’s quarterly financial results and in the
Company’s SEC filings, including its Form 10-K and its exhibits furnished to the SEC, which are posted at
www.TheCloroxCompany.com in the Investors/Financial Information/Financial Results and SEC Filings sections, respectively.

Key Messages
• Strategy focus on profitable growth continues to produce
strong results
• We are confident in our business plans

International : 17% Cleaning : 33%
Household : 33% Lifestyle : 17%
Cleaning 33%
Household 33%
Lifestyle 17%
International 17%
Advantaged Portfolio
Over 80% of Sales in U.S. and from #1 or #2 Share Brands
Latin America 9%
Canada 3%
Australia / NZ 2%
Rest of World 3%
9%
4%
4%
15%
11%
6%
Home Care 18%
Laundry 9%
Professional 6%
FY16 Company Sales: $5.8B
<1%*
Note: Reflects results following May 2016 Acquisition. Expect Renew Life to contribute 2pts of Sales in FY17
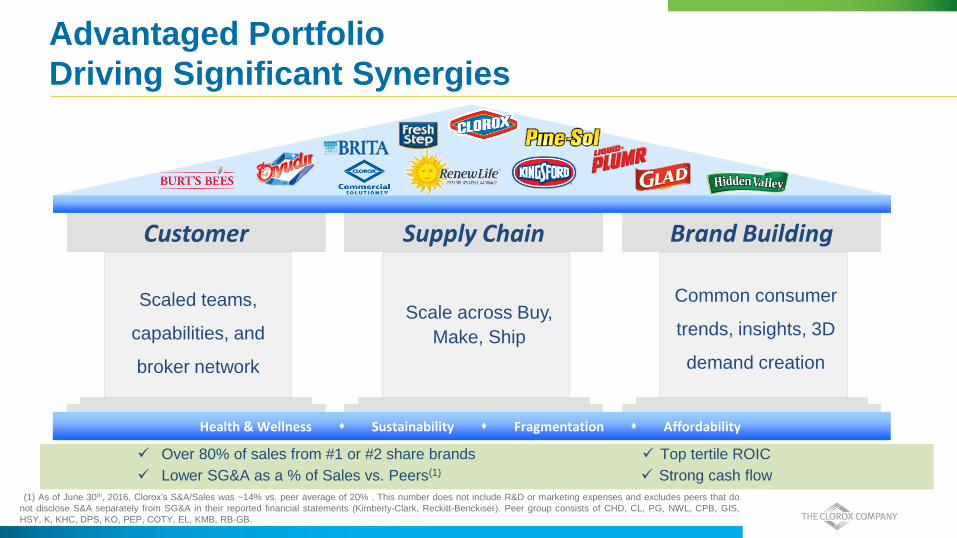
Advantaged Portfolio
Driving Significant Synergies
Over 80% of sales from #1 or #2 share brands
Lower SG&A as a % of Sales vs. Peers(1)
Top tertile ROIC
Strong cash flow
Customer
Scaled teams,
capabilities, and
broker network
Supply Chain
Scale across Buy,
Make, Ship
Brand Building
Common consumer
trends, insights, 3D
demand creation
Health & Wellness Sustainability Fragmentation Affordability
(1) As of June 30th, 2016, Clorox’s S&A/Sales was ~14% vs. peer average of 20% . This number does not include R&D or marketing expenses and excludes peers that do
not disclose S&A separately from SG&A in their reported financial statements (Kimberly-Clark, Reckitt-Benckiser). Peer group consists of CHD, CL, PG, NWL, CPB, GIS,
HSY, K, KHC, DPS, KO, PEP, COTY, EL, KMB, RB-GB.

Advantaged Portfolio
Supported by Consumer Megatrends
Affordability
Health & Wellness Sustainability
Fragmentation
MEGA
TRENDS

2020 Strategy
Mission
Strategy Strategy
Objectives
• We make everyday life better, every day
• Maximize economic profit
• Big-share brands in midsized categories and countries
• Engage our people as business owners
• Increase brand investment behind superior value and more targeted
3D plans
• Keep the core healthy and grow into new categories and channels
• Reduce waste in work, products, and supply chain

Strategy has Produced Strong Shareholder Return
Peers consist of 13 companies: CPB, KMB, K, RB-GB, KO, GIS, NWL, EL, PEP, CHD, CL, PG and HSY
29% 26% 21%
11% 10%
8%
0%
10%
20%
30%
40%
50%
Clorox Peers S&P 500
Share Price Appreciation Dividend Paid
40%
29%
36%
Total Shareholder Return
3 Years Ending 12/31/2016

Sales
EBIT Margin
Diluted EPS
EBIT (a non-GAAP measure) represents earnings from continuing operations before income taxes (a GAAP measure), excluding interest income &
interest expense. EBIT margin is a measure of EBIT as a percentage of sales.
+3% to +4%
+25bps
to +50bps
$5.23 to $5.38
(+6% to +9%)
FY17 Outlook Based on Feb 3rd Earnings Call
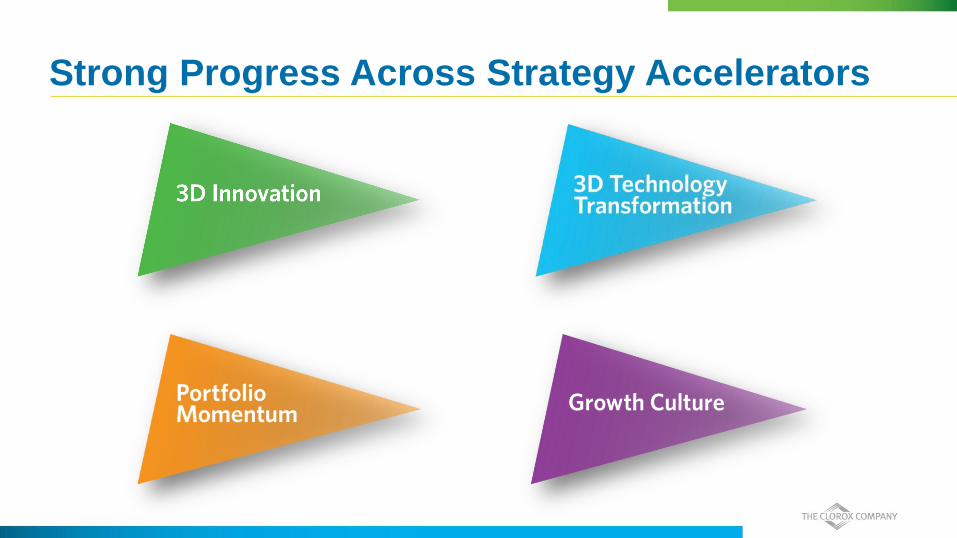
Strong Progress Across Strategy Accelerators

Focus on 3D Innovation
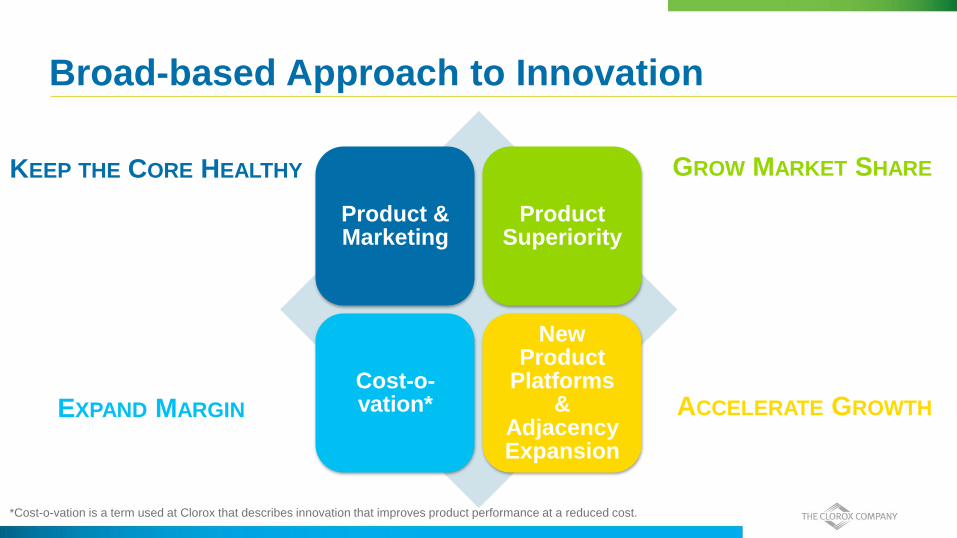
Broad-based Approach to Innovation
Product & Marketing
Product Superiority
Cost-o-vation*
New Product
Platforms &
Adjacency Expansion
GROW MARKET SHARE
ACCELERATE GROWTH EXPAND MARGIN
KEEP THE CORE HEALTHY
*Cost-o-vation is a term used at Clorox that describes innovation that improves product performance at a reduced cost.

Driving Upside from Strong FY16 Innovation
Burt’s Bees Lipsticks
Fresh Step with Febreze
Hidden Valley with Greek Yogurt
Clorox Wipes with Micro-Scrubbers
Glad with Clorox Antimicrobial
Clorox Bleach Crystals Stephen Curry
Partnership Brita Infinity “Connected”
Pitcher
Clorox Clothes (International)

Setting the Odor Control Gold Standard in Cat Litter
Source: IRI MULOP 52 weeks ending 12/18/16 $ Share
+4% FYTD Sales vs YA
+0.4 Share Pts
FYTD vs YA

Continuing Cat Litter Innovation in FY17
Fresh Step with Febreze Hawaiian Aloha
Product Innovation Cost-o-vation
New Convenient Compact Packs

2017 New Product Launches
Hidden Valley Simply Ranch Brita Stream Long-Burning Charcoal
Glad Kitchen Pro with Leakguard Lip Balm with
Flavor Crystals Burt’s Bees Protein Drink Scentiva Cleaning Platform
Brita LONGLAST Filter

International : 17% Cleaning : 33%
Household : 33% Lifestyle : 17%
Cleaning 33%
Household 33%
Lifestyle 17%
International 17%
Latin America 9%
Canada 3%
Australia / NZ 2%
Rest of World 3%
9%
4%
4%
15%
11%
6%
Home Care 18%
Laundry 9%
Professional 6%
FY16 Company Sales: $5.8B
<1%*
Note: Reflects results following May 2016 Acquisition. Expect Renew Life to contribute 2pts of Sales in FY17
Innovation Spotlight: Cleaning

Innovating to Improve the Cleaning Experience
“Cleaning is boring…
unfulfilling…
And never ending “
Sensorial Efficacious
73% of consumers
seek new
experiences

Clorox® ScentivaTM = Cleaning Power + Scent Experience
Tuscan Lavender & Jasmine Hawaiian Sunshine
Kills 99.9% of Bacteria & Viruses
Cleans, Disinfects and Deodorizes
Two experiential custom blended scents from
top fragrance houses

“I absolutely loved the scent…a lot better than that cleaning-type scent
of other products.”
Experiential Scent Without the Sacrifice
“After cleaning, the scent lingers almost
like I have flowers in the room.”
“I trust the Clorox name and I would love scents that aren't harsh
chemical smells.”
“The fact that it has
good fragrance but is
the Clorox product is a plus.”
ScentivaTM resonates
with both
scent and efficacy
Source for verbatims: SKU BASES CTU 2015

International : 17% Cleaning : 33%
Household : 33% Lifestyle : 17%
Cleaning 33%
Household 33%
Lifestyle 17%
International 17%
Latin America 9%
Canada 3%
Australia / NZ 2%
Rest of World 3%
9%
4%
4%
15%
11%
6%
Home Care 18%
Laundry 9%
Professional 6%
FY16 Company Sales: $5.8B
<1%*
Note: Reflects results following May 2016 Acquisition. Expect Renew Life to contribute 2pts of Sales in FY17
Innovation Spotlight: Lifestyle
Addressing Opportunities in Water Filtration
Opportunity #1 – Driving Household Penetration
Key Consumer Issue: Refilling pitchers takes too long

Introducing Brita® Stream with Filter-As-You-PourTM
Improves convenience by filtering 10x faster
Precision pouring
Modern design
Addressing Opportunities in Water Filtration
Opportunity #2 – Filter Market Share
Key Consumer Issue: Value vs Private Label
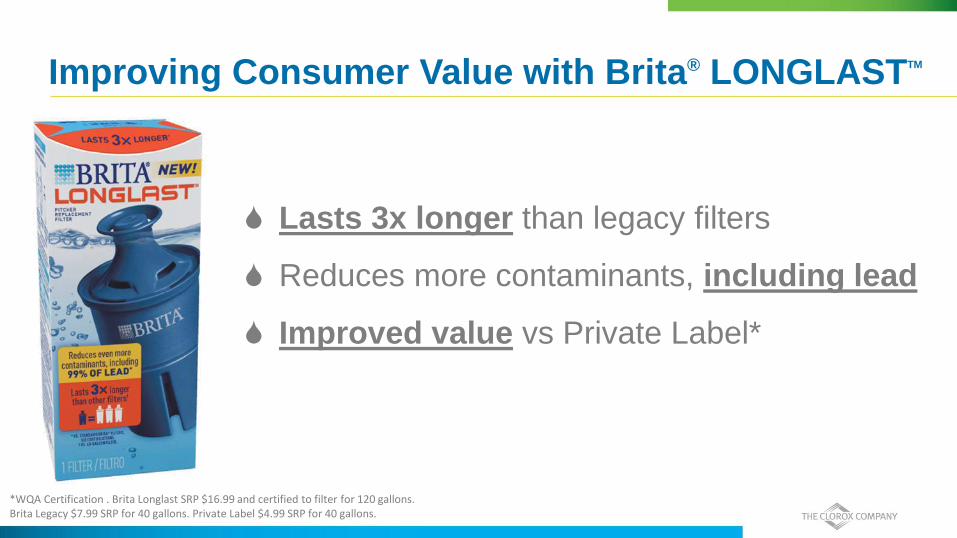
Improving Consumer Value with Brita® LONGLASTTM
Lasts 3x longer than legacy filters
Reduces more contaminants, including lead
Improved value vs Private Label*
*WQA Certification . Brita Longlast SRP $16.99 and certified to filter for 120 gallons. Brita Legacy $7.99 SRP for 40 gallons. Private Label $4.99 SRP for 40 gallons.

Burt’s Bees®: Innovation Focus
Drive
Trial & Awareness on Core
Expand into Adjacencies
International Expansion
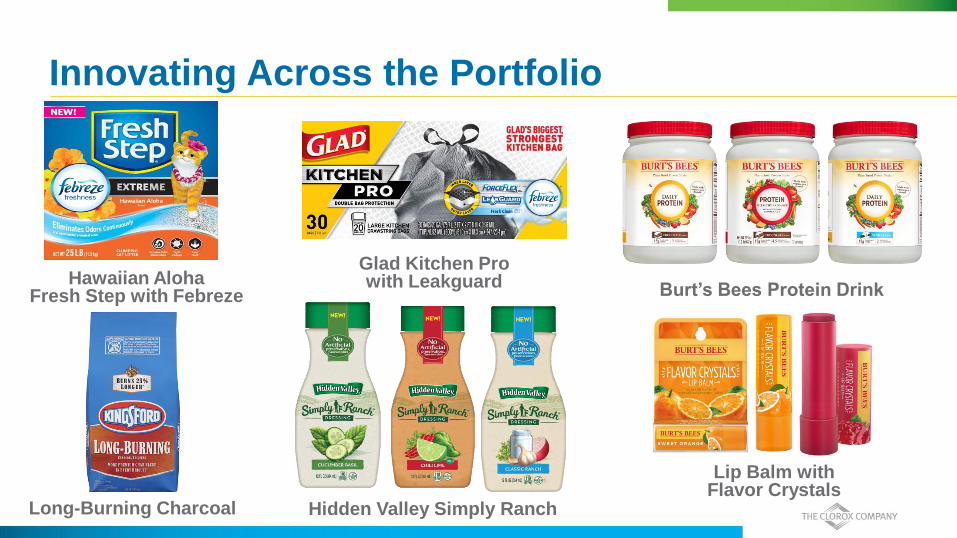
Innovating Across the Portfolio
Hawaiian Aloha Fresh Step with Febreze
Hidden Valley Simply Ranch
Glad Kitchen Pro with Leakguard
Lip Balm with Flavor Crystals
Long-Burning Charcoal
Burt’s Bees Protein Drink

Innovation Drives Value in Multiple Ways
Increases Company
Margin
Improves
Assortment in Store
Drives
Brand Value Perception
Helps
Maintain Pricing Power

Focus on 3D Technology Transformation

Leading the Industry in Digital Consumer Engagement
Clorox now
invests 45%
of our media in
digital
45%
FY14 FY15 FY16 FY17 Proj
Source: Clorox Internal

FY16 FY17 Proj
Winning with e-Commerce Across Portfolio
+30% Sales vs YA
Source: Clorox Internal
• Increase brand investment behind
superior value and more targeted
3D plans
• Keep the core healthy and grow into
new categories and channels
2020 Strategy

e-Commerce Enabled Innovation

Focus on Portfolio Momentum
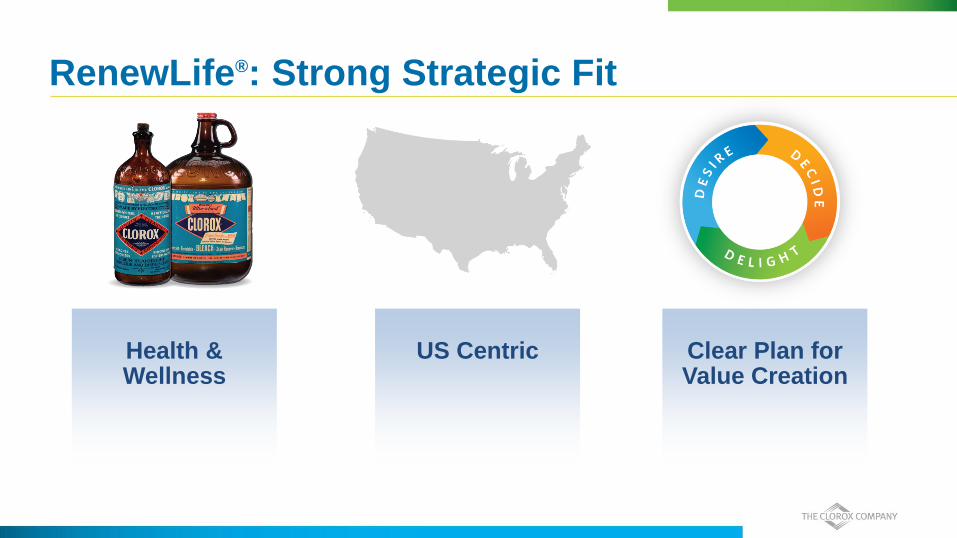
RenewLife®: Strong Strategic Fit
Health & Wellness
US Centric
Clear Plan for Value Creation
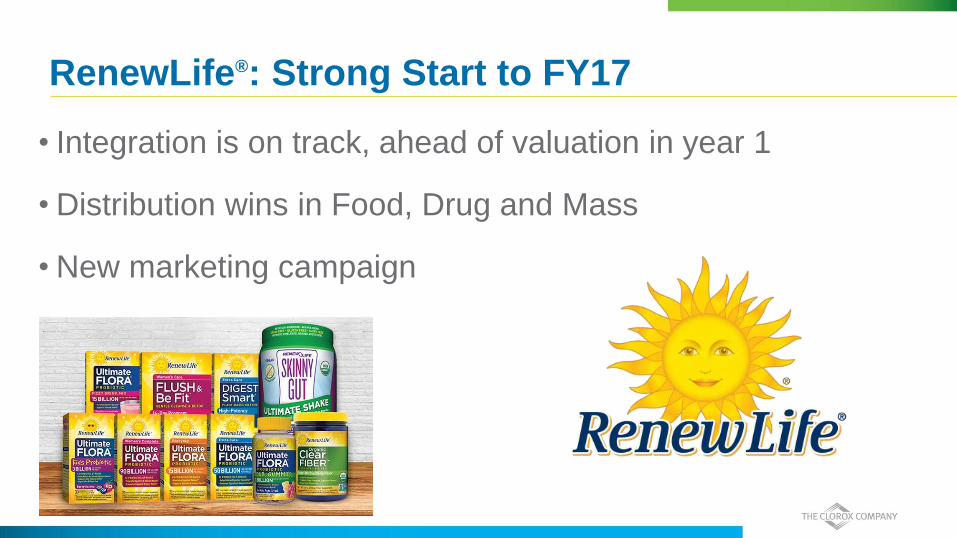
RenewLife®: Strong Start to FY17
• Integration is on track, ahead of valuation in year 1
• Distribution wins in Food, Drug and Mass
• New marketing campaign

Portfolio Segmentation
Sales Growth Potential
High
Low High
Fuel Growth
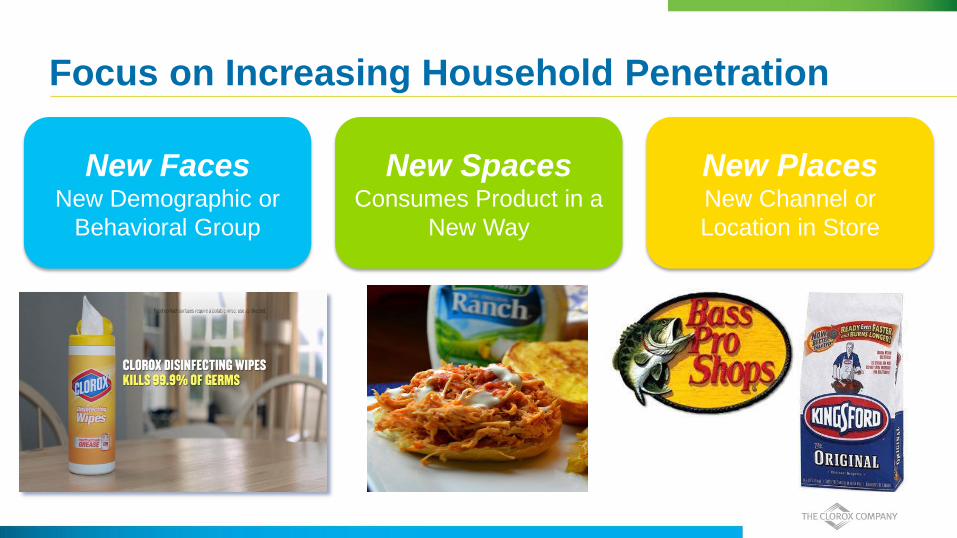
Focus on Increasing Household Penetration
New Faces New Demographic or
Behavioral Group
New Spaces Consumes Product in a
New Way
New Places New Channel or
Location in Store
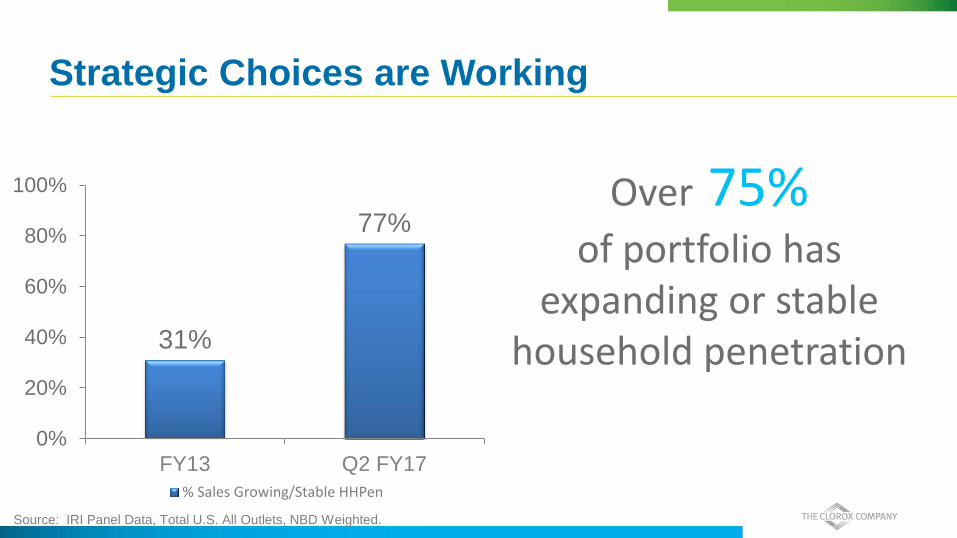
31%
77%
0%
20%
40%
60%
80%
100%
FY13 Q2 FY17
% Sales Growing/Stable HHPen
Over 75% of portfolio has
expanding or stable household penetration
Source: IRI Panel Data, Total U.S. All Outlets, NBD Weighted.
Strategic Choices are Working
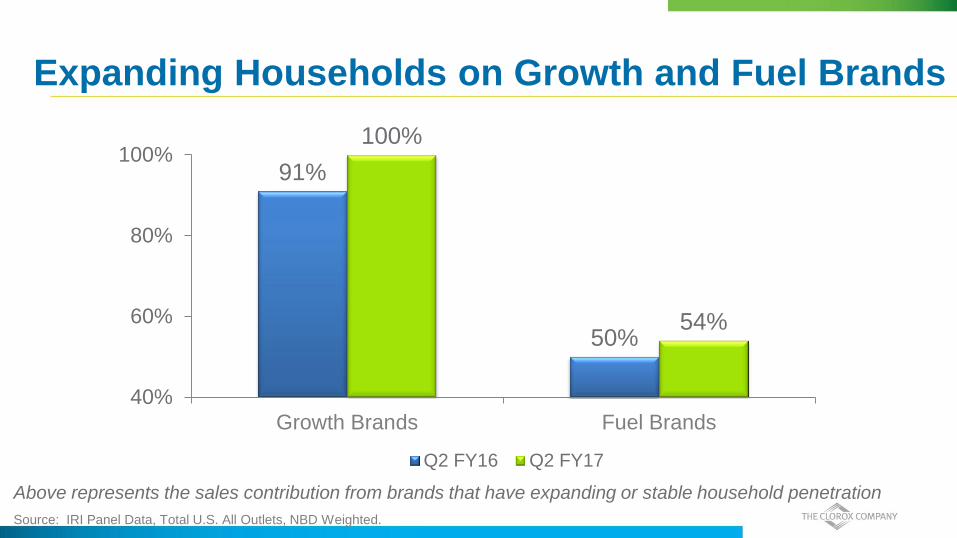
91%
50%
100%
54%
40%
60%
80%
100%
Growth Brands Fuel Brands
Q2 FY16 Q2 FY17
Expanding Households on Growth and Fuel Brands
Source: IRI Panel Data, Total U.S. All Outlets, NBD Weighted.
Above represents the sales contribution from brands that have expanding or stable household penetration

63%
65%
Q2 FY16 Q2 FY17
Household Penetration
+1.25M
Households vs YA
Source: IRI Panel Data, Total U.S. All Outlets, NBD Weighted.
Clorox® Brand is Leading the Way

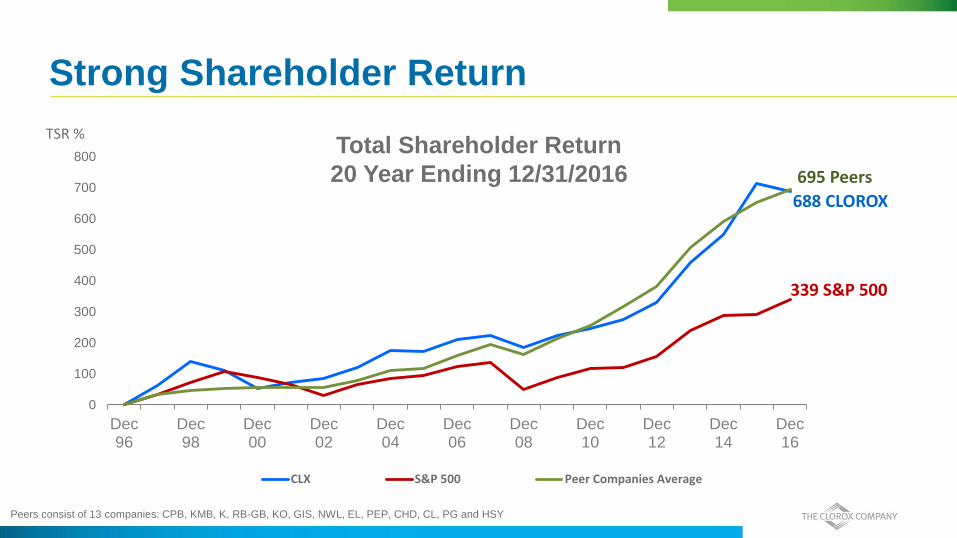
688 CLOROX
339 S&P 500
695 Peers
0
100
200
300
400
500
600
700
800
Dec96
Dec98
Dec00
Dec02
Dec04
Dec06
Dec08
Dec10
Dec12
Dec14
Dec16
CLX S&P 500 Peer Companies Average
TSR %
Strong Shareholder Return
Peers consist of 13 companies: CPB, KMB, K, RB-GB, KO, GIS, NWL, EL, PEP, CHD, CL, PG and HSY
Total Shareholder Return
20 Year Ending 12/31/2016

Strong Shareholder Return, The Right Way

With a Highly Engaged Workforce
86%
77%
85%
70%
80%
90%
2015Clorox
CPG Norm Global HighPerforming
Co.
Top 5%
CPG Norm: The Towers Watson global fast-moving consumer goods norm is based on responses from more than 126,346 employees from 61 global organizations.
Global High Performing Companies: The Towers Watson Global High Performance Norm is comprised of a weighted average of employee survey results. Companies qualify for
the norm by meeting two criteria: (a) superior financial performance, defined by a net profit margin and/or return on invested capital that exceeds industry averages; and (b) superior
human resource practices, defined by employee opinion scores near the top among the most financially successful companies surveyed by Towers Watson. This norm includes
responses from over 145,000 employees at 28 global organizations.
“I am empowered to make the decisions needed to do my job well.”
“Clorox has established a climate where one can
challenge our traditional ways of doing things.”
“I understand how my work contributes to Clorox's strategy.”

Key Messages
• Strategy focus on profitable growth continues to produce
strong results
• We are confident in our business plans
Steve Robb Chief Financial Officer
Key Messages
• Strategy focus on profitable growth continues to produce
strong results
• We are confident in our business plans
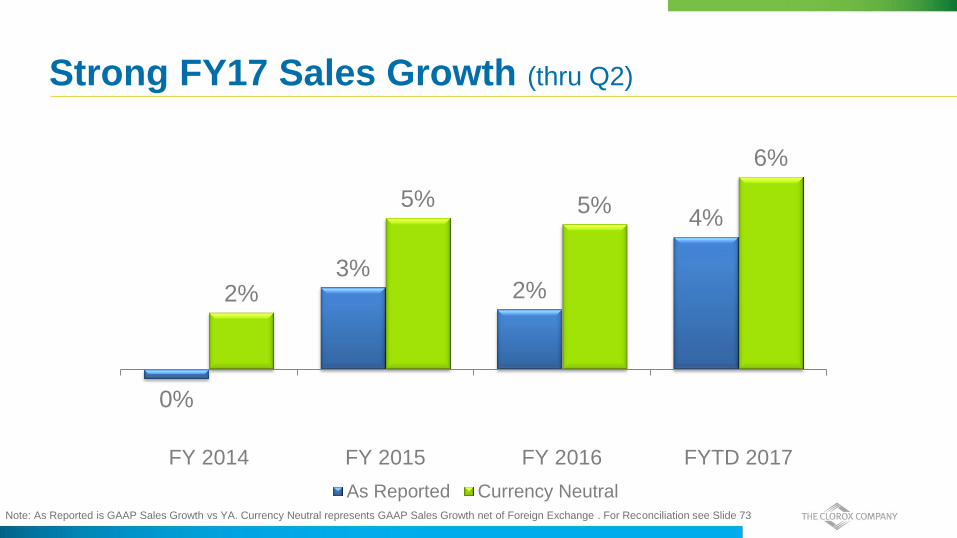
Strong FY17 Sales Growth (thru Q2)
0%
3% 2%
4%
2%
5% 5%
6%
FY 2014 FY 2015 FY 2016 FYTD 2017
As Reported Currency NeutralNote: As Reported is GAAP Sales Growth vs YA. Currency Neutral represents GAAP Sales Growth net of Foreign Exchange . For Reconciliation see Slide 73

FY17 Outlook Based on Feb 3rd Earnings Call
• Categories: about 1%
• Innovation: +3pts
• Renew Life: +2pts
• Mix/Other: about -1pt
• FX: -1pt to -2pts Sales
+3% to +4%
EBIT Margin +25 to +50bps
Diluted EPS $5.23 to $5.38
(+6% to +9%)
• Gross Margin: Down slightly
• Selling & Admin: <14% of Sales
• Advertising & Sales Promotion: about 10% of Sales
• Tax rate: 32% to 33%
EBIT (a non-GAAP measure) represents earnings from continuing operations before income taxes (a GAAP measure), excluding interest income &
interest expense. EBIT margin is a measure of EBIT as a percentage of sales.
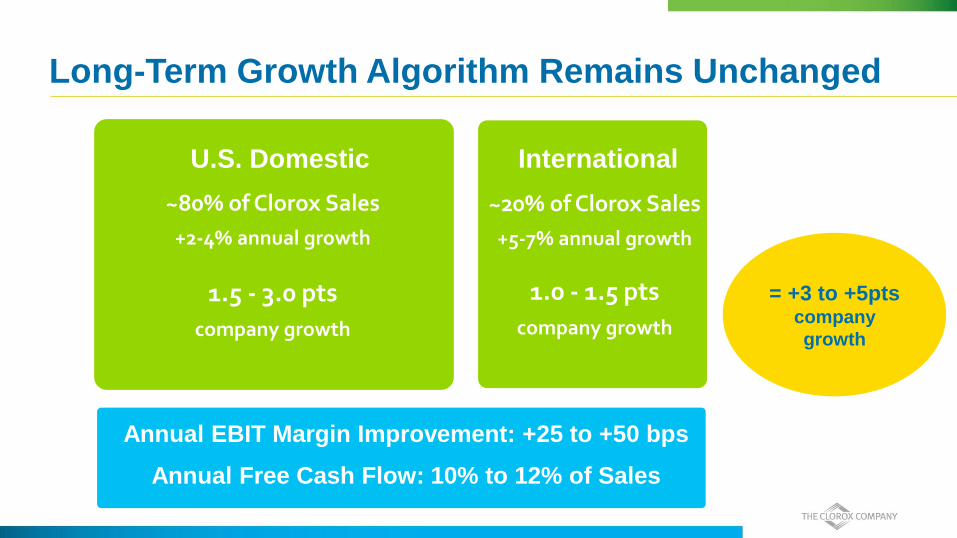
Long-Term Growth Algorithm Remains Unchanged
~80% of Clorox Sales
+2-4% annual growth
1.5 - 3.0 pts
company growth
U.S. Domestic
~20% of Clorox Sales
+5-7% annual growth
1.0 - 1.5 pts
company growth
International
Annual EBIT Margin Improvement: +25 to +50 bps
Annual Free Cash Flow: 10% to 12% of Sales
= +3 to +5pts company
growth
Focused on Long-Term Gross Margin Expansion
Focus on
International Profitability
Margin Accretive
Innovation & Pricing
Investing Behind
Cost Savings

Cost Savings Continue to Deliver
0 bps
50 bps
100 bps
150 bps
200 bps
250 bps
FY13 FY14 FY15 FY16 FY17+
EBIT Margin Benefit from Cost Savings
+150bps
Annual
Goal
EBIT (a non-GAAP measure) represents earnings from continuing operations before income taxes (a GAAP measure), excluding interest income &
interest expense. EBIT margin is a measure of EBIT as a percentage of sales. See reconcilation on our website
(https://investors.thecloroxcompany.com/investors/financial-information/quarterly-results/default.aspx) and on slide 76 and 77
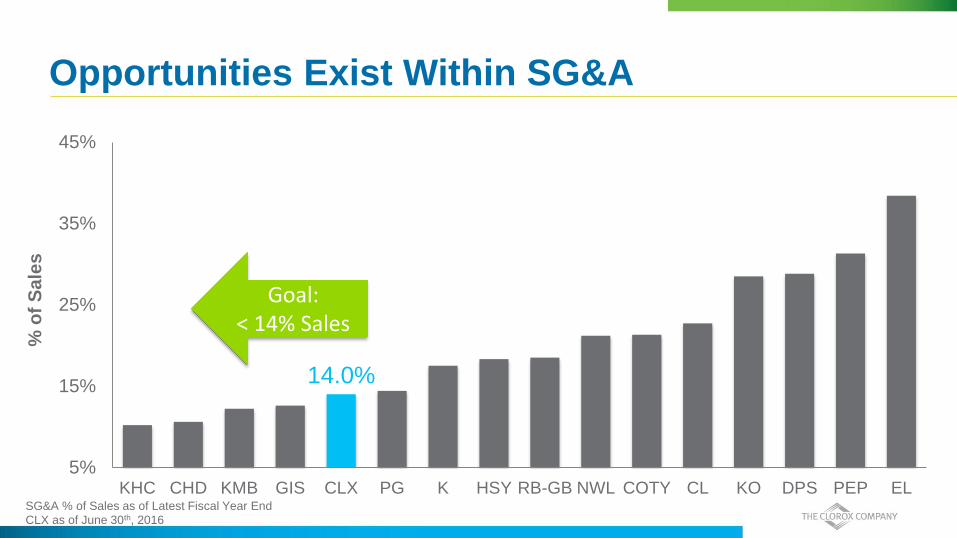
Opportunities Exist Within SG&A
14.0%
5%
15%
25%
35%
45%
KHC CHD KMB GIS CLX PG K HSY RB-GB NWL COTY CL KO DPS PEP EL
% o
f S
ale
s
Goal: < 14% Sales
SG&A % of Sales as of Latest Fiscal Year End
CLX as of June 30th, 2016

Top-Tier ROIC
Peer Average: 15%
Return on invested capital (ROIC), a non-GAAP measure, is calculated as earnings from continuing operations before income taxes and interest expense, computed on an
after-tax basis as a percentage of average invested capital. Average invested capital represents a five quarter average of total assets less non-interest bearing liabilities. ROIC
is a measure of how effectively the company allocates capital. Information on the Peer ROIC is based on publicly available Fiscal-end data (FactSet) as of 6/30/2016. See
Slide 81 and 82 for reconciliation.
29%
0%
10%
20%
30%
CLX KMB CL HSY EL RB-GB DPS CHD CPB GIS PEP PG KO K COTY KHC NWL
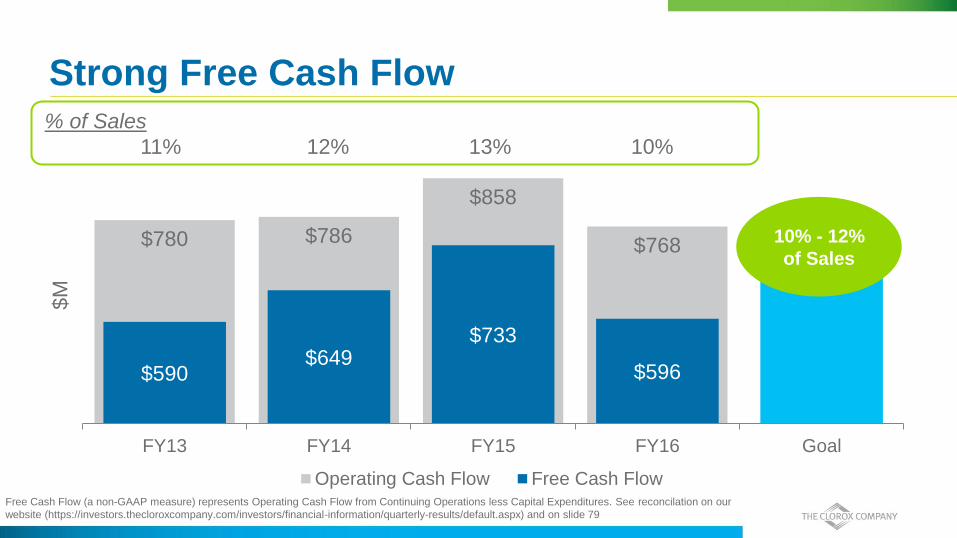
$780 $786
$858
$768
$590 $649
$733
$596
FY13 FY14 FY15 FY16 Goal
$M
Operating Cash Flow Free Cash Flow
Strong Free Cash Flow
10% - 12%
of Sales
Free Cash Flow (a non-GAAP measure) represents Operating Cash Flow from Continuing Operations less Capital Expenditures. See reconcilation on our
website (https://investors.thecloroxcompany.com/investors/financial-information/quarterly-results/default.aspx) and on slide 79
% of Sales
11% 12% 13% 10%

Use of Cash Priorities
Business Growth (includes targeted M&A)
Support Dividend
Share Repurchases Debt Leverage1
(Target: 2.0 – 2.5x)
Free
Cash
Flow
1. Debt Leverage = Gross Debt / EBITDA
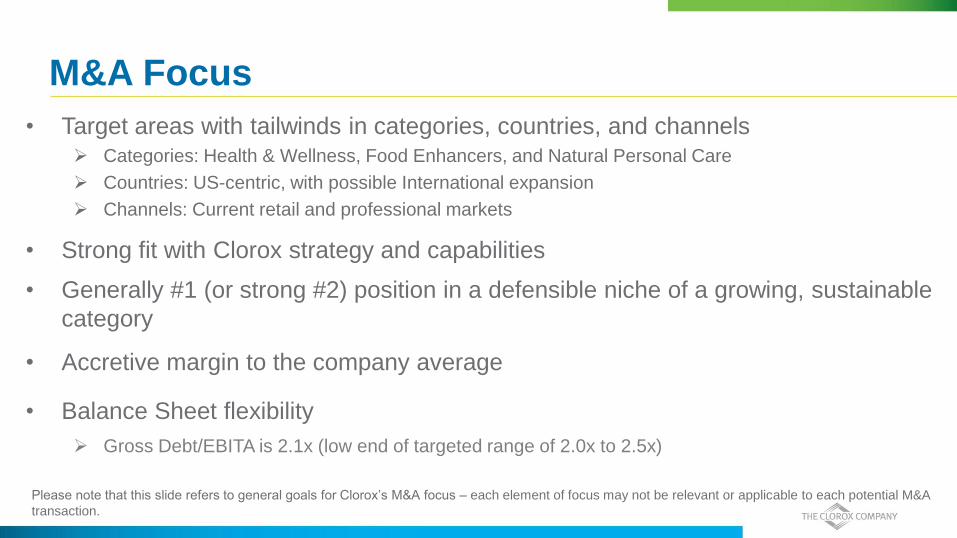
M&A Focus
• Target areas with tailwinds in categories, countries, and channels Categories: Health & Wellness, Food Enhancers, and Natural Personal Care
Countries: US-centric, with possible International expansion
Channels: Current retail and professional markets
• Strong fit with Clorox strategy and capabilities
• Generally #1 (or strong #2) position in a defensible niche of a growing, sustainable
category
• Accretive margin to the company average
• Balance Sheet flexibility
Gross Debt/EBITA is 2.1x (low end of targeted range of 2.0x to 2.5x)
Please note that this slide refers to general goals for Clorox’s M&A focus – each element of focus may not be relevant or applicable to each potential M&A
transaction.

Nearly $2B Returned to Shareholders
in the Last 4 Years FY16
Dividend
Payout Ratio
= 61%
$590 $649
$733
$596
$330
$532 $568
$442
FY13 FY14 FY15 FY16
$ M
Free Cash Flow Cash Returned to Shareholders
Free Cash Flow (a non-GAAP measure) represents Operating Cash Flow from Continuing Operations less Capital Expenditures. See reconcilation on our
website (https://investors.thecloroxcompany.com/investors/financial-information/quarterly-results/default.aspx) and on slide 79

Healthy Dividend Growth…
Dividends Have Increased Each Year Since 1977
0%
1%
2%
3%
4%
COTY KO KMB PG GIS K PEP KHC CLX CL HSY DPS CPB RB-GB NWL CHD EL
2.6% Peer Average: 2.5%
Dividend Yield as of Dec 31st, 2016

Long-Term Investment Case Remains Solid
• Investing behind leading brands to grow categories and share − 3%+ annual growth from innovation
− Advertising projected at about 10% of Sales in FY17
• Margin improvement opportunities continue to exist − Strong cost savings track record
− Driving SG&A to below 14% of sales
• Strong cash flow generation − Goal to generate Free Cash Flow of 10-12% of sales
− +4% dividend increase in 2016
688 CLOROX
339 S&P 500
695 Peers
0
100
200
300
400
500
600
700
800
Dec96
Dec98
Dec00
Dec02
Dec04
Dec06
Dec08
Dec10
Dec12
Dec14
Dec16
CLX S&P 500 Peer Companies Average
TSR %
Strong Shareholder Return
Peers consist of 13 companies: CPB, KMB, K, RB-GB, KO, GIS, NWL, EL, PEP, CHD, CL, PG and HSY
Total Shareholder Return
20 Year Ending 12/31/2016

Areas We Are Watching
• Challenging global macroeconomic environment
• Commodity costs are expected to continue to firm up
• Potential for tax reform

Key Messages
• Strategy focus on profitable growth continues to produce
strong results
• We are confident in our business plans

Appendix

Advantaged Portfolio Strong Position in Categories with Private Label Exposure
Clorox Private Label Other
59% 35%
Bleach
Kingsford Private Label Other
Charcoal
74%
17%
Glad Private Label Hefty Other
Trash Bags
31%
44%
17%
Source: $ Market Share IRI MULOP 52 weeks ending 12/18/16
Note: Sales from above business units represent approx. 35% of portfolio

Advantaged Portfolio
#1 or #2 Market Share in Competitive Categories
Source: $ Market Share IRI MULOP 52 weeks ending 12/18/16
Note: Sales from above business units represent approx. 33% of portfolio

Corporate Responsibility at Clorox
<A> Reviewed by Ernst & Young LLP Footnotes: http://annualreport.thecloroxcompany.com/_pdf/CLX-012_2016_Integrated_Report.pdf page 27
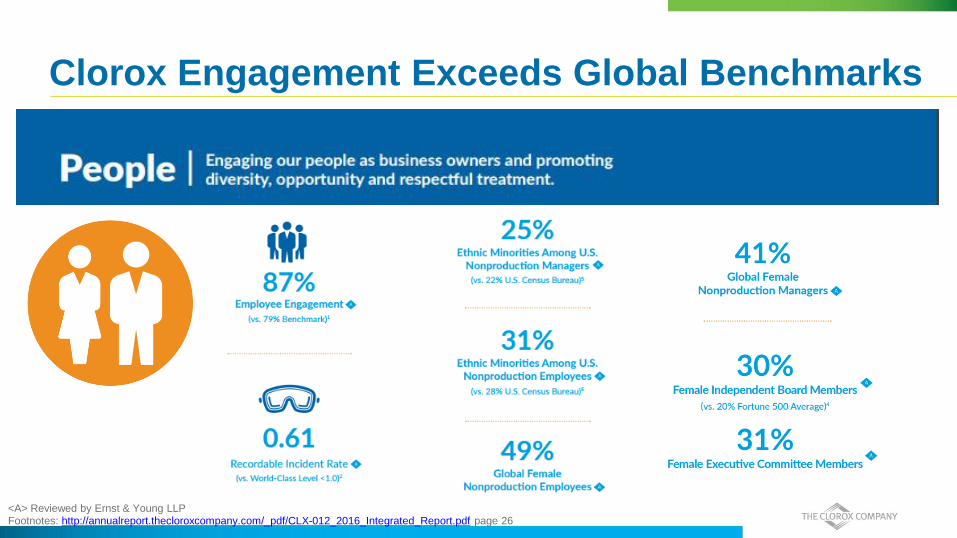
Clorox Engagement Exceeds Global Benchmarks
<A> Reviewed by Ernst & Young LLP Footnotes: http://annualreport.thecloroxcompany.com/_pdf/CLX-012_2016_Integrated_Report.pdf page 26

$ in B FY13 FY14 FY15 FY16
EBITDA $1.2 $1.1 $1.2 $1.2
Total Debt / EBITDA 2.1x 2.0x 1.8x 1.9x
EBITDA Interest Coverage 9.5x 11.3x 11.9x 14.0x
EBIT / Interest 8.0x 9.6x 10.2x 12.1x
Free Cash Flow / Debt 25% 28% 33% 26%
FCF after Dividends / Debt 10% 12% 16% 9%
FCF as % of sales 10% 12% 13% 10%
FCF after Dividends as % of Sales 4% 5% 6% 3%
Long Term Credit Ratings BBB+ /Baa1
BBB+/Baa1 BBB+/Baa1 A- / Baa1
CP Ratings A-2/P-2 A-2/P-2 A-2/P-2 A-2/P-2
Key Credit Metrics
Note: EBIT, EBITDA, FCF are Non-GAAP measures with reconciliations available on slides 76-80

Currency Neutral Net Sales Reconciliation
Q2 FYTD
Fiscal
2017
Q2 FYTD
Fiscal
2016
FY
Fiscal
2016
FY
Fiscal
2015
FY
Fiscal
2014
Total Net Sales Growth – GAAP 4.2% 1.4% 1.9% 2.6% -0.3%
Less: Foreign exchange -1.9% -2.8% -2.7% -2.1% -2.0%
Currency-Neutral Net Sales Growth - Non-GAAP(1) 6.1% 4.2% 4.6% 4.7% 1.7%
(1) Currency-neutral net sales growth represents GAAP net sales growth excluding the impact of the change in foreign currency exchange rates, and is
calculated by re-measuring the current period new sales using the comparable prior year’s exchange rates.

Gross Margin Reconciliation
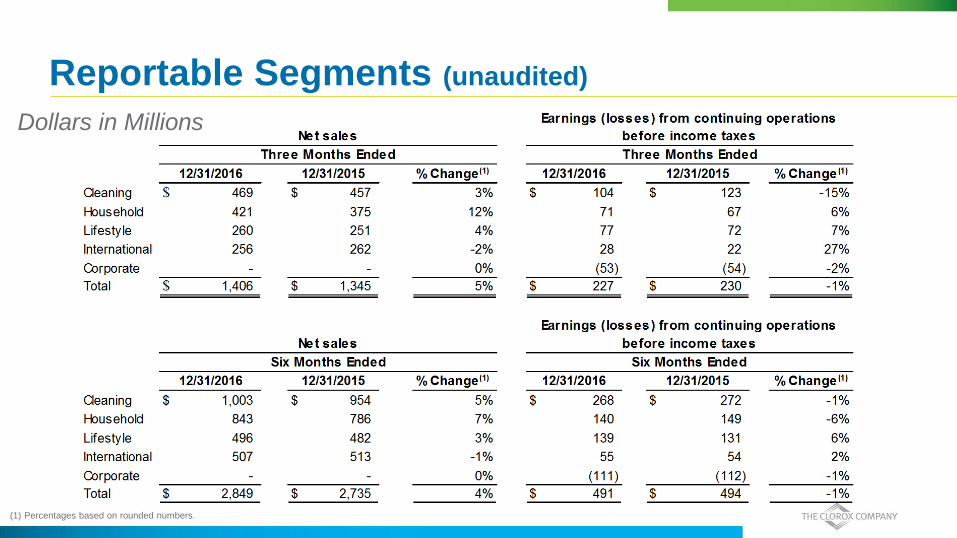
Reportable Segments (unaudited)
Dollars in Millions
(1) Percentages based on rounded numbers.

EBIT and EBITDA (unaudited)
Dollars in Millions
Footnotes on Slide 78

EBIT and EBITDA (unaudited)
Dollars in Millions
Footnotes on Slide 78

EBIT and EBITDA (unaudited)
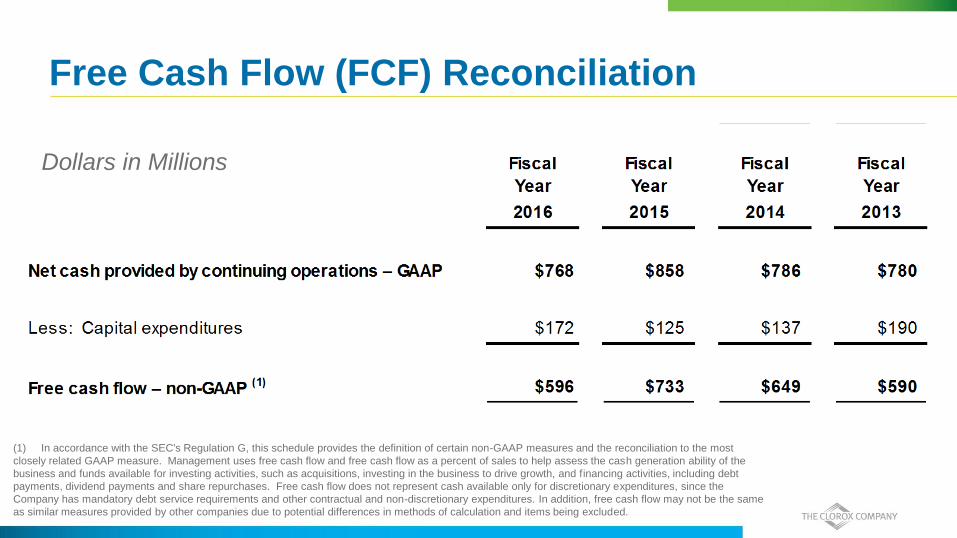
Free Cash Flow (FCF) Reconciliation
Dollars in Millions
(1) In accordance with the SEC's Regulation G, this schedule provides the definition of certain non-GAAP measures and the reconciliation to the most
closely related GAAP measure. Management uses free cash flow and free cash flow as a percent of sales to help assess the cash generation ability of the
business and funds available for investing activities, such as acquisitions, investing in the business to drive growth, and financing activities, including debt
payments, dividend payments and share repurchases. Free cash flow does not represent cash available only for discretionary expenditures, since the
Company has mandatory debt service requirements and other contractual and non-discretionary expenditures. In addition, free cash flow may not be the same
as similar measures provided by other companies due to potential differences in methods of calculation and items being excluded.
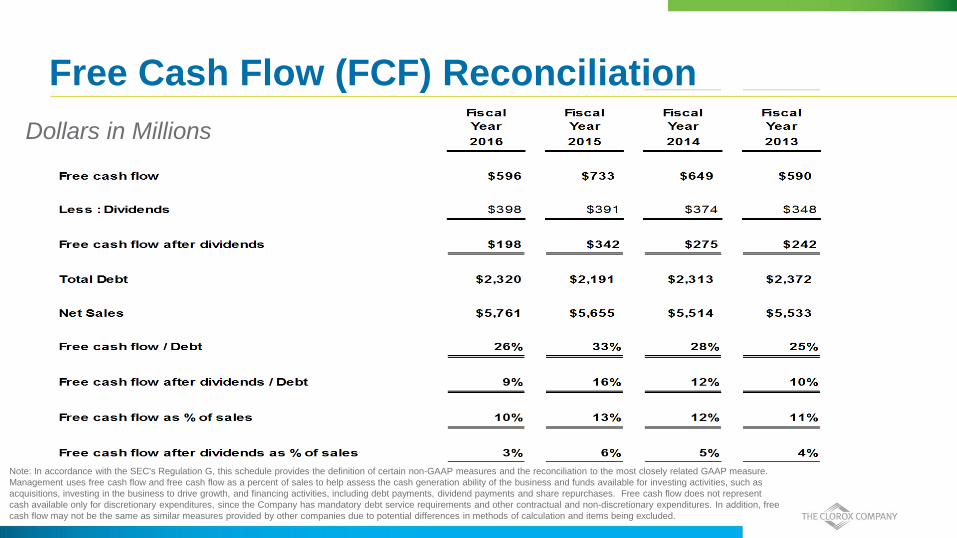
Free Cash Flow (FCF) Reconciliation
Dollars in Millions
Note: In accordance with the SEC's Regulation G, this schedule provides the definition of certain non-GAAP measures and the reconciliation to the most closely related GAAP measure.
Management uses free cash flow and free cash flow as a percent of sales to help assess the cash generation ability of the business and funds available for investing activities, such as
acquisitions, investing in the business to drive growth, and financing activities, including debt payments, dividend payments and share repurchases. Free cash flow does not represent
cash available only for discretionary expenditures, since the Company has mandatory debt service requirements and other contractual and non-discretionary expenditures. In addition, free
cash flow may not be the same as similar measures provided by other companies due to potential differences in methods of calculation and items being excluded.

Return on Invested Capital (ROIC) Reconciliation Dollars in millions and all calculations based on rounded numbers
FY16
$ 983
88
$ 1,071
$ (365)
$ 706
$ 2,457
29%Return on invested capital (1)
Earnings from continuing operations before income taxes
Earnings from continuing operations before income taxes
and interest expense
Average invested capital (3)
Income taxes on earnings from continuing operations before
income taxes and interest expense (2)
Interest expense
Adjusted after-tax profit
(1) In accordance with SEC's Regulation G, this schedule provides the definition of a non-GAAP measure and the reconciliation to the most closely related GAAP measure. Return on invested capital (ROIC), a non-GAAP measure, is calculated as earnings from continuing operations before income taxes and interest expense, computed on an after-tax basis as a percentage of average invested capital. Management believes ROIC provides additional information to investors about current trends in the business. ROIC is a measure of how effectively the company allocates capital.
(2) The tax rate applied is the effective tax rate on continuing operations, which was 34.1%.
(3) Average invested capital represents a five quarter average of total assets less non-interest bearing liabilities.
(Amounts shown below are five quarter averages) FY16
Total assets 4,247$
Less: non-interest bearing liabilities (1,790)
Average invested capital 2,457$
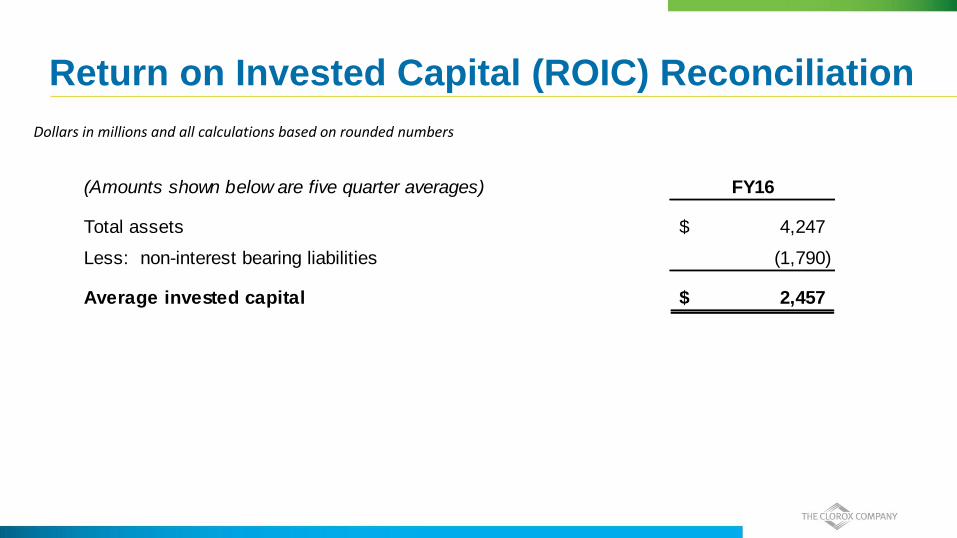
Return on Invested Capital (ROIC) Reconciliation
Dollars in millions and all calculations based on rounded numbers
FY16
$ 983
88
$ 1,071
$ (365)
$ 706
$ 2,457
29%Return on invested capital (1)
Earnings from continuing operations before income taxes
Earnings from continuing operations before income taxes
and interest expense
Average invested capital (3)
Income taxes on earnings from continuing operations before
income taxes and interest expense (2)
Interest expense
Adjusted after-tax profit
(1) In accordance with SEC's Regulation G, this schedule provides the definition of a non-GAAP measure and the reconciliation to the most closely related GAAP measure. Return on invested capital (ROIC), a non-GAAP measure, is calculated as earnings from continuing operations before income taxes and interest expense, computed on an after-tax basis as a percentage of average invested capital. Management believes ROIC provides additional information to investors about current trends in the business. ROIC is a measure of how effectively the company allocates capital.
(2) The tax rate applied is the effective tax rate on continuing operations, which was 34.1%.
(3) Average invested capital represents a five quarter average of total assets less non-interest bearing liabilities.
(Amounts shown below are five quarter averages) FY16
Total assets 4,247$
Less: non-interest bearing liabilities (1,790)
Average invested capital 2,457$
Dollars in millions and all calculations based on rounded numbers