2017 CAGNY Presentation - Kellogg'sinvestor.kelloggs.com/.../2017/cagny-presentation.pdf · Kellogg...
28
Kellogg Company February 21, 2017 Page 1 of 28 CAGNY February 21, 2017 CAGNY 2017 Forward-Looking Statements CAGNY 2017 2 This presentation contains, or incorporates by reference, “forward-looking statements” with projections concerning, among other things, the Company’s global growth and efficiency program (Project K), the integration of acquired businesses, the Company’s strategy, zero-based budgeting, and the Company’s sales, earnings, margin, operating profit, costs and expenditures, interest expense, tax rate, capital expenditure, dividends, cash flow, debt reduction, share repurchases, costs, charges, rates of return, brand building, ROIC, working capital, growth, new products, innovation, cost reduction projects, workforce reductions, savings, and competitive pressures. Forward-looking statements include predictions of future results or activities and may contain the words “expects,” “believes,” “should,” “will,” “anticipates,” “projects,” “estimates,” “implies,” “can,” or words or phrases of similar meaning. The Company’s actual results or activities may differ materially from these predictions. The Company’s future results could also be affected by a variety of factors, including the ability to implement Project K (including the exit from its Direct Story Delivery system) as planned, whether the expected amount of costs associated with Project K will differ from forecasts, whether the Company will be able to realize the anticipated benefits from Project K in the amounts and times expected, the ability to realize the anticipated benefits from Revenue Growth Management, the ability to realize the anticipated benefits and synergies from the acquisitions in the amounts and at the times expected, the impact of competitive conditions; the effectiveness of pricing, advertising, and promotional programs; the success of innovation, renovation and new product introductions; the recoverability of the carrying value of goodwill and other intangibles; the success of productivity improvements and business transitions; commodity and energy prices; labor costs; disruptions or inefficiencies in supply chain; the availability of and interest rates on short-term and long-term financing; actual market performance of benefit plan trust investments; the levels of spending on systems initiatives, properties, business opportunities, integration of acquired businesses, and other general and administrative costs; changes in consumer behavior and preferences; the effect of U.S. and foreign economic conditions on items such as interest rates, statutory tax rates, currency conversion and availability; legal and regulatory factors including changes in food safety, advertising and labeling laws and regulations; the ultimate impact of product recalls; business disruption or other losses from war, terrorist acts or political unrest; and other items. Forward-looking statements speak only as of the date they were made, and the Company undertakes no obligation to update them publicly. This presentation includes non‐GAAP financial measures. Please refer to the Appendices for a reconciliation of these non‐GAAP financial measures to the most directly comparable GAAP financial measures. Management believes that the use of such non-GAAP measures assists investors in understanding the underlying operating performance of the company and its segments.
Transcript of 2017 CAGNY Presentation - Kellogg'sinvestor.kelloggs.com/.../2017/cagny-presentation.pdf · Kellogg...

Kellogg Company February 21, 2017
Page 1 of 28
CAGNYFebruary 21, 2017
CAGNY 2017
Forward-Looking Statements
CAGNY 2017 2
This presentation contains, or incorporates by reference, “forward-looking statements” with projections concerning, among other things, the Company’s global growth and efficiency program (Project K), the integration of acquired businesses, the Company’s strategy, zero-based budgeting, and the Company’s sales, earnings, margin, operating profit, costs and expenditures, interest expense, tax rate, capital expenditure, dividends, cash flow, debt reduction, share repurchases, costs, charges, rates of return, brand building, ROIC, working capital, growth, new products, innovation, cost reduction projects, workforce reductions, savings, and competitive pressures. Forward-looking statements include predictions of future results or activities and may contain the words “expects,” “believes,” “should,” “will,” “anticipates,” “projects,” “estimates,” “implies,” “can,” or words or phrases of similar meaning.
The Company’s actual results or activities may differ materially from these predictions. The Company’s future results could also be affected by a variety of factors, including the ability to implement Project K (including the exit from its Direct Story Delivery system) as planned, whether the expected amount of costs associated with Project K will differ from forecasts, whether the Company will be able to realize the anticipated benefits from Project K in the amounts and times expected, the ability to realize the anticipated benefits from Revenue Growth Management, the ability to realize the anticipated benefits and synergies from the acquisitions in the amounts and at the times expected, the impact of competitive conditions; the effectiveness of pricing, advertising, and promotional programs; the success of innovation, renovation and new product introductions; the recoverability of the carrying value of goodwill and other intangibles; the success of productivity improvements and business transitions; commodity and energy prices; labor costs; disruptions or inefficiencies in supply chain; the availability of and interest rates on short-term and long-term financing; actual market performance of benefit plan trust investments; the levels of spending on systems initiatives, properties, business opportunities, integration of acquired businesses, and other general and administrative costs; changes in consumer behavior and preferences; the effect of U.S. and foreign economic conditions on items such as interest rates, statutory tax rates, currency conversion and availability; legal and regulatory factors including changes in food safety, advertising and labeling laws and regulations; the ultimate impact of product recalls; business disruption or other losses from war, terrorist acts or political unrest; and other items.
Forward-looking statements speak only as of the date they were made, and the Company undertakes no obligation to update them publicly.
This presentation includes non‐GAAP financial measures. Please refer to the Appendices for a reconciliation of these non‐GAAP financial measures to the most directly comparable GAAP financial measures. Management believes that the use of such non-GAAP measures assists investors in understanding the underlying operating performance of the company and its segments.

Kellogg Company February 21, 2017
Page 2 of 28
CAGNY 2017
CFO Transition
Thanks, Ron! Welcome, Fareed!
3
CAGNY 2017
Agenda
• Kellogg Company – Solidly on 2020 Growth Plan
• Kellogg North America – Prioritizing to Win
• U.S. Snacks – Transforming our Business
• Closing Remarks
4

Kellogg Company February 21, 2017
Page 3 of 28
CAGNY 2017
2020 Growth Plan – Kellogg Company
5
CAGNY 2017
Win in Breakfast
StabilizeCore 4
DevelopedMarkets
GrowEmergingMarkets
6

Kellogg Company February 21, 2017
Page 4 of 28
CAGNY 2017
Global Snacks Powerhouse
• Pringles growth in all Regions in 2016
• Dedicated Teams
• Revitalized Wholesome Snacks in International
2012 2013 2014 2015 2016
Kellogg International Snacks, in Kilos
+8%CAGR
2013-2016
Acquisition
7
CAGNY 2017
Emerging Markets Engine
Kellogg Emerging-Markets Volume in Tons
• Household penetration• Geographic expansion
• Acquisitions
Plus: • Joint Ventures
2012 2016
4.5%CAGR
2013-2016x-JVs and Parati
Joint Ventures
Parati, 2017
8

Kellogg Company February 21, 2017
Page 5 of 28
CAGNY 2017
Win Where the Shopper Shops
Increased small can
availability
Winning Wholesome
Snacks
Evolved Cereal offer
to win
Expanding distribution in emerging markets
High Frequency Stores
Route to Market Winning Portfolio
E-Commerce
• Digital Shelf• Click & Collect• Home Delivery
9
• Local distributors• Acquired capabilities and
scale
CAGNY 2017
Margin Expansion
• Ongoing• Project K• ZBB
Invest forImpact
PriceRealization
Productivity
10.0%
12.5%
15.0%
17.5%
20.0%
2015 2016 2017E 2018E
Currency-Neutral Comparable Basis, Operating Profit as % of Net Sales, Excluding Venezuela *
14.4%
• ROI• New Marketing model
~18%
• Revenue Growth Management
On-TrendFood
• Renovation• Innovation
15.4%+100+ bp
10
* See Appendix for reconciliation.
Kellogg Company February 21, 2017
Page 6 of 28
CAGNY 2017
Agenda
• Kellogg Company – Solidly on 2020 Growth Plan
• Kellogg North America – Prioritizing to Win
• U.S. Snacks – Transforming our Business
• Closing Remarks
11
CAGNY 2017
Kellogg North America
Snacks Morning Foods
Specialty
Frozen
Canada
Kashi
North AmericaOther
Category Share Position(a)
RTEC
Toaster Pastries
Crackers
Cookies
Wholesome Snacks
Frozen Waffles
Frozen Veggie(b)
#1
#1
#2
#2
#2
#1
#1(a) A.C. Nielsen, xAOC, 52 weeks through 12/31/16(b) Frozen Meat Substitutes
A Diverse Portfolio / Strong Category-Leading Positions
12
Net Sales
Kellogg Company February 21, 2017
Page 7 of 28
CAGNY 2017
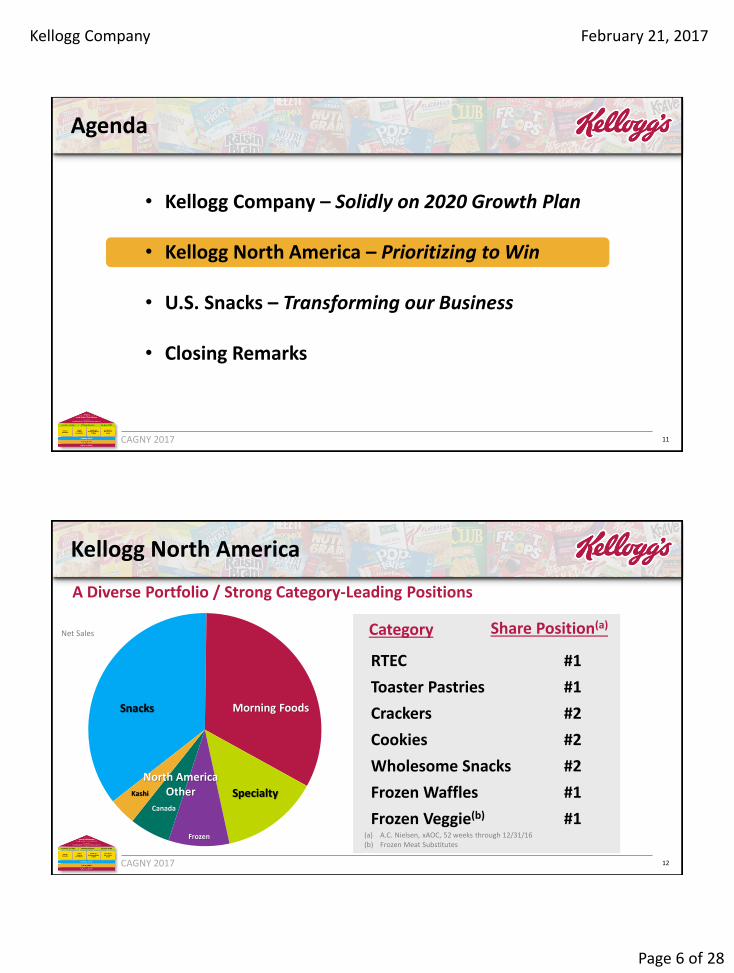
Unlocking KNA’s Full Potential
Invest with Impact
Portfolio Prioritization
Operational Excellence
• Where to play, how to win
• Shift investment to highest ROI
• Build Capabilities
13
CAGNY 2017
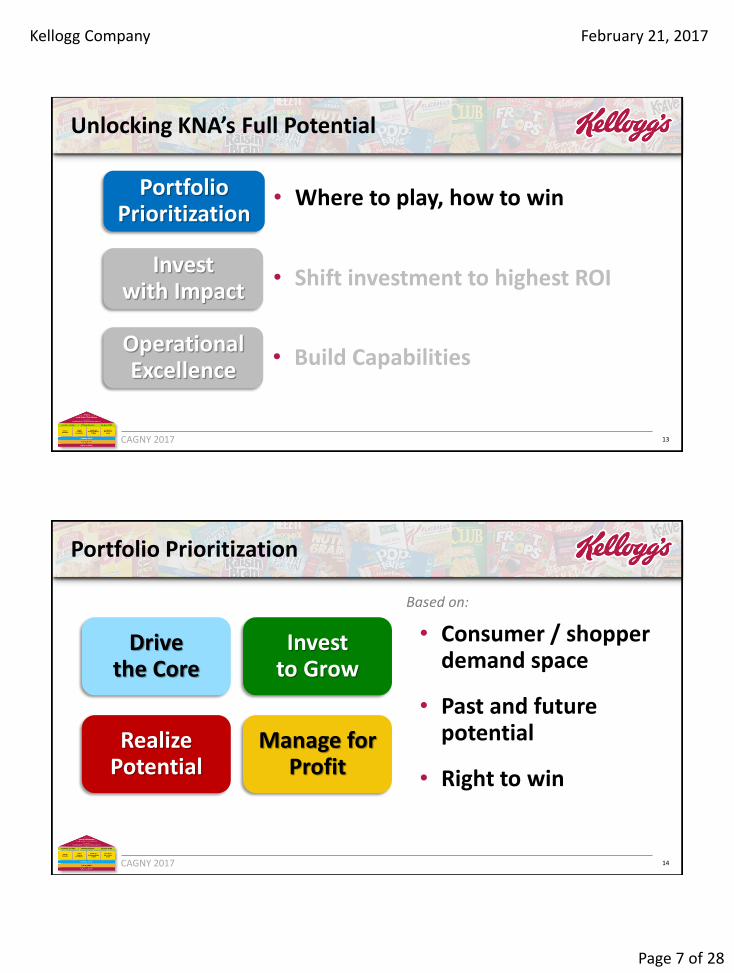
Portfolio Prioritization
Invest to Grow
Drive the Core
Manage for Profit
Realize Potential
• Consumer / shopper demand space
• Past and future potential
• Right to win
Based on:
14

Kellogg Company February 21, 2017
Page 8 of 28
CAGNY 2017
Driving the Core – Improving Performance
Drive the Core
• Biggest Core brands already improving share
• Significant scale
• High margin
• Powerful brand equities, cover broad set of needs
15
~40% of KNA sales
CAGNY 2017
Core 6 Cereal – Growing Share
• Our improved consumption and share performance has been driven by Core 6 brands
22.3
22.722.9
2014 2015 2016
Share of U.S. RTEC CategoryCore 6 Kellogg’s Brands
Source: Nielsen, xAOC, 52-week periods
Drive the Core
16
Kellogg Company February 21, 2017
Page 9 of 28
CAGNY 2017
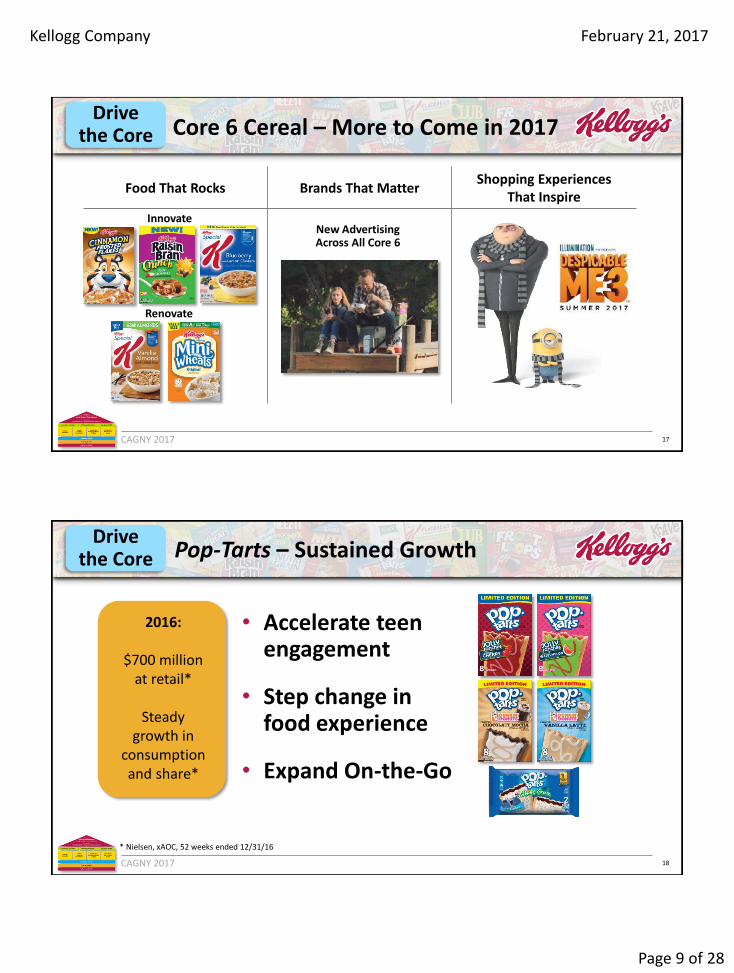
Food That Rocks Brands That MatterShopping Experiences
That Inspire
Innovate
Renovate
New Advertising Across All Core 6
Core 6 Cereal – More to Come in 2017Drive
the Core
17
CAGNY 2017
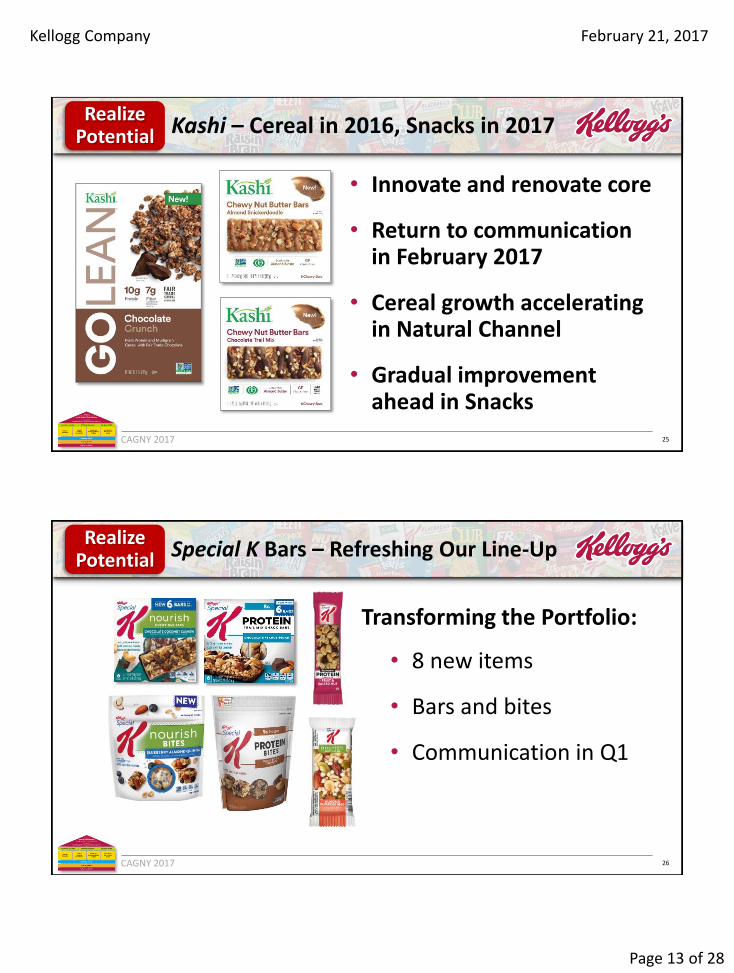
Pop-Tarts – Sustained Growth
• Accelerate teen engagement
• Step change in food experience
• Expand On-the-Go
* Nielsen, xAOC, 52 weeks ended 12/31/16
Drive the Core
2016:
$700 million at retail*
Steady growth in
consumption and share*
18

Kellogg Company February 21, 2017
Page 10 of 28
CAGNY 2017
Eggo – Returning to Growth
• Core renovation (removal of artificials)
• Family fun
• Increased brand building 2017
Drive the Core
2016:
$691 million at retail*
Consumption and share* returned to
growth in Q4
* Nielsen, xAOC; retail sales 52 weeks ended 12/31/16; Q4 performance refers to 13 weeks ended 12/31/16. 19
CAGNY 2017
Invest to Grow – Building on Momentum
• Strong growth
• High margins
• Unique and differentiated
• Significant potential to expand consumption
Invest to Grow
~25% of KNA sales
20

Kellogg Company February 21, 2017
Page 11 of 28
CAGNY 2017
Cheez-It – Stronger Than Ever
• Increase investment in core
• Expand across channels and occasions
• Source from adjacencies
Share Leader in Crackers (2016)
1996 2016
Over $1 Billion in U.S. Net Sales
Consecutive Years of Growth20
+8.6% in 20164-year CAGR ≈6% Growth
Invest to Grow
21
CAGNY 2017
• Increase investment in core
• Expand across channels
• Unlock occasion through small sizes
+4% CAGRU.S. Net Sales, 2013-2016
Pringles – More to GrowInvest
to Grow
22

Kellogg Company February 21, 2017
Page 12 of 28
CAGNY 2017
• Invest in core
• Channels and occasions
• Capitalize on seasonal and licensed opportunities
Rice Krispies Treats – Solid MomentumInvest
to Grow
+9% CAGRNet Sales, 2013-2016
2013 2014 2015 2016
23
* Net Sales in U.S.
CAGNY 2017
Realize Potential
Realize Potential – Investing to Get Back On Trend
~15% of KNA sales
• Significant potential but underperforming
• Investing in food and packaging
• Sales decline near-term, before returning to growth
24
Kellogg Company February 21, 2017
Page 13 of 28
CAGNY 2017
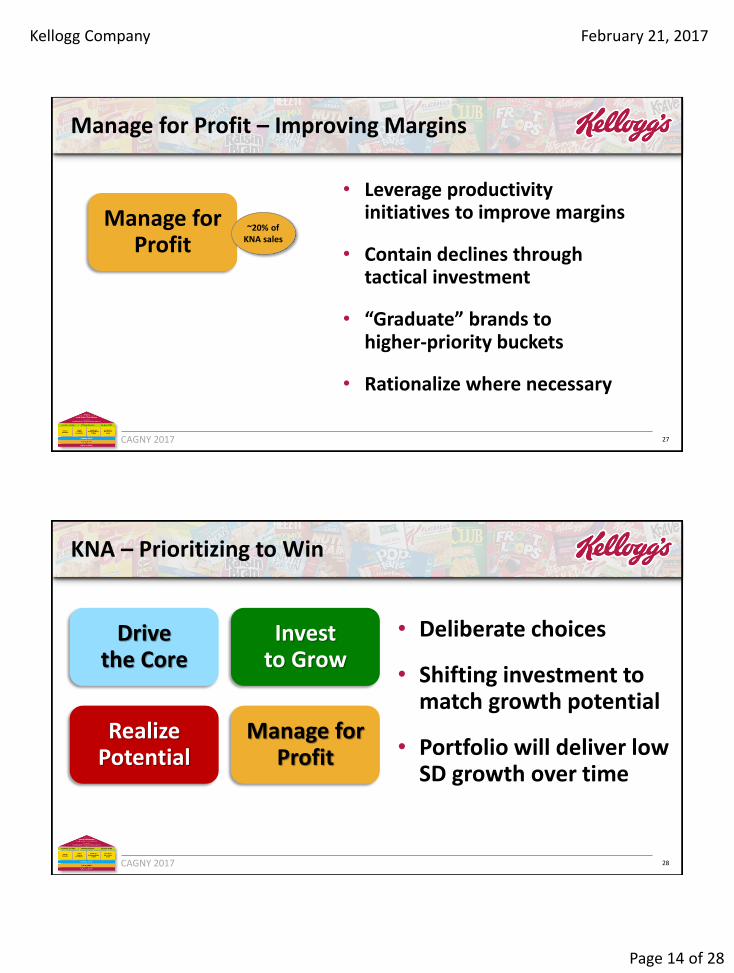
• Innovate and renovate core
• Return to communication in February 2017
• Cereal growth acceleratingin Natural Channel
• Gradual improvement ahead in Snacks
Realize Potential Kashi – Cereal in 2016, Snacks in 2017
25
CAGNY 2017
• 8 new items
• Bars and bites
• Communication in Q1
Realize Potential Special K Bars – Refreshing Our Line-Up
26
Transforming the Portfolio:
Kellogg Company February 21, 2017
Page 14 of 28
CAGNY 2017
Manage for Profit – Improving Margins
Manage for Profit
• Leverage productivity initiatives to improve margins
• Contain declines through tactical investment
• “Graduate” brands to higher-priority buckets
• Rationalize where necessary
~20% of KNA sales
27
CAGNY 2017
KNA – Prioritizing to Win
Invest to Grow
Drive the Core
Manage for Profit
Realize Potential
• Deliberate choices
• Shifting investment to match growth potential
• Portfolio will deliver low SD growth over time
28

Kellogg Company February 21, 2017
Page 15 of 28
CAGNY 2017
Unlocking KNA’s Full Potential
Invest with Impact
Portfolio Prioritization
• Where to play, how to win
• Shift investment to highest ROI
• Build CapabilitiesOperational Excellence
29
CAGNY 2017
• Deploying resources to highest ROI brands and activities
• Moving from “Push” to “Pull” in Snacks
• “Agile” ROI – Marketing Mix Model moving to real-time
• Migrating with consumer to digital
Invest with Impact – Prioritization & Measurement
30

Kellogg Company February 21, 2017
Page 16 of 28
CAGNY 2017
Unlocking KNA’s Full Potential
Invest with Impact
Portfolio Prioritization
Operational Excellence
• Where to play, how to win
• Shift investment to highest ROI
• Build Capabilities
31
CAGNY 2017
Building New Capabilities
• New Marketing Model Data Analytics & Agile ROI
“Demand Chain” Shopper Segmentation
• Revenue Growth Management Pack formats
Price-pack architecture
• Productivity Zero-Based Budgeting
• Single Go-to-Market Model / E2E Supply Chain DSD Exit unlocks resources to accelerate growth
32

Kellogg Company February 21, 2017
Page 17 of 28
CAGNY 2017
Summary
• Portfolio prioritization
• Investing for impact
• Driving operational excellence
Prioritizing to Win:
• Margin expansion
• Improved core brand performanceProgress Already Evident:
• Exiting DSD
• Transforming U.S. SnacksTransformation Continues:
33
CAGNY 2017
Agenda
• Kellogg Company – Solidly on 2020 Growth Plan
• Kellogg North America – Prioritizing to Win
• U.S. Snacks – Transforming our Business
• Closing Remarks
34

Kellogg Company February 21, 2017
Page 18 of 28
CAGNY 2017
U.S. Snacks – Portfolio Overview
35
Crackers
Cookies
Bars
Salty
Fruit Snacks
2016 Net Sales$3.2 billion
Retail Sales*$1.0 bn
Retail Sales*$0.2 bn
each
Retail Sales*$0.5 bn
Retail Sales*$0.2 bn
each
Retail Sales*$0.7 bn
* Retail sales figures are from Nielsen, xAOC, with Cheez-It figures xAOC+Convenience; 52 weeks ended 12/31/2016
CAGNY 2017
Exiting DSD – Rationale & Benefits
• More effective and efficient route to market= Lower costs, higher fill rate, lower
inventory
• Investment to accelerate growth= More support across more brands
• Scale behind One Kellogg route to market= Cross category promotions
Drivers to Exit DSD
• Category requirements not dependent on DSD
• Consumer splintering trips across more channels
• Evolving Customer landscape not serviced by DSD
• Increased sophistication in Customer warehouse
• Higher share & fill-rates in warehouse channel
US Snacks Benefits
36

Kellogg Company February 21, 2017
Page 19 of 28
CAGNY 2017
Simplified Route to Market – Customer Benefits
SIMPLIFIED ROUTE TO MARKET CUSTOMER BENEFITS
1. Margin Expansion
2. Inventory Management
3. Increased Growth
37
CAGNY 2017
Transition Plan in Place
• DSD network• Incentive plans• Manufacturing network
Infrastructure Intact1.
Seasoned Transition Team
3. • Playbook from M&A integrations• Fully resourced, cross-functional team • Retailer support
Established Warehouse System 2. • Already serves 75% of Kellogg U.S.
• IT, invoicing and customer service in place
38

Kellogg Company February 21, 2017
Page 20 of 28
CAGNY 2017
Financial Impact
2016 2017 2018 2019 KNA 2016
US Snacks Operating Margin Expansion*
* Currency-neutral comparable basis
• Accelerated Net Sales Growth after Transition
• Increased Brand Investment
• Higher OP Margin
CAGNY 2017
US Snacks – Roadmap
Reset Transform Accelerate
2016 2017 2018/2019
• Improve Efficiencies
• Focus Investments
• Establish RGM Capability
• Exit DSD
• Optimize Portfolio
• From “Push” to “Pull”
• Increase Brand Investment
• Stronger, leaner portfolio
• Joint Business Partnership
40
Kellogg Company February 21, 2017
Page 21 of 28
CAGNY 2017
Reset
Reset the Business Fundamentals
• Project K Network Consolidation• Launched ZBB
• Focused on Priority Brands− Cheez-It, Pringles, Rice Krispies Treats
• Established Price-Pack Architectures
1.
2.
3.
Improve Efficiencies
Focus Investments
Revenue Growth Management
41
CAGNY 2017
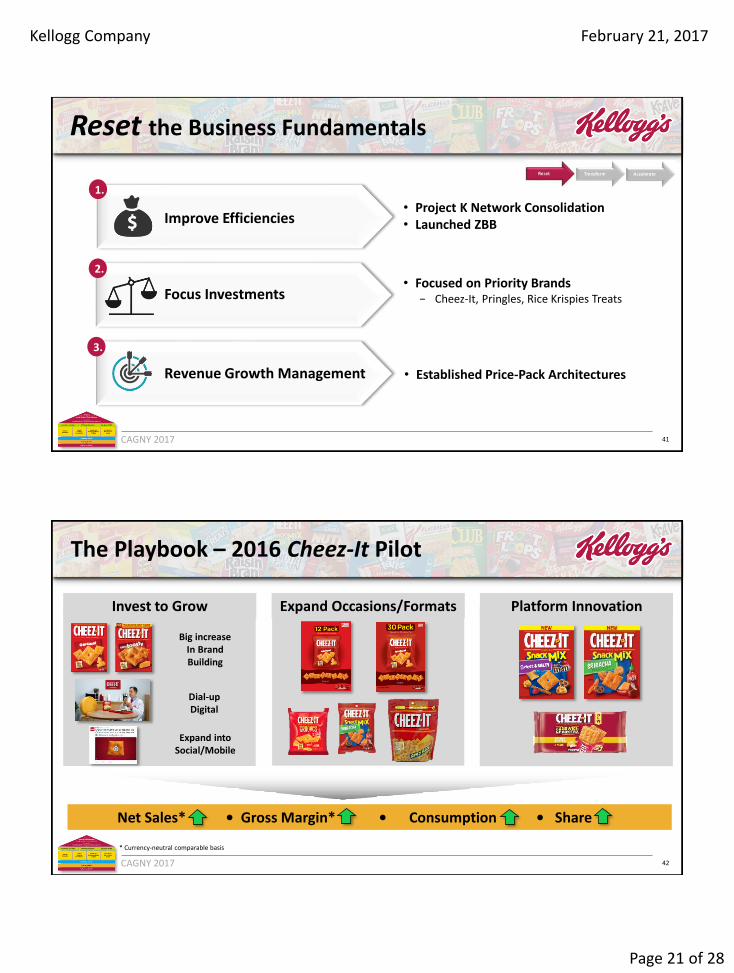
The Playbook – 2016 Cheez-It Pilot
Invest to Grow Platform InnovationExpand Occasions/Formats
Net Sales* • Gross Margin* • Consumption • Share
Big increaseIn Brand Building
Dial-up Digital
Expand into Social/Mobile
42
* Currency-neutral comparable basis
Kellogg Company February 21, 2017
Page 22 of 28
CAGNY 2017
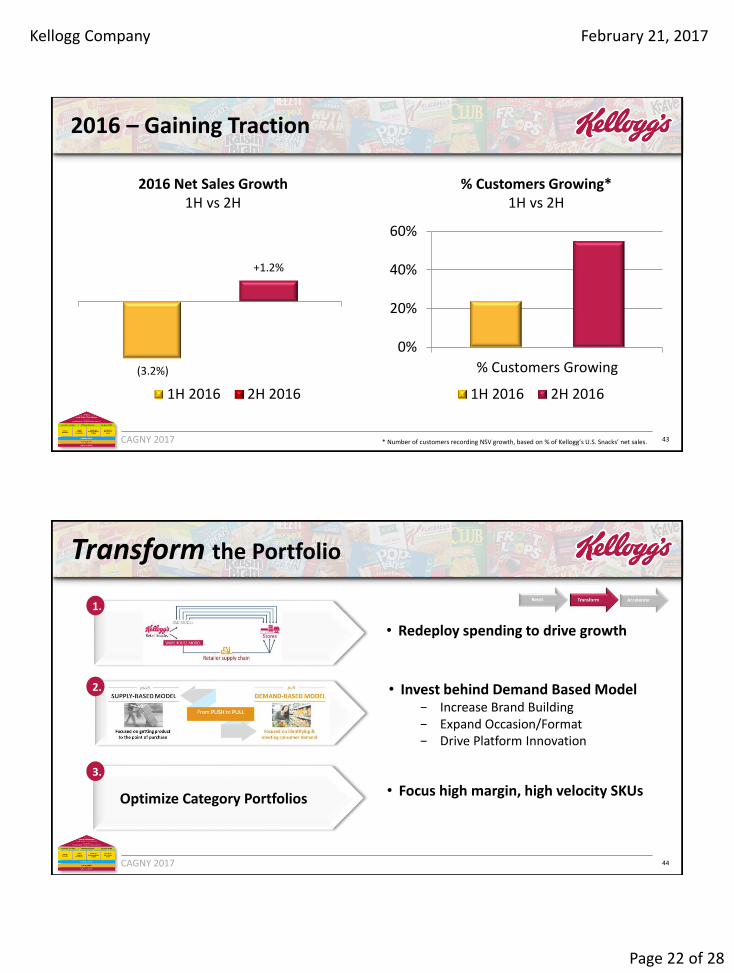
2016 – Gaining Traction
2016 Net Sales Growth1H vs 2H
% NSV
1H 2016 2H 2016
(3.2%)
+1.2%
% Customers Growing*1H vs 2H
0%
20%
40%
60%
% Customers Growing
1H 2016 2H 2016
43* Number of customers recording NSV growth, based on % of Kellogg’s U.S. Snacks’ net sales.
CAGNY 2017
Transform the Portfolio
• Redeploy spending to drive growth
1.
• Invest behind Demand Based Model− Increase Brand Building− Expand Occasion/Format− Drive Platform Innovation
2.
• Focus high margin, high velocity SKUs
3.
Optimize Category Portfolios
44

Kellogg Company February 21, 2017
Page 23 of 28
CAGNY 2017
Accelerate Growth Behind “Pull” Model
• Higher investment, higher ROI• Broader support across portfolio
• Grow new margin enhanced portfolio • Higher-velocity shelf set
• Launch cross-category programs• Partner of Choice for eCommerce
1.
2.
3.
Increase Brand Investment
Stronger, Leaner Portfolio
Joint Business Partnership
45
CAGNY 2017
Invest to Grow
Cheez-It – Sustain Momentum
Increased Media Investment--Multi-cultural--Millennials
Expand Occasions /Formats Innovation
Invest to Grow
46

Kellogg Company February 21, 2017
Page 24 of 28
CAGNY 2017
Pringles – Dial Up Growth
• Increased Media, Dial-up Digital
• Millennial & Multi-cultural Focus
• Tent Pole Merch Activation
Invest to Grow Expand Occasions /Formats Innovation
Invest to Grow
47
CAGNY 2017
Rice Krispies Treats – Sustain Growth
New Campaign--Millennial Focus--Multi-cultural
Seasonal Minis/Fun Sheets
Invest to Grow Expand Occasions /Formats Innovation
Invest to Grow
48
Kellogg Company February 21, 2017
Page 25 of 28
CAGNY 2017
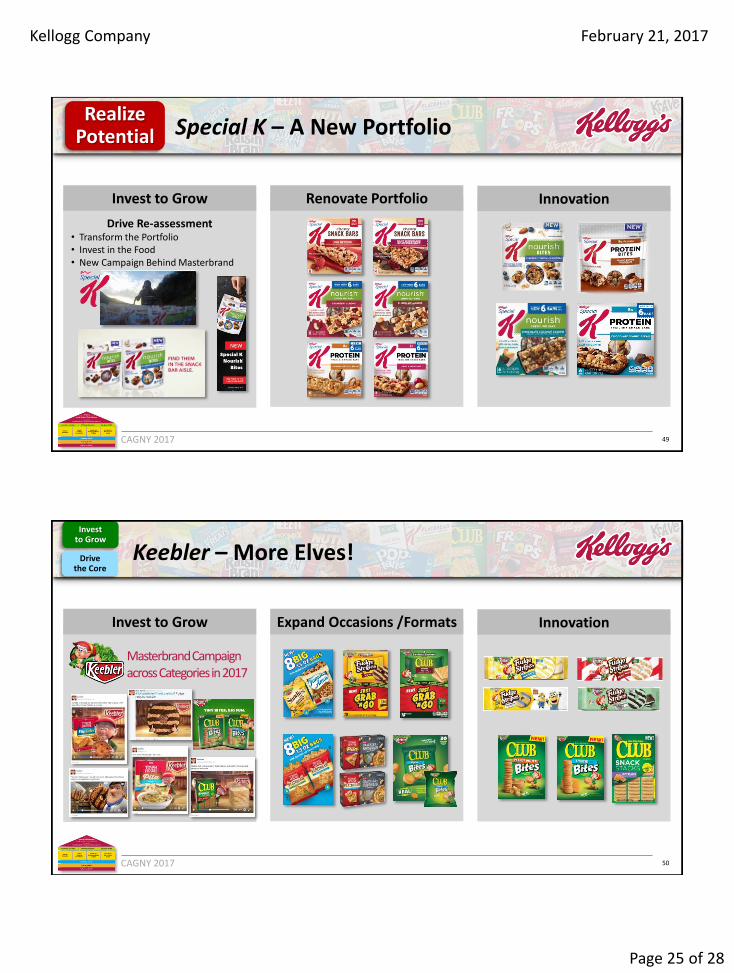
Special K – A New Portfolio
Drive Re-assessment• Transform the Portfolio• Invest in the Food• New Campaign Behind Masterbrand
Invest to Grow Renovate Portfolio Innovation
Realize Potential
49
CAGNY 2017
Keebler – More Elves!
Masterbrand Campaign across Categories in 2017
Invest to Grow Expand Occasions /Formats Innovation
Invest to Grow
Drive the Core
50

Kellogg Company February 21, 2017
Page 26 of 28
CAGNY 2017
In-store Activation – Stronger Than Ever
EstablishedTent-pole
Events
Pre-builtShipper & Modules
51
CAGNY 2017
Transforming Snacks
Good Progress Made in 2016
• Focused investment drove priority brands• Savings programs drove margin expansion• Sales turned to growth in 2H
DSD Exit Unlocks Resources for Accelerated growth
• Solid plans around transition• Boosting investment in Brand Building
A Stronger Kellogg Snacks is Emerging
• Better Growth and Profitability Over Time
52

Kellogg Company February 21, 2017
Page 27 of 28
CAGNY 2017
Agenda
• Kellogg Company – Solidly on 2020 Growth Plan
• Kellogg North America – Prioritizing to Win
• U.S. Snacks – Transforming our Business
• Closing Remarks
53
CAGNY 2017
In Summary…
54
Good Progress on 2020 Growth Plan• Stabilizing Developed RTEC• Expanding Snacks Worldwide• Building Scale in Emerging Markets• Increased Confidence in 2018 OP Margin Goal
KNA is Prioritizing to Win• Growing the brands in which we are investing• Investing in our food, and marketing for impact and ROI• Driving margin expansion
Transforming U.S. Snacks• Build on momentum of invest-to-grow brands• DSD exit enables step-change in investment• Positioning portfolio for accelerated growth

Kellogg Company February 21, 2017
Page 28 of 28
Q&AQ&A
55
CAGNY 2017
Appendix
Kellogg Company and Subsidiaries
Reconciliation of Non-GAAP Amounts - Reported Operating Margin to Comparable Operating Margin
excluding Venezuela
Year ended 2016 and 2015
2016 2015
Reported operating margin 10.7% 8.1%
Mark-to-market -2.0% -3.3%
Project K and cost reduction activities -2.5% -2.4%
Other costs impacting comparability 0.0% 0.5%
Integration and transaction costs -0.1% -0.2%
Venezuela remeasurement -0.1% -0.9%
Comparable operating margin 15.4% 14.4%
Comparable operating margin excluding Venezuela 15.4% 14.4%
56