CAGNY 2021
44
CAGNY 2021
Transcript of CAGNY 2021

CAGNY 2021

C A G N Y 2 0 2 1
This presentation contains forward-looking statements within the meaning of the Private Securities Litigation Reform Act of 1995 that are based on
management’s current expectations and assumptions. These forward-looking statements are subject to certain risks and uncertainties that could cause
actual results to differ materially from the potential results discussed in the forward-looking statements. In particular, our predictions about future net
sales and earnings could be affected by a variety of factors, including: the impact of the COVID-19 pandemic on our business, suppliers, consumers,
customers, and employees; disruptions or inefficiencies in the supply chain, including any impact of the COVID-19 pandemic; competitive dynamics in
the consumer foods industry and the markets for our products, including new product introductions, advertising activities, pricing actions, and
promotional activities of our competitors; economic conditions, including changes in inflation rates, interest rates, tax rates, or the availability of capital;
product development and innovation; consumer acceptance of new products and product improvements; consumer reaction to pricing actions and
changes in promotion levels; acquisitions or dispositions of businesses or assets; changes in capital structure; changes in the legal and regulatory
environment, including tax legislation, labeling and advertising regulations, and litigation; impairments in the carrying value of goodwill, other intangible
assets, or other long-lived assets, or changes in the useful lives of other intangible assets; changes in accounting standards and the impact of
significant accounting estimates; product quality and safety issues, including recalls and product liability; changes in consumer demand for our
products; effectiveness of advertising, marketing, and promotional programs; changes in consumer behavior, trends, and preferences, including weight
loss trends; consumer perception of health-related issues, including obesity; consolidation in the retail environment; changes in purchasing and
inventory levels of significant customers; fluctuations in the cost and availability of supply chain resources, including raw materials, packaging, and
energy; effectiveness of restructuring and cost saving initiatives; volatility in the market value of derivatives used to manage price risk for certain
commodities; benefit plan expenses due to changes in plan asset values and discount rates used to determine plan liabilities; failure or breach of our
information technology systems; foreign economic conditions, including currency rate fluctuations; and political unrest in foreign markets and economic
uncertainty due to terrorism or war. The company undertakes no obligation to publicly revise any forward-looking statements to reflect any future
events or circumstances.
A REMINDER ON FORWARD -LOOKING STATEMENTS
2

JEFF HARMENINGChairman and CEO

C A G N Y 2 0 2 1
BULLISH on our prospects for generating profitable growth and superior shareholder returns
4
BUILDING on our sustained momentum
EXECUTING our Accelerate Strategy
TODAY’S KEY MESSAGES

C A G N Y 2 0 2 1 5
WE’VE BEEN WINNING
Continued Strong Execution
Amid Pandemic
Organic Net Sales
+8%1
Adjusted Operating Profit
+13%2
Adjusted Diluted EPS
+17%2
Building Momentum
Pre-Pandemic
Strengthened organic net
sales growth
Improved market share
performance
Continued strong results
on margins and cash
1 Non-GAAP measure. See appendix for reconciliation2 Constant currency growth rate. Non-GAAP measure. See appendix for reconciliation
1H F21:

C A G N Y 2 0 2 1
OUR ACCELERATE STRATEGY
6
W H E R E TO P L AY
H O W TO W I N
D R I V E L O N G - T E R M S H A R E H O L D E R VA L U E
O U R P U R P O S E
*Non-GAAP measures1 Constant currency growth rate
Core
Markets
Global
Platforms
Local
Gems
Portfolio
Reshaping
Boldly Building
Brands
Relentlessly
Innovating
Unleashing
Our Scale
Being a Force
for Good
Organic Net
Sales* 2-3%
Adj. Operating
Profit* +MSD1
Adj. Diluted EPS*
+MSD to +HSD1
Maintain Capital
Discipline
Making Food the World Loves

C A G N Y 2 0 2 1
H O W T O W I N
D R I V I N G V A L U E
W H E R E T O P L AY
PRIORITIZING 8 CORE MARKETS
7
W I N N I N G I N N O R T H A M E R I C A A S # 1 P R I O R I T Y
Core markets
make up
95%of total
F20 Net Sales

C A G N Y 2 0 2 1C A G N Y 2 0 2 1
H O W T O W I N
D R I V I N G V A L U E
W H E R E T O P L AY
I C E C R E AMP E T
GLOBAL PLATFORMS
8
I N V E S T I N G I N A R E A S W I T H
H I G H E S T G R O W T H P O T E N T I A L
~45%of F20 Net Sales
A D VA N TA G E D P L AT F O R M S W I T H
G L O B A L G R O W T H P O T E N T I A L
B AR S M E X I C AN
C E R E AL

C A G N Y 2 0 2 1
H O W T O W I N
D R I V I N G V A L U E
W H E R E T O P L AY
LOCAL GEMSAT T R A C T I V E L O C A L A N D
R E G I O N A L G R O W T H D R I V E R S
~35%of F20 Net Sales
9

C A G N Y 2 0 2 1
H O W T O W I N
D R I V I N G V A L U E
W H E R E T O P L AY
PORTFOLIO RESHAPING
10
Strategic
DivestituresAccretive
Acquisitions
✓ Growth accretive
✓ Bolt-on
✓ Present in our core markets
✓ Existing or new growth platforms that
leverage our capabilities
✓ Targeting roughly 5%
of sales
✓ Growth dilutive platforms with
lower ROI
B U I L D I N G O N O U R S T R O N G T R A C K
R E C O R D O F G R O W T H - E N H A N C I N G M & A

C A G N Y 2 0 2 1
W H E R E T O P L AY
D R I V I N G V A L U E
H O W T O W I N
BOLDLY BUILDING BRANDSM E E T I N G C O N S U M E R S W H E R E T H E Y A R E W I T H
P U R P O S E - D R I V E N B R A N D S
11

C A G N Y 2 0 2 1
W H E R E T O P L AY
D R I V I N G V A L U E
H O W T O W I N
RELENTLESSLY INNOVATING
12
Core Platform
Innovation
Internal Start-Up Accelerator
C R E AT I N G N E W S O L U T I O N S T O R E A L C O N S U M E R P R O B L E M S
301 INC Investment Arm

C A G N Y 2 0 2 1
W H E R E T O P L AY
D R I V I N G V A L U E
H O W T O W I N
C A G N Y 2 0 2 1 13
UNLEASHING OUR SCALE
Enhancing Core Capabilities
Across our Business
Strategic Revenue
Management
E-Commerce
Holistic Margin
Management
Differentially Driving
Data & Analytics

C A G N Y 2 0 2 1
W H E R E T O P L AY
D R I V I N G V A L U E
H O W T O W I N
C A G N Y 2 0 2 1 14
BEING A FORCE FOR GOOD
Our Priorities
Improving
FOOD securityRegenerating
our PLANET
Advancing
inclusion among
our PEOPLE
Strengthening our
COMMUNITIES
CLIMATE COMMITMENTS
By 2030: By 2050:
Advance regenerative
agriculture on
1MM acres
Reduce greenhouse
gas emissions
by 30%
Achieve net-zero
greenhouse gas
emissions

C A G N Y 2 0 2 1
H O W T O W I N
D R I V I N G VA L U ED R I V I N G VA L U E
W H E R E T O P L AY
ACCELERATE GROWTH
Goal: Drive Top-Tier Shareholder Returns
SalesGrowth
MarginExpansion
CashConversion
CashReturns
15

IVAN POLLARDChief Marketing Officer

C A G N Y 2 0 2 1
OUR BELIEFS ABOUT BRAND BUILDING
BrandsMatter
Big Ideas Count
Executionis Crucial
17

C A G N Y 2 0 2 1
OUR PLAYBOOK FOR BOLDLY BUILDING BRANDS IS EVOLVING
18
Clear Brand Anatomies,
Built with Purpose
Executing with a
New, Modern Playbook
Connected Commerce
Quantum Marketing
Upskill marketers
Intelligent Investment
3x the Speed
Evolution of Insights
Cultural Capital
Compelling Creative

C A G N Y 2 0 2 1
F19 F20 F21 Est.
TOTAL MEDIA SPENDING
THE SIZE OF OURINVESTMENT IS INCREASING
1919
+MSD
to +HSD+15%
YOY
$ in Millions

C A G N Y 2 0 2 1
THE SHAPE OF OURINVESTMENT IS EVOLVING
20
E-CommerceE-Commerce
Brand Digital
Brand Digital
TVTV
Other Other
F19 F21 Est.
MIX OF MEDIA SPENDING
F O L L O W T H E C O N S U M E R A N D U S E T H E B E S T T O O L T O G E T T H E J O B D O N E
Bars represent proportion of total media spend in each fiscal year

C A G N Y 2 0 2 1
THE CREATION OF CONNECTED COMMERCE: BOX TOPS FOR EDUCATION
21
DIGITAL
PHYSICAL
IMPACTACTIONDigitized Box Tops Program
2.7MM App Downloads
>700MMReceipt Rows
81,000+Schools

C A G N Y 2 0 2 1
LEVERAGING CULTURAL CAPITAL FOR GOOD: WHEATIES
22
#1 Consumer
Goods2019 2020
ACTIONFeaturing Influencers and their Causes
IMPACT
Retail Sales
Growth
+8%
#6 Overall
Source: Wheaties Nielsen xAOC FYTD vs. LY through 1/2/21
Source: Newsweek December 2020
1934

C A G N Y 2 0 2 1
THE ELEVATION OF COMPELLING CREATIVITY: HÄAGEN-DAZS
ACTIONNew Modern Campaign
IMPACT
Retail Sales
Growth
+DD
Market Share
Growth
+0.3 pts
23
Source: Häagen-Dazs Europe & Australia Nielsen/IRI June to August 2020 vs. LY

KOFI BRUCEChief Financial Officer

C A G N Y 2 0 2 1
Cash Returns to
Shareholders
~80-90%
Adj. Diluted EPS*
+MSD to +HSD1
ACCELERATE GROWTH
25*Non-GAAP measures1 Constant currency growth rate. Non-GAAP measures
Organic Net Sales*
+2 to +3%
Adj. Operating Profit*
+MSD1
FCF Conversion*
95%+
Goal: Drive Top-Tier Shareholder Returns
SalesGrowth
MarginExpansion
CashConversion
CashReturns

C A G N Y 2 0 2 1
INCREASING NET SALES GROWTH EXPOSURE WITH PORTFOLIO RESHAPING
26
Existing Portfolio Portfolio Reshaping Impact Target Exposure
+2 to +3%
NET SALES GROWTH EXPOSURE

C A G N Y 2 0 2 1
MARGIN EXPANSION TO SUPPORT +MSD ADJ. OPERATING PROFIT GROWTH
27
HMM
Leveraging Global Scale
SRM
Data & Analytics
16.6%16.9%
17.3%
F18 F19 F20 F21 Est.
In Line
or
Better
Adj. Op. Profit Margin* (% of Net Sales)
Levers to Expand Margins
*Non-GAAP measure. See appendix for reconciliation

C A G N Y 2 0 2 1
EXCELLENT CASH MANAGEMENT PROVIDES BALANCE SHEET FLEXIBILITY
28
$5.7 $6.0 $6.2
$7.7
103%108% 109%
127%
70%
80%
90%
100%
110%
120%
130%
140%
150%
160%
$2.0
$3.0
$4.0
$5.0
$6.0
$7.0
$8.0
F15-F17 F16-F18 F17-F19 F18-F20
Free Cash Flow* Free Cash Flow Conversion*
(3-Year Rolling, $ in Billions)
*Non-GAAP measures. See appendix for reconciliation
Delivering on
Long-term FCF
Conversion
Target ≥ 95%

C A G N Y 2 0 2 1
LONG-TERM CAPITAL ALLOCATION PRIORITIES
29
F18Pro Forma
F19 F20 Q2 F21
4.2x3.9x
3.2x2.9x
Enables Execution on our Long-term Priorities
*Net Debt to Trailing 12-Month Adjusted-EBTIDA Ratio. Non-GAAP measure. See appendix for reconciliation
• CAPEX ~4% of Net Sales
• Grow Dividends with Earnings
• Strategic M&A
• Share Repurchases
Achieved Target Leverage* of 3.0x in F21

C A G N Y 2 0 2 1
ACHIEVING OUR FISCAL 2021 PRIORITIES
30
Compete
Fuel Investments
Reduce
Compete Effectively, Everywhere We Play
Drive Efficiency to Fuel Investments in Brands and Capabilities
Reduce Debt Leverage to Increase Financial Flexibility
1
2
3

C A G N Y 2 0 2 1
REAFFIRMING SECOND HALF FISCAL 2021 ASSUMPTIONS
31
*Non-GAAP measures
Q3 GUIDANCE
• Organic Net Sales* Growth
Roughly Similar to F21 Q2
• Adj. Operating Profit Margin* In Line
with Last Year
FULL-YEAR OUTLOOK
• Full-Year Adj. Operating Profit
Margin In Line or Better than F20

C A G N Y 2 0 2 1
BULLISH on our prospects for generating profitable growth and superior shareholder returns
32
BUILDING on our sustained momentum
EXECUTING our Accelerate Strategy
TODAY’S KEY MESSAGES

C A G N Y 2 0 2 1
OUR ACCELERATE STRATEGY
33*Non-GAAP measures1 Constant currency growth rate
W H E R E TO P L AY
H O W TO W I N
D R I V E L O N G - T E R M S H A R E H O L D E R VA L U E
O U R P U R P O S E
Core
Markets
Global
Platforms
Local
Gems
Portfolio
Reshaping
Boldly Building
Brands
Relentlessly
Innovating
Unleashing
Our Scale
Being a Force
for Good
Organic Net
Sales* 2-3%
Adj. Operating
Profit* +MSD1
Adj. Diluted EPS*
+MSD to +HSD1
Maintain Capital
Discipline
Making Food the World Loves

CAGNY 2021

C A G N Y 2 0 2 1
Our outlook for organic net sales growth and adjusted operating profit margin are non-GAAP financialmeasures that exclude, or have otherwise been adjusted for, items impacting comparability, including theeffect of foreign currency exchange rate fluctuations, acquisitions, divestitures, and a 53rd week, whenapplicable. We are not able to reconcile these forward-looking non-GAAP financial measures to their mostdirectly comparable forward-looking GAAP financial measure without unreasonable efforts because we areunable to predict with a reasonable degree of certainty the actual impact of changes in foreign currencyexchange rates or the timing of acquisitions and divestitures throughout fiscal 2021. The unavailableinformation could have a significant impact on our fiscal 2021 GAAP financial results.
A REMINDER ON NON -GAAP GUIDANCE
35
C A G N Y 2 0 2 1
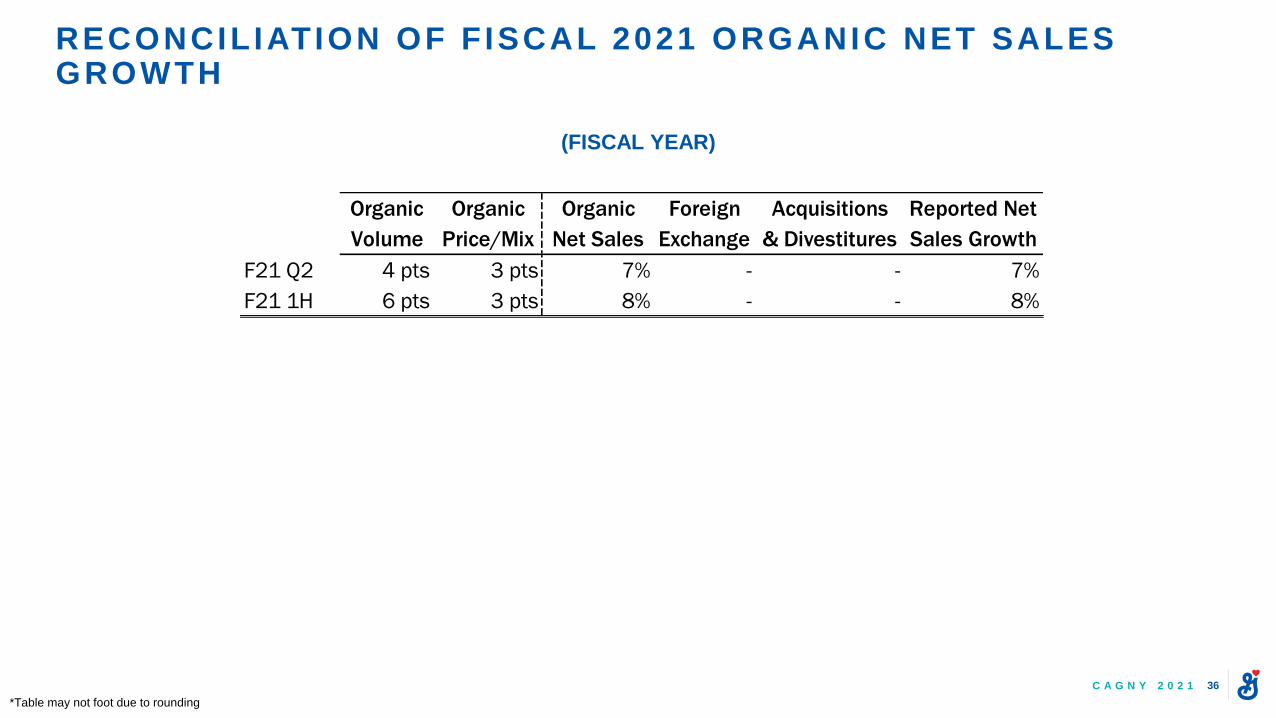
RECONCILIATION OF F ISCAL 2021 ORGANIC NET SALES GROWTH
36
*Table may not foot due to rounding
(FISCAL YEAR)
Organic
Volume
Organic
Price/Mix
Organic
Net Sales
Foreign
Exchange
Acquisitions
& Divestitures
Reported Net
Sales Growth
F21 Q2 4 pts 3 pts 7% - - 7%
F21 1H 6 pts 3 pts 8% - - 8%

C A G N Y 2 0 2 1
RECONCILIATION OF F IRST HALF F ISCAL 2021 ADJUSTED OPERATING PROFIT CONSTANT-CURRENCY GROWTH RATE
37
*Table may not foot due to rounding
(FISCAL YEARS, $ IN MILLIONS)
2021 2020
Operating profit as reported $ 1,770.3 $ 1,473.6 20 %
Mark-to-market effects (62.3) (7.6)
Investment activity, net (19.0) 3.7
Product recall 7.1 -
Restructuring charges 1.9 24.8
Project-related costs - 0.7
Adjusted operating profit $ 1,698.0 $ 1,495.2 14 %
Foreign currency exchange impact 1 pt
Adjusted operating profit growth,
on a constant-currency basis 13 %
1H
Change

C A G N Y 2 0 2 1
RECONCILIATION OF F IRST HALF F ISCAL 2021 ADJUSTED DILUTED EPS AND RELATED CONSTANT-CURRENCY GROWTH RATES
38*Table may not foot due to rounding
(FISCAL YEARS)
Per Share Data 2021 2020
Diluted earnings per share, as reported $ 2.14 $ 1.80 19 %
Mark-to-market effects** (0.08) (0.01)
Investment activity, net** (0.02) -
Product recall** 0.01 -
Restructuring charges** - 0.03
Tax item - (0.09)
Adjusted diluted earnings per share $ 2.06 $ 1.74 18 %
Foreign currency exchange impact 1 pt
Adjusted diluted earnings per share growth,
on a constant-currency basis 17 %
1H
Change
**See reconciliation of tax rate excluding items for tax impact of individual items

C A G N Y 2 0 2 1
RECONCILIATION OF F IRST HALF F ISCAL 2021 INCOME TAXES ON ADJUSTING ITEMS
39*Table may not foot due to rounding
(FISCAL YEARS, $ IN MILLIONS EXCEPT PER SHARE DATA)
Income Income
Taxes Taxes
As reported $ 1,624.8 $ 360.2 $ 1,295.9 $ 222.7
Mark-to-market effects (62.3) (14.3) (7.6) (1.7)
Investment activity, net (19.0) (4.4) 3.7 4.4
Product recall 7.1 0.8 - -
Restructuring charges 1.9 0.5 24.8 4.3
Project-related costs - - 0.7 0.1
Tax item - - - 53.1
As adjusted $ 1,552.4 $ 342.8 $ 1,317.5 $ 282.8
Effective tax rate:
As reported 22.2% 17.2%
As adjusted 22.1% 21.5%
Sum of adjustment to income taxes $ (17.4) $ 60.2
Average number of common shares - diluted EPS 619.7 611.8
Impact of income tax adjustments on adjusted diluted EPS $ (0.03) $ 0.10
1H
2021 2020
Pretax Pretax
Earnings** Earnings**
**Earnings before income taxes and after-tax earnings from joint ventures

C A G N Y 2 0 2 1
RECONCILIATION OF ADJUSTED OPERATING PROFIT MARGIN
40
*Table may not foot due to rounding
(FISCAL YEARS)
Full-year Q3 Full-year Full-year
Operating profit margin as reported 16.8 % 15.6 % 14.9 % 15.4 %
Restructuring charges 0.3 0.3 0.5 0.5
Mark-to-market effects 0.1 0.2 0.2 (0.2)
Product recall 0.1 - - -
Asset impairments - - 1.2 0.6
Divestitures loss - - 0.2 -
Acquisition transaction and integration costs - - 0.1 0.2
Investment activity, net - 0.1 (0.1) -
Legal recovery - - (0.1) -
Project-related costs - - - 0.1
Adjusted operating profit margin 17.3 % 16.1 % 16.9 % 16.6 %
Percent of Net Sales
2020 2019 20182020

C A G N Y 2 0 2 1
RECONCILIATION OF FREE CASH FLOW AND FREE CASH FLOW CONVERSION
41
*Table may not foot due to rounding **All adjustments are Net of Income Taxes. See reconciliation of Income Taxes on Adjusting Items
(FISCAL YEARS, $ IN MILLIONS)
2020 2019 2018 2017 2016 2015
Net earnings, including earnings attributable to
redeemable and noncontrolling interests$2,211 $1,786 $2,163 $1,701 $1,737 $1,259
Restructuring charges** 39 63 61 154 161 218
Mark-to-market effects** 19 28 (22) (9) (40) 56
Product recall** 17 - - - - -
CPW restructuring costs 5 11 2 - - -
Investment activity** 3 (18) - - - -
Project-related costs** 1 1 8 28 37 8
Tax items (53) (73) 41 - - 79
Asset impairments** - 160 65 - - 177
Acquisition transaction and integration costs** - 20 58 - - 10
Divestitures loss (gain)** - 16 - 9 (66) -
Hyperinflationary accounting** - 3 - - - -
Net tax benefit - (7) (523) - - -
Legal recovery** - (11) - - - -
Venezuela currency devaluation** - - - - - 8
Adjusted net earnings, including earnings attributable to
redeemable and noncontrolling interests$2,242 $1,980 $1,853 $1,884 $1,829 $1,815
Net cash provided by operating activities, as reported $3,676 $2,807 $2,841 $2,415 $2,764 $2,648
Purchases of land, buildings, and equipment ($461) ($538) ($623) ($684) ($729) ($712)
Free cash flow $3,215 $2,269 $2,218 $1,731 $2,035 $1,936
Free cash flow, rolling 3-year $7,703 $6,219 $5,984 $5,702 $5,930 $6,329
Free cash flow conversion, rolling 3-years 127% 109% 108% 103% 108% 115%
Full-year

C A G N Y 2 0 2 1
2020 2019 2018**
Full-year Full-year Full-year
Net earnings, including earnings attributable to
redeemable and noncontrolling interests, as reported
Income taxes 618.0 480.5 367.8 104.3
Interest, net 440.2 466.5 521.8 527.8
Depreciation and amortization 582.1 594.7 620.1 642.6
EBITDA $ 4,073.4 $ 3,752.5 $ 3,295.9 $ 3,559.1
After-tax earnings from joint ventures (122.1) (91.1) (72.0) (84.7)
Mark-to-market effects (30.0) 24.7 36.0 (32.1)
Investment activity, net (14.3) 8.4 (22.8) -
Project-related costs 0.8 1.5 1.3 11.3
Product recall 26.4 19.3 - -
Restructuring charges 27.3 50.2 77.6 82.7
Asset impairments - - 207.4 96.9
Divestitures loss - - 30.0 -
Acquisition integration costs - - 25.6 -
Hyperinflationary accounting - - 3.2 -
Legal recovery - - (16.2) -
Adjusted EBITDA $ 3,961.5 $ 3,765.6 $ 3,566.0 $ 3,633.2
Total debt $ 13,964.4 $ 13,539.5 $ 14,490.0 $ 15,818.6
Cash 2,582.8 1,677.8 450.0 399.0
Net debt $ 11,381.7 $ 11,861.7 $ 14,040.0 $ 15,419.6
Net debt-to-adjusted EBITDA ratio 2.9 3.2 3.9 4.2
$$ 2,433.1 2,210.8 $ 1,786.2 $ 2,284.4
Trailing 12 Months
Ending 2021 Q2
RECONCILIATION OF NET DEBT-TO-ADJUSTED EBITDA RATIO
42
*Table may not foot due to rounding **On a pro-forma basis
(FISCAL YEARS, $ IN MILLIONS)

C A G N Y 2 0 2 1
RECONCILIATION OF INCOME TAXES ON ADJUSTING ITEMS
43
*Table may not foot due to rounding **Earnings before income taxes and after-tax earnings from joint ventures
Pretax
Earnings**
Income
Taxes
Pretax
Earnings**
Income
Taxes
Pretax
Earnings**
Income
Taxes
Pretax
Earnings**
Income
Taxes
Pretax
Earnings**
Income
Taxes
Pretax
Earnings**
Income
Taxes
As reported $2,600 $481 $2,082 $368 $2,136 $57 $2,271 $655 $2,404 $755 $1,762 $587
Tax items - 53 - 73 - (41) - - - - - (79)
Restructuring charges 50 11 78 15 83 21 224 70 230 69 344 126
Mark-to-market effects 25 6 36 8 (32) (10) (14) (5) (63) (23) 90 33
Product recall 19 2
Investment activity, net 8 5 (23) (5) - - - - - - - -
Project-related costs 2 0 1 - 11 3 44 16 58 21 13 5
Asset impairments - - 207 48 97 32 - - - - 260 83
Divestitures loss (gain) - - 30 14 - - 14 4 (148) (82) - -
Acquisition transaction and
integration costs- - 26 6 84 25 - - - - 16 6
Hyperinflationary accounting - - 3 - - - - - - - - -
Legal recovery - - (16) (5) - - - - - - - -
Net tax benefit - - - 7 - 523 - - - - - -
Venezuela currency devaluation - - - - - - - - - - 8 -
As adjusted $2,704 $559 $2,424 $528 $2,378 $612 $2,539 $740 $2,480 $740 $2,492 $761
2020
Full-year
2019 2018 2017 2016 2015
(FISCAL YEARS, $ IN MILLIONS)