

2017 Bike Share Pilot - Seattle Bike Blog · 2017 Bike Share Pilot Regulatory framework for...
43
2017 Bike Share Pilot Regulatory framework for free-floating bike share Sustainability & Transportation Committee Andrew Glass Hastings & Kyle Rowe September 19, 2017
Transcript of 2017 Bike Share Pilot - Seattle Bike Blog · 2017 Bike Share Pilot Regulatory framework for...
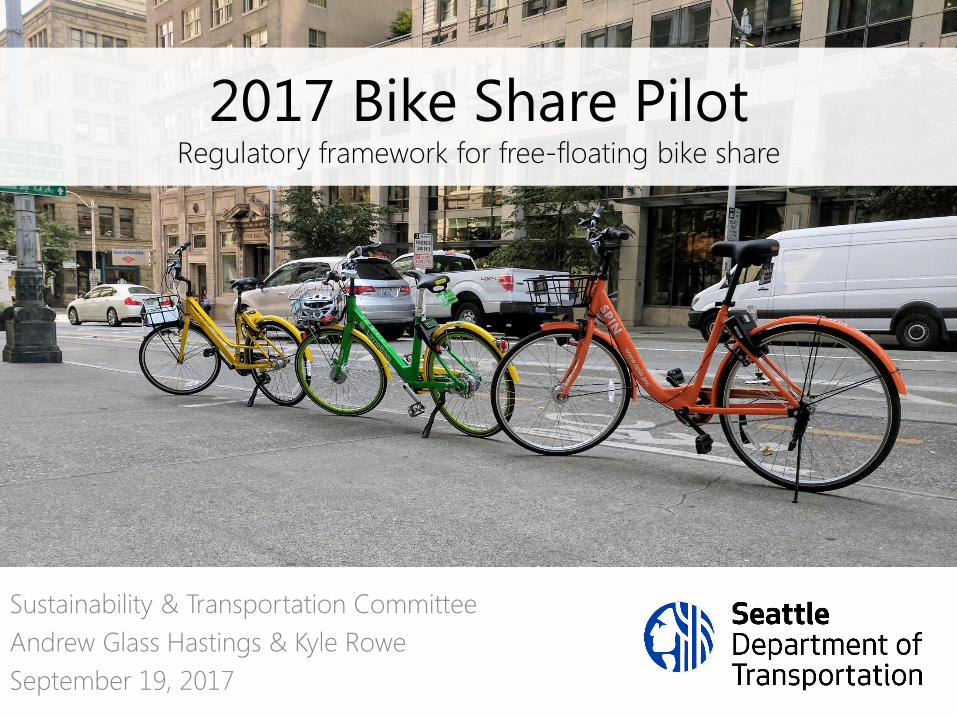
2017 Bike Share PilotRegulatory framework for free-floating bike share
Sustainability & Transportation CommitteeAndrew Glass Hastings & Kyle RoweSeptember 19, 2017
Our mission, vision, and core values
Committed to 5 core values to create a city that is:• Safe• Interconnected• Affordable• Vibrant• Innovative
For all
Mission: deliver a high-quality transportation system for Seattle
Vision: connected people, places, and products
2
Presentation overview
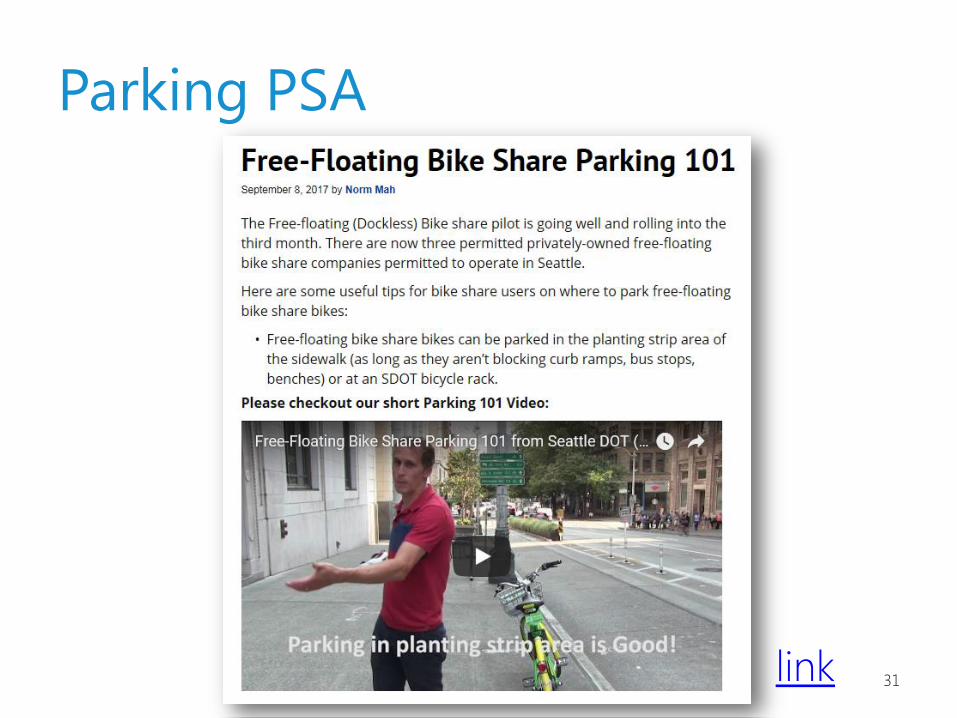
• Regulatory framework• Performance metrics• Advancing free-floating policy• Parking PSA• Next steps
3
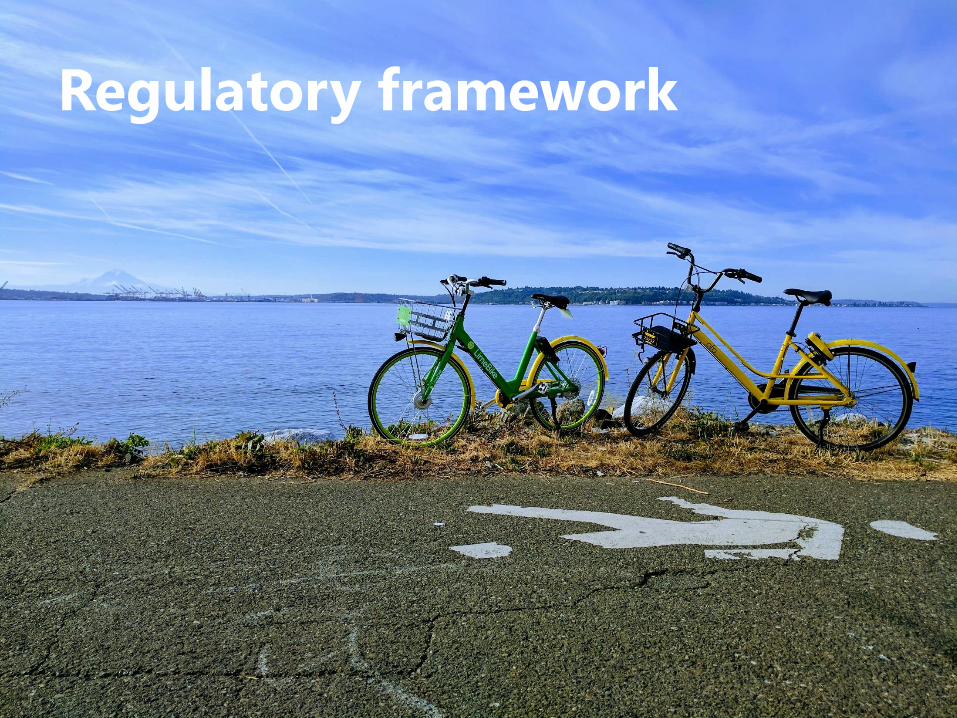
Regulatory framework
4

5
• Safety• Parking• Operations• Data sharing• Fees
Permit
6
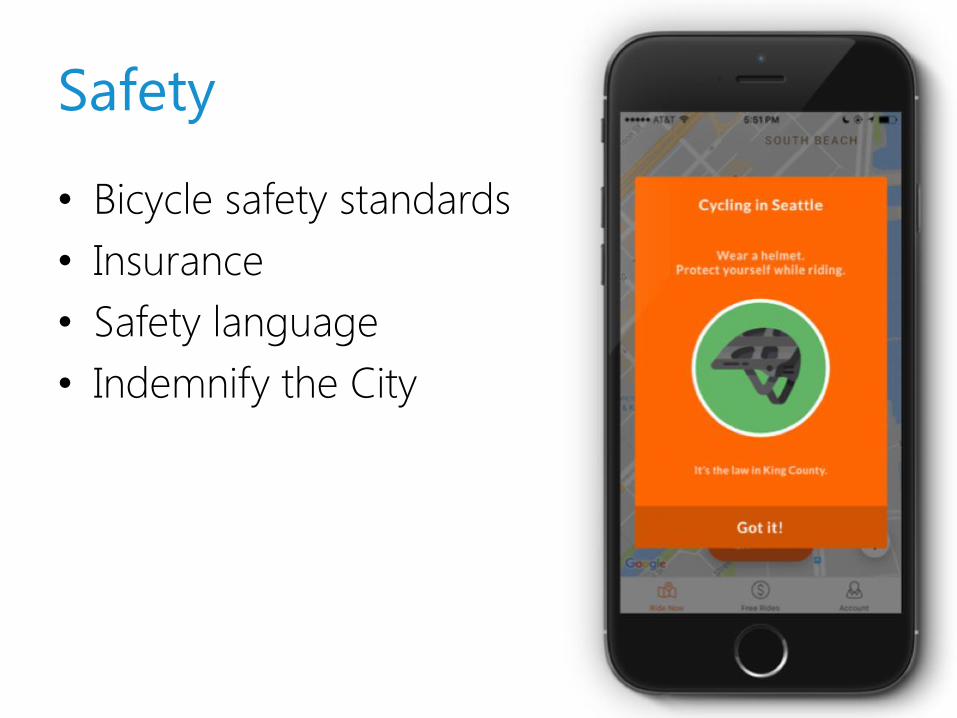
Safety
• Bicycle safety standards• Insurance• Safety language• Indemnify the City

7
Parking
• Landscape / furniture zone
• Ability to create “stations”
• Relocating / rebalancing
8
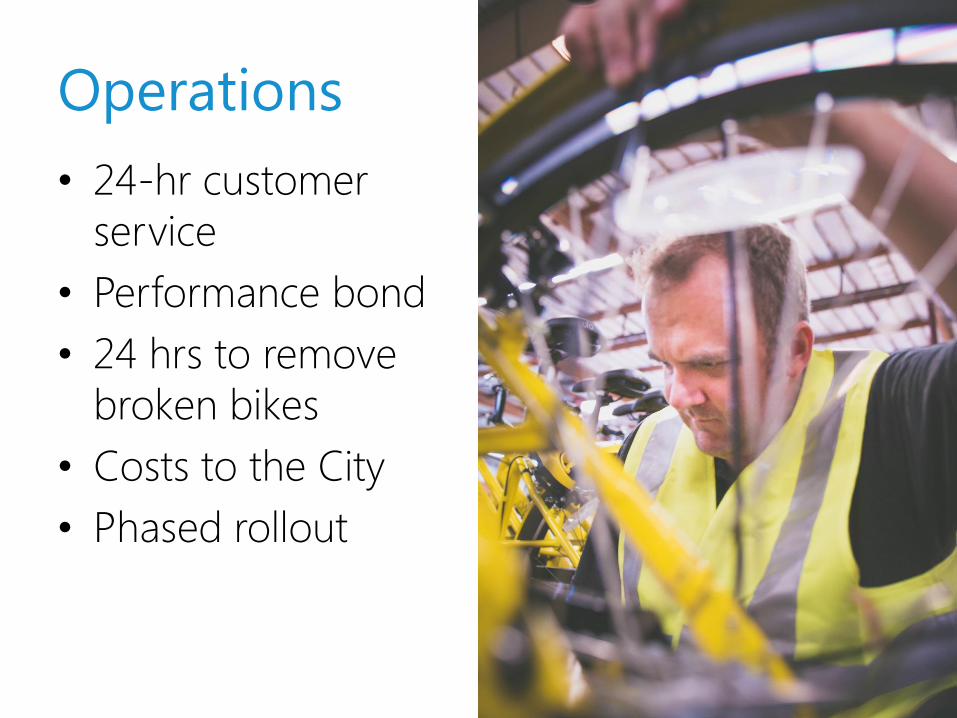
Operations• 24-hr customer
service• Performance bond• 24 hrs to remove
broken bikes• Costs to the City• Phased rollout
9
Data sharing
Two options:
1. Data submitted directly to SDOT
2. Data submitted to the University of Washington’s Transportation Data Collaborative (UW TDC)
10
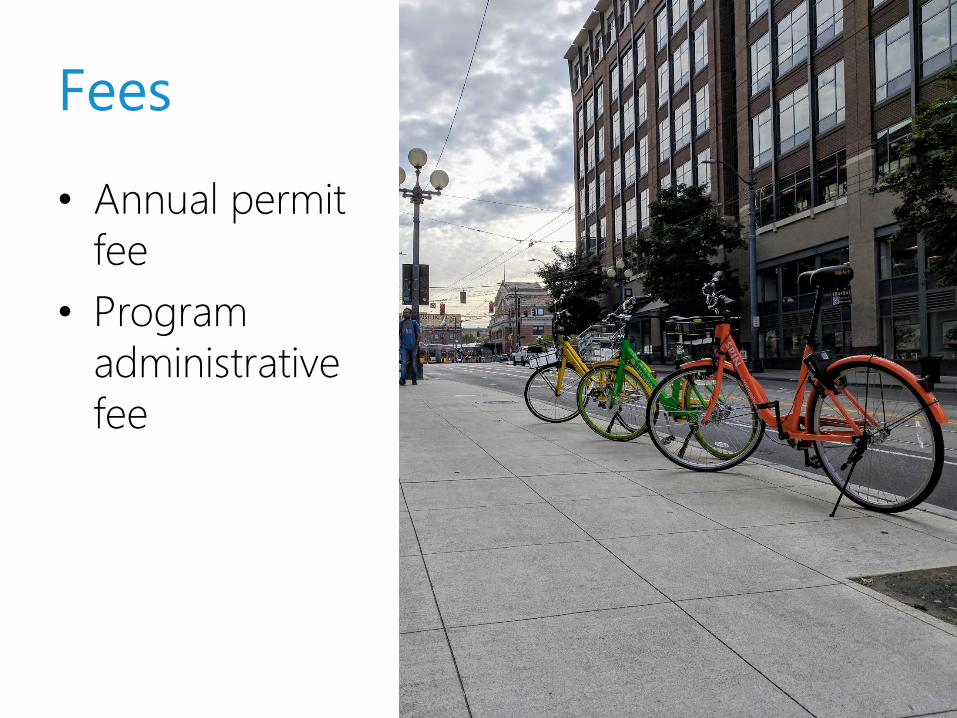
Fees
• Annual permit fee
• Program administrative fee
11
Performance metrics
12
Basic stats
13
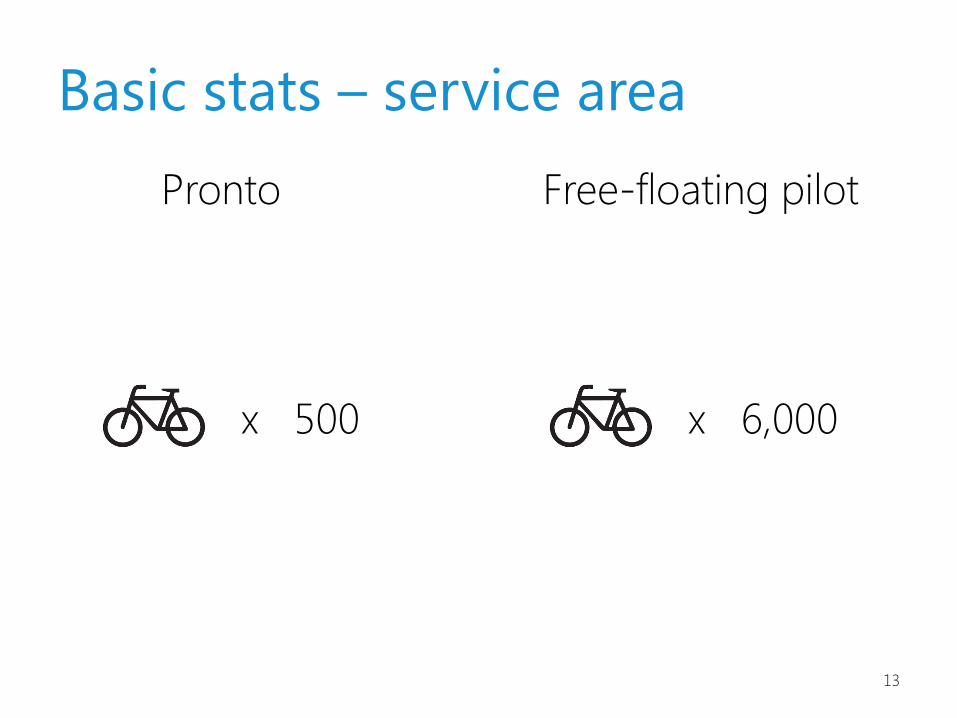
Basic stats – service areaPronto Free-floating pilot
x 500 x 6,000
14
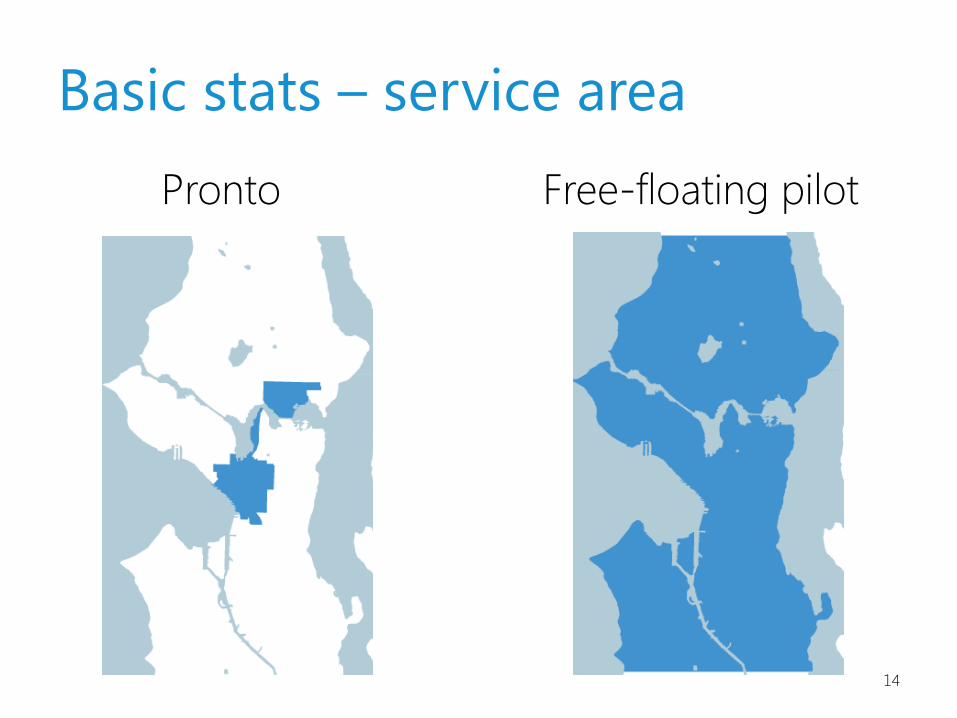
Basic stats – service areaPronto Free-floating pilot
15
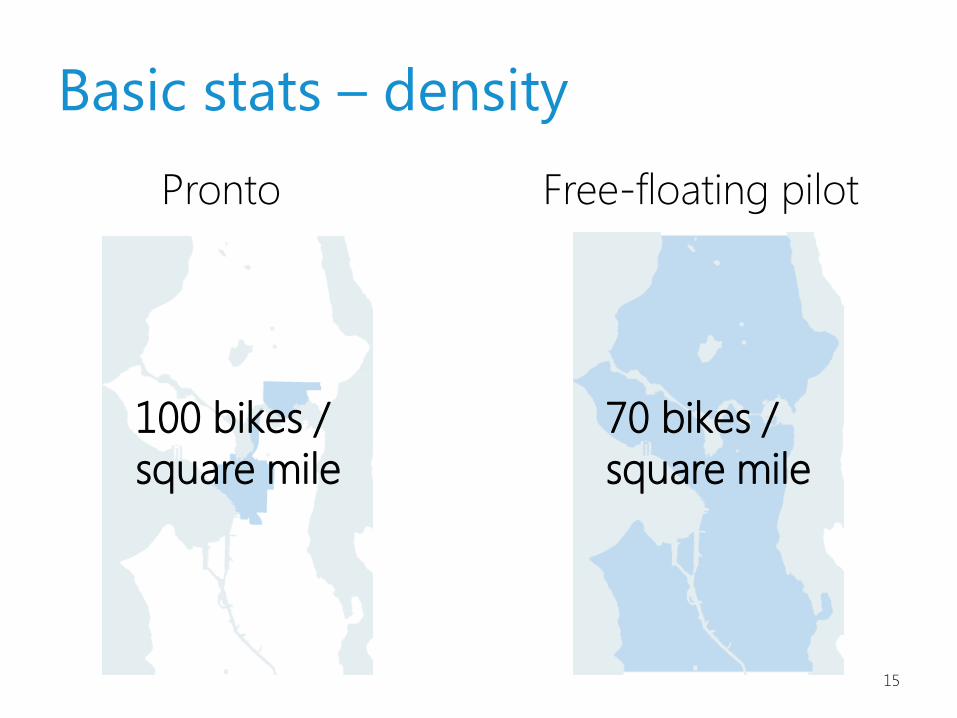
Basic stats – densityPronto Free-floating pilot
100 bikes / square mile
70 bikes / square mile
16
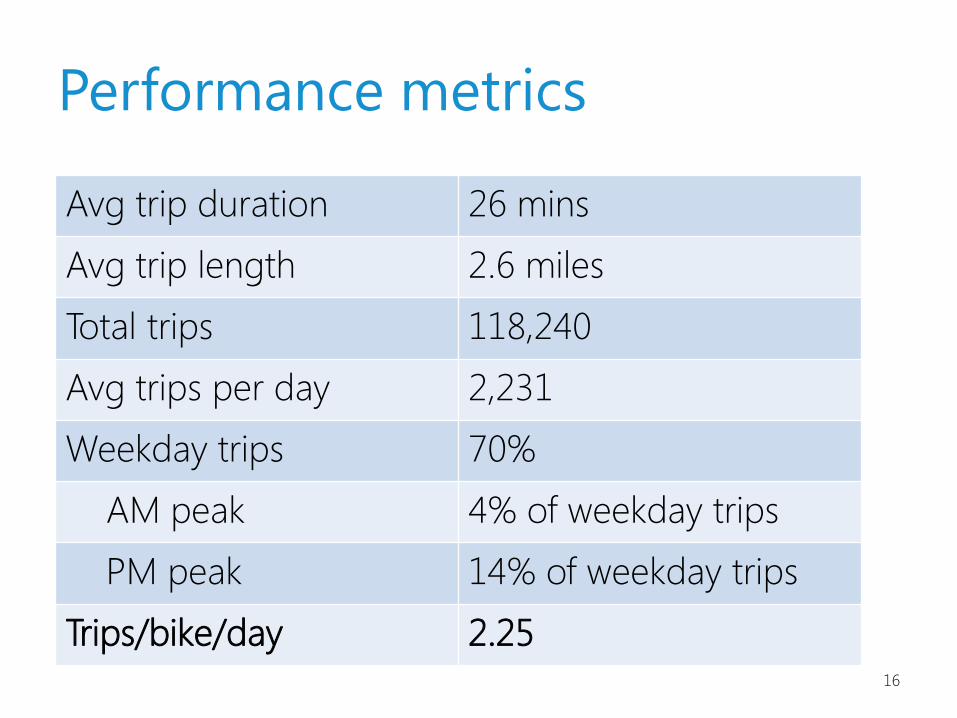
Performance metrics
Avg trip duration 26 mins
Avg trip length 2.6 miles
Total trips 118,240
Avg trips per day 2,231
Weekday trips 70%
AM peak 4% of weekday trips
PM peak 14% of weekday trips
Trips/bike/day 2.25
17
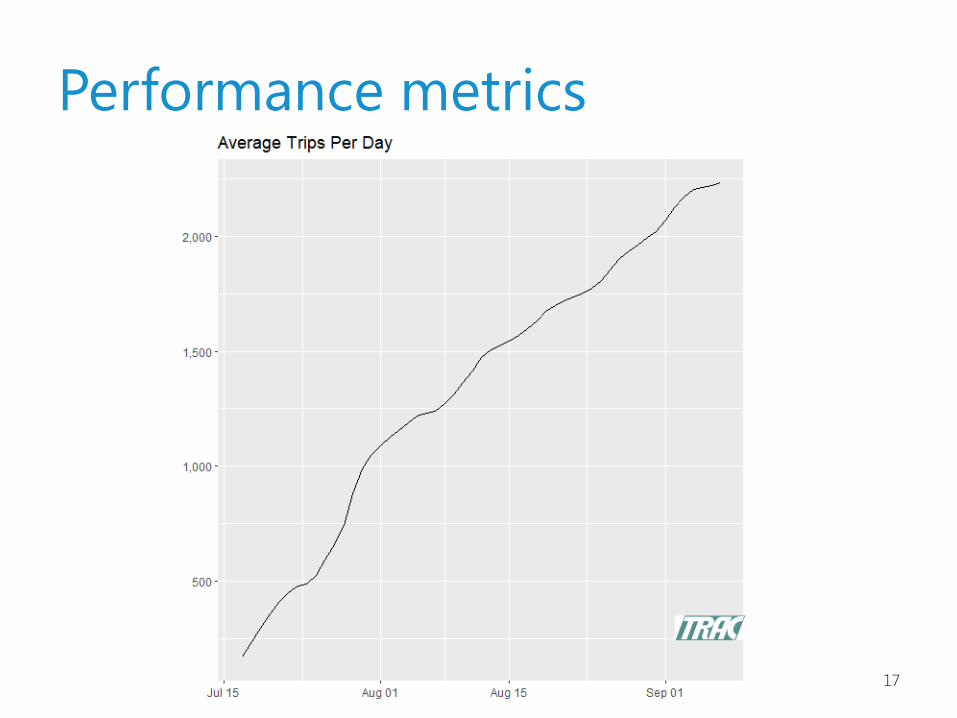
Performance metrics
18
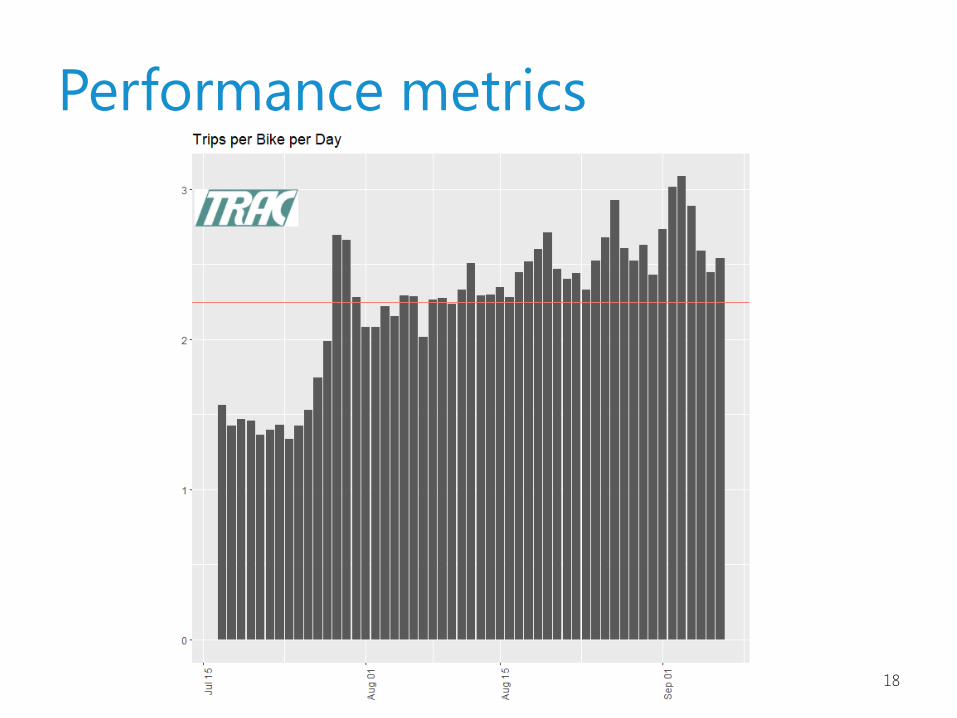
Performance metrics

19
Performance metricsOrigins Destination
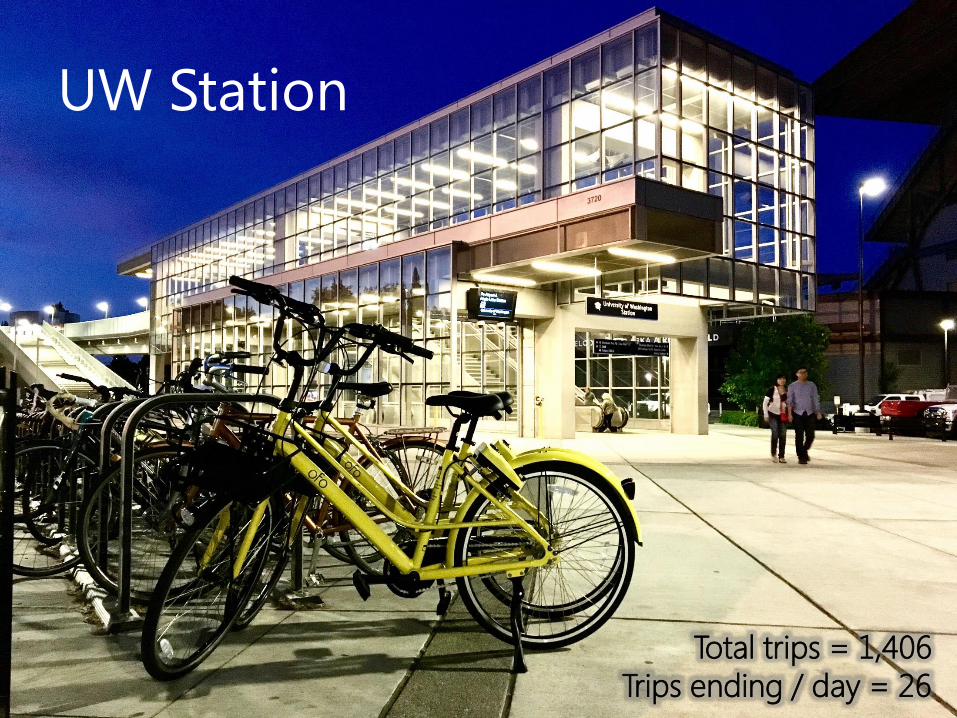
Total trips = 1,406Trips ending / day = 26
UW Station
21
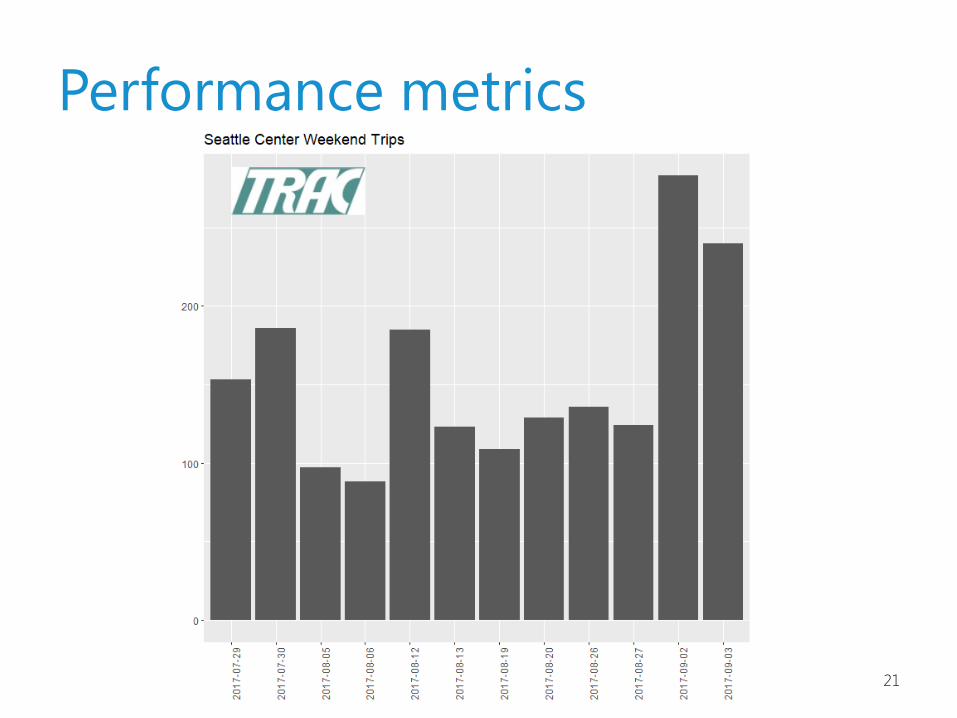
Performance metrics

22
Performance metrics

Advancing free-floating policy

24

25
Advancing free-floating policy• Equity
26
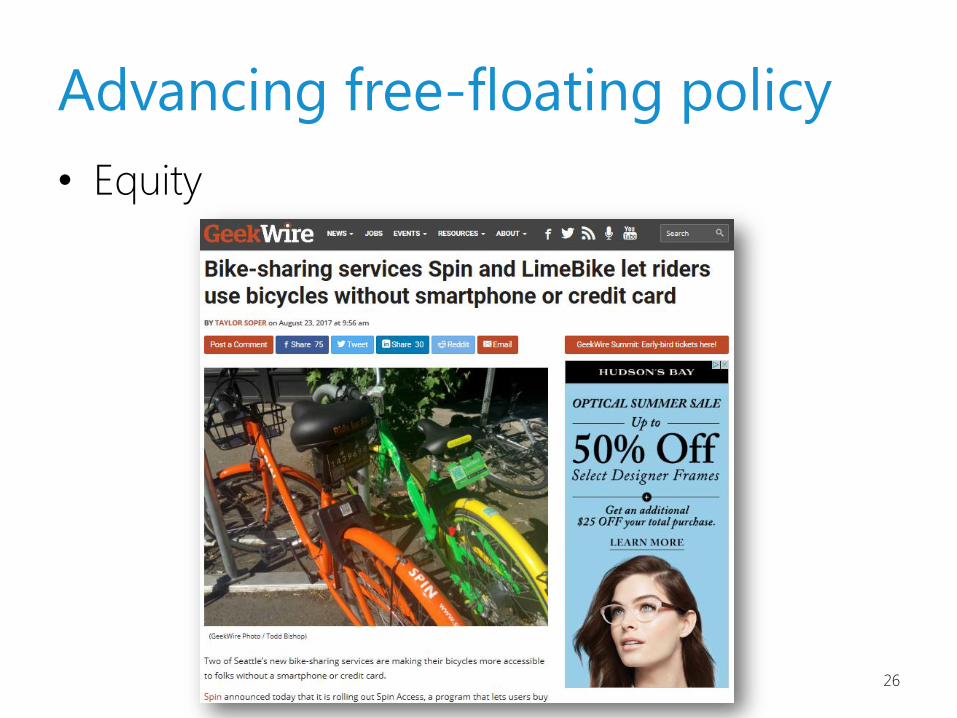
Advancing free-floating policy• Equity
27
Advancing free-floating policy• Equity• Enforcement
28
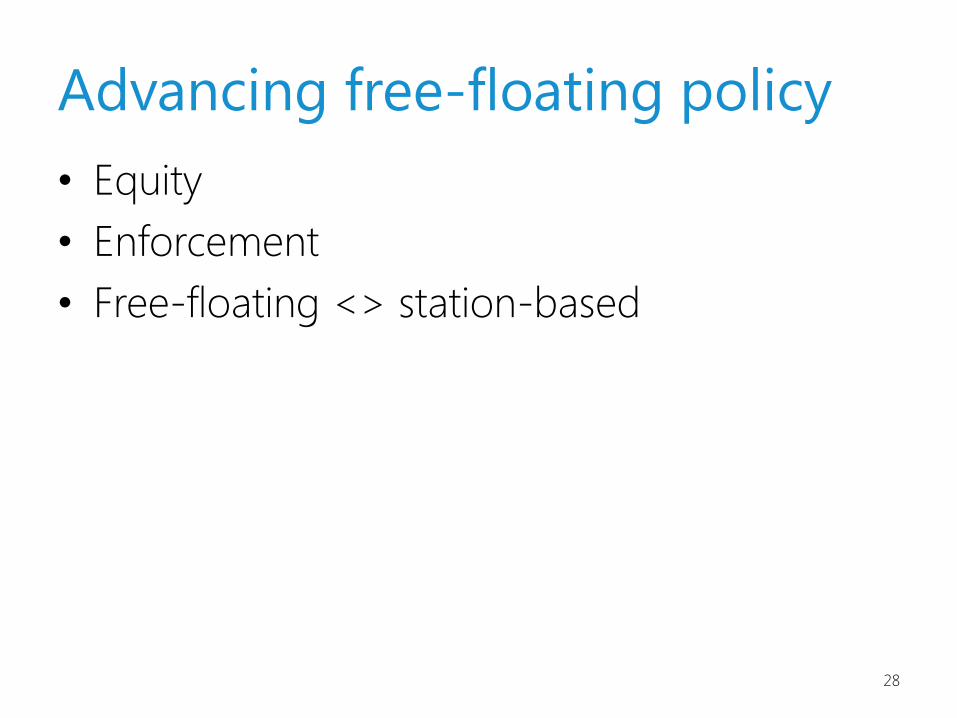
Advancing free-floating policy• Equity• Enforcement• Free-floating <> station-based
29
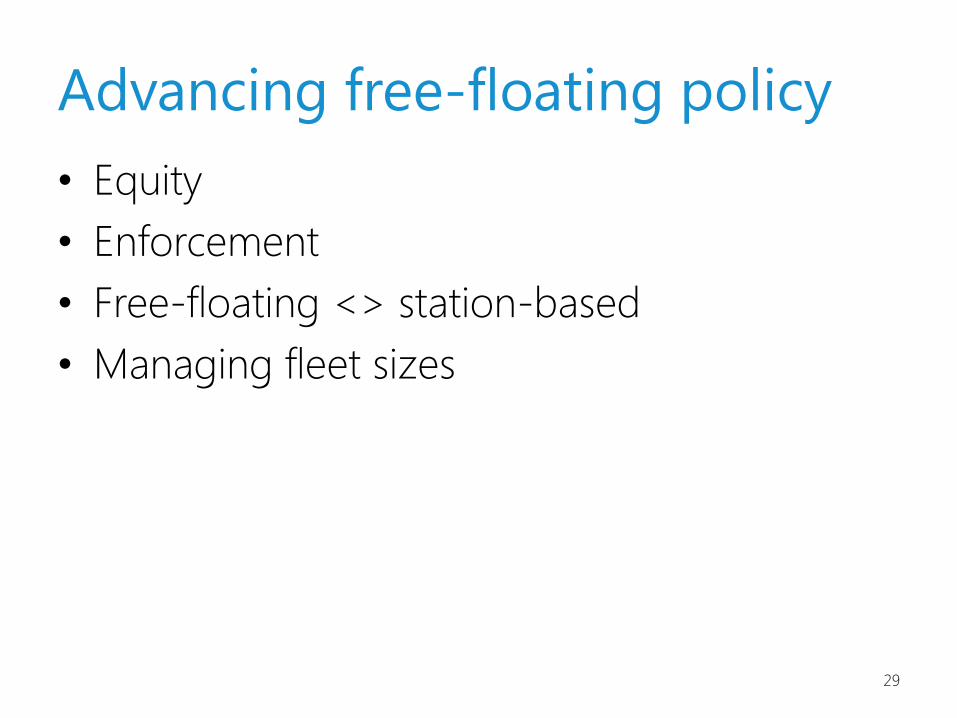
Advancing free-floating policy• Equity• Enforcement• Free-floating <> station-based• Managing fleet sizes
30
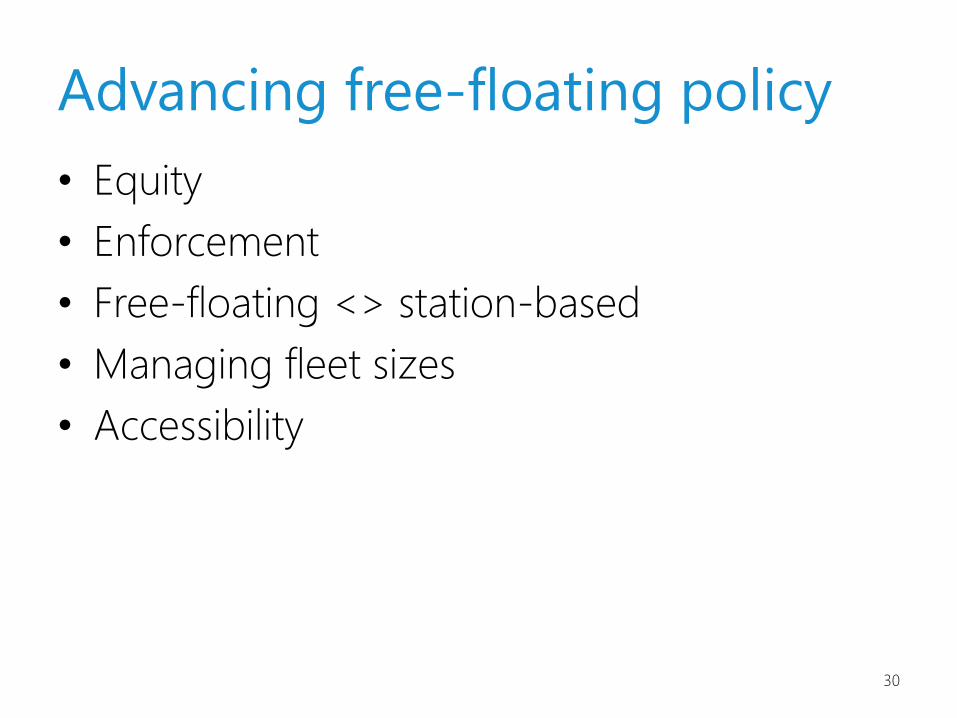
Advancing free-floating policy• Equity• Enforcement• Free-floating <> station-based• Managing fleet sizes• Accessibility
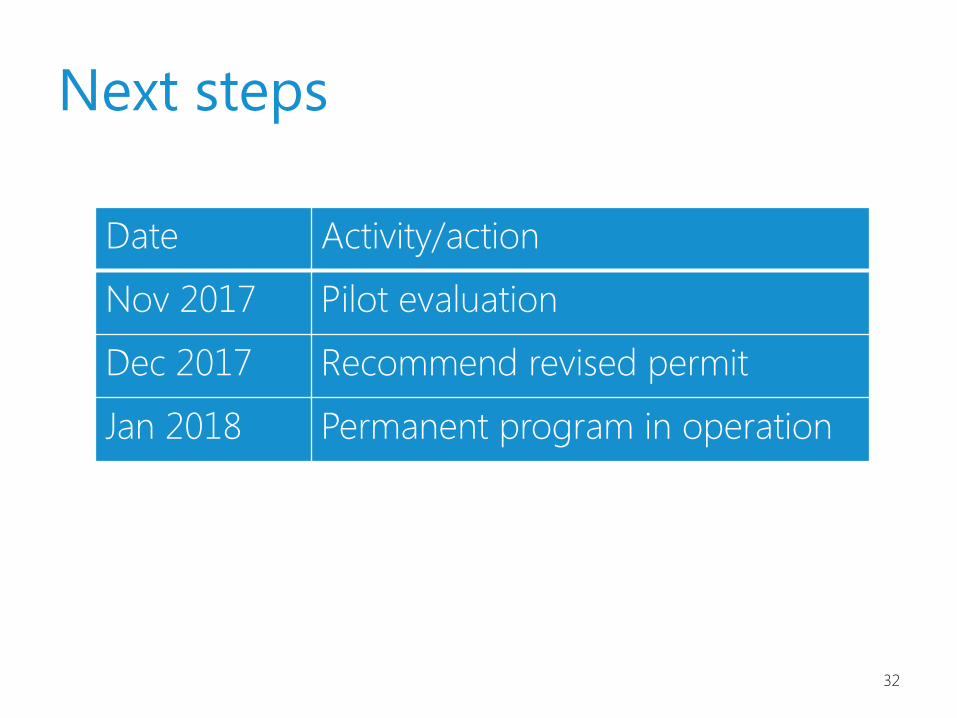
Next steps
Date Activity/action
Nov 2017 Pilot evaluation
Dec 2017 Recommend revised permit
Jan 2018 Permanent program in operation
32
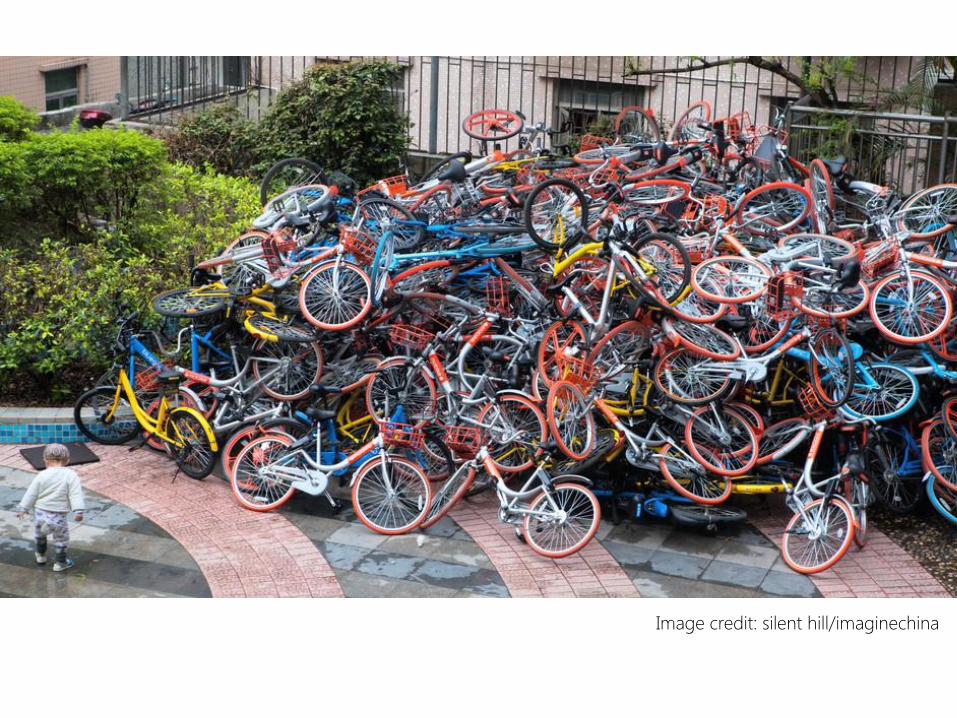
Image credit: silent hill/imaginechina

40
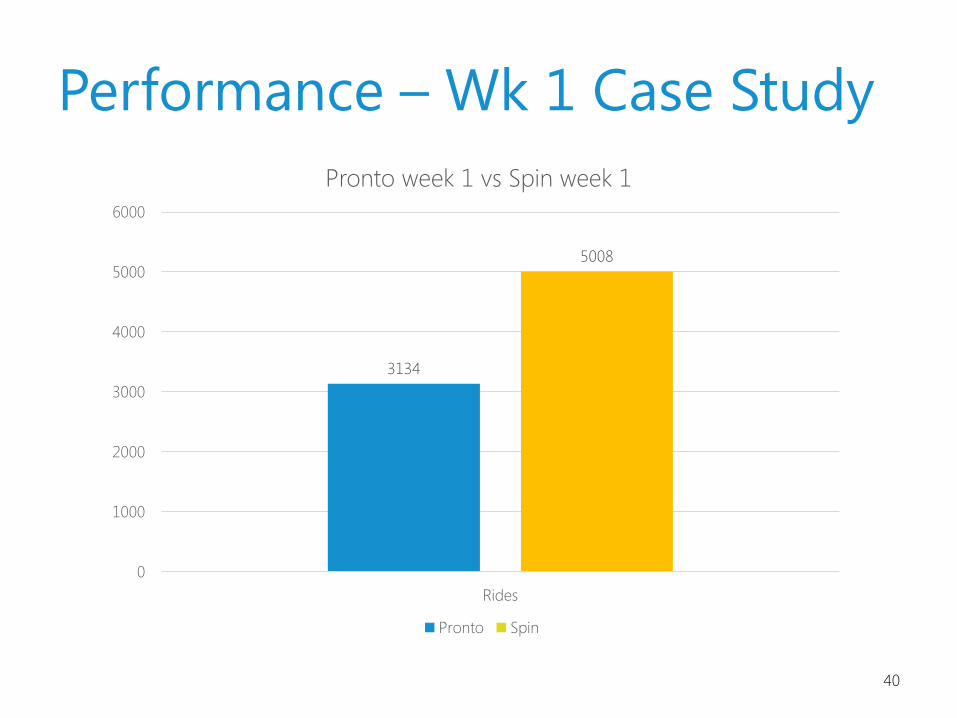
Performance – Wk 1 Case Study
3134
5008
0
1000
2000
3000
4000
5000
6000
Rides
Pronto week 1 vs Spin week 1
Pronto Spin
41
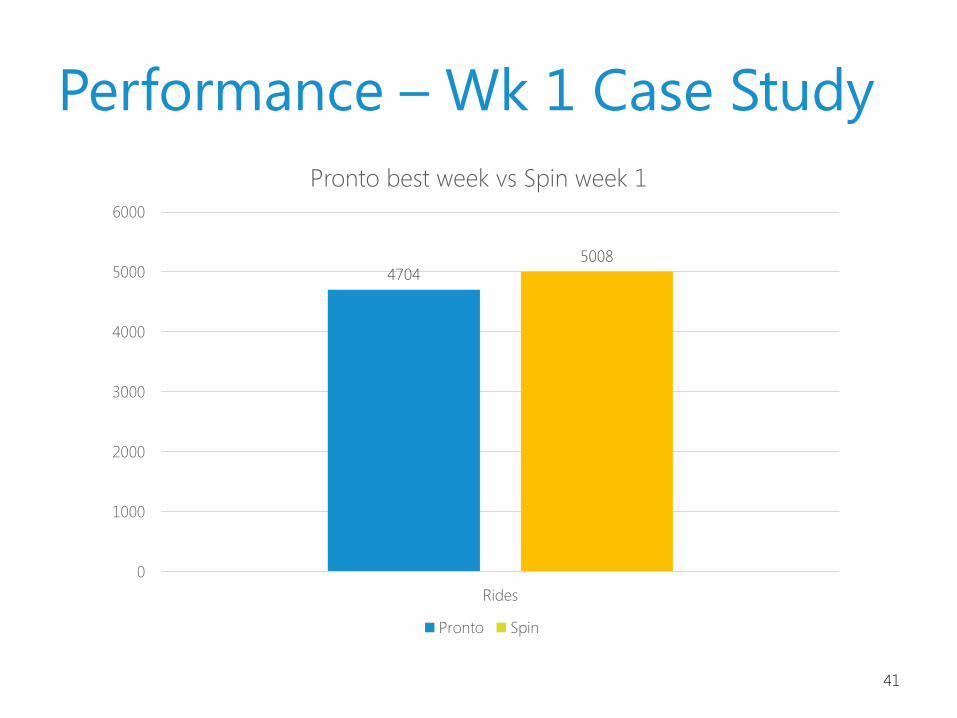
Performance – Wk 1 Case Study
47045008
0
1000
2000
3000
4000
5000
6000
Rides
Pronto best week vs Spin week 1
Pronto Spin
42
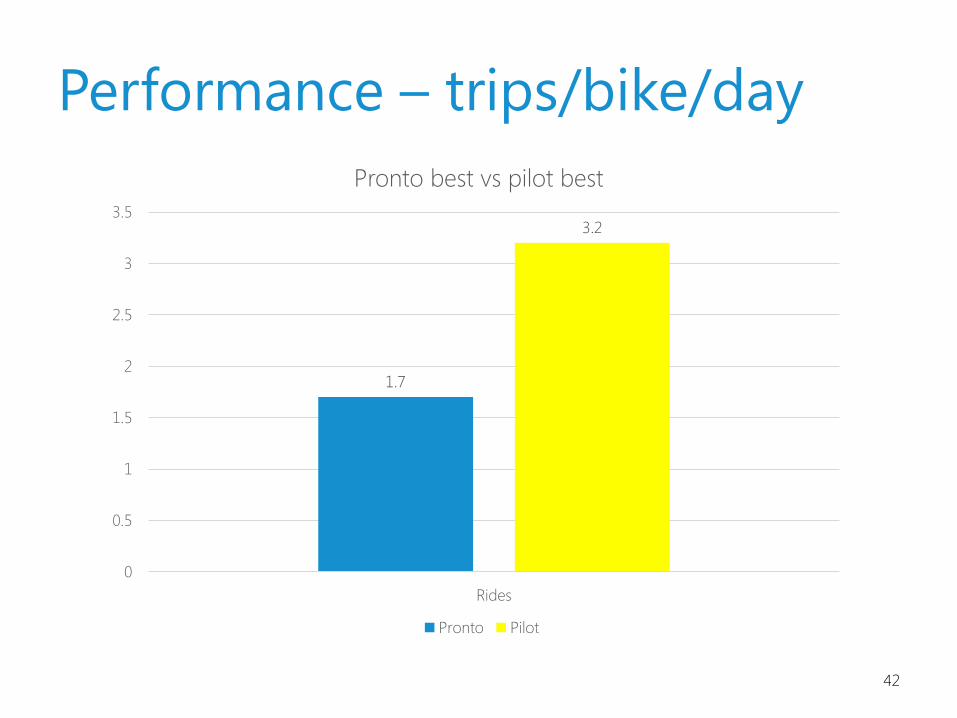
Performance – trips/bike/day
1.7
3.2
0
0.5
1
1.5
2
2.5
3
3.5
Rides
Pronto best vs pilot best
Pronto Pilot
43
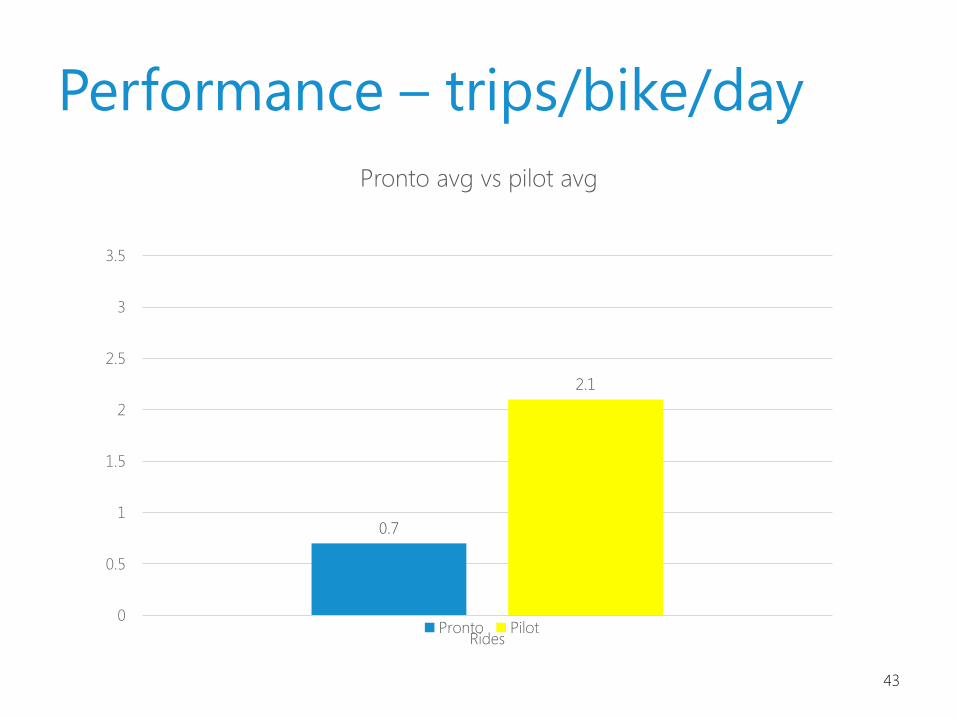
Performance – trips/bike/day
0.7
2.1
0
0.5
1
1.5
2
2.5
3
3.5
Rides
Pronto avg vs pilot avg
Pronto Pilot