2013 SEMA Annual Market Report · 2013 SEMA Annual Market Report 1 Three years of positive results...
83
2013 SEMA Annual Market Report
Transcript of 2013 SEMA Annual Market Report · 2013 SEMA Annual Market Report 1 Three years of positive results...

2013 SEMA AnnualMarket Report

2013 SEMA Annual Market Report
11
Three years of positive results point to a renewed growth trend for the Specialty Equipment Market. Overall, specialty equipment industry sales in 2012 climbed 4% to over $31 billion.
Fueled by a rebirth of the muscle car, street performance products lead the growth of the industry. Models such as the Mustang, Camaro, and Challenger are sparking increased passion for performance products. The Camaro and Mustang were the most commonly displayed cars at the 2012 SEMA Show, indicating the industry’s focus on the new muscle. But, muscle cars aren’t the only ones getting the industry excited, a newcomer, the Scion FR-S, was also one of the most common 2012 SEMA Show booths vehicles.
The truck market continues to rebound, both in terms of new-vehicle sales and specialty equipment sales. Sales of specialty equipment for light trucks grew 1% in 2012 to reverse a declining trend that was set off by the recent recession. New pickup truck sales are up for the third year, climbing 6.4% in 2012. With GM and Ford due to release major redesigns to their flagship pickups in the next couple models years, the truck sector looks like it should continue a slow recovery.
The off-road market continues to be solid, with the Wrangler continuing as one of the most popular booth vehicles at the 2012 SEMA Show. With the Wrangler Unlimited accounting for nearly half of the Jeep vehicles in SEMA Show booths, the industry sees a lot of possibility for the four-door off-road sector.
Industry optimism continues to build. The 2012 SEMA Show brought in a record attendance and the 2013 Show is shaping up to be even bigger. SEMA industry research shows that most companies are reporting sales are up over the last year and they expect growth going forward. More than 40 companies recently attended a new product development conference sponsored by SEMA. And in anticipation of further growth opportunities for members, SEMA is opening a new product development facility, the SEMA Garage – Industry Innovations Center.
Most economic indicators are showing positive signs, resulting in GDP growth and lower unemployment rates. Forecasters are generally predicting moderate, but increasing growth for the US economy over the next few years. While we aren’t returning to the free spending days of the past decade, positive eco-nomic growth combined with the rebound in new-vehicle sales point to continued positive results for the specialty equipment market.
For the first time, the 2013 SEMA Annual Market Report includes sales estimates for a separate product category, Suspension. This gives us the opportunity to track an important industry product group which hasn’t been reported as a separate category previously. In addition, the Q1 2013 SEMA Market Update is integrated into the Annual Market Report to provide additional updates on economic and industry trends.
Think of this report as a starting point for the information that SEMA can provide to help your business. We encourage you to take advantage of its findings as well as all of the research reports available on our website, www.SEMA.org .
As always, if you have any questions or require assistance with the data or information in this report, please let us know.
Gavin Knapp Senior Manager, Market Research
Introduction
2013 SEMA Annual Market Report
22
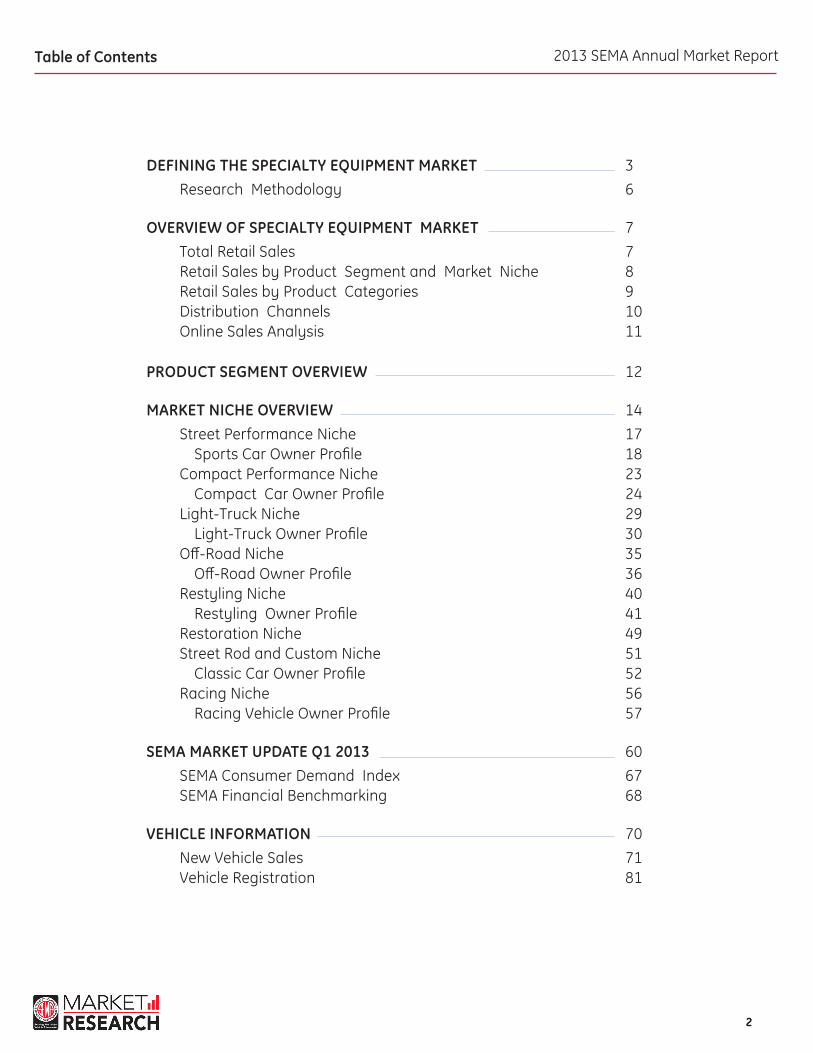
DEFINING THE SPECIALTY EQUIPMENT MARKET 3 Research Methodology 6
OVERVIEW OF SPECIALTY EQUIPMENT MARKET 7 Total Retail Sales 7 Retail Sales by Product Segment and Market Niche 8 Retail Sales by Product Categories 9 Distribution Channels 10 Online Sales Analysis 11
PRODUCT SEGMENT OVERVIEW 12
MARKET NICHE OVERVIEW 14 Street Performance Niche 17 Sports Car Owner Profile 18 Compact Performance Niche 23 Compact Car Owner Profile 24 Light-Truck Niche 29 Light-Truck Owner Profile 30 Off-Road Niche 35 Off-Road Owner Profile 36 Restyling Niche 40 Restyling Owner Profile 41 Restoration Niche 49 Street Rod and Custom Niche 51 Classic Car Owner Profile 52 Racing Niche 56 Racing Vehicle Owner Profile 57 SEMA MARKET UPDATE Q1 2013 60 SEMA Consumer Demand Index 67 SEMA Financial Benchmarking 68
VEHICLE INFORMATION 70 New Vehicle Sales 71 Vehicle Registration 81
Table of Contents

2013 SEMA Annual Market Report
33
Defining the Specialty Equipment Market
DEFINING THE SPECIALTY EQUIPMENT MARKETThe specialty equipment market includes parts and accessories that are manufactured, sold and distributed for cars, light trucks, and other passenger vehicles (motorcycles, ATVs, UTVs, boats, etc.). These products are designed to customize or enhance the performance, handling or appearance of new or used vehicles. The market does not however include direct repair or replacement parts intended to replicate factory specs (except in the case of restoration parts for older vehicles). The specialty equipment market is often described as the parts you want rather than those you need. Some examples of products that fall into the specialty equipment market include exhaust kits, suspension kits, custom wheels, stereo systems and engine modifications to increase horsepower.
Throughout this report, SEMA tracks two broad types of sub-groups within the specialty equipment market: Product Segments and Market Niches.
PRODUCT SEGMENTSSEMA defines three product segments to include everything in the specialty equipment market: accessory and appearance products; performance products; and wheels, tires and suspension. These segments are made up of groups of products that serve similar functions and are generally added for the purpose of comparison.
Accessory and appearance products include interior trim and accessories; restyling and appearance products; specialty waxes and chemicals; graphics and decals; sunroofs; and others. This segment has a broader range and larger number of products than the other latter two segments. These products are often a non-enthusiast’s initial contact with the automotive specialty equipment industry. Many consumers keep coming back and, in the process, escalate their involvement with other industry products along the way.
The second product segment is performance products, which includes internal engine, drivetrain, exhaust system, fuel system and ignition components designed to improve performance through increased durability, capability or dependability. This “go-fast” segment has long been thought of as the heart of the specialty equipment market.
The third product segment in the specialty equipment industry is wheels, tires and suspension. Wheels, tires and suspension components include specialty shocks, struts, lowering packages, lift kits, custom wheels, performance tires and performance brakes. Custom wheels have become the most visible item in this product mix, though suspension upgrades are also common for performance and off-road enthusiasts.
2013 SEMA Annual Market Report
44
SEMA defines eight primary and one miscellaneous market niche, each of which includes the three product segments. Each of these market niches is centered around a vehicle type, how the vehicle is used or the type of components involved in the vehicle use. The three product segments detailed in the previous section are sold and installed in each of the niches.
Four major types of information are combined to determine the size of each of the eight primary specialty equipment markets: product information, vehicle information, distributor/retailer/installer information and parallel research. For some niches, market size is determined by a combination of factors.
For example, defining the light-truck market and off-road market volumes involves determining the nature of the vehicle on which the products are used [truck versus SUV/CUV versus car, etc.] and examining the nature of the product and its design purpose. Such definitions also involve combining information about product volume through particular retailers and distributors as well as specific outlets or installers where the products were purchased. For example, products designed for the trail [even if used on-road] would be allocated to the off-road market.
The nine niches SEMA recognizes are: Street Performance Market Compact Performance Market Light-Truck Market Restyling Market Restoration Market Off-Road Market Street Rod and Custom Market Racing Market Other
MARKET NICHES
Defining the Specialty Equipment Market
2013 SEMA Annual Market Report
55
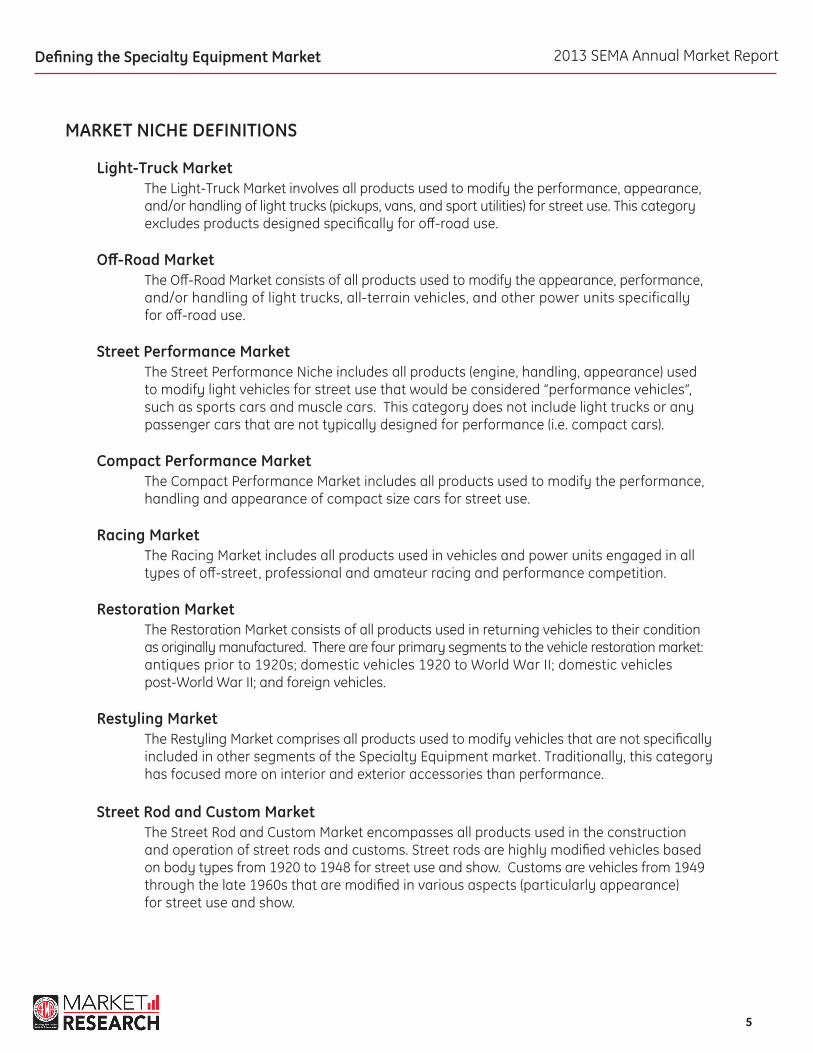
Light-Truck Market The Light-Truck Market involves all products used to modify the performance, appearance, and/or handling of light trucks (pickups, vans, and sport utilities) for street use. This category excludes products designed specifically for off-road use.
Off-Road Market The Off-Road Market consists of all products used to modify the appearance, performance, and/or handling of light trucks, all-terrain vehicles, and other power units specifically for off-road use.
Street Performance Market The Street Performance Niche includes all products (engine, handling, appearance) used to modify light vehicles for street use that would be considered “performance vehicles”, such as sports cars and muscle cars. This category does not include light trucks or any passenger cars that are not typically designed for performance (i.e. compact cars).
Compact Performance Market The Compact Performance Market includes all products used to modify the performance, handling and appearance of compact size cars for street use.
Racing Market The Racing Market includes all products used in vehicles and power units engaged in all types of off-street, professional and amateur racing and performance competition.
Restoration Market The Restoration Market consists of all products used in returning vehicles to their condition as originally manufactured. There are four primary segments to the vehicle restoration market: antiques prior to 1920s; domestic vehicles 1920 to World War II; domestic vehicles post-World War II; and foreign vehicles.
Restyling Market The Restyling Market comprises all products used to modify vehicles that are not specifically included in other segments of the Specialty Equipment market. Traditionally, this category has focused more on interior and exterior accessories than performance.
Street Rod and Custom Market The Street Rod and Custom Market encompasses all products used in the construction and operation of street rods and customs. Street rods are highly modified vehicles based on body types from 1920 to 1948 for street use and show. Customs are vehicles from 1949 through the late 1960s that are modified in various aspects (particularly appearance) for street use and show.
MARKET NICHE DEFINITIONS
Defining the Specialty Equipment Market

2013 SEMA Annual Market Report
66
RESEARCH METHODOLOGY
The 2013 SEMA Annual Market Report was compiled utilizing a variety of data sources, including interviews with industry sources, consumer surveys, secondary data sources and published government statistics. The main data was provided by:
Lang Marketing Resources: Retail and Manufacturer Sales; Retail Sales Channels Information was gathered on 2012 specialty equipment market volume for retailers, jobbers and warehouse outlets; sales by product segment; and product sales by eight market niches. The data was collected through telephone interviews, mailed questionnaires, Internet questionnaires and parallel research.
SEMA Consumer Segmentation: Vehicle Owner Profiles; Consumer Data The study surveyed 3,000 people across the U.S. who spent more than $100 per year modifying or accessorizing their vehicles. This study represents the buying habits of a large cross-section of specialty equipment buyers. The full SEMA Consumer Segmentation report is available for download from the SEMA website (sema.org/research), but pertinent details from the research were used in preparing this 2013 SEMA Annual Market Report.
Ward’s Auto: New-Vehicle Sales Information was collected from Ward’s online data library at www.wardsauto.com.
Experian: Vehicle Registrations The data collected covered vehicles registered through the 2012 calendar year.
U.S. Census Bureau; Federal Reserve; Bureau of Economic Analysis; U.S. Energy Information Administration: National Economic Trends Data was collected from published government statistics.
Defining the Specialty Equipment Market
2013 SEMA Annual Market Report
77
OVERVIEW OF SPECIALTY EQUIPMENT MARKET
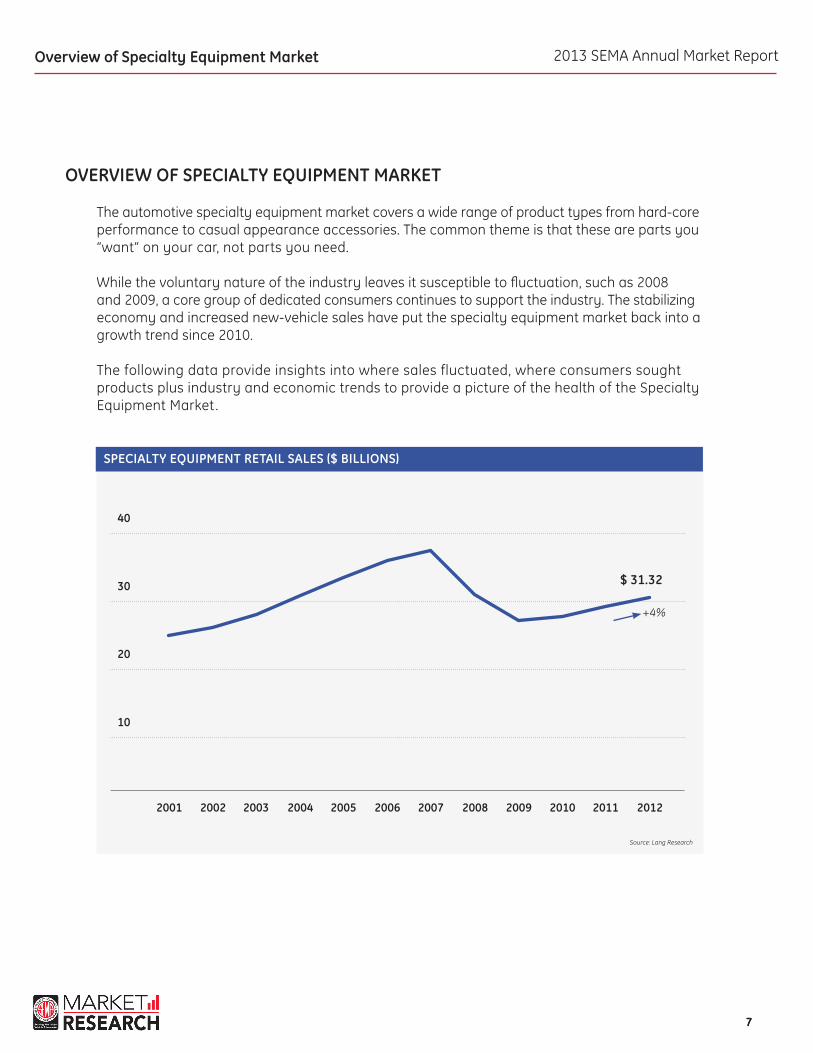
The automotive specialty equipment market covers a wide range of product types from hard-core performance to casual appearance accessories. The common theme is that these are parts you “want” on your car, not parts you need.
While the voluntary nature of the industry leaves it susceptible to fluctuation, such as 2008 and 2009, a core group of dedicated consumers continues to support the industry. The stabilizing economy and increased new-vehicle sales have put the specialty equipment market back into a growth trend since 2010.
The following data provide insights into where sales fluctuated, where consumers sought products plus industry and economic trends to provide a picture of the health of the Specialty Equipment Market .
Overview of Specialty Equipment Market
SPECIALTY EQUIPMENT RETAIL SALES ($ BILLIONS)
2001 2005 20092003 2007 20112002 2006 20102004 2008 2012
40
20
30
10
$ 31.32
+4%
Source: Lang Research

2013 SEMA Annual Market Report
88
Overview of Specialty Equipment Market
2012 RETAIL SALES BY SEGMENT ($ BILLIONS)
2012 RETAIL SALES BY NIChE ($ BILLIONS)
0
0($ BILLIONS)
($ BILLIONS)
5
1
15
3 4 5 6 7 8
10
2
Accessory and Appearance Products
Street Performance
Off-Road
Light-Truck
Racing
$ 8.18
$ 10.61
$ 5.04
$ 4.23
$ 1.20
$ 4.65
$ 1.31
$ 1.46
$ 1.19
$ 12.52
$ 7.47
+5.7%
+2.7%
+3.0%
+5.6%
+5.9%
+1.0%
+2.0%
+5.2%
+5.2%
+4.9%
+15.3%
Percent Change from 2011
Percent Change from 2011
Wheels, Tiresand Suspension
Compact Performance
Restoration
Restyling
Street Rod & Custom
Performance Products
Source: Lang Research
Source: Lang Research
2013 SEMA Annual Market Report
99
Overview of Specialty Equipment Market
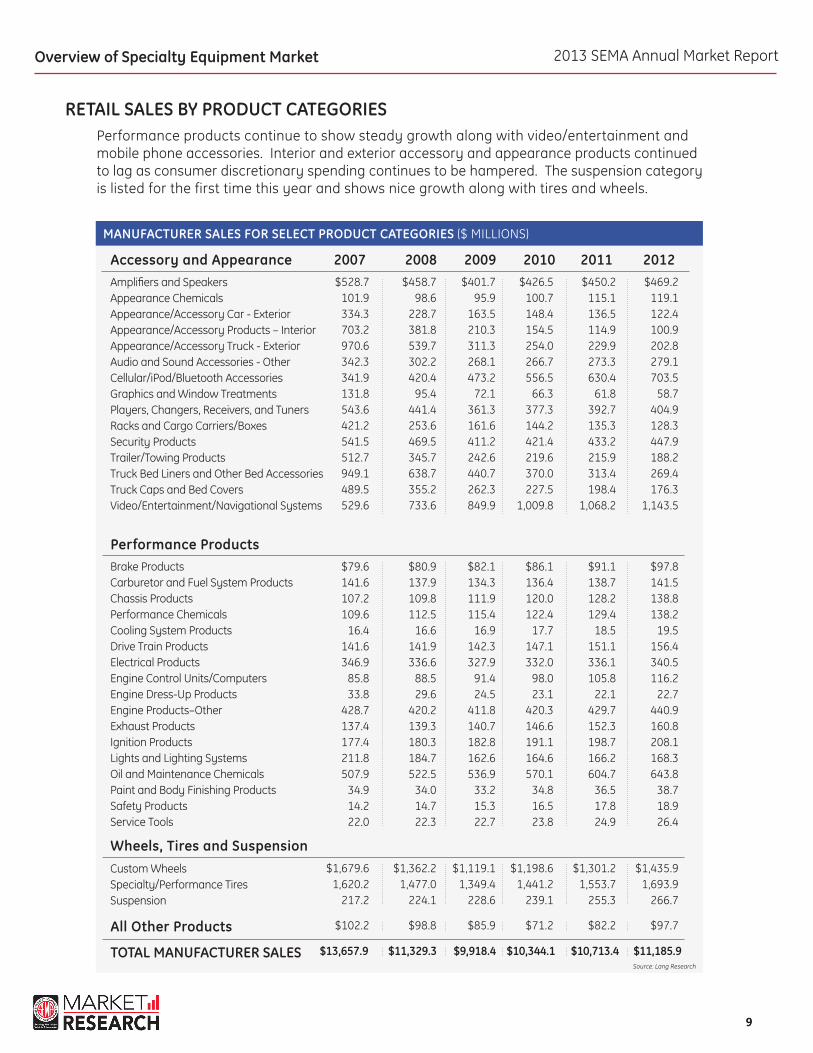
RETAIL SALES BY PRODUCT CATEGORIESPerformance products continue to show steady growth along with video/entertainment and mobile phone accessories. Interior and exterior accessory and appearance products continued to lag as consumer discretionary spending continues to be hampered. The suspension category is listed for the first time this year and shows nice growth along with tires and wheels.
MANUFACTURER SALES FOR SELECT PRODUCT CATEGORIES ($ MILLIONS)
Accessory and Appearance 2007 2008 2009 2010 2011 2012
Performance Products
Wheels, Tires and Suspension
All Other Products
TOTAL MANUFACTURER SALES
Amplifiers and SpeakersAppearance ChemicalsAppearance/Accessory Car - Exterior Appearance/Accessory Products – InteriorAppearance/Accessory Truck - ExteriorAudio and Sound Accessories - OtherCellular/iPod/Bluetooth AccessoriesGraphics and Window TreatmentsPlayers, Changers, Receivers, and TunersRacks and Cargo Carriers/BoxesSecurity ProductsTrailer/Towing ProductsTruck Bed Liners and Other Bed AccessoriesTruck Caps and Bed CoversVideo/Entertainment/Navigational Systems
Brake ProductsCarburetor and Fuel System ProductsChassis ProductsPerformance ChemicalsCooling System ProductsDrive Train ProductsElectrical ProductsEngine Control Units/ComputersEngine Dress-Up ProductsEngine Products–OtherExhaust ProductsIgnition ProductsLights and Lighting SystemsOil and Maintenance ChemicalsPaint and Body Finishing ProductsSafety ProductsService Tools
Custom WheelsSpecialty/Performance TiresSuspension
$528.7 101.9 334.3 703.2 970.6 342.3 341.9 131.8 543.6 421.2 541.5 512.7 949.1 489.5 529.6
$458.7 98.6
228.7 381.8 539.7 302.2 420.4
95.4 441.4 253.6 469.5 345.7 638.7 355.2 733.6
$401.7 95.9
163.5 210.3 311.3 268.1 473.2
72.1 361.3 161.6 411.2 242.6 440.7 262.3 849.9
$426.5 100.7 148.4 154.5 254.0 266.7 556.5
66.3 377.3 144.2 421.4 219.6 370.0 227.5
1,009.8
$450.2 115.1 136.5 114.9 229.9 273.3 630.4
61.8 392.7 135.3 433.2 215.9 313.4 198.4
1,068.2
$469.2119.1122.4100.9202.8279.1703.5
58.7404.9128.3447.9188.2269.4176.3
1,143.5
$79.6 141.6 107.2 109.6
16.4 141.6 346.9
85.8 33.8
428.7 137.4 177.4 211.8 507.9
34.9 14.2 22.0
$80.9 137.9 109.8 112.5
16.6 141.9 336.6
88.5 29.6
420.2 139.3 180.3 184.7 522.5
34.0 14.7 22.3
$82.1 134.3 111.9 115.4
16.9 142.3 327.9
91.4 24.5
411.8 140.7 182.8 162.6 536.9
33.2 15.3 22.7
$86.1136.4 120.0 122.4
17.7 147.1 332.0
98.0 23.1
420.3 146.6 191.1 164.6 570.1
34.8 16.5 23.8
$91.1 138.7 128.2 129.4
18.5 151.1 336.1 105.8
22.1 429.7 152.3 198.7 166.2 604.7
36.5 17.8 24.9
$97.8141.5138.8138.2
19.5156.4340.5116.2
22.7440.9160.8208.1168.3643.8
38.718.926.4
$1,679.6 1,620.2
217.2
$1,362.2 1,477.0
224.1
$1,119.1 1,349.4
228.6
$1,198.6 1,441.2
239.1
$1,301.2 1,553.7
255.3
$1,435.91,693.9
266.7
$102.2 $98.8 $85.9 $71.2 $82.2 $97.7
$13,657.9 $11,329.3 $9,918.4 $10,344.1 $10,713.4 $11,185.9Source: Lang Research
2013 SEMA Annual Market Report
1010
Overview of Specialty Equipment Market
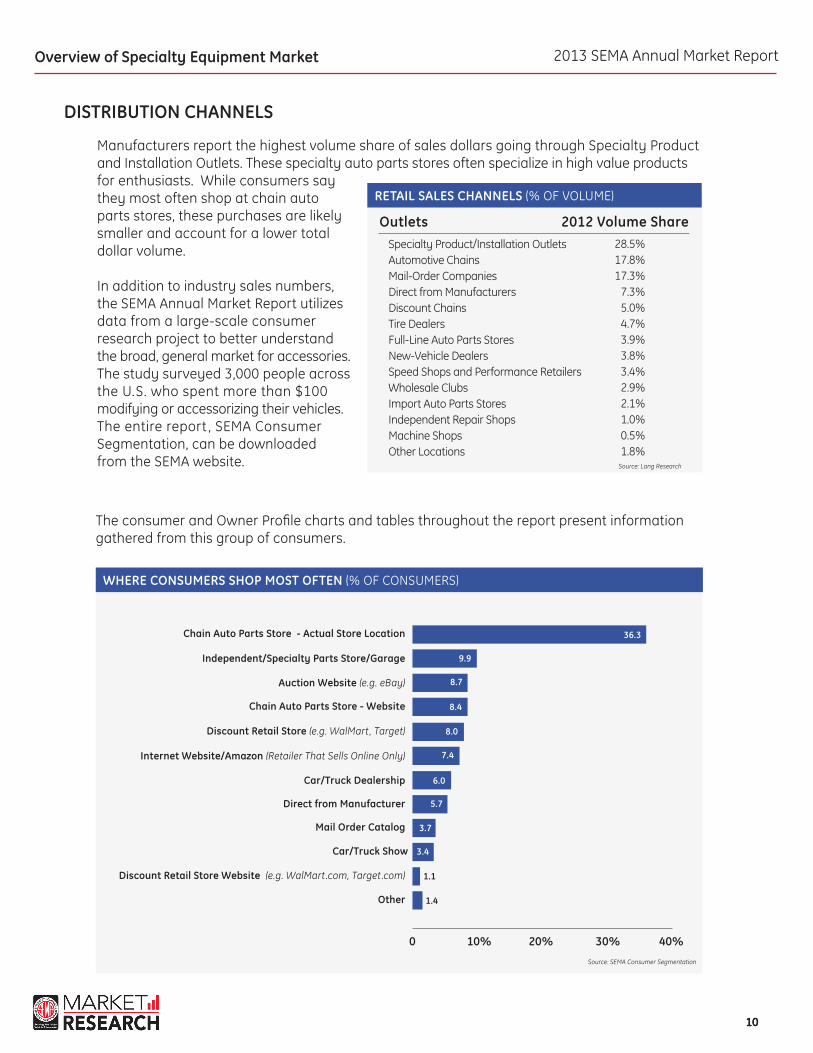
DISTRIBUTION ChANNELS
Manufacturers report the highest volume share of sales dollars going through Specialty Product and Installation Outlets. These specialty auto parts stores often specialize in high value products for enthusiasts. While consumers say they most often shop at chain auto parts stores, these purchases are likely smaller and account for a lower total dollar volume.
In addition to industry sales numbers, the SEMA Annual Market Report utilizes data from a large-scale consumer research project to better understand the broad, general market for accessories. The study surveyed 3,000 people across the U.S. who spent more than $100 modifying or accessorizing their vehicles. The entire report , SEMA Consumer Segmentation, can be downloaded from the SEMA website.
The consumer and Owner Profile charts and tables throughout the report present information gathered from this group of consumers.
RETAIL SALES CHANNELS (% OF VOLUME)
Outlets 2012 Volume ShareSpecialty Product/Installation OutletsAutomotive ChainsMail-Order CompaniesDirect from ManufacturersDiscount ChainsTire DealersFull-Line Auto Parts StoresNew-Vehicle DealersSpeed Shops and Performance RetailersWholesale ClubsImport Auto Parts StoresIndependent Repair ShopsMachine ShopsOther Locations
28.5%17.8%17.3%
7.3%5.0%4.7%3.9%3.8%3.4%2.9%2.1%1.0%0.5%1.8%
Source: Lang Research
Source: SEMA Consumer Segmentation
WHERE CONSUMERS SHOP MOST OFTEN (% OF CONSUMERS)
0 10% 30% 40%20%
Chain Auto Parts Store - Actual Store Location
Discount Retail Store (e.g. WalMart, Target)
Mail Order Catalog
Independent/Specialty Parts Store/Garage
Internet Website/Amazon (Retailer That Sells Online Only)
Car/Truck Show
Auction Website (e.g. eBay)
Car/Truck Dealership
Discount Retail Store Website (e.g. WalMart.com, Target.com)
Chain Auto Parts Store - Website
Direct from Manufacturer
Other
36.3
8.0
3.7
8.7
6.0
1.1
9.9
7.4
3.4
8.4
5.7
1.4
2013 SEMA Annual Market Report
1111
Overview of Specialty Equipment Market
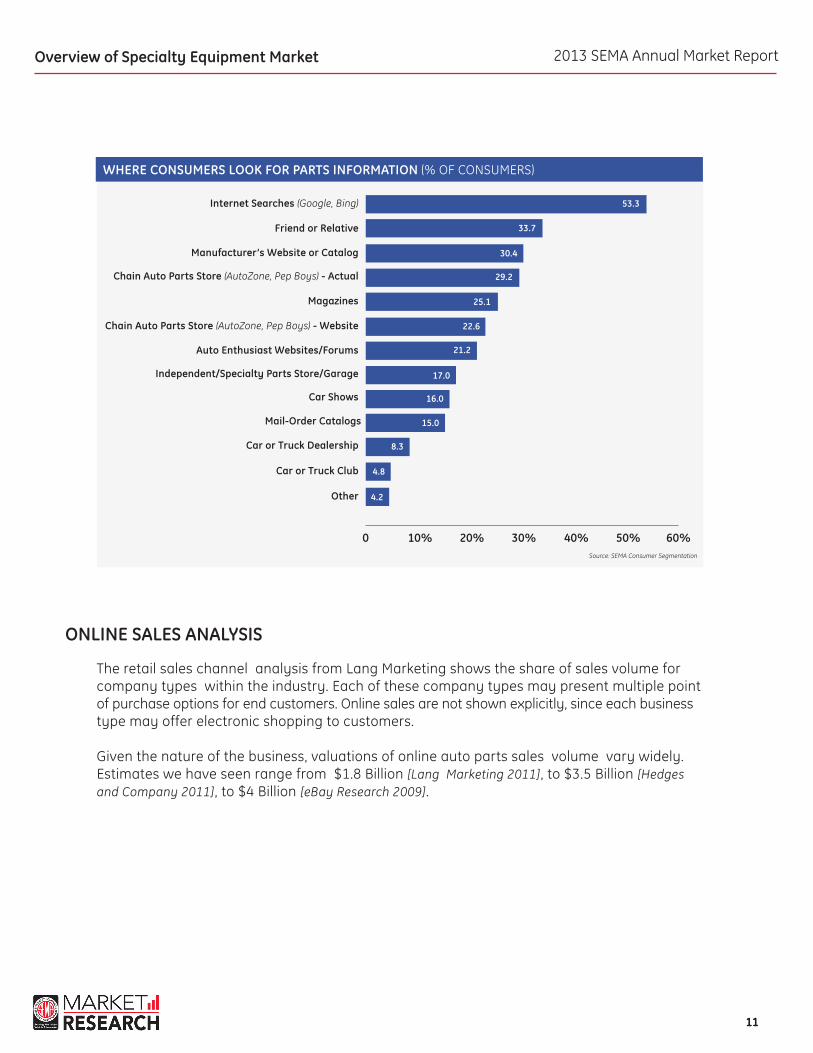
ONLINE SALES ANALYSIS
The retail sales channel analysis from Lang Marketing shows the share of sales volume for company types within the industry. Each of these company types may present multiple point of purchase options for end customers. Online sales are not shown explicitly, since each business type may offer electronic shopping to customers.
Given the nature of the business, valuations of online auto parts sales volume vary widely. Estimates we have seen range from $1.8 Billion [Lang Marketing 2011], to $3.5 Billion [Hedges and Company 2011], to $4 Billion [eBay Research 2009].
Source: SEMA Consumer Segmentation
WHERE CONSUMERS LOOK FOR PARTS INFORMATION (% OF CONSUMERS)
0 10% 30% 40% 50% 60%20%
Internet Searches (Google, Bing)
Magazines
Car Shows
Friend or Relative
Chain Auto Parts Store (AutoZone, Pep Boys) - Website
Mail-Order Catalogs
Manufacturer’s Website or Catalog
Auto Enthusiast Websites/Forums
Car or Truck Dealership
Car or Truck Club
Chain Auto Parts Store (AutoZone, Pep Boys) - Actual
Independent/Specialty Parts Store/Garage
Other
53.3
22.6
15.0
29.2
17.0
4.8
30.4
33.7
21.2
8.3
25.1
16.0
4.2
2013 SEMA Annual Market Report
1212
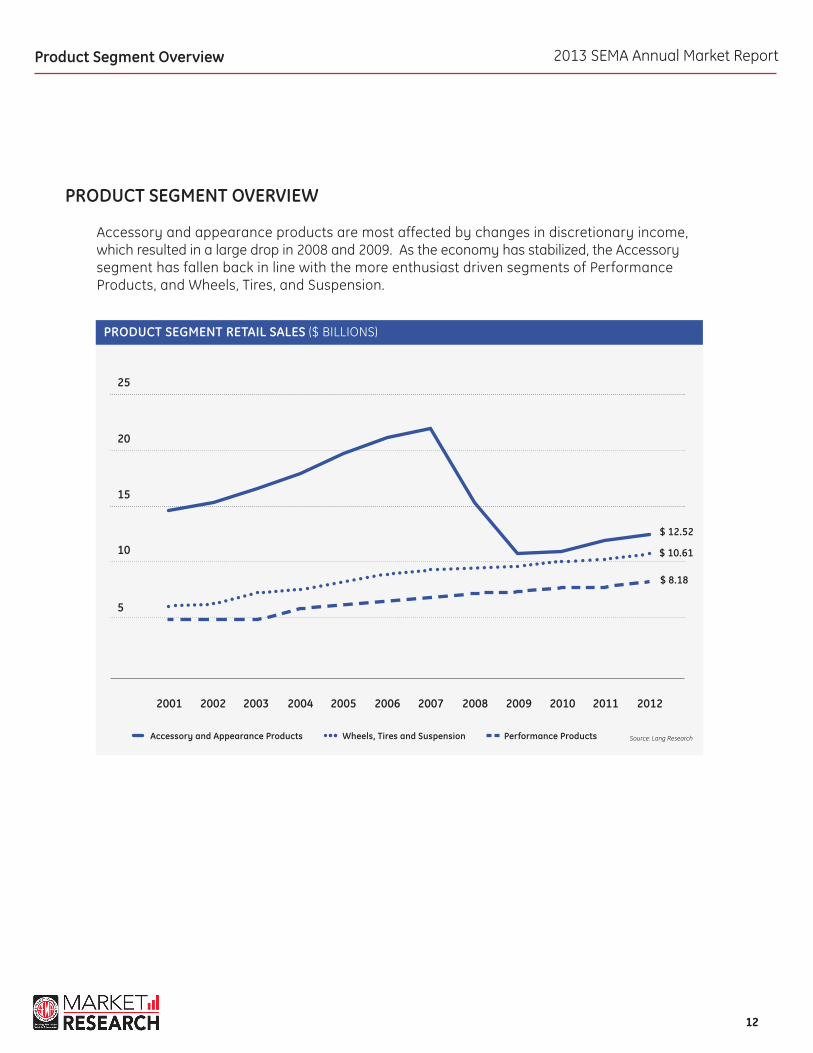
PRODUCT SEGMENT OVERVIEW
Accessory and appearance products are most affected by changes in discretionary income, which resulted in a large drop in 2008 and 2009. As the economy has stabilized, the Accessory segment has fallen back in line with the more enthusiast driven segments of Performance Products, and Wheels, Tires, and Suspension.
Product Segment Overview
PRODUCT SEGMENT RETAIL SALES ($ BILLIONS)
2001 2005 20092003 2007 20112002 2006 20102004 2008 2012
10
15
20
25
5
$ 12.52
$ 10.61
$ 8.18
Source: Lang ResearchWheels, Tires and SuspensionAccessory and Appearance Products Performance Products
2013 SEMA Annual Market Report
1313
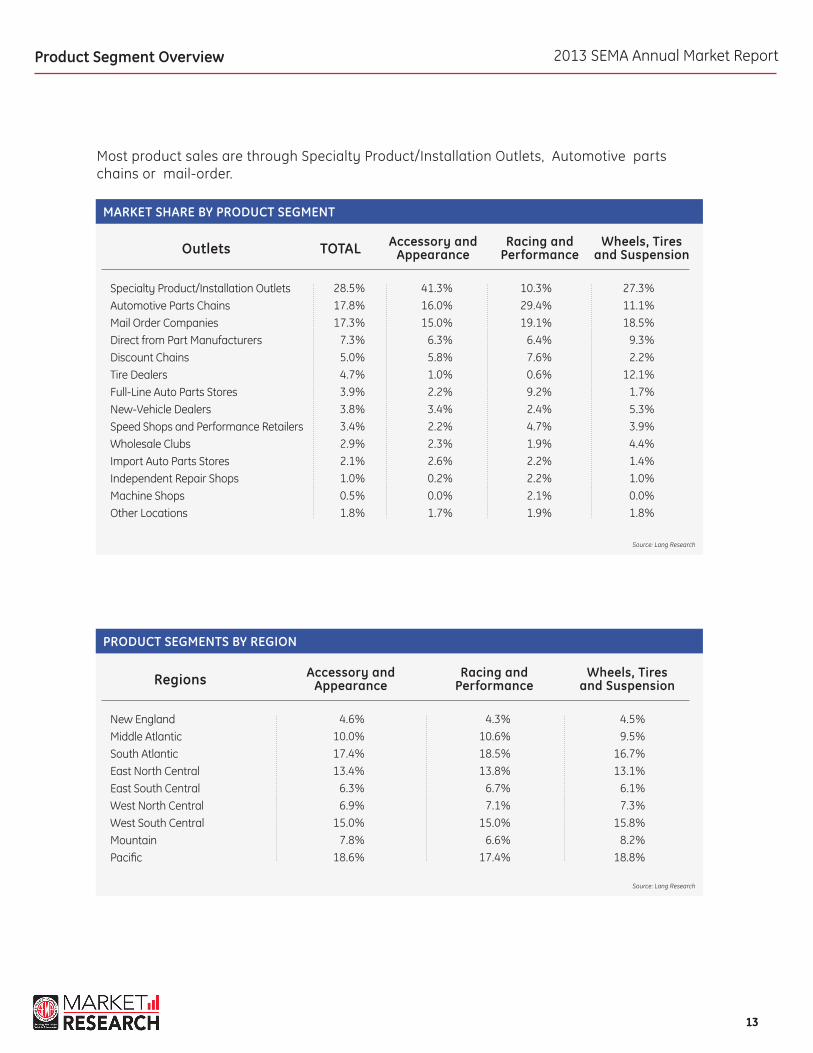
MARkET ShARE BY PRODUCT SEGMENT
PRODUCT SEGMENTS BY REGION
Outlets
Regions
TOTAL Accessory and Appearance
Accessory and Appearance
Racing and Performance
Racing and Performance
Wheels, Tires and Suspension
Wheels, Tires and Suspension
Specialty Product/Installation Outlets Automotive Parts Chains Mail Order Companies Direct from Part Manufacturers Discount Chains Tire Dealers Full-Line Auto Parts Stores New-Vehicle Dealers Speed Shops and Performance Retailers Wholesale Clubs Import Auto Parts Stores Independent Repair Shops Machine Shops Other Locations
New EnglandMiddle AtlanticSouth AtlanticEast North CentralEast South CentralWest North CentralWest South CentralMountainPacific
28.5%17.8%17.3%
7.3%5.0%4.7%3.9%3.8%3.4%2.9%2.1%1.0%0.5%1.8%
4.6%10.0%17.4%13.4%
6.3%6.9%
15.0%7.8%
18.6%
41.3%16.0%15.0%
6.3%5.8%1.0%2.2%3.4%2.2%2.3%2.6%0.2%0.0%1.7%
4.3%10.6%18.5%13.8%
6.7%7.1%
15.0%6.6%
17.4%
10.3%29.4%19.1%
6.4%7.6%0.6%9.2%2.4%4.7%1.9%2.2%2.2%2.1%1.9%
27.3%11.1%18.5%
9.3%2.2%
12.1%1.7%5.3%3.9%4.4%1.4%1.0%0.0%1.8%
4.5%9.5%
16.7%13.1%
6.1%7.3%
15.8%8.2%
18.8%
Product Segment Overview
Most product sales are through Specialty Product/Installation Outlets, Automotive parts chains or mail-order.
Source: Lang Research
Source: Lang Research
2013 SEMA Annual Market Report
1414
MARKET NICHE OVERVIEW
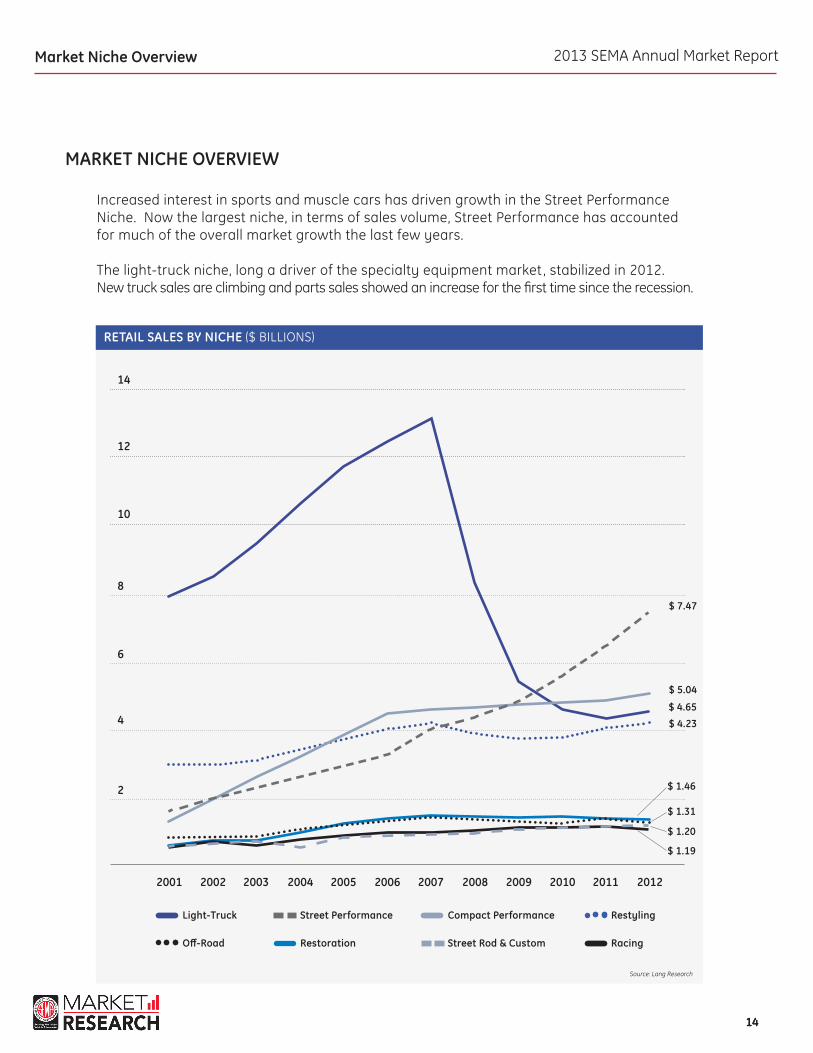
Increased interest in sports and muscle cars has driven growth in the Street Performance Niche. Now the largest niche, in terms of sales volume, Street Performance has accounted for much of the overall market growth the last few years.
The light-truck niche, long a driver of the specialty equipment market , stabilized in 2012. New truck sales are climbing and parts sales showed an increase for the first time since the recession.
Market Niche Overview
RETAIL SALES BY NIChE ($ BILLIONS)
2001 2005 20092003 2007 20112002 2006 20102004 2008 2012
4
6
8
10
12
14
2
$ 7.47
$ 4.65
$ 5.04
$ 4.23
$ 1.31
Source: Lang Research
Restyling
Off-Road
Light-Truck Compact Performance
Restoration Street Rod & Custom Racing
Street Performance
$ 1.46
$ 1.19
$ 1.20
2013 SEMA Annual Market Report
1515
Specialty Product/ Installation Outlets
Automotive Chains Mail Order CompaniesDirect from Manufacturers Discount Chains Full-Line Auto Parts Stores Tire Dealers Speed Shops & Performance Retailers
New-Vehicle Dealers Wholesale Clubs Import Auto Parts Stores Independent Repair Shops Machine Shops Other Locations
SALES ChANNELS BY NIChE (%)
RacingStreet Performance
Compact Performance
Light- Truck Off-Road Restyling Restoration Street Rod
& Custom
25.9%
19.4%17.7%
7.1%5.4%4.8%4.2%3.7%
3.5%2.9%1.8%1.4%0.4%1.8%
29.3%
16.9%17.2%
6.8%4.0%4.2%3.9%3.4%
5.8%1.8%3.3%1.2%0.4%1.8%
29.0%
17.8%16.5%
7.7%4.7%3.4%5.4%3.3%
4.1%3.4%1.7%1.1%0.2%1.7%
28.4%
15.5%17.7%
8.1%4.2%3.2%6.4%3.5%
4.3%3.6%1.6%1.2%0.4%1.9%
33.4%
17.0%16.6%
6.8%5.7%3.3%3.2%3.2%
3.5%3.1%1.9%0.7%0.2%1.4%
28.6%
17.7%17.3%
7.4%5.3%4.1%4.5%3.4%
3.6%3.0%1.8%1.2%0.6%1.5%
23.4%
15.5%18.3%
9.4%5.6%5.7%4.3%4.0%
3.3%2.8%2.0%1.6%2.6%1.5%
25.0%
19.4%17.8%
7.3%5.4%4.7%4.4%3.5%
3.8%3.0%1.7%1.4%0.8%1.8%
Market Niche Overview
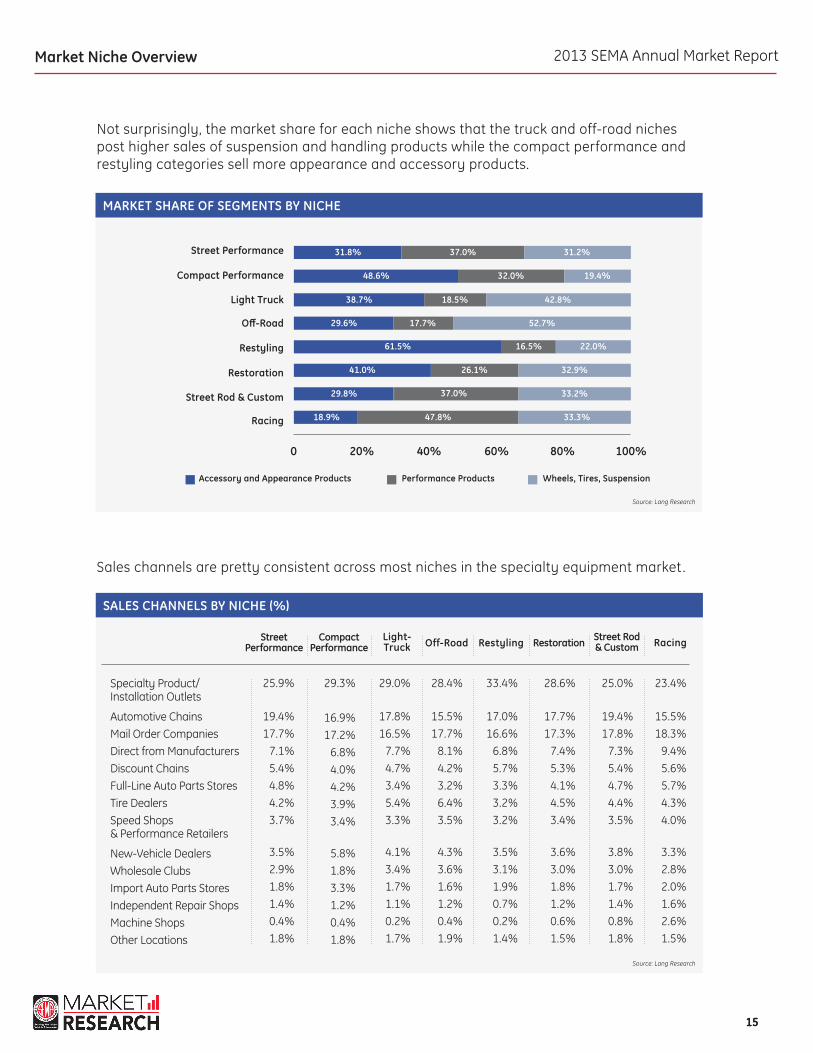
Not surprisingly, the market share for each niche shows that the truck and off-road niches post higher sales of suspension and handling products while the compact performance and restyling categories sell more appearance and accessory products.
Sales channels are pretty consistent across most niches in the specialty equipment market .
Source: Lang Research
Source: Lang Research
MARkET ShARE OF SEGMENTS BY NIChE
0 20% 60% 80% 100%40%
Street Performance
Restyling
Compact Performance
Restoration
Light Truck
Street Rod & Custom
Off-Road
Racing
31.8%
48.6%
38.7%
29.6%
61.5%
41.0%
29.8%
18.9%
37.0%
32.0%
18.5%
17.7%
16.5%
26.1%
37.0%
47.8%
31.2%
19.4%
42.8%
52.7%
22.0%
32.9%
33.2%
33.3%
Performance Products Wheels, Tires, SuspensionAccessory and Appearance Products

2013 SEMA Annual Market Report
1616
Sports car and classic car owners showed a higher propensity to perform engine, chassis and intake/ exhaust modifications than some of the other niche enthusiasts. Passenger car owners [midsize, fullsize, and luxury] were less likely to perform such “hard parts” modifications but were interested in performing interior and electrical modifications and in using chemical products.
TYPES OF MODIFICATIONS (% OF OWNERS)
Luxury Sports Car
Pickup Truck
Midsize Car
Street Performance
Restyling
Light-Truck
Compact Performance
Street Rod & Custom, Restoration
Sports Car
SUV/CUV
Large/ Fullsize Car
Small/Compact Vehicle
Van/Mini Van
Luxury Car Classic/Pre-1973
EngineChassisIntake/Fuel/ExhaustElectrical (e.g. Audio, alarm, GPS)Drivetrain (e.g. Clutch, shifter, transmission)Chemicals (e.g. Fluids, cleaners)Lighting (e.g. Exterior/Interior)Interior (e.g. Mats, safety gear) Exterior (e.g. Decals, paint, racks, truck shell, hitch) Other
EngineChassisIntake/Fuel/ExhaustElectrical (e.g. Audio, alarm, GPS)Drivetrain (e.g. Clutch, shifter, transmission)Chemicals (e.g. Fluids, cleaners)Lighting (e.g. Exterior/Interior)Interior (e.g. Mats, safety gear) Exterior (e.g. Decals, paint, racks, truck shell, hitch) Other
EngineChassisIntake/Fuel/ExhaustElectrical (e.g. Audio, alarm, GPS)Drivetrain (e.g. Clutch, shifter, transmission)Chemicals (e.g. Fluids, cleaners)Lighting (e.g. Exterior/Interior)Interior (e.g. Mats, safety gear) Exterior (e.g. Decals, paint, racks, truck shell, hitch) Other
41.9%38.1%45.6%56.9%22.5%40.0%49.4%50.6%38.8%
4.4%
24.7%29.0%35.5%33.4%11.6%44.0%22.8%46.3%57.5%
8.3%
20.3%22.6%26.6%40.3%10.5%46.1%26.1%46.6%32.4%
8.4%
43.0%40.8%51.5%41.3%25.0%42.5%31.3%51.8%42.5%
6.5%
17.8%23.6%26.8%42.3%
7.5%45.7%27.5%47.7%43.8%
9.0%
33.3%39.8%34.9%40.9%15.6%48.9%32.8%39.8%36.6%
8.6%
23.0%26.3%32.6%42.9%15.8%39.5%30.3%48.7%35.3%
6.9%
23.2%16.8%22.4%32.8%11.2%42.4%25.6%44.0%30.4%14.4%
28.5%29.5%29.5%44.4%15.0%39.1%28.5%48.8%37.7%
5.8%
60.2%55.6%61.7%39.3%36.7%42.9%27.6%50.0%42.3%
6.6%
Source: Lang Research
Market Niche Overview
2013 SEMA Annual Market Report
1717
STREET PERFORMANCE NICHE
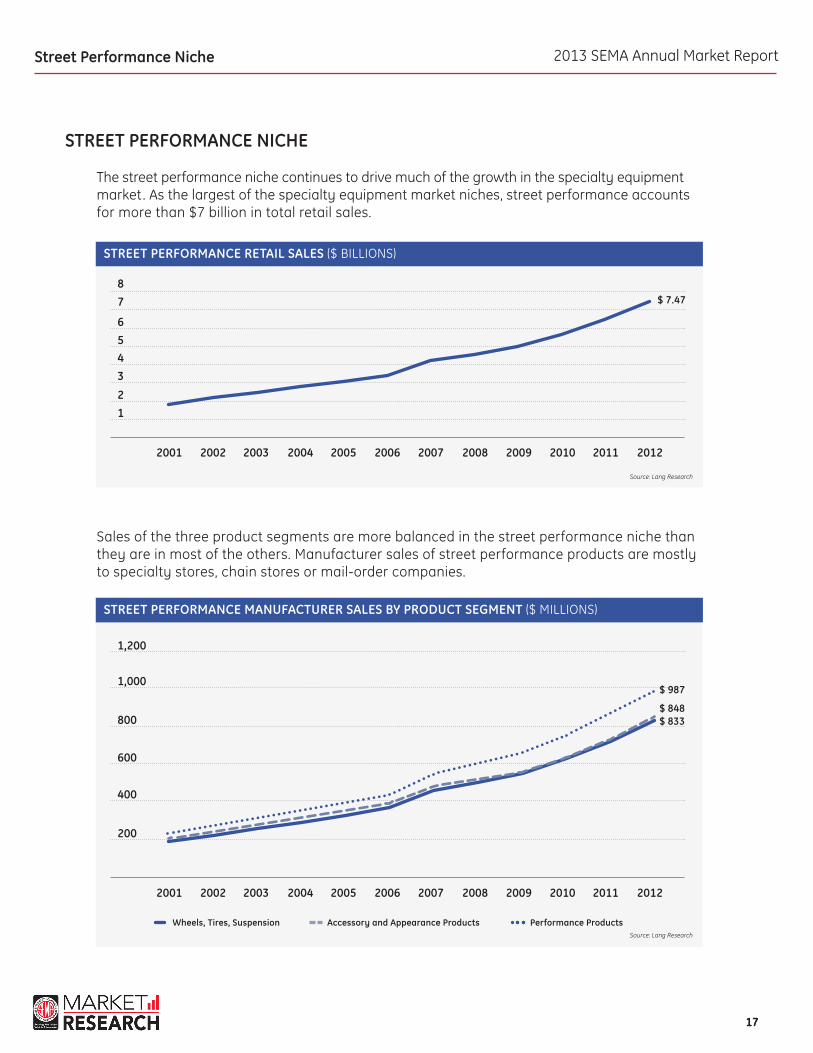
The street performance niche continues to drive much of the growth in the specialty equipment market. As the largest of the specialty equipment market niches, street performance accounts for more than $7 billion in total retail sales.
Sales of the three product segments are more balanced in the street performance niche than they are in most of the others. Manufacturer sales of street performance products are mostly to specialty stores, chain stores or mail-order companies.
Street Performance Niche
STREET PERFORMANCE RETAIL SALES ($ BILLIONS)
STREET PERFORMANCE MANUFACTURER SALES BY PRODUCT SEGMENT ($ MILLIONS)
2001
2001
2005
2005
2009
2009
2003
2003
2007
2007
2011
2011
2002
2002
2006
2006
2010
2010
2004
2004
2008
2008
2012
2012
2
4
6
8
1
200
400
600
800
1,000
1,200
3
5
7 $ 7.47
$ 833$ 848
$ 987
Source: Lang Research
Source: Lang Research
Performance ProductsWheels, Tires, Suspension Accessory and Appearance Products

2013 SEMA Annual Market Report
1818
SPORTS CAR OWNER PROFILE
The profile of the street performance consumer was comprised of data on the owners of sports cars and luxury sports cars. Among those owners, nearly one-third use auto-enthusiast websites and forums as a primary source for information on specialty equipment parts.
STREET PERFORMANCE SALES CHANNEL (% OF VOLUME)
Specialty Product/Installation Outlets Automotive Chains Mail-Order CompaniesDirect from Manufacturers Discount Chains Full-Line Auto Parts Stores Tire Dealers Speed Shops and Performance RetailersNew-Vehicle Dealers Wholesale Clubs Import Auto Parts Stores Independent Repair Shops Machine Shops Other Locations
25.9%19.4%17.7%
7.1%5.4%4.8%4.2%3.7%3.5%2.9%1.8%1.4%0.4%1.8%
Source: Lang Research
Source: SEMA Consumer Segmentation
SPORTS CAR - SOURCES OF INFORMATION (% OF OWNERS)
0 10% 30% 40% 50% 60%20%
Magazines
Chain Parts Stores (e.g. AutoZone, Pep Boys) - Actual Store
Manufacturer’s Website or Catalog
Car or Truck Club
Auto Enthusiasts Websites/Forums
Chain Parts Stores (e.g. AutoZone, Pep Boys) - Website
Car or Truck Dealership
Friend or Relative
Mail Order Catalogs
Other
Car Shows
Internet Searches (e.g. Google, Bing)
Independent/Specialty Parts Store/Garage
32.9
23.9
35.0
8.6
28.8
20.0
32.0
22.3
7.7
5.2
27.1
48.9
19.6
Street Performance Niche
2013 SEMA Annual Market Report
1919
Source: SEMA Consumer Segmentation
Source: SEMA Consumer Segmentation
WHERE SPORTS CAR OWNERS PURCHASE MOST OFTEN (% OF OWNERS)
HOW SPORTS CAR PARTS AND ACCESSORIES ARE INSTALLED (% OF OWNERS)
0 5% 15% 20% 25% 30%10%
Auction Website (e.g. eBay)
Car/Truck Show
Independent/Specialty Parts Store/Garage
Car/Truck Dealership
Internet Website/Amazon (Retailer that sells online)
Discount Retail Store (e.g. WalMart, Target)
Mail Order/Catalog
Discount Retail Store - Website (e.g. WalMart.com, Target.com)
Chain Auto Parts Stores - Website
Other
Chain Auto Parts Stores - Actual Store Location
Direct from Manufacturer
Street Performance Niche
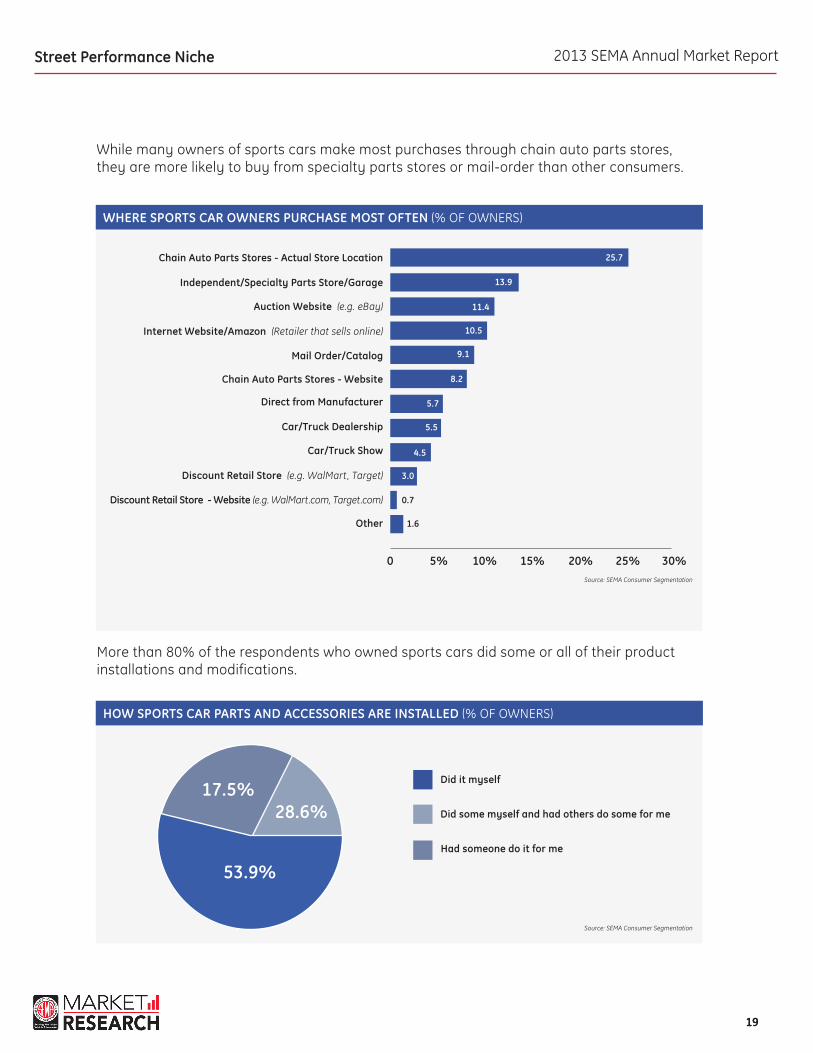
While many owners of sports cars make most purchases through chain auto parts stores, they are more likely to buy from specialty parts stores or mail-order than other consumers.
More than 80% of the respondents who owned sports cars did some or all of their product installations and modifications.
11.4
5.7
13.9
0.7
9.1
4.5
10.5
5.5
1.6
8.2
25.7
3.0
17.5%28.6%
53.9%
Did some myself and had others do some for me
Did it myself
had someone do it for me
2013 SEMA Annual Market Report
2020
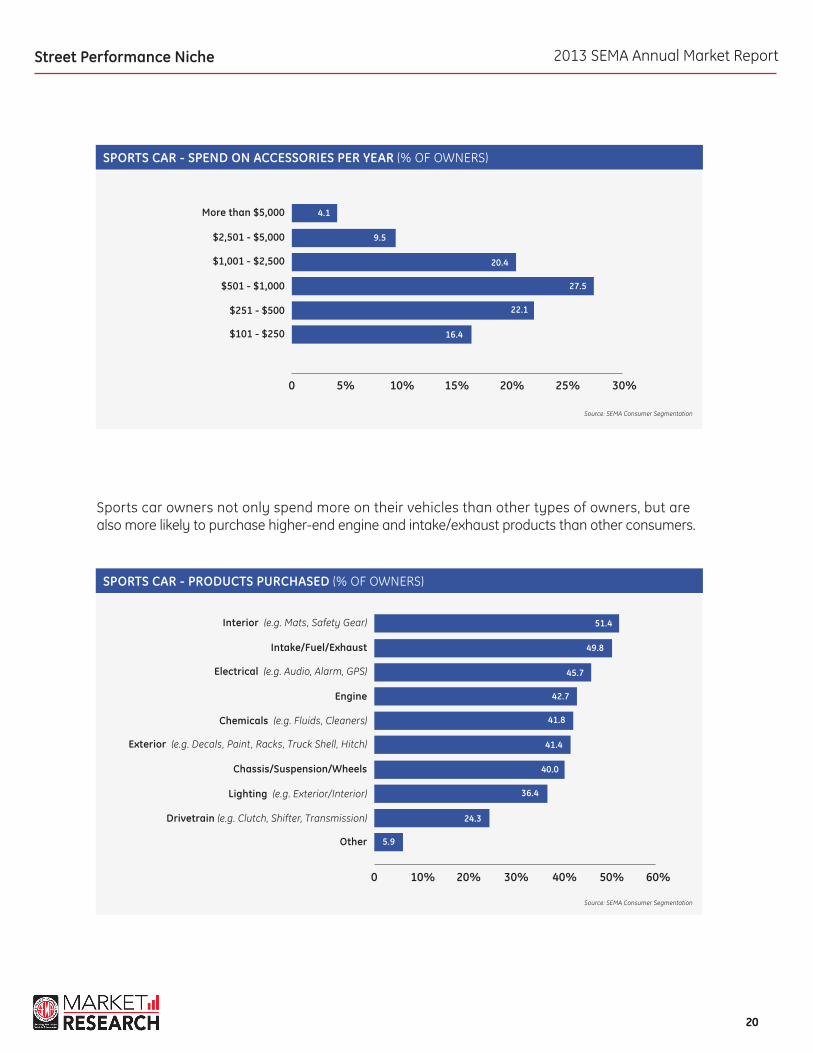
SPORTS CAR - SPEND ON ACCESSORIES PER YEAR (% OF OWNERS)
0 5% 15% 20% 25% 30%10%
$1,001 - $2,500
$2,501 - $5,000
$501 - $1,000
$251 - $500
$101 - $250
More than $5,000
20.4
9.5
22.1
27.5
16.4
4.1
Street Performance Niche
Sports car owners not only spend more on their vehicles than other types of owners, but are also more likely to purchase higher-end engine and intake/exhaust products than other consumers.
Source: SEMA Consumer Segmentation
Source: SEMA Consumer Segmentation
SPORTS CAR - PRODUCTS PURChASED (% OF OWNERS)
0 10% 30% 40% 50% 60%20%
Electrical (e.g. Audio, Alarm, GPS)
Chassis/Suspension/Wheels
Intake/Fuel/Exhaust
Engine
Lighting (e.g. Exterior/Interior)
Chemicals (e.g. Fluids, Cleaners)
Drivetrain (e.g. Clutch, Shifter, Transmission)
Exterior (e.g. Decals, Paint, Racks, Truck Shell, Hitch)
Interior (e.g. Mats, Safety Gear)
Other
45.7
40.0
49.8
41.8
24.3
42.7
36.4
41.4
51.4
5.9
2013 SEMA Annual Market Report
2121
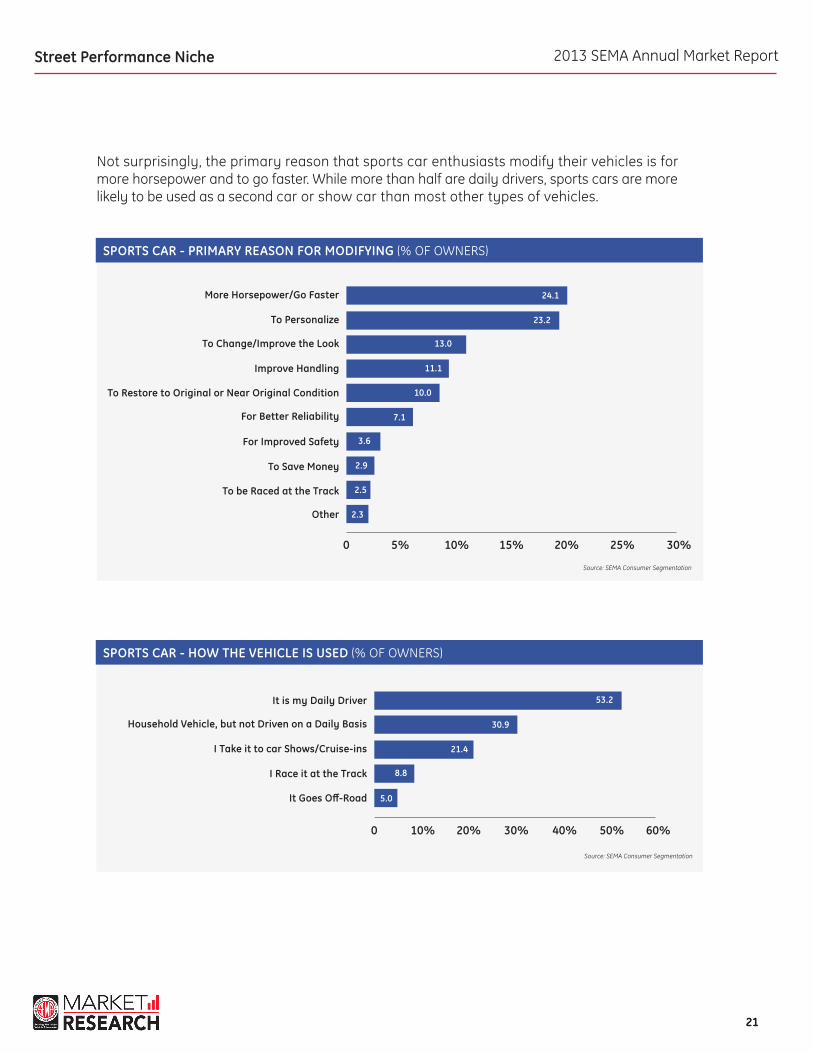
SPORTS CAR - PRIMARY REASON FOR MODIFYING (% OF OWNERS)
0 5% 15% 20% 25% 30%10%
To Change/Improve the Look
For Improved Safety
To Personalize
Improve handling
To Save Money
To Restore to Original or Near Original Condition
To be Raced at the Track
For Better Reliability
Other
More horsepower/Go Faster
23.2
7.1
11.1
2.9
2.3
24.1
10.0
13.0
3.6
2.5
Street Performance Niche
Not surprisingly, the primary reason that sports car enthusiasts modify their vehicles is for more horsepower and to go faster. While more than half are daily drivers, sports cars are more likely to be used as a second car or show car than most other types of vehicles.
Source: SEMA Consumer Segmentation
Source: SEMA Consumer Segmentation
SPORTS CAR - hOW ThE VEhICLE IS USED (% OF OWNERS)
0 10% 30% 40% 50% 60%20%
I Take it to car Shows/Cruise-ins
I Race it at the Track
It is my Daily Driver
It Goes Off-Road
household Vehicle, but not Driven on a Daily Basis
21.4
53.2
5.0
8.8
30.9

2013 SEMA Annual Market Report
2222
Acura TLAcura TSXAudi A4Audi A5BMW 3-SeriesBMW 5-SeriesBMW 7-SeriesChevrolet CamaroChevrolet CorvetteDodge ChallengerDodge ChargerDodge DartFord MustangHyundai GenesisInfiniti GInfiniti MMercedes SLMercedes SLKMitsubishi LancerNissan 370ZPorsche 911Scion FR-SSubaru LegacyVolkswagen GTI
ExAMPLES OF CURRENT STREET PERFORMANCE VEHICLE SALES
2008 2009 2010 2011 2012
46,76631,99843,344
6,282112,464
45,91512,276
--26,97117,42397,367
--91,251
6,16764,18115,618
5,4644,941
27,861--
8,324--
22,61412,232
33,62028,65037,070
9,80090,96040,109
9,25461,64813,93425,85260,651
--66,62321,88947,174
8,5014,0252,566
20,1179,2426,839
--30,974
7,932
34,04932,07634,67216,379
100,91039,48812,25381,29912,62436,79175,397
--73,71629,12258,14314,618
2,3851,980
21,41610,215
5,737--
38,72513,755
31,23730,93535,23415,38594,37151,49111,29988,24913,16439,53470,089
--70,43832,99858,24610,818
1,4493,220
19,8747,3286,016
--42,40116,867
33,57228,86535,41517,27099,60256,79811,09884,39114,13243,11982,59225,30382,99533,97359,844
9,1304,8994,595
16,4267,3388,528
11,41747,12716,314
Sources: Ward’s Auto, SEMA
STREET PERFORMANCE VEHICLE SALES
SEMA SHOW STREET PERFORMANCE VEHICLE DATAMost of the top models displayed at the 2011 SEMA Show remained in the top five in 2012. The Scion FR-S displaced the Dodge Charger from the top five positions and was the third most displayed model among the street performance cars.
Sports cars and muscle cars are the top-selling vehicles that are considered part of the street performance niche. Note also that this study places all sports cars—foreign and domestic— in this niche rather than in compact performance.
SEMA ShOW VEhICLES—STREET PERFORMANCE
2010 2011 2012
Ford MustangChevy CamaroDodge ChallengerChevy CorvetteDodge Charger
Chevy CamaroFord MustangDodge ChallengerChevy CorvetteDodge Charger
Ford MustangChevrolet CamaroScion FR-SChevrolet CorvetteChallenger, BMW 3-series,Porsche 911, Genesis
177135
454012
11699352622
7473532214
Source: SEMA
TOP 5 MODELS
Note: The method of counting SEMA Show display vehicles changed between years.
Street Performance Niche
2013 SEMA Annual Market Report
2323
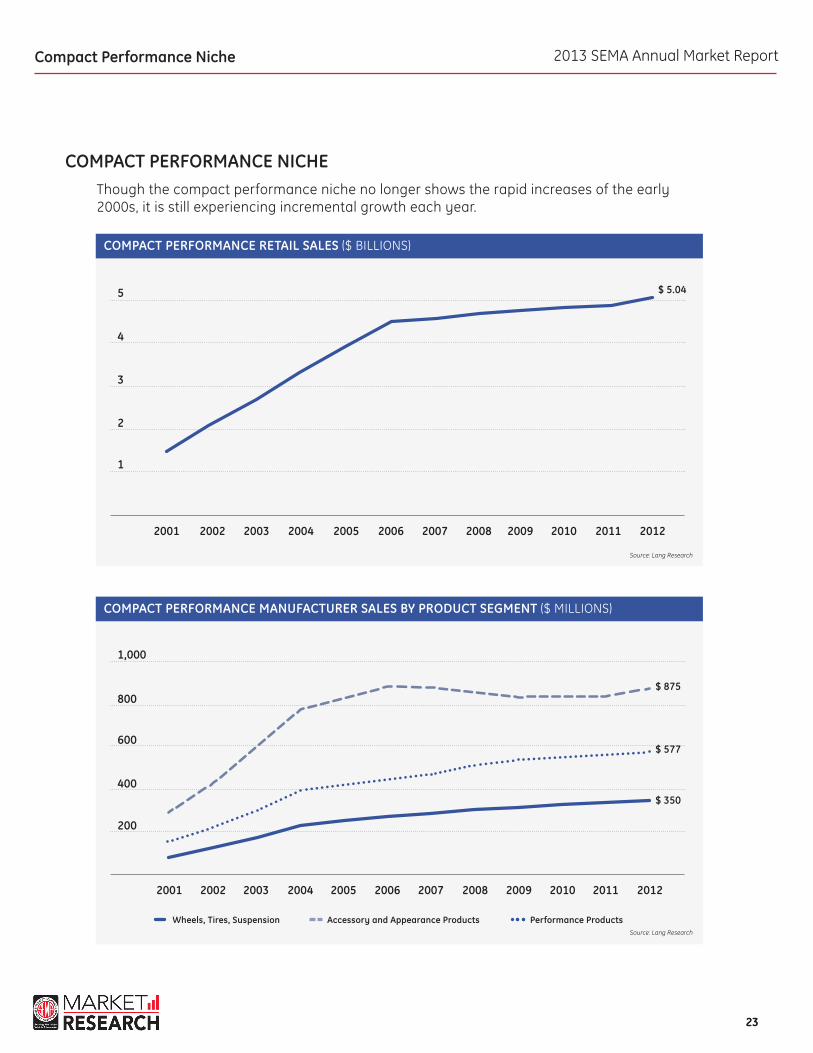
COMPACT PERFORMANCE NICHEThough the compact performance niche no longer shows the rapid increases of the early 2000s, it is still experiencing incremental growth each year.
Compact Performance Niche
COMPACT PERFORMANCE RETAIL SALES ($ BILLIONS)
COMPACT PERFORMANCE MANUFACTURER SALES BY PRODUCT SEGMENT ($ MILLIONS)
2001
2004
2005
20092008
2009
2002
2003
2006
2007
2011
2011
2001
2002
2005
2006
2010
2010
2003
2004
2007
2008
2012
2012
2
4
1
200
400
600
800
1,000
3
5 $ 5.04
$ 350
$ 577
$ 875
Source: Lang Research
Source: Lang Research
Performance ProductsWheels, Tires, Suspension Accessory and Appearance Products
2013 SEMA Annual Market Report
2424
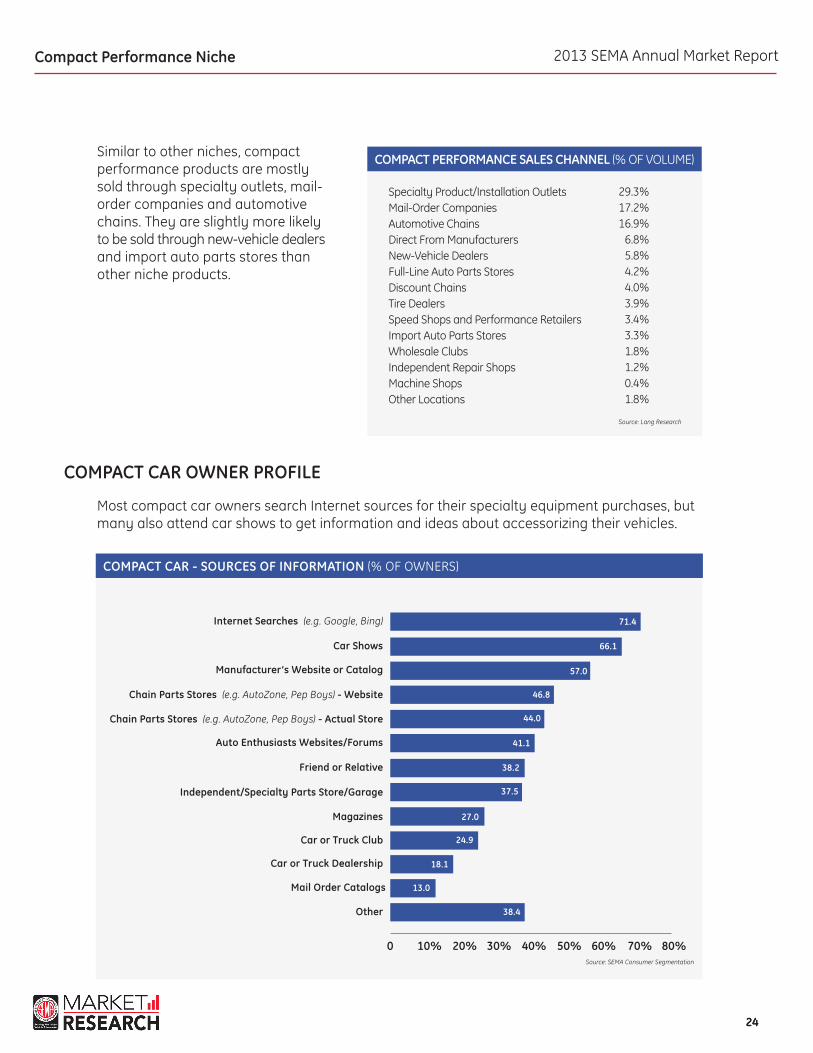
COMPACT CAR OWNER PROFILE
Most compact car owners search Internet sources for their specialty equipment purchases, but many also attend car shows to get information and ideas about accessorizing their vehicles.
Similar to other niches, compact performance products are mostly sold through specialty outlets, mail-order companies and automotive chains. They are slightly more likely to be sold through new-vehicle dealers and import auto parts stores than other niche products.
COMPACT PERFORMANCE SALES CHANNEL (% OF VOLUME)
Specialty Product/Installation Outlets Mail-Order CompaniesAutomotive Chains Direct From Manufacturers New-Vehicle Dealers Full-Line Auto Parts Stores Discount Chains Tire Dealers Speed Shops and Performance RetailersImport Auto Parts Stores Wholesale Clubs Independent Repair Shops Machine Shops Other Locations
29.3%17.2%16.9%
6.8%5.8%4.2%4.0%3.9%3.4%3.3%1.8%1.2%0.4%1.8%
Source: Lang Research
Source: SEMA Consumer Segmentation
COMPACT CAR - SOURCES OF INFORMATION (% OF OWNERS)
0 10% 30% 40% 50% 60% 70% 80%20%
Manufacturer’s Website or Catalog
Friend or Relative
Car Shows
Car or Truck Dealership
Chain Parts Stores (e.g. AutoZone, Pep Boys) - Website
Independent/Specialty Parts Store/Garage
Mail Order Catalogs
Chain Parts Stores (e.g. AutoZone, Pep Boys) - Actual Store
Magazines
Other
Auto Enthusiasts Websites/Forums
Internet Searches (e.g. Google, Bing)
Car or Truck Club
57.0
38.2
66.1
18.1
44.0
27.0
46.8
37.5
13.0
38.4
41.1
71.4
24.9
Compact Performance Niche
2013 SEMA Annual Market Report
2525
Source: SEMA Consumer Segmentation
Source: SEMA Consumer Segmentation
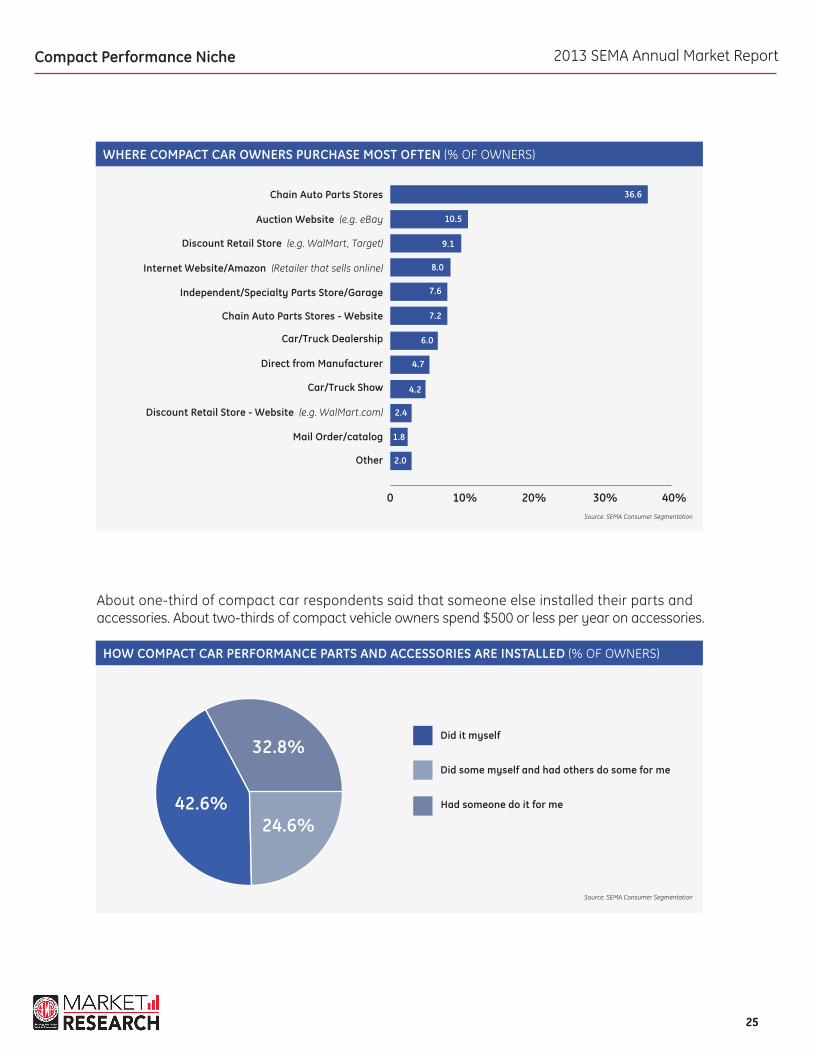
WHERE COMPACT CAR OWNERS PURCHASE MOST OFTEN (% OF OWNERS)
HOW COMPACT CAR PERFORMANCE PARTS AND ACCESSORIES ARE INSTALLED (% OF OWNERS)
0 10% 20% 30% 40%
Discount Retail Store (e.g. WalMart, Target)
Car/Truck Show
Auction Website (e.g. eBay
Direct from Manufacturer
Internet Website/Amazon (Retailer that sells online)
Discount Retail Store - Website (e.g. WalMart.com)
Independent/Specialty Parts Store/Garage
Mail Order/catalog
Chain Auto Parts Stores - Website
Other
Chain Auto Parts Stores
Car/Truck Dealership
Compact Performance Niche
9.1
6.0
10.5
1.8
7.6
4.2
8.0
4.7
2.0
7.2
36.6
2.4
24.6%
32.8%
42.6%
Did some myself and had others do some for me
Did it myself
had someone do it for me
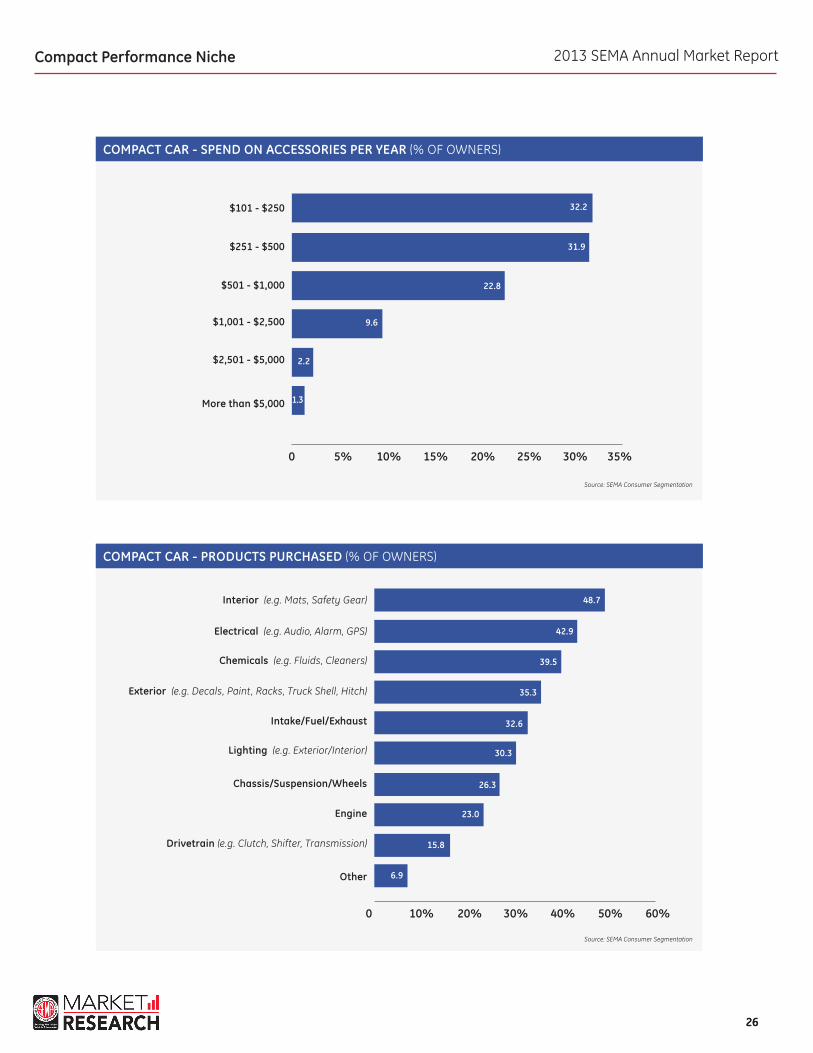
About one-third of compact car respondents said that someone else installed their parts and accessories. About two-thirds of compact vehicle owners spend $500 or less per year on accessories.
2013 SEMA Annual Market Report
2626
COMPACT CAR - SPEND ON ACCESSORIES PER YEAR (% OF OWNERS)
0 5% 15% 20% 25% 30% 35%10%
$501 - $1,000
$251 - $500
$1,001 - $2,500
$2,501 - $5,000
More than $5,000
$101 - $250
22.8
31.9
2.2
9.6
1.3
32.2
Compact Performance Niche
Source: SEMA Consumer Segmentation
Source: SEMA Consumer Segmentation
COMPACT CAR - PRODUCTS PURChASED (% OF OWNERS)
0 10% 30% 40% 50% 60%20%
Chemicals (e.g. Fluids, Cleaners)
Chassis/Suspension/Wheels
Electrical (e.g. Audio, Alarm, GPS)
Exterior (e.g. Decals, Paint, Racks, Truck Shell, Hitch)
Engine
Intake/Fuel/Exhaust
Drivetrain (e.g. Clutch, Shifter, Transmission)
Lighting (e.g. Exterior/Interior)
Interior (e.g. Mats, Safety Gear)
Other
39.5
26.3
42.9
32.6
15.8
35.3
23.0
30.3
48.7
6.9
2013 SEMA Annual Market Report
2727
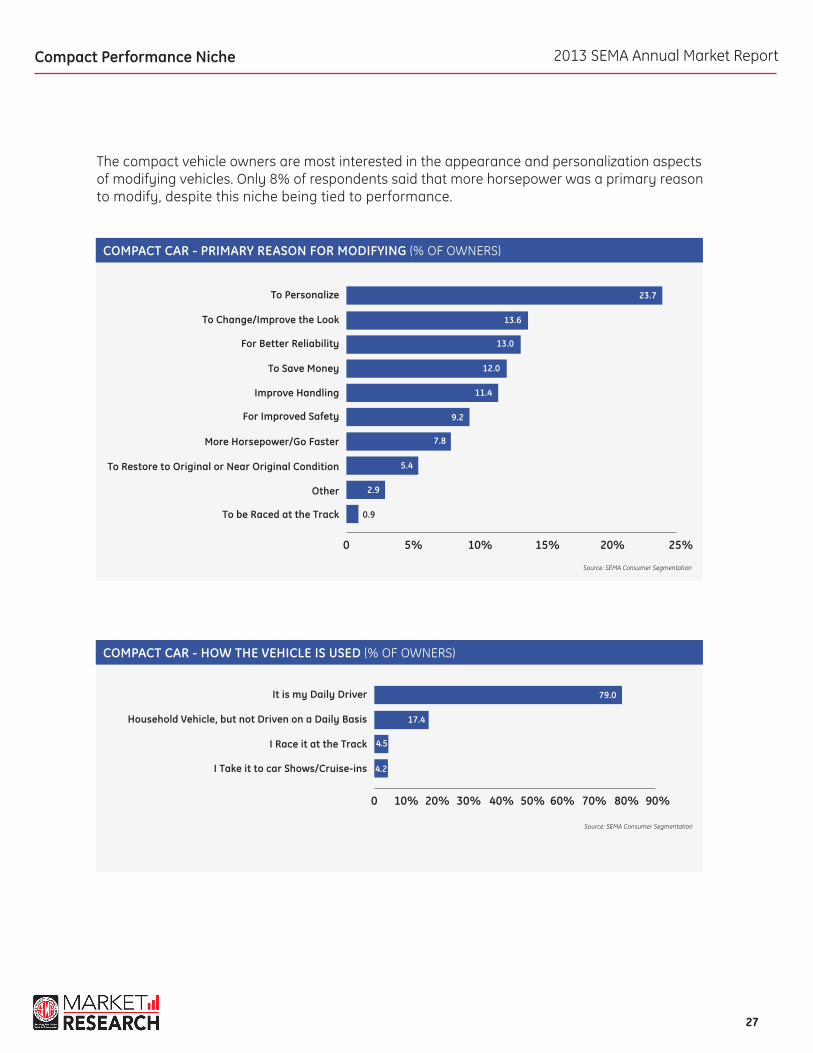
COMPACT CAR - PRIMARY REASON FOR MODIFYING (% OF OWNERS)
0 5% 15% 20% 25%10%
For Better Reliability
More horsepower/Go Faster
To Change/Improve the Look
To Save Money
To Restore to Original or Near Original Condition
Improve handling
Other
For Improved Safety
To be Raced at the Track
To Personalize
13.6
9.2
12.0
5.4
0.9
23.7
11.4
13.0
7.8
2.9
Compact Performance Niche
The compact vehicle owners are most interested in the appearance and personalization aspects of modifying vehicles. Only 8% of respondents said that more horsepower was a primary reason to modify, despite this niche being tied to performance.
Source: SEMA Consumer Segmentation
Source: SEMA Consumer Segmentation
COMPACT CAR - hOW ThE VEhICLE IS USED (% OF OWNERS)
0 10% 30% 40% 50% 60% 70% 80% 90%20%
household Vehicle, but not Driven on a Daily Basis
I Race it at the Track
I Take it to car Shows/Cruise-ins
It is my Daily Driver
17.4
4.2
4.5
79.0
2013 SEMA Annual Market Report
2828
Chevrolet CruzeChevrolet SonicChevrolet SparkFiat 500Ford FiestaHonda CivicHonda CR-ZHonda FitHyundai AccentKia SoulMazda2Mazda3Mini CooperMini CountrymanMitsubishi LancerNissan SentraNissan VersaScion iQScion tCScion xBScion xDSubaru ImprezaToyota YarisVolkswagen BeetleVolkswagen GolfVolkswagen GTIVolkswagen Jetta
ExAMPLES OF CURRENT COMPACT PERFORMANCE VEHICLE SALES
2008 2009 2010 2011 2012
----------
339,289--
79,79450,431
----
109,95754,077
--27,86199,79785,182
--40,98045,22027,66549,098
102,32826,477
--12,23297,461
----------
259,722--
67,31568,08631,621
--96,46645,225
--20,11782,70682,906
--17,99825,46114,49946,61163,74314,085
1,2117,932
108,427
24,495------
23,273260,218
5,24954,35451,97567,110
3,021106,353
45,644--
21,41694,06599,705
--15,20420,36410,11044,39540,07616,53713,42613,755
123,213
231,73215,778
--19,76968,574
221,23511,33059,23555,601
102,26713,952
102,41740,82816,68319,874
114,99199,730
24822,43317,017
9,57341,19632,704
6,46817,83916,867
177,360
237,75881,24712,38543,77256,775
317,9094,192
49,34661,004
115,77819,315
123,36145,11121,01216,426
106,395113,327
8,87922,66619,78710,75681,79930,59029,17424,57116,314
170,424Sources: Ward’s Auto, SEMA
COMPACT CAR VEHICLE SALES
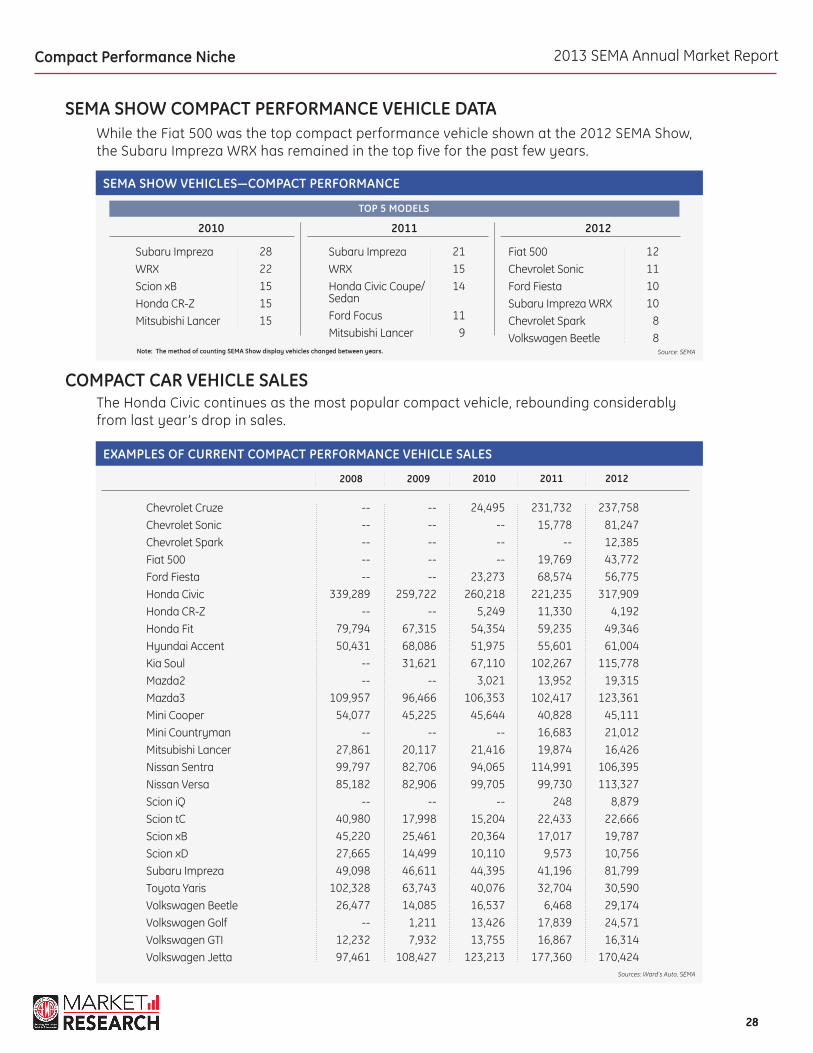
SEMA SHOW COMPACT PERFORMANCE VEHICLE DATAWhile the Fiat 500 was the top compact performance vehicle shown at the 2012 SEMA Show, the Subaru Impreza WRX has remained in the top five for the past few years.
The Honda Civic continues as the most popular compact vehicle, rebounding considerably from last year’s drop in sales.
SEMA ShOW VEhICLES—COMPACT PERFORMANCE
2010 2011 2012
Subaru Impreza WRXScion xBHonda CR-ZMitsubishi Lancer
Subaru Impreza WRXHonda Civic Coupe/SedanFord FocusMitsubishi Lancer
Fiat 500Chevrolet SonicFord FiestaSubaru Impreza WRXChevrolet SparkVolkswagen Beetle
2822151515
211514
119
12111010
88
Source: SEMANote: The method of counting SEMA Show display vehicles changed between years.
TOP 5 MODELS
Compact Performance Niche

2013 SEMA Annual Market Report
2929
LIGhT-TRUCk NIChE
The SEMA definition of the light-truck niche includes a combination of pickups, SUVs, CUVs and vans. This market was particularly hard hit by the recession that began in 2008 as well as the escalation of fuel prices in the last few years. Light-truck accessory sales plummeted from their peak in 2007 but now seem to be leveling out . The downward trend has begun to improve slightly in 2012 by gaining almost 1% from the previous year.
Light-Truck Niche
LIGhT-TRUCk RETAIL SALES ($ BILLIONS)
LIGhT-TRUCk MANUFACTURER SALES BY PRODUCT SEGMENT ($ MILLIONS)
2001
2004
2005
20092008
2009
2002
2003
2006
2007
2011
2011
2001
2002
2005
2006
2010
2010
2003
2004
2007
2008
2012
2012
10
5
200
400
600
800
15
$ 4.65
$ 307$ 643$ 712
Source: Lang Research
Source: Lang Research
Performance ProductsWheels, Tires, Suspension Accessory and Appearance Products
2013 SEMA Annual Market Report
3030
LIGhT-TRUCk OWNER PROFILE
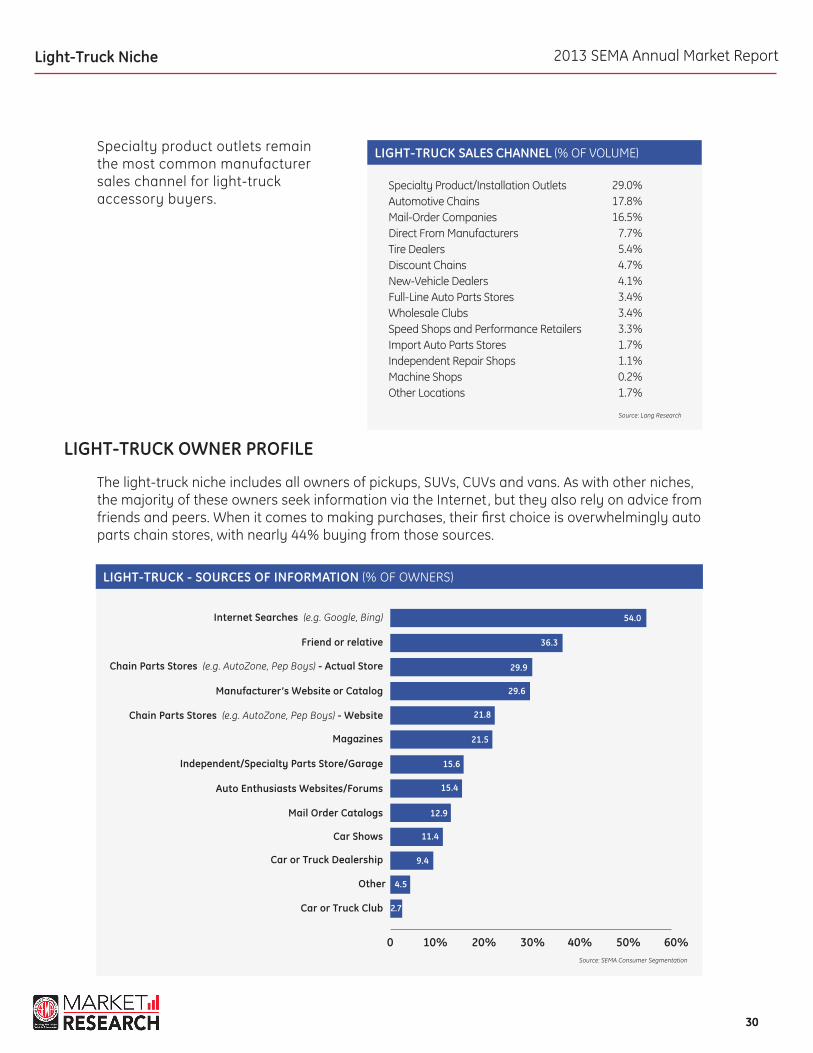
The light-truck niche includes all owners of pickups, SUVs, CUVs and vans. As with other niches, the majority of these owners seek information via the Internet, but they also rely on advice from friends and peers. When it comes to making purchases, their first choice is overwhelmingly auto parts chain stores, with nearly 44% buying from those sources.
Specialty product outlets remain the most common manufacturer sales channel for light- truck accessory buyers.
LIGhT-TRUCk SALES ChANNEL (% OF VOLUME)
Specialty Product/Installation Outlets Automotive Chains Mail-Order CompaniesDirect From Manufacturers Tire Dealers Discount Chains New-Vehicle Dealers Full-Line Auto Parts Stores Wholesale Clubs Speed Shops and Performance RetailersImport Auto Parts Stores Independent Repair Shops Machine Shops Other Locations
29.0%17.8%16.5%
7.7%5.4%4.7%4.1%3.4%3.4%3.3%1.7%1.1%0.2%1.7%
Source: Lang Research
Source: SEMA Consumer Segmentation
LIGhT-TRUCk - SOURCES OF INFORMATION (% OF OWNERS)
0 10% 30% 40% 50% 60%20%
Chain Parts Stores (e.g. AutoZone, Pep Boys) - Actual Store
Independent/Specialty Parts Store/Garage
Friend or relative
Car or Truck Dealership
Manufacturer’s Website or Catalog
Auto Enthusiasts Websites/Forums
Other
Chain Parts Stores (e.g. AutoZone, Pep Boys) - Website
Mail Order Catalogs
Car or Truck Club
Magazines
Internet Searches (e.g. Google, Bing)
Car Shows
29.9
15.6
36.3
9.4
21.8
12.9
29.6
15.4
4.5
2.7
21.5
54.0
11.4
Light-Truck Niche
2013 SEMA Annual Market Report
3131
Source: SEMA Consumer Segmentation
Source: SEMA Consumer Segmentation
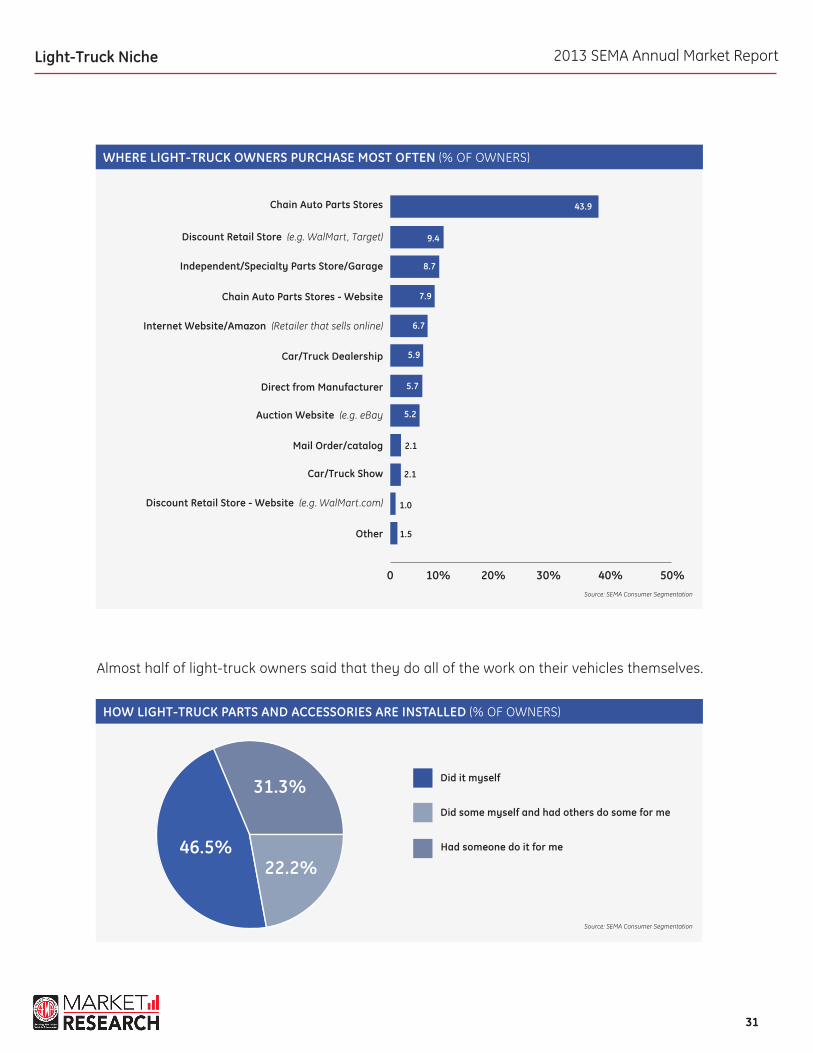
WhERE LIGhT-TRUCk OWNERS PURChASE MOST OFTEN (% OF OWNERS)
hOW LIGhT-TRUCk PARTS AND ACCESSORIES ARE INSTALLED (% OF OWNERS)
0 10% 20% 30% 40% 50%
Independent/Specialty Parts Store/Garage
Mail Order/catalog
Discount Retail Store (e.g. WalMart, Target)
Auction Website (e.g. eBay
Chain Auto Parts Stores - Website
Car/Truck Show
Internet Website/Amazon (Retailer that sells online)
Discount Retail Store - Website (e.g. WalMart.com)
Car/Truck Dealership
Other
Chain Auto Parts Stores
Direct from Manufacturer
Light-Truck Niche
8.7
5.7
9.4
1.0
6.7
2.1
2.1
7.9
5.2
1.5
5.9
43.9
22.2%
31.3%
46.5%
Did some myself and had others do some for me
Did it myself
had someone do it for me
Almost half of light-truck owners said that they do all of the work on their vehicles themselves.
2013 SEMA Annual Market Report
3232
LIGhT-TRUCk - SPEND ON ACCESSORIES PER YEAR (% OF OWNERS)
0 5% 15% 20% 25% 30% 35%10%
$501 - $1,000
$251 - $500
$1,001 - $2,500
$2,501 - $5,000
More than $5,000
$101 - $250
24.8
31.1
2.8
9.2
1.1
30.9
Light-Truck Niche
Source: SEMA Consumer Segmentation
Source: SEMA Consumer Segmentation
LIGhT-TRUCk - PRODUCTS PURChASED (% OF OWNERS)
0 10% 30% 40% 50% 60%20%
Chemicals (e.g. Fluids, Cleaners)
Lighting (e.g. Exterior/Interior)
Interior (e.g. Mats, Safety Gear)
Electrical (e.g. Audio, Alarm, GPS)
Engine
Intake/Fuel/Exhaust
Drivetrain (e.g. Clutch, Shifter, Transmission)
Chassis/Suspension/Wheels
Exterior (e.g. Decals, Paint, Racks, Truck Shell, Hitch)
Other
44.5
25.0
46.6
30.4
9.9
36.9
21.7
25.3
48.6
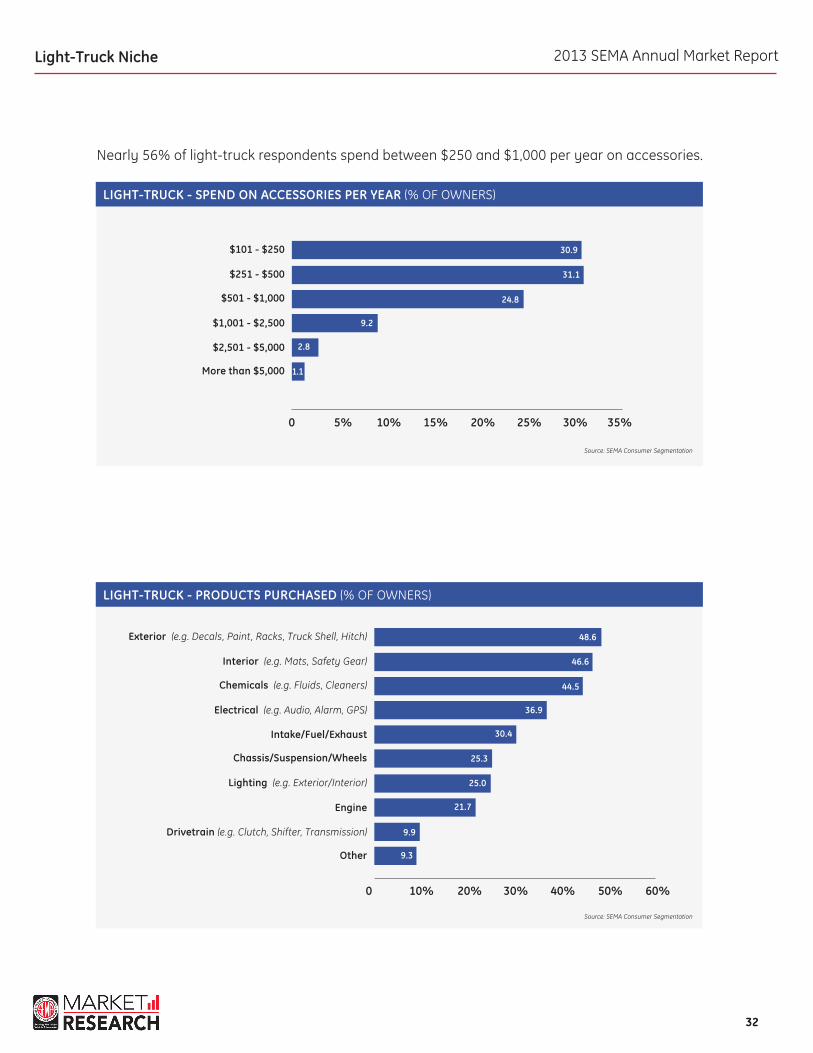
9.3
Nearly 56% of light-truck respondents spend between $250 and $1,000 per year on accessories.
2013 SEMA Annual Market Report
3333
LIGhT-TRUCk - PRIMARY REASON FOR MODIFYING (% OF OWNERS)
0 5% 15% 20% 25% 30%10%
For Better Reliability
To Save Money
To Change/Improve the Look
For Improved Safety
Other
Improve handling
To Restore to Original or Near Original Condition
More horsepower/Go Faster
For Off-road Use
To Personalize
17.4
6.9
8.0
5.4
2.7
25.8
7.1
15.3
6.2
5.2
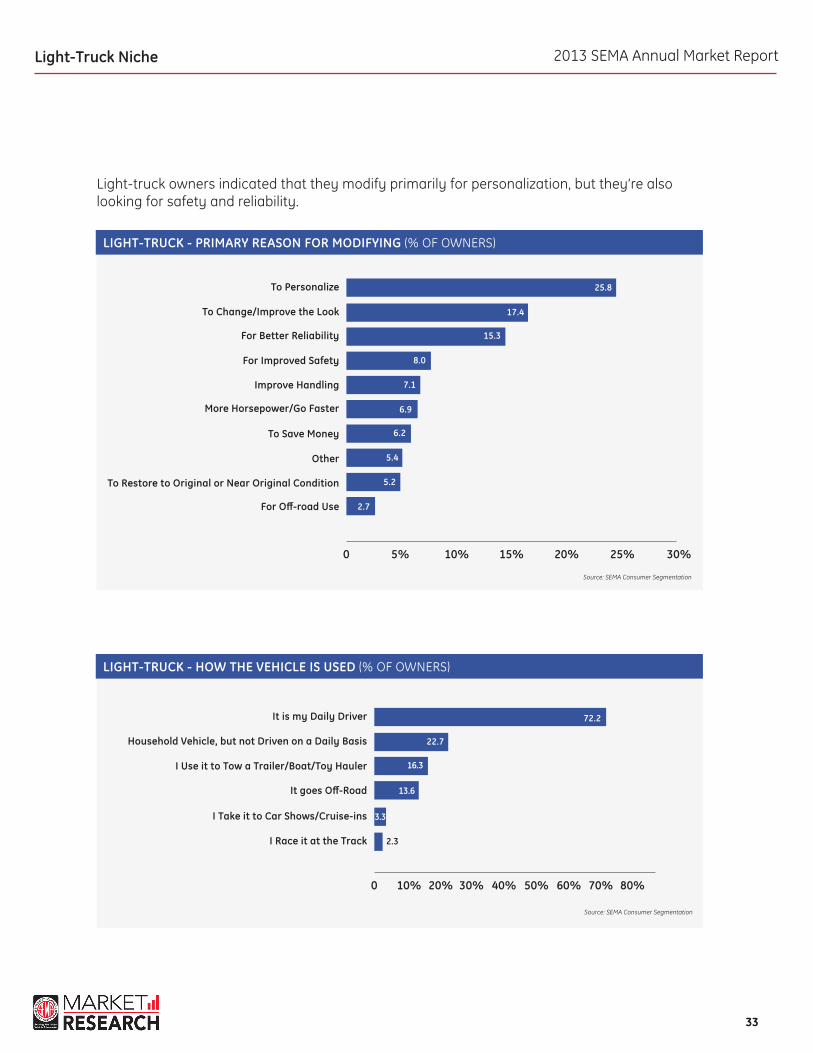
Light-Truck Niche
Light-truck owners indicated that they modify primarily for personalization, but they’re also looking for safety and reliability.
Source: SEMA Consumer Segmentation
Source: SEMA Consumer Segmentation
LIGhT-TRUCk - hOW ThE VEhICLE IS USED (% OF OWNERS)
0 10% 30% 40% 50% 60% 70% 80%20%
household Vehicle, but not Driven on a Daily Basis
I Race it at the Track
I Use it to Tow a Trailer/Boat/Toy hauler
It goes Off-Road
It is my Daily Driver
I Take it to Car Shows/Cruise-ins
22.7
2.3
13.6
16.3
72.2
3.3
2013 SEMA Annual Market Report
3434
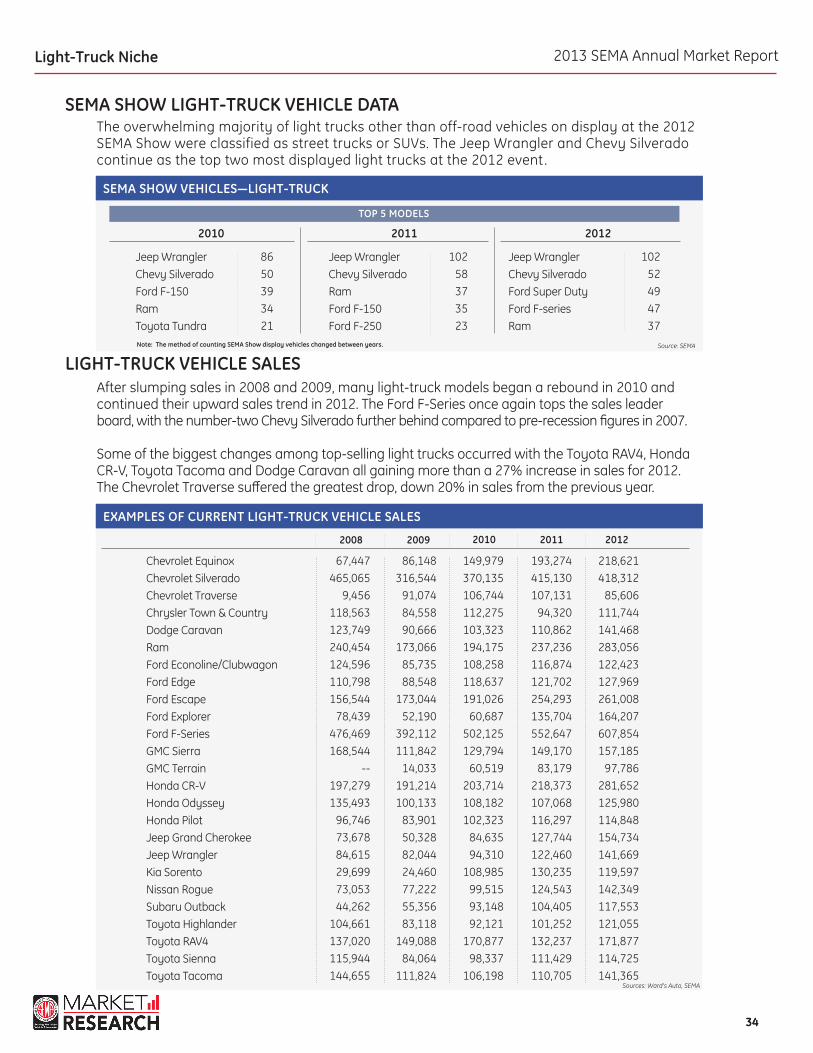
SEMA ShOW LIGhT-TRUCk VEhICLE DATAThe overwhelming majority of light trucks other than off-road vehicles on display at the 2012 SEMA Show were classified as street trucks or SUVs. The Jeep Wrangler and Chevy Silverado continue as the top two most displayed light trucks at the 2012 event .
SEMA ShOW VEhICLES—LIGhT-TRUCk
2010 2011 2012
Jeep WranglerChevy SilveradoFord F-150RamToyota Tundra
Jeep WranglerChevy SilveradoRamFord F-150Ford F-250
Jeep WranglerChevy SilveradoFord Super DutyFord F-seriesRam
8650393421
10258373523
10252494737
Source: SEMA
TOP 5 MODELS
LIGhT-TRUCk VEhICLE SALESAfter slumping sales in 2008 and 2009, many light-truck models began a rebound in 2010 and continued their upward sales trend in 2012. The Ford F-Series once again tops the sales leader board, with the number-two Chevy Silverado further behind compared to pre-recession figures in 2007.
Some of the biggest changes among top-selling light trucks occurred with the Toyota RAV4, Honda CR-V, Toyota Tacoma and Dodge Caravan all gaining more than a 27% increase in sales for 2012. The Chevrolet Traverse suffered the greatest drop, down 20% in sales from the previous year.
Chevrolet EquinoxChevrolet SilveradoChevrolet TraverseChrysler Town & CountryDodge Caravan Ram Ford Econoline/ClubwagonFord EdgeFord EscapeFord ExplorerFord F-SeriesGMC SierraGMC TerrainHonda CR-VHonda OdysseyHonda PilotJeep Grand CherokeeJeep WranglerKia SorentoNissan RogueSubaru OutbackToyota HighlanderToyota RAV4Toyota SiennaToyota Tacoma
ExAMPLES OF CURRENT LIGhT-TRUCk VEhICLE SALES
2008 2009 2010 2011 2012
67,447465,065
9,456118,563123,749240,454124,596110,798156,544
78,439476,469168,544
--197,279135,493
96,74673,67884,61529,69973,05344,262
104,661137,020115,944144,655
86,148316,544
91,07484,55890,666
173,06685,73588,548
173,04452,190
392,112111,842
14,033191,214100,133
83,90150,32882,04424,46077,22255,35683,118
149,08884,064
111,824
149,979370,135106,744112,275103,323194,175108,258118,637191,026
60,687502,125129,794
60,519203,714108,182102,323
84,63594,310
108,98599,51593,14892,121
170,87798,337
106,198
193,274415,130107,131
94,320110,862237,236116,874121,702254,293135,704552,647149,170
83,179218,373107,068116,297127,744122,460130,235124,543104,405101,252132,237111,429110,705
218,621418,312
85,606111,744141,468283,056122,423127,969261,008164,207607,854157,185
97,786281,652125,980114,848154,734141,669119,597142,349117,553121,055171,877114,725141,365
Sources: Ward’s Auto, SEMA
Note: The method of counting SEMA Show display vehicles changed between years.
Light-Truck Niche
2013 SEMA Annual Market Report
3535
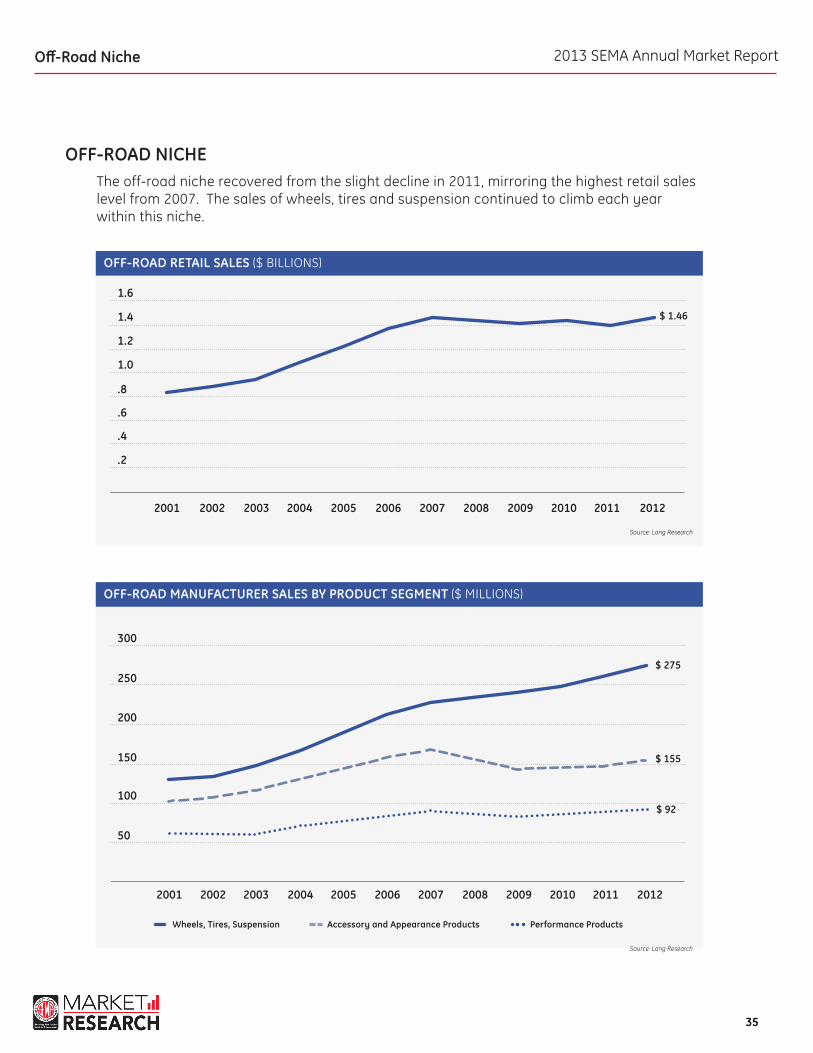
OFF-ROAD NIChEThe off-road niche recovered from the slight decline in 2011, mirroring the highest retail sales level from 2007. The sales of wheels, tires and suspension continued to climb each year within this niche.
Off-Road Niche
OFF-ROAD RETAIL SALES ($ BILLIONS)
OFF-ROAD MANUFACTURER SALES BY PRODUCT SEGMENT ($ MILLIONS)
2001
2004
2005
20092008
2009
2002
2003
2006
2007
2011
2011
2001
2002
2005
2006
2010
2010
2003
2004
2007
2008
2012
2012
.2
.4
.6
.8
1.0
1.2
1.4
1.6
50
100
150
200
250
300
$ 1.46
$ 92
$ 155
$ 275
Source: Lang Research
Source: Lang Research
Performance ProductsWheels, Tires, Suspension Accessory and Appearance Products

2013 SEMA Annual Market Report
3636
OFF-ROAD SALES ChANNEL (% OF VOLUME)
Specialty Product/Installation Outlets Mail-Order CompaniesAutomotive Chains Direct from Manufacturers Tire Dealers New-Vehicle Dealers Discount Chains Wholesale Clubs Speed Shops and Performance RetailersFull-Line Auto Parts Stores Import Auto Parts Stores Independent Repair Shops Machine Shops Other Locations
28.4%17.7%15.5%
8.1%6.4%4.3%4.2%3.6%3.5%3.2%1.6%1.2%0.4%1.9%
Source: Lang Research
Source: SEMA Consumer Segmentation
OFF-ROAD - SOURCES OF INFORMATION (% OF OWNERS)
0 10% 30% 40% 50% 60%20%
Chain Parts Stores (e.g. AutoZone, Pep Boys) - Actual Store
Chain Parts Stores (e.g. AutoZone, Pep Boys) - Website
Manufacturer’s Website or Catalog
Car or Truck Dealership
Magazines
Car Shows
Car or Truck Club
Friend or relative
Mail Order Catalogs
Auto Enthusiasts Websites/Forums
Internet Searches (e.g. Google, Bing)
Independent/Specialty Parts Store/Garage
38.7
27.7
40.3
12.6
30.3
22.7
37.8
24.4
5.9
30.3
54.0
20.2
Off-Road Niche
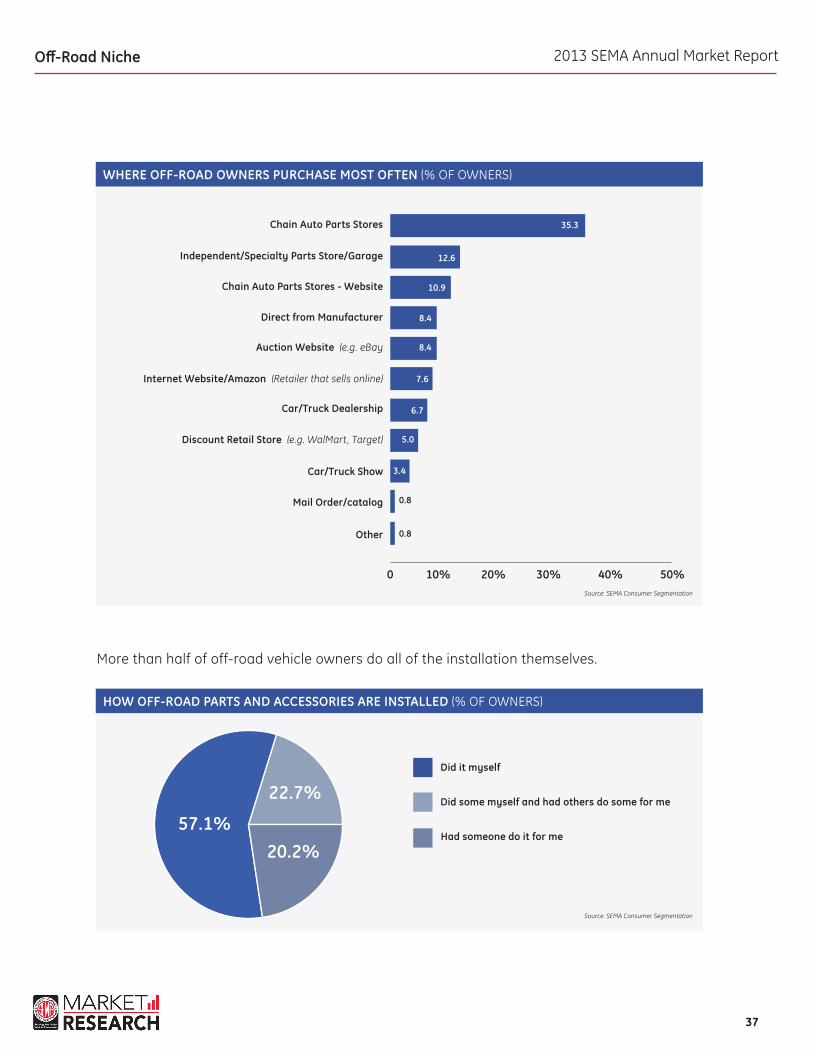
OFF-ROAD OWNER PROFILEThe results tabulated in the following section include data from only consumers who indicated that they used their vehicles off-road. Like most others, off-road owners are likely to look to the Internet for information about customization.
2013 SEMA Annual Market Report
3737
Source: SEMA Consumer Segmentation
Source: SEMA Consumer Segmentation
WhERE OFF-ROAD OWNERS PURChASE MOST OFTEN (% OF OWNERS)
hOW OFF-ROAD PARTS AND ACCESSORIES ARE INSTALLED (% OF OWNERS)
0 10% 20% 30% 40% 50%
Chain Auto Parts Stores - Website
Car/Truck Show
Independent/Specialty Parts Store/Garage
Discount Retail Store (e.g. WalMart, Target)
Direct from Manufacturer
Mail Order/catalog
Auction Website (e.g. eBay
Other
Internet Website/Amazon (Retailer that sells online)
Chain Auto Parts Stores
Car/Truck Dealership
Off-Road Niche
10.9
6.7
12.6
8.4
3.4
0.8
0.8
8.4
5.0
7.6
35.3
20.2%
22.7%
57.1%Did some myself and had others do some for me
Did it myself
had someone do it for me
More than half of off-road vehicle owners do all of the installation themselves.
2013 SEMA Annual Market Report
3838
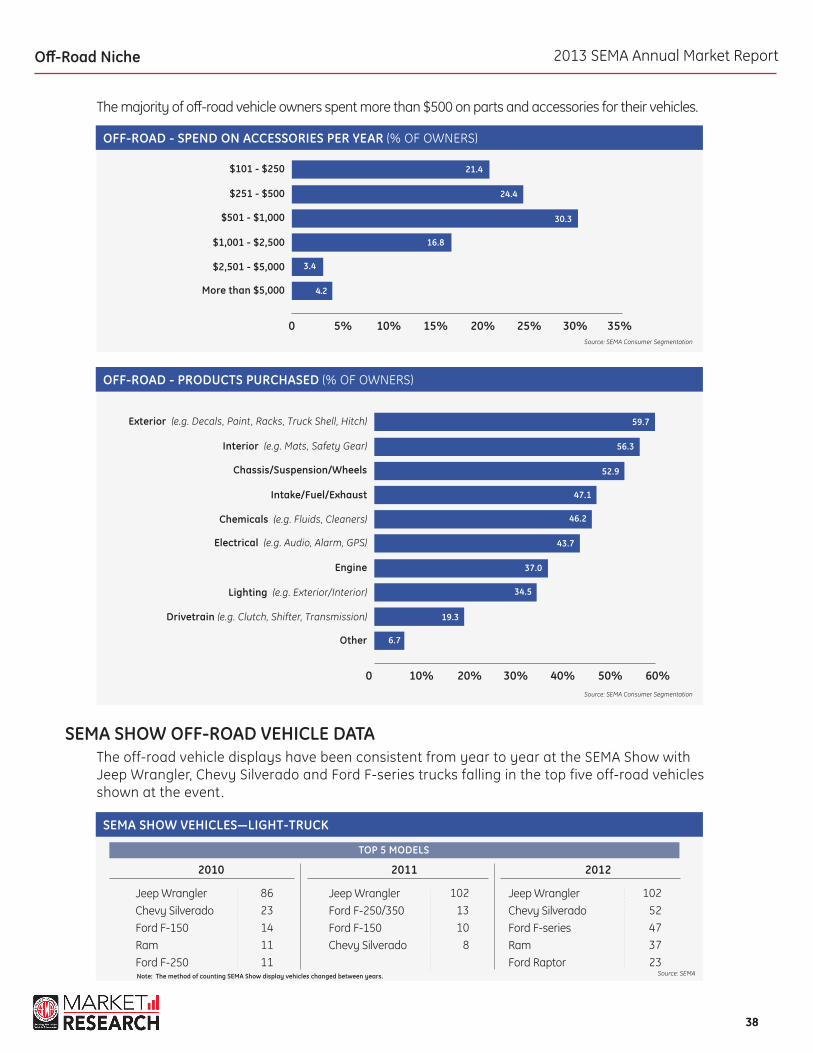
SEMA ShOW OFF-ROAD VEhICLE DATAThe off-road vehicle displays have been consistent from year to year at the SEMA Show with Jeep Wrangler, Chevy Silverado and Ford F-series trucks falling in the top five off-road vehicles shown at the event .
SEMA ShOW VEhICLES—LIGhT-TRUCk
2010 2011 2012
Jeep WranglerChevy SilveradoFord F-150RamFord F-250
Jeep WranglerFord F-250/350Ford F-150Chevy Silverado
Jeep WranglerChevy SilveradoFord F-seriesRamFord Raptor
8623141111
1021310
8
10252473723
Source: SEMA
TOP 5 MODELS
Note: The method of counting SEMA Show display vehicles changed between years.
OFF-ROAD - SPEND ON ACCESSORIES PER YEAR (% OF OWNERS)
0 5% 15% 20% 25% 30% 35%10%
$501 - $1,000
$251 - $500
$1,001 - $2,500
$2,501 - $5,000
More than $5,000
$101 - $250
30.3
24.4
3.4
16.8
4.2
21.4
Off-Road Niche
The majority of off-road vehicle owners spent more than $500 on parts and accessories for their vehicles.
Source: SEMA Consumer Segmentation
Source: SEMA Consumer Segmentation
OFF-ROAD - PRODUCTS PURChASED (% OF OWNERS)
0 10% 30% 40% 50% 60%20%
Chassis/Suspension/Wheels
Engine
Interior (e.g. Mats, Safety Gear)
Intake/Fuel/Exhaust
Lighting (e.g. Exterior/Interior)
Chemicals (e.g. Fluids, Cleaners)
Drivetrain (e.g. Clutch, Shifter, Transmission)
Electrical (e.g. Audio, Alarm, GPS)
Exterior (e.g. Decals, Paint, Racks, Truck Shell, Hitch)
Other
52.9
37.0
56.3
46.2
19.3
47.1
34.5
43.7
59.7
6.7

2013 SEMA Annual Market Report
3939
Chevrolet AvalancheChevrolet ColoradoChevrolet SilveradoChevrolet SuburbanChevrolet TahoeDodge Ram DakotaRamFord ExpeditionFord F-SeriesFord RangerGMC CanyonGMC SierraGMC YukonGMC Yukon XLHonda RidgelineJeep Grand CherokeeJeep WranglerLand Rover LR4Land Rover Range RoverLand Rover Range Rover SportNissan FrontierNissan TitanNissan XterraToyota 4RunnerToyota FJ CruiserToyota Land CruiserToyota TacomaToyota TundraVolkswagen Touareg
ExAMPLES OF CURRENT OFF-ROAD VEhICLE SALES
2008 2009 2010 2011 2012
35,00354,346
465,06554,05891,57826,044
240,45455,123
476,46965,87214,974
168,54439,06426,40433,87573,67884,615
--8,393
11,66844,99734,05333,57947,87828,668
3,801144,655137,249
6,755
16,43232,413
316,54441,05573,25410,690
173,06631,655
392,11255,60010,107
111,84229,41116,81916,46450,32882,044
8677,312
11,36428,41519,04216,45519,67511,941
2,261111,824
79,3854,392
20,51524,642
370,13545,15275,67513,047
194,17537,336
502,12555,364
7,992129,794
28,78123,79716,14284,63594,310
7,1228,746
12,34740,42723,41620,52346,53114,959
1,807106,198
93,3094,713
20,08831,026
415,13049,42780,52712,156
237,23640,499
552,64770,832
9,590149,170
34,25025,223
9,759127,744122,460
7,9839,761
15,33351,70021,99418,22144,31613,541
1,662110,705
82,9087,535
23,99536,840
418,31248,11668,904
490283,056
38,062607,854
19,3668,735
157,18527,81823,42714,068
154,734141,669
7,3167,843
16,49155,43521,57617,22248,75513,656
2,895141,365101,621
10,553
Sources: Ward’s Auto, SEMA
OFF-ROAD VEhICLE SALESAmong vehicles often accessorized for off-road use, the Toyota Land Cruiser, Volkswagen Touareg and Honda Ridgeline experienced the largest gain in sales in the past year. Sales for the Ford Ranger and Ram Dakota declined drastically in 2012 as the vehicles are being discontinued.
Off-Road Niche
2013 SEMA Annual Market Report
4040
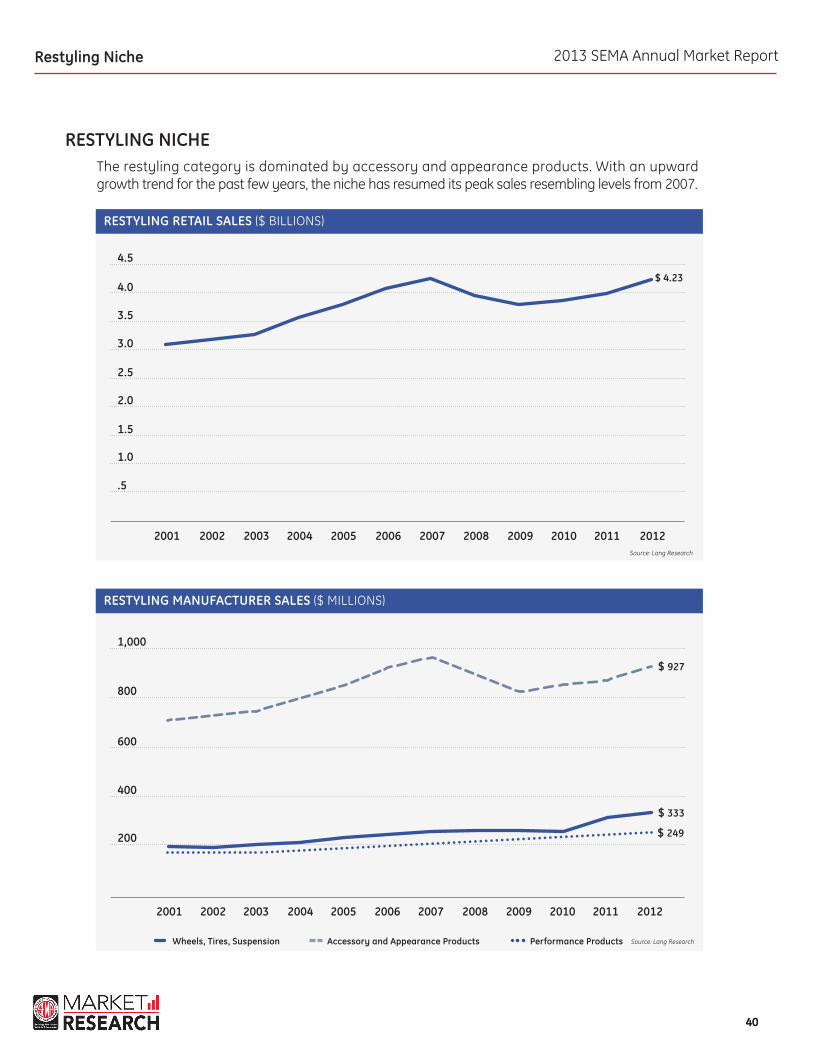
RESTYLING NICHEThe restyling category is dominated by accessory and appearance products. With an upward growth trend for the past few years, the niche has resumed its peak sales resembling levels from 2007.
Restyling Niche
RESTYLING RETAIL SALES ($ BILLIONS)
RESTYLING MANUFACTURER SALES ($ MILLIONS)
2001
2004
2005
20092008
2009
2002
2003
2006
2007
2011
2011
2001
2002
2005
2006
2010
2010
2003
2004
2007
2008
2012
2012
.5
1.0
1.5
2.0
2.5
3.0
3.5
4.0
4.5
200
400
600
800
1,000
$ 4.23
$ 249
$ 333
$ 927
Source: Lang Research
Source: Lang ResearchPerformance ProductsWheels, Tires, Suspension Accessory and Appearance Products
2013 SEMA Annual Market Report
4141
Restyling Niche
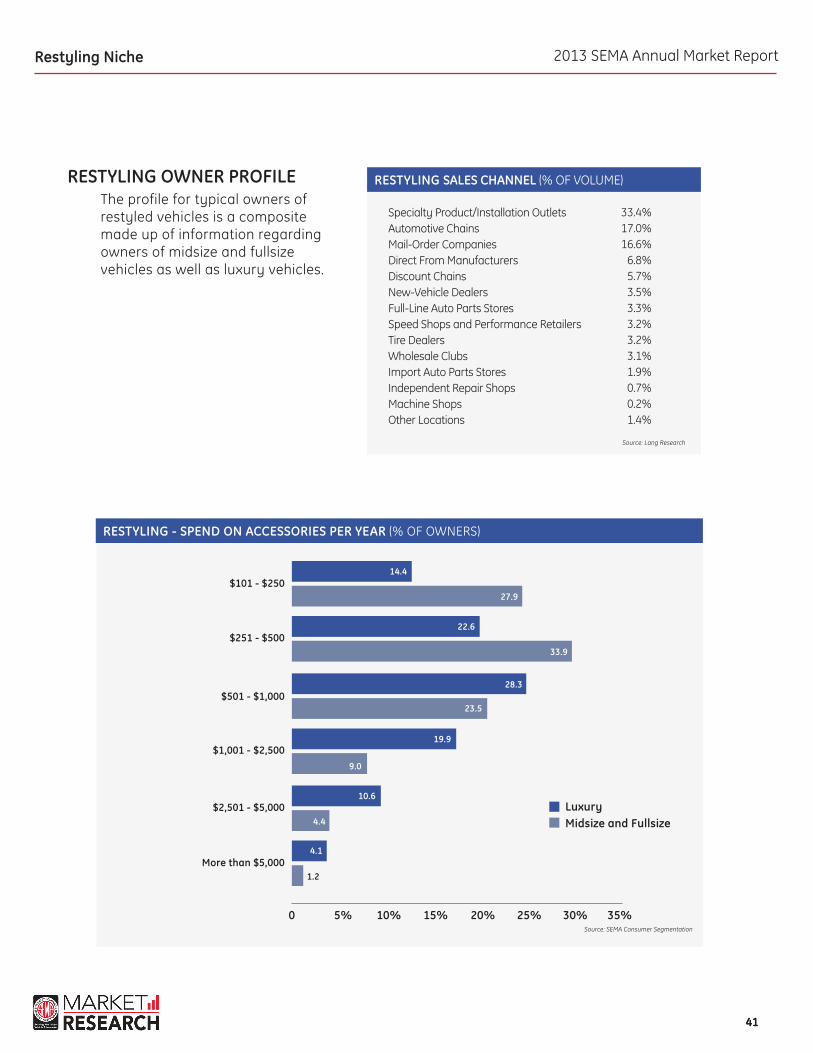
RESTYLING OWNER PROFILEThe profile for typical owners of restyled vehicles is a composite made up of information regarding owners of midsize and fullsize vehicles as well as luxury vehicles.
RESTYLING - SPEND ON ACCESSORIES PER YEAR (% OF OWNERS)
0 5% 15% 20% 25% 30% 35%
LuxuryMidsize and Fullsize
10%
$501 - $1,000
$251 - $500
$1,001 - $2,500
$2,501 - $5,000
More than $5,000
$101 - $25014.4
28.3
10.6
22.6
19.9
4.1
27.9
23.5
4.4
33.9
9.0
1.2
Source: SEMA Consumer Segmentation
RESTYLING SALES CHANNEL (% OF VOLUME)
Specialty Product/Installation Outlets Automotive Chains Mail-Order CompaniesDirect From Manufacturers Discount Chains New-Vehicle Dealers Full-Line Auto Parts Stores Speed Shops and Performance RetailersTire Dealers Wholesale Clubs Import Auto Parts Stores Independent Repair Shops Machine Shops Other Locations
33.4%17.0%16.6%
6.8%5.7%3.5%3.3%3.2%3.2%3.1%1.9%0.7%0.2%1.4%
Source: Lang Research

2013 SEMA Annual Market Report
4242
Source: SEMA Consumer Segmentation
RESTYLING - SOURCES OF INFORMATION - LUxURY VEhICLES (% OF OWNERS)
0 10% 30% 40% 50% 60%20%
Auto Enthusiasts Websites/Forums
Friend or relative
Manufacturer’s Website or Catalog
Car or Truck Dealership
Chain Parts Stores (e.g. AutoZone, Pep Boys) - Actual Store
Car Shows
Car or Truck Club
Chain Parts Stores (e.g. AutoZone, Pep Boys) - Website
Mail Order Catalogs
Other
Magazines
Internet Searches (e.g. Google, Bing)
Independent/Specialty Parts Store/Garage
30.8
23.7
38.4
9.5
28.1
19.3
30.5
20.7
8.2
3.3
27.5
47.1
19.3
Restyling Niche
Source: SEMA Consumer Segmentation
RESTYLING - SOURCES OF INFORMATION - MIDSIzE AND FULLSIzE (% OF OWNERS)
0 10% 30% 40% 50% 60%20%
Chain Parts Stores (e.g. AutoZone, Pep Boys) - Actual Store
Auto Enthusiasts Websites/Forums
Friend or relative
Car or Truck Dealership
Manufacturer’s Website or Catalog
Car Shows
Car or Truck Club
Magazines
Independent/Specialty Parts Store/Garage
Other
Chain Parts Stores (e.g. AutoZone, Pep Boys) - Website
Internet Searches (e.g. Google, Bing)
Mail Order Catalogs
30.9
19.4
36.6
9.2
26.8
15.1
28.3
15.9
4.8
3.0
24.0
57.8
14.4
While both groups use the Internet as a primary source for information, the owners of midsize and fullsize vehicles are more likely to also seek information from family and friends.

2013 SEMA Annual Market Report
4343
Source: SEMA Consumer Segmentation
Source: SEMA Consumer Segmentation
WhERE RESTYLING OWNERS PURChASE MOST OFTEN - MIDSIzE AND FULLSIzE (% OF OWNERS)
WhERE RESTYLING OWNERS PURChASE MOST OFTEN - LUxURY VEhICLES (% OF OWNERS)
0
0
10%
10% 15% 25%5%
20%
20%
30%
30%
40% 50%
Chain Auto Parts Stores - Website
Chain Auto Parts Stores - Website
Mail Order/Catalog
Discount Retail Store (e.g. WalMart, Target)
Discount Retail Store (e.g. WalMart, Target)
Auction Website (e.g. eBay
Direct from Manufacturer
Internet Website/Amazon (Retailer that sells online)
Independent/Specialty Parts Store/Garage
Independent/Specialty Parts Store/Garage
Car/Truck Show
Mail Order/Catalog
Auction Website (e.g. eBay
Direct from Manufacturer
Discount Retail Store - Website (e.g. WalMart.com)
Discount Retail Store - Website (e.g. WalMart.com)
Car/Truck Dealership
Car/Truck Dealership
Other
Other
Chain Auto Parts Stores - Actual Location
Chain Auto Parts Stores - Actual Location
Internet Website/Amazon (Retailer that sells online)
Car/Truck Show
Restyling Niche
10.2
11.4
5.7
6.5
10.6
13.9
0.5
0.8
8.8
8.2
3.0
5.2
2.3
3.0
10.1
9.5
4.9
5.2
0.9
0.8
6.2
7.6
36.7
27.8
2013 SEMA Annual Market Report
4444
Source: SEMA Consumer Segmentation
Source: SEMA Consumer Segmentation
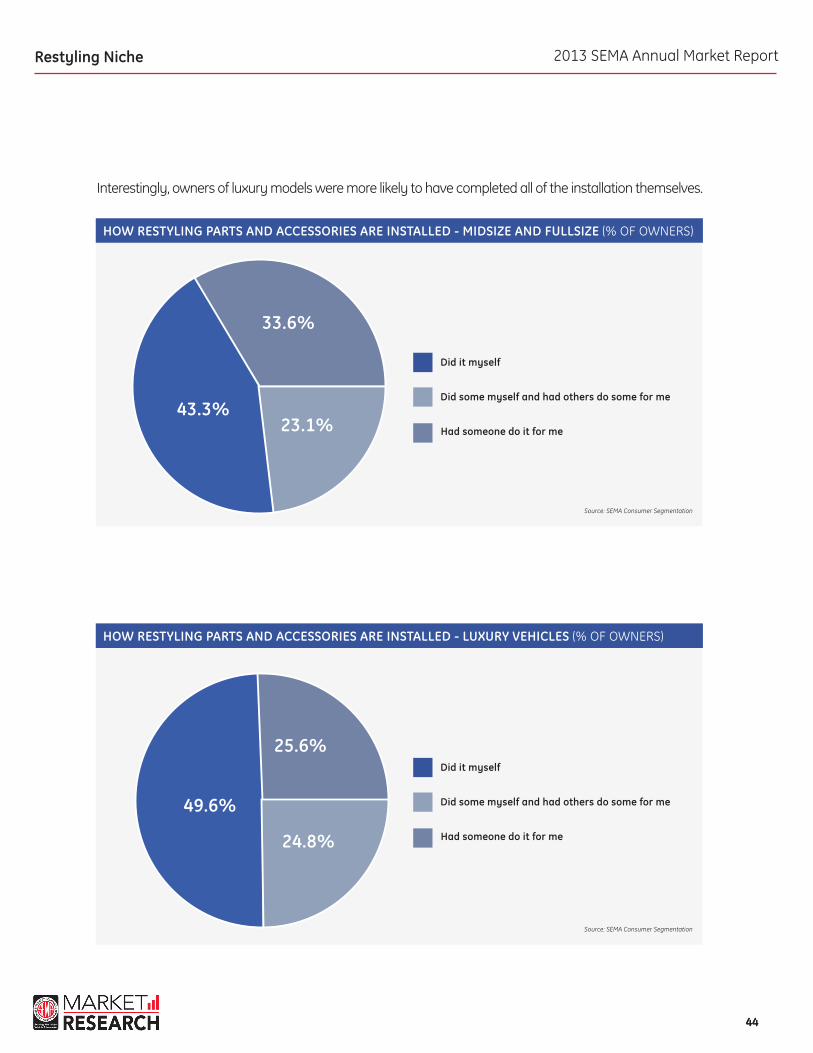
hOW RESTYLING PARTS AND ACCESSORIES ARE INSTALLED - LUxURY VEhICLES (% OF OWNERS)
hOW RESTYLING PARTS AND ACCESSORIES ARE INSTALLED - MIDSIzE AND FULLSIzE (% OF OWNERS)
Restyling Niche
24.8%
23.1%
25.6%
33.6%
49.6%
43.3%
Did some myself and had others do some for me
Did some myself and had others do some for me
Did it myself
Did it myself
had someone do it for me
had someone do it for me
Interestingly, owners of luxury models were more likely to have completed all of the installation themselves.
2013 SEMA Annual Market Report
4545
Restyling Niche
Source: SEMA Consumer Segmentation
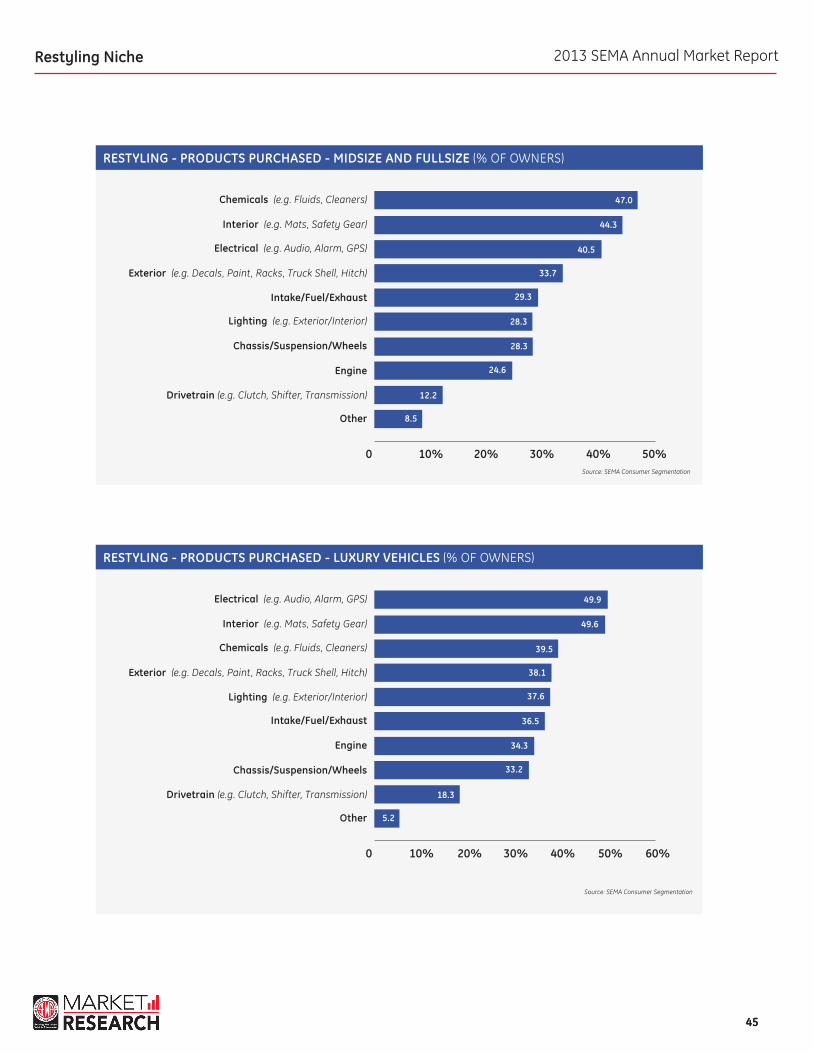
RESTYLING - PRODUCTS PURChASED - MIDSIzE AND FULLSIzE (% OF OWNERS)
RESTYLING - PRODUCTS PURChASED - LUxURY VEhICLES (% OF OWNERS)
0
0
10%
10%
30%
30%
40%
40%
50%
50% 60%
20%
20%
Electrical (e.g. Audio, Alarm, GPS)
Chemicals (e.g. Fluids, Cleaners)
Chassis/Suspension/Wheels
Engine
Interior (e.g. Mats, Safety Gear)
Interior (e.g. Mats, Safety Gear)
Exterior (e.g. Decals, Paint, Racks, Truck Shell, Hitch)
Exterior (e.g. Decals, Paint, Racks, Truck Shell, Hitch)
Engine
Chassis/Suspension/Wheels
Intake/Fuel/Exhaust
Lighting (e.g. Exterior/Interior)
Drivetrain (e.g. Clutch, Shifter, Transmission)
Drivetrain (e.g. Clutch, Shifter, Transmission)
Lighting (e.g. Exterior/Interior)
Intake/Fuel/Exhaust
Chemicals (e.g. Fluids, Cleaners)
Electrical (e.g. Audio, Alarm, GPS)
Other
Other
40.5
39.5
28.3
34.3
44.3
49.6
29.3
37.6
12.2
18.3
33.7
38.1
24.6
33.2
28.3
36.5
47.0
49.9
8.5
5.2
Source: SEMA Consumer Segmentation
2013 SEMA Annual Market Report
4646
RESTYLING - PRIMARY REASON FOR MODIFYING - MIDSIzE AND FULLSIzE (% OF OWNERS)
RESTYLING - PRIMARY REASON FOR MODIFYING - LUxURY VEhICLES (% OF OWNERS)
0
0
5%
5%
15%
15%
20%
20%
25%
25% 30%
10%
10%
To Change/Improve the Look
More horsepower/Go Faster
To Restore to Original or Near Original Condition
To Save Money
For Better Reliability
Improve handling
For Improved Safety
To Change/Improve the Look
More horsepower/Go Faster
To Restore to Original or Near Original Condition
Improve handling
For Better Reliability
Other
Other
To Save Money
For Improved Safety
To Personalize
To Personalize
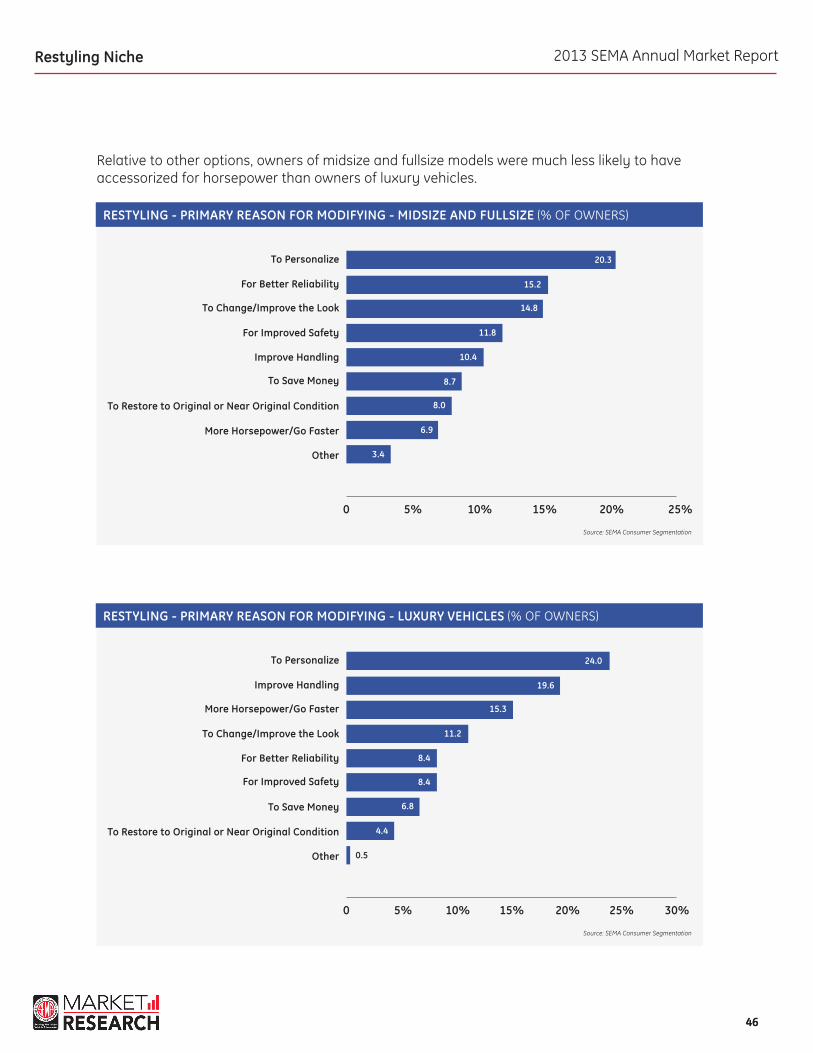
15.2
19.6
8.7
11.8
11.2
6.9
4.4
20.3
24.0
10.4
8.4
8.4
14.8
15.3
8.0
6.8
3.4
0.5
Restyling Niche
Relative to other options, owners of midsize and fullsize models were much less likely to have accessorized for horsepower than owners of luxury vehicles.
Source: SEMA Consumer Segmentation
Source: SEMA Consumer Segmentation
2013 SEMA Annual Market Report
4747
SEMA ShOW VEhICLES—RESTYLING
2010 2011 2012
BMW M3BMW 3-SeriesBentley ContinentalLamborghini GallardoBMW M5
Bentley ContinentalLexus ISMercedes Benz CLLexus GSLamborghini Murcielago
Mercedes-Benz C-ClassChrysler 300Ford FocusFord FusionCadillac CTS
8650393421
116655
17151210
9Source: SEMA
TOP 5 MODELS
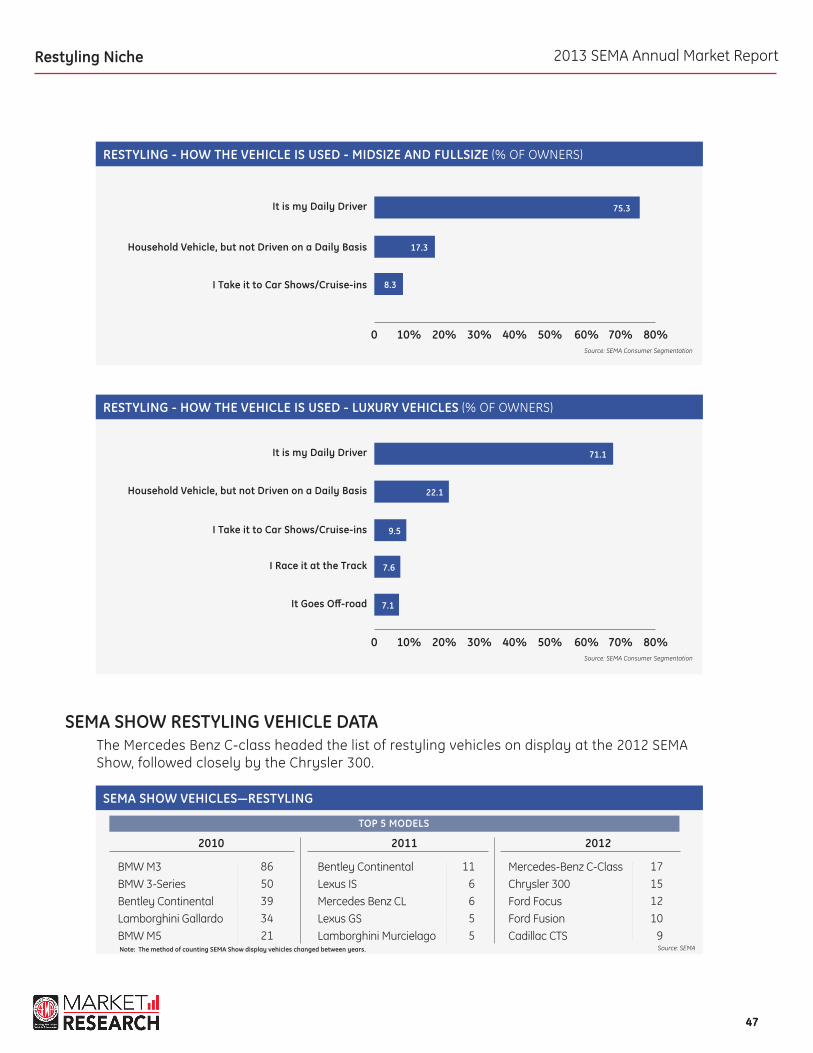
SEMA SHOW RESTYLING VEHICLE DATAThe Mercedes Benz C-class headed the list of restyling vehicles on display at the 2012 SEMA Show, followed closely by the Chrysler 300.
Note: The method of counting SEMA Show display vehicles changed between years.
Restyling Niche
Source: SEMA Consumer Segmentation
Source: SEMA Consumer Segmentation
RESTYLING - hOW ThE VEhICLE IS USED - MIDSIzE AND FULLSIzE (% OF OWNERS)
RESTYLING - hOW ThE VEhICLE IS USED - LUxURY VEhICLES (% OF OWNERS)
0
0
10%
10%
30%
30%
40%
40%
50%
50%
60%
60%
70%
70%
80%
80%
20%
20%
household Vehicle, but not Driven on a Daily Basis
household Vehicle, but not Driven on a Daily Basis
It Goes Off-road
It is my Daily Driver
It is my Daily Driver
I Race it at the Track
I Take it to Car Shows/Cruise-ins
I Take it to Car Shows/Cruise-ins
75.3
71.1
7.6
17.3
22.1
7.1
8.3
9.5
2013 SEMA Annual Market Report
4848
Acura TLAcura TSXAudi A3Audi A6Audi A8BMW 1-SeriesCadillac CTSChrysler 300 SeriesFord FocusFord FusionHonda AccordHyundai SonataInfiniti GInfiniti MLexus ESLexus GSLexus ISLexus LSMazda6Mercedes C-ClassMercedes CLSMercedes E-ClassMercedes S-ClassNissan AltimaNissan SentraToyota Camry
ExAMPLES OF CURRENT RESTYLING VEHICLE SALES
2008 2009 2010 2011 2012
46,76631,998
4,75911,956
2,82512,01858,77462,352
195,823147,569372,789117,357
64,18115,61864,13515,75949,43220,25552,59072,471
5,77538,57617,787
269,66899,797
436,617
33,62028,650
3,8746,7861,463
11,18238,81738,606
160,433180,671287,492120,028
47,1748,501
48,4857,430
38,07711,33434,86652,427
2,52743,07211,199
203,56882,706
356,824
34,04932,076
6,5588,6751,521
13,13245,65637,116
172,421219,219282,530196,623
58,14314,61848,652
7,05934,12912,27535,66258,785
2,13560,92213,608
229,26394,065
327,804
31,23730,935
6,56111,124
5,7008,832
55,04236,285
175,717248,067235,625225,961
58,24610,81840,873
3,74629,669
9,56835,71169,314
5,66562,73612,258
268,981114,991308,510
33,57228,865
7,20518,998
6,0027,689
46,97970,747
245,922241,263331,872230,605
59,8449,130
56,15822,16027,708
8,34533,75681,697
8,06565,17111,794
302,934106,395404,886
Sources: Ward’s Auto, SEMA
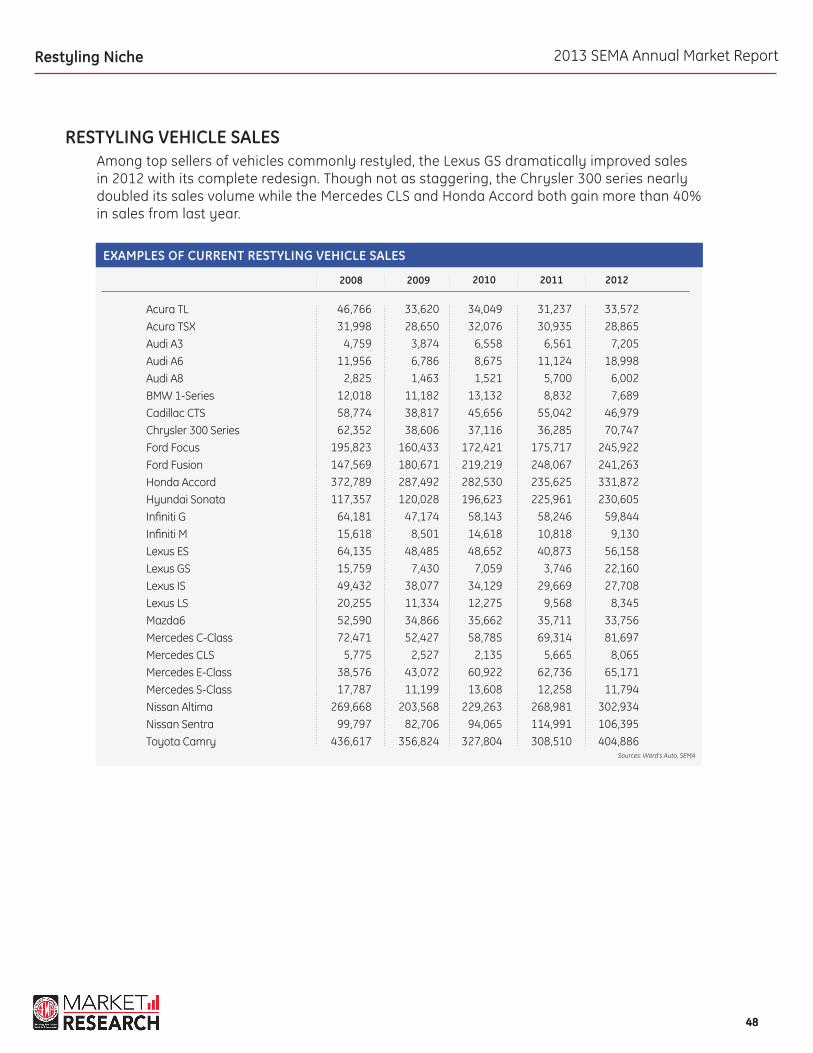
RESTYLING VEHICLE SALESAmong top sellers of vehicles commonly restyled, the Lexus GS dramatically improved sales in 2012 with its complete redesign. Though not as staggering, the Chrysler 300 series nearly doubled its sales volume while the Mercedes CLS and Honda Accord both gain more than 40% in sales from last year.
Restyling Niche
2013 SEMA Annual Market Report
4949
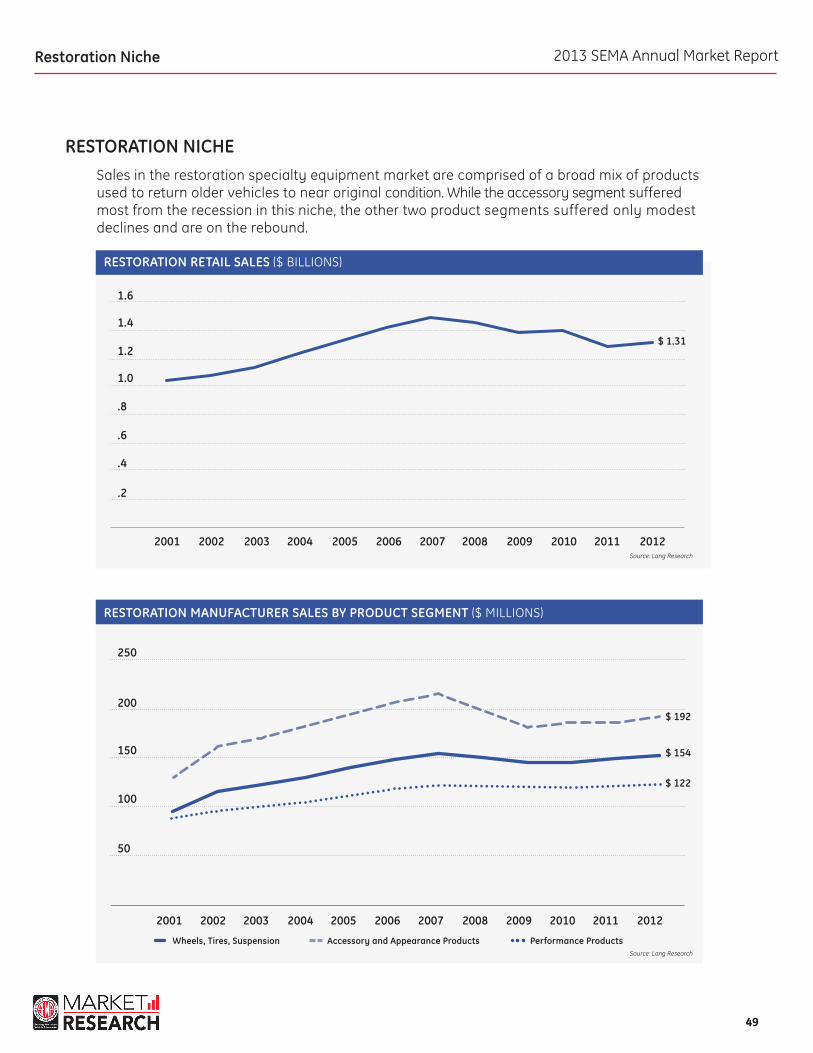
RESTORATION NICHESales in the restoration specialty equipment market are comprised of a broad mix of products used to return older vehicles to near original condition. While the accessory segment suffered most from the recession in this niche, the other two product segments suffered only modest declines and are on the rebound.
Restoration Niche
RESTORATION RETAIL SALES ($ BILLIONS)
RESTORATION MANUFACTURER SALES BY PRODUCT SEGMENT ($ MILLIONS)
2001
2004
2005
20092008
2009
2002
2003
2006
2007
2011
2011
2001
2002
2005
2006
2010
2010
2003
2004
2007
2008
2012
2012
.4
.8
.2
50
100
150
200
250
.6
1.0
1.2
1.4
1.6
$ 1.31
$ 122
$ 154
$ 192
Source: Lang Research
Source: Lang Research
Performance ProductsWheels, Tires, Suspension Accessory and Appearance Products
2013 SEMA Annual Market Report
5050
Restoration Niche
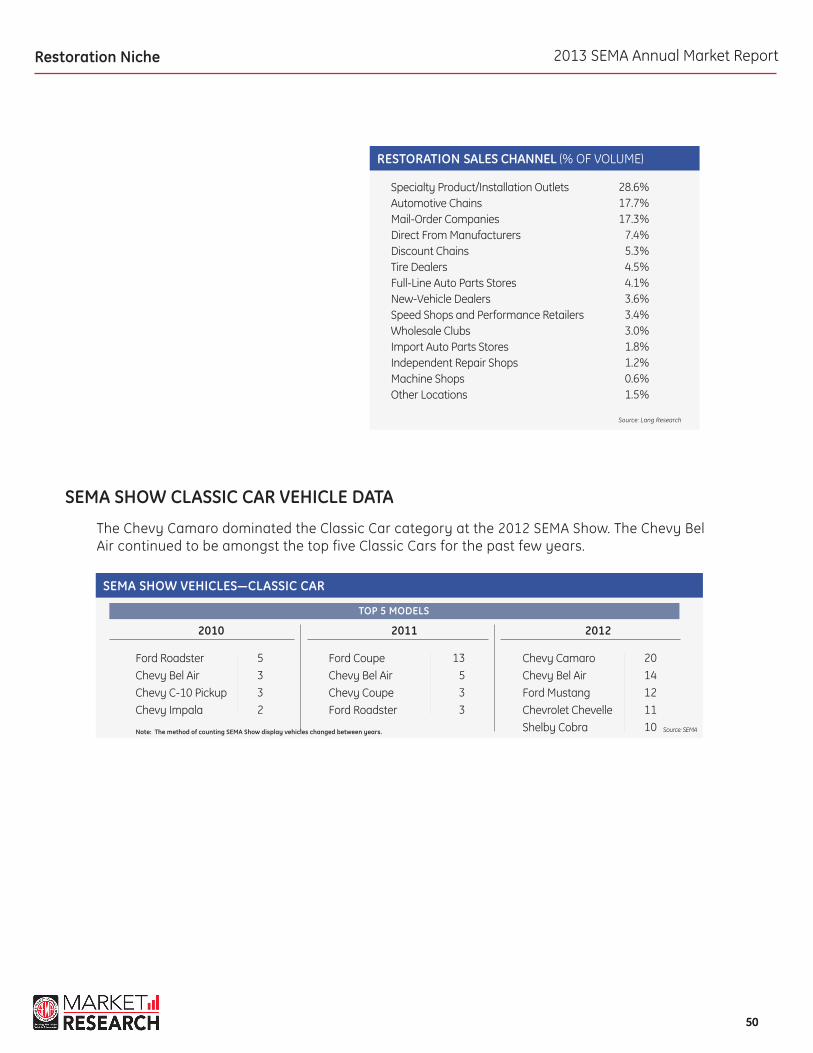
RESTORATION SALES CHANNEL (% OF VOLUME)
Specialty Product/Installation Outlets Automotive Chains Mail-Order CompaniesDirect From Manufacturers Discount Chains Tire Dealers Full-Line Auto Parts Stores New-Vehicle Dealers Speed Shops and Performance RetailersWholesale Clubs Import Auto Parts Stores Independent Repair Shops Machine Shops Other Locations
28.6%17.7%17.3%
7.4%5.3%4.5%4.1%3.6%3.4%3.0%1.8%1.2%0.6%1.5%
Source: Lang Research
SEMA SHOW CLASSIC CAR VEHICLE DATA
The Chevy Camaro dominated the Classic Car category at the 2012 SEMA Show. The Chevy Bel Air continued to be amongst the top five Classic Cars for the past few years.
SEMA ShOW VEhICLES—CLASSIC CAR
2010 2011 2012
Ford RoadsterChevy Bel AirChevy C-10 PickupChevy Impala
Ford CoupeChevy Bel AirChevy CoupeFord Roadster
Chevy CamaroChevy Bel AirFord MustangChevrolet ChevelleShelby Cobra
5332
13533
2014121110 Source: SEMA
TOP 5 MODELS
Note: The method of counting SEMA Show display vehicles changed between years.
2013 SEMA Annual Market Report
5151
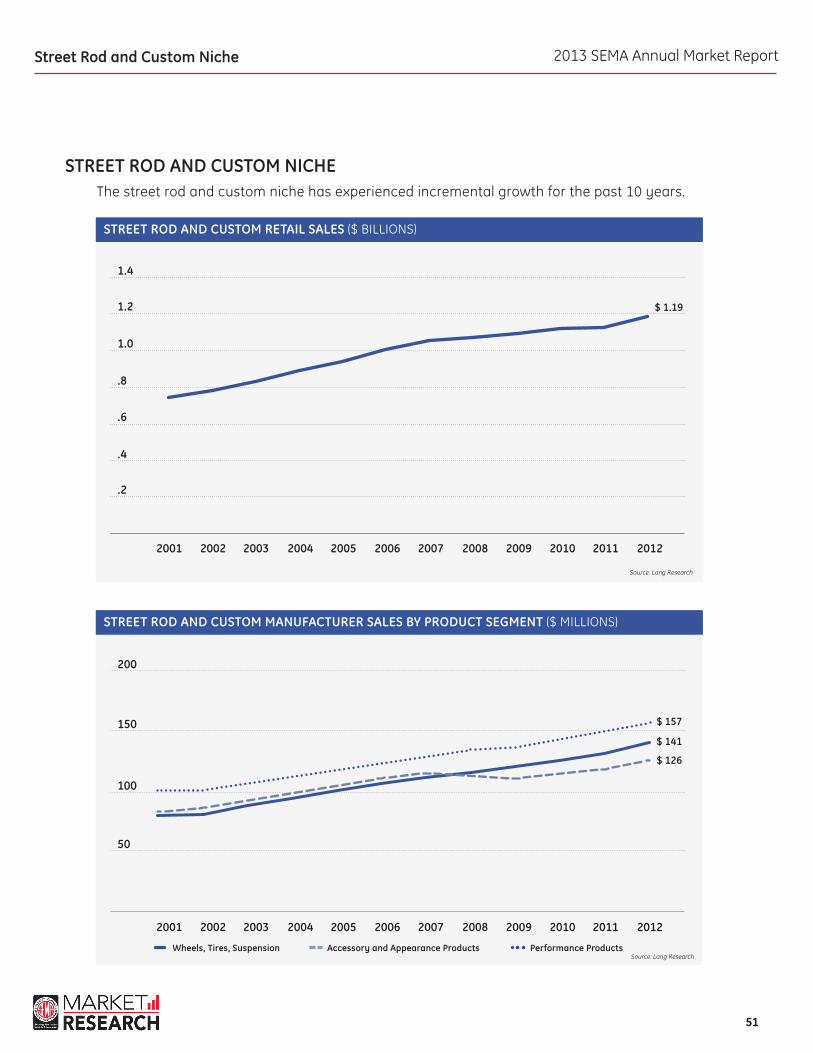
STREET ROD AND CUSTOM NICHEThe street rod and custom niche has experienced incremental growth for the past 10 years.
Street Rod and Custom Niche
STREET ROD AND CUSTOM RETAIL SALES ($ BILLIONS)
STREET ROD AND CUSTOM MANUFACTURER SALES BY PRODUCT SEGMENT ($ MILLIONS)
2001
2001
2005
2005
2009
2009
2003
2003
2007
2007
2011
2011
2002
2002
2006
2006
2010
2010
2004
2004
2008
2008
2012
2012
.4
.8
1.2
.2
50
100
150
200
.6
1.0
1.4
$ 1.19
$ 126
$ 141
$ 157
Source: Lang Research
Source: Lang ResearchPerformance ProductsWheels, Tires, Suspension Accessory and Appearance Products
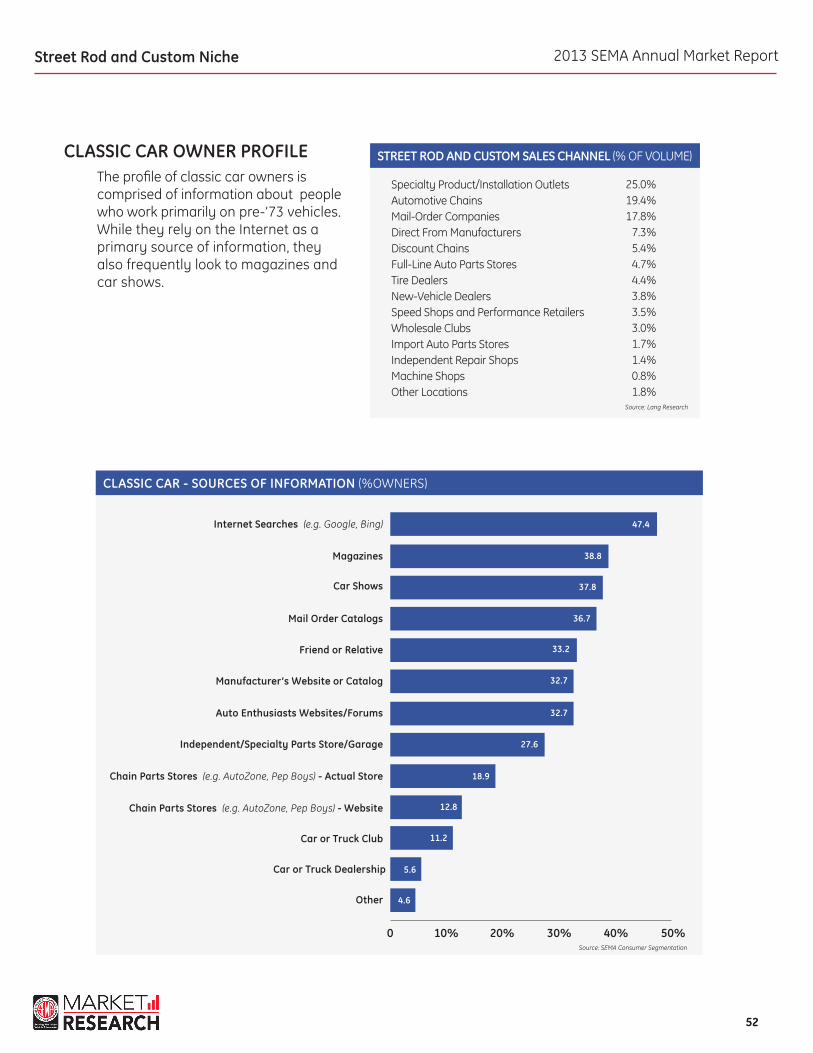
2013 SEMA Annual Market Report
5252
CLASSIC CAR OWNER PROFILEThe profile of classic car owners is comprised of information about people who work primarily on pre-’73 vehicles. While they rely on the Internet as a primary source of information, they also frequently look to magazines and car shows.
CLASSIC CAR - SOURCES OF INFORMATION (%OWNERS)
0 10% 30% 40% 50%20%
Car Shows
Auto Enthusiasts Websites/Forums
Magazines
Car or Truck Club
Mail Order Catalogs
Independent/Specialty Parts Store/Garage
Car or Truck Dealership
Friend or Relative
Chain Parts Stores (e.g. AutoZone, Pep Boys) - Actual Store
Other
Manufacturer’s Website or Catalog
Internet Searches (e.g. Google, Bing)
Chain Parts Stores (e.g. AutoZone, Pep Boys) - Website
37.8
32.7
38.8
11.2
33.2
18.9
36.7
27.6
5.6
4.6
32.7
47.4
12.8
Street Rod and Custom Niche
Source: SEMA Consumer Segmentation
STREET ROD AND CUSTOM SALES CHANNEL (% OF VOLUME)
Specialty Product/Installation Outlets Automotive Chains Mail-Order CompaniesDirect From Manufacturers Discount Chains Full-Line Auto Parts Stores Tire Dealers New-Vehicle Dealers Speed Shops and Performance RetailersWholesale Clubs Import Auto Parts Stores Independent Repair Shops Machine Shops Other Locations
25.0%19.4%17.8%
7.3%5.4%4.7%4.4%3.8%3.5%3.0%1.7%1.4%0.8%1.8%
Source: Lang Research
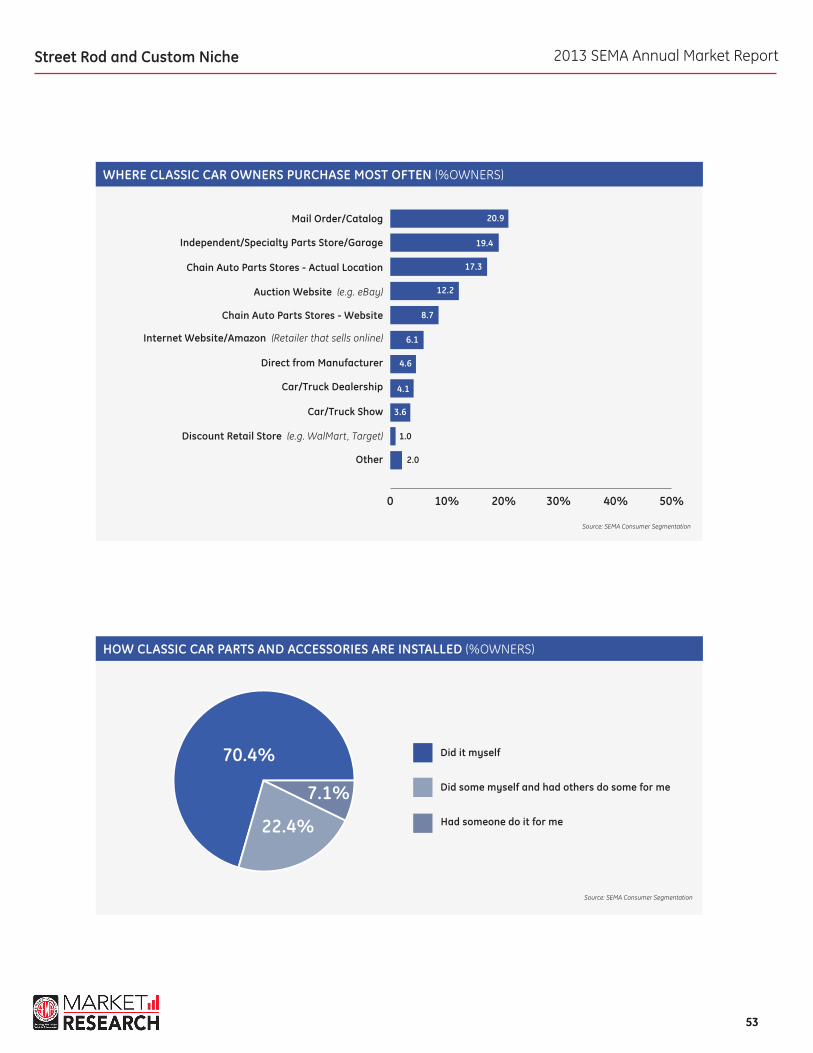
2013 SEMA Annual Market Report
5353
Source: SEMA Consumer Segmentation
Source: SEMA Consumer Segmentation
WHERE CLASSIC CAR OWNERS PURCHASE MOST OFTEN (%OWNERS)
HOW CLASSIC CAR PARTS AND ACCESSORIES ARE INSTALLED (%OWNERS)
0 20% 30% 40% 50%10%
Independent/Specialty Parts Store/Garage
Car/Truck Dealership
Mail Order/Catalog
Direct from Manufacturer
Chain Auto Parts Stores - Actual Location
Car/Truck Show
Auction Website (e.g. eBay)
Discount Retail Store (e.g. WalMart, Target)
Chain Auto Parts Stores - Website
Other
Internet Website/Amazon (Retailer that sells online)
Street Rod and Custom Niche
19.4
6.1
20.9
1.0
12.2
4.1
17.3
4.6
2.0
8.7
3.6
70.4%
7.1%
22.4%
Did some myself and had others do some for me
Did it myself
had someone do it for me
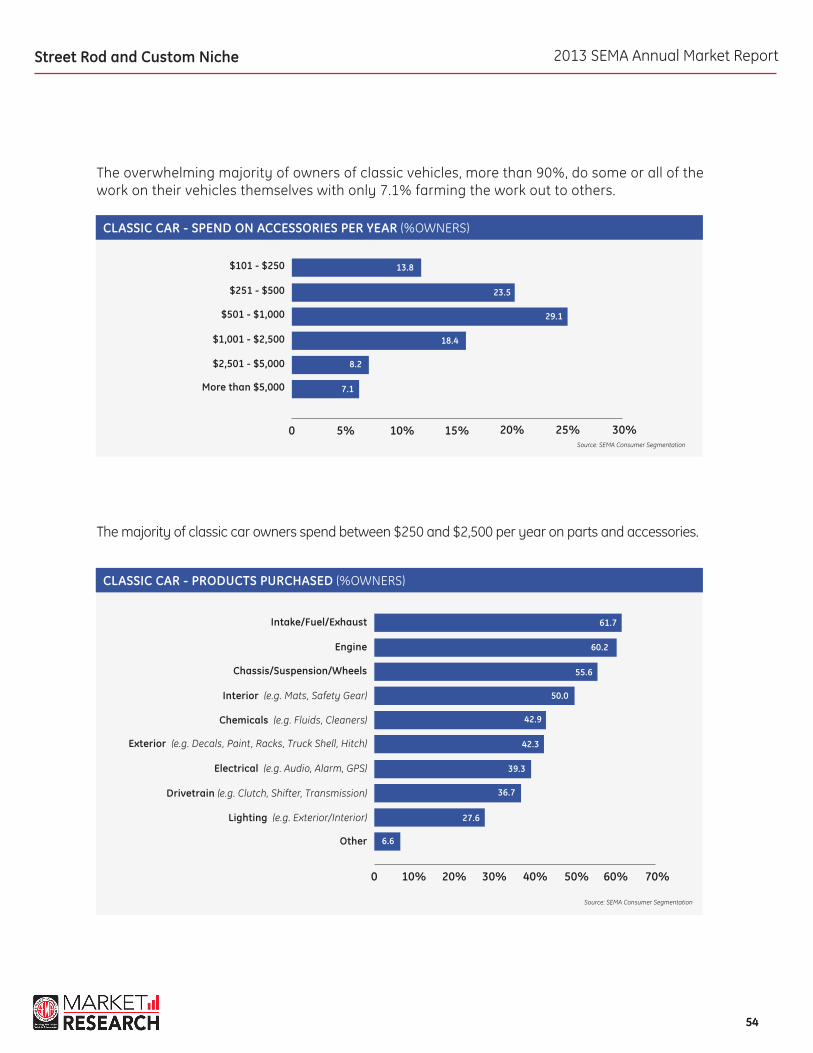
2013 SEMA Annual Market Report
5454
Street Rod and Custom Niche
Source: SEMA Consumer Segmentation
CLASSIC CAR - PRODUCTS PURChASED (%OWNERS)
0 10% 30% 40% 50% 60% 70%20%
Chassis/Suspension/Wheels
Electrical (e.g. Audio, Alarm, GPS)
Engine
Interior (e.g. Mats, Safety Gear)
Drivetrain (e.g. Clutch, Shifter, Transmission)
Chemicals (e.g. Fluids, Cleaners)
Lighting (e.g. Exterior/Interior)
Exterior (e.g. Decals, Paint, Racks, Truck Shell, Hitch)
Intake/Fuel/Exhaust
Other
55.6
39.3
60.2
42.9
27.6
50.0
36.7
42.3
61.7
6.6
The overwhelming majority of owners of classic vehicles, more than 90%, do some or all of the work on their vehicles themselves with only 7.1% farming the work out to others.
The majority of classic car owners spend between $250 and $2,500 per year on parts and accessories.
CLASSIC CAR - SPEND ON ACCESSORIES PER YEAR (%OWNERS)
0 5% 15% 20% 25% 30%10%
$501 - $1,000
$251 - $500
$1,001 - $2,500
$2,501 - $5,000
More than $5,000
$101 - $250
29.1
23.5
8.2
18.4
7.1
13.8
Source: SEMA Consumer Segmentation
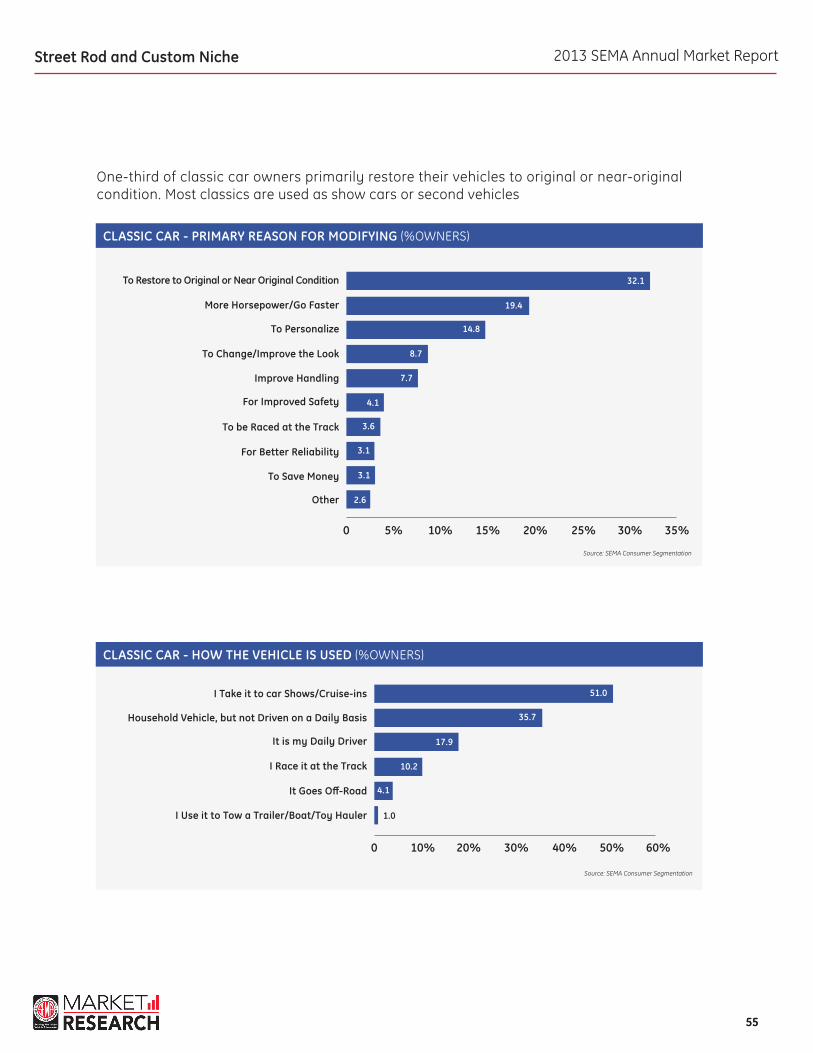
2013 SEMA Annual Market Report
5555
Street Rod and Custom Niche
Source: SEMA Consumer Segmentation
CLASSIC CAR - hOW ThE VEhICLE IS USED (%OWNERS)
0 10% 30% 40% 50% 60%20%
I Race it at the Track
It Goes Off-Road
household Vehicle, but not Driven on a Daily Basis
I Take it to car Shows/Cruise-ins
I Use it to Tow a Trailer/Boat/Toy hauler
It is my Daily Driver
10.2
35.7
51.0
1.0
4.1
17.9
CLASSIC CAR - PRIMARY REASON FOR MODIFYING (%OWNERS)
0 5% 15% 20% 25% 30% 35%10%
To Personalize
To be Raced at the Track
More horsepower/Go Faster
To Change/Improve the Look
For Better Reliability
Improve handling
To Save Money
For Improved Safety
Other
To Restore to Original or Near Original Condition
19.4
4.1
8.7
3.1
2.6
32.1
7.7
14.8
3.6
3.1
One-third of classic car owners primarily restore their vehicles to original or near-original condition. Most classics are used as show cars or second vehicles
Source: SEMA Consumer Segmentation
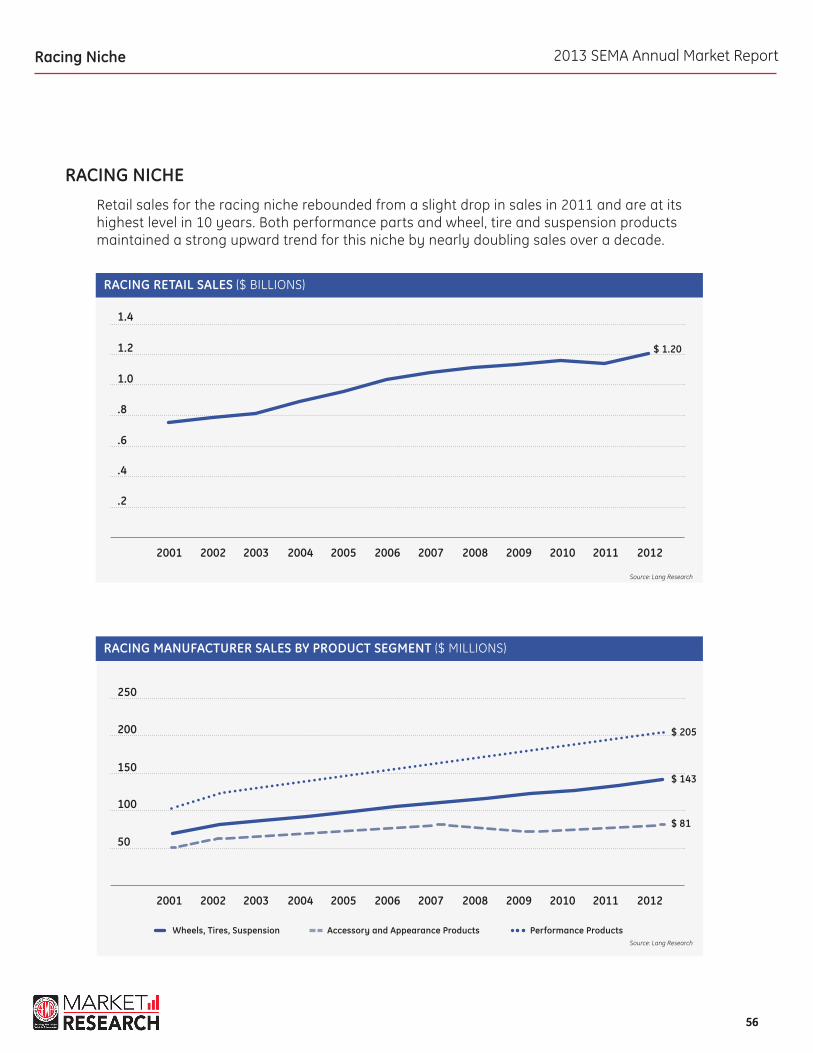
2013 SEMA Annual Market Report
5656
RACING NICHERetail sales for the racing niche rebounded from a slight drop in sales in 2011 and are at its highest level in 10 years. Both performance parts and wheel, tire and suspension products maintained a strong upward trend for this niche by nearly doubling sales over a decade.
Racing Niche
RACING RETAIL SALES ($ BILLIONS)
RACING MANUFACTURER SALES BY PRODUCT SEGMENT ($ MILLIONS)
2001
2001
2005
2005
2009
2009
2003
2003
2007
2007
2011
2011
2002
2002
2006
2006
2010
2010
2004
2004
2008
2008
2012
2012
.4
.8
1.2
.2
50
100
150
200
250
.6
1.0
1.4
$ 1.20
$ 81
$ 143
$ 205
Source: Lang Research
Source: Lang Research
Performance ProductsWheels, Tires, Suspension Accessory and Appearance Products

2013 SEMA Annual Market Report
5757
RACING VEHICLE OWNER PROFILE
Nearly 46% of vehicle owners who indicated that they race their vehicle at the track use a manufacturer’s website or catalog as a source of information. This is the only niche in which something other than Internet searches appeared as the top source. Note: This study did not target dedicated race cars, so most responses will be for multi-use vehicles.
RACING SALES CHANNEL (% OF VOLUME)
Specialty Product/Installation Outlets Mail-Order CompaniesAutomotive Chains Direct from Manufacturers Full-Line Auto Parts Stores Discount Chains Tire Dealers Speed Shops and Performance RetailersNew-Vehicle Dealers Wholesale Clubs Machine Shops Import Auto Parts Stores Independent Repair Shops Other Locations
23.4%18.3%15.5%
9.4%5.7%5.6%4.3%4.0%3.3%2.8%2.6%2.0%1.6%1.5%
Source: Lang Research
RACING - SOURCES OF INFORMATION (%OWNERS)
0 10% 30% 40% 50%20%
Internet Searches (e.g. Google, Bing)
Magazines
Manufacturer’s Website or Catalog
Mail Order Catalogs
Auto Enthusiasts Websites/Forums
Chain Parts Stores (e.g. AutoZone, Pep Boys) - Website
Car or Truck Dealership
Chain Parts Stores (e.g. AutoZone, Pep Boys) - Actual Store
Friend or Relative
Car or Truck Club
Car Shows
Independent/Specialty Parts Store/Garage
42.9
36.8
45.9
39.1
42.1
36.1
31.6
31.6
31.6
21.8
15.0
38.3
Racing Niche
Source: SEMA Consumer Segmentation

2013 SEMA Annual Market Report
5858
Source: SEMA Consumer Segmentation
Source: SEMA Consumer Segmentation
WHERE RACING OWNERS PURCHASE MOST OFTEN (%OWNERS)
HOW RACING PARTS AND ACCESSORIES ARE INSTALLED (%OWNERS)
0 10% 15% 20% 25%5%
Auction Website (e.g. eBay)
Internet Website/Amazon (Retailer that sells online)
Car/Truck Show
Chain Auto Parts Stores - Actual Location
Chain Auto Parts Stores - Website
Independent/Specialty Parts Store/Garage
Discount Retail Store (e.g. WalMart, Target)
Direct from Manufacturer
Discount Retail Store- Website (e.g. WalMart.com, Target.com)
Mail Order/Catalog
Other
Car/Truck Dealership
Racing Niche
11.3
7.5
15.8
19.5
8.3
6.0
10.5
6.8
0.8
7.5
4.5
1.5
68.4% 10.5%
21.1%Did some myself and had others do some for me
Did it myself
had someone do it for me
Nearly 90% of race vehicle owners do some or all of the work themselves.
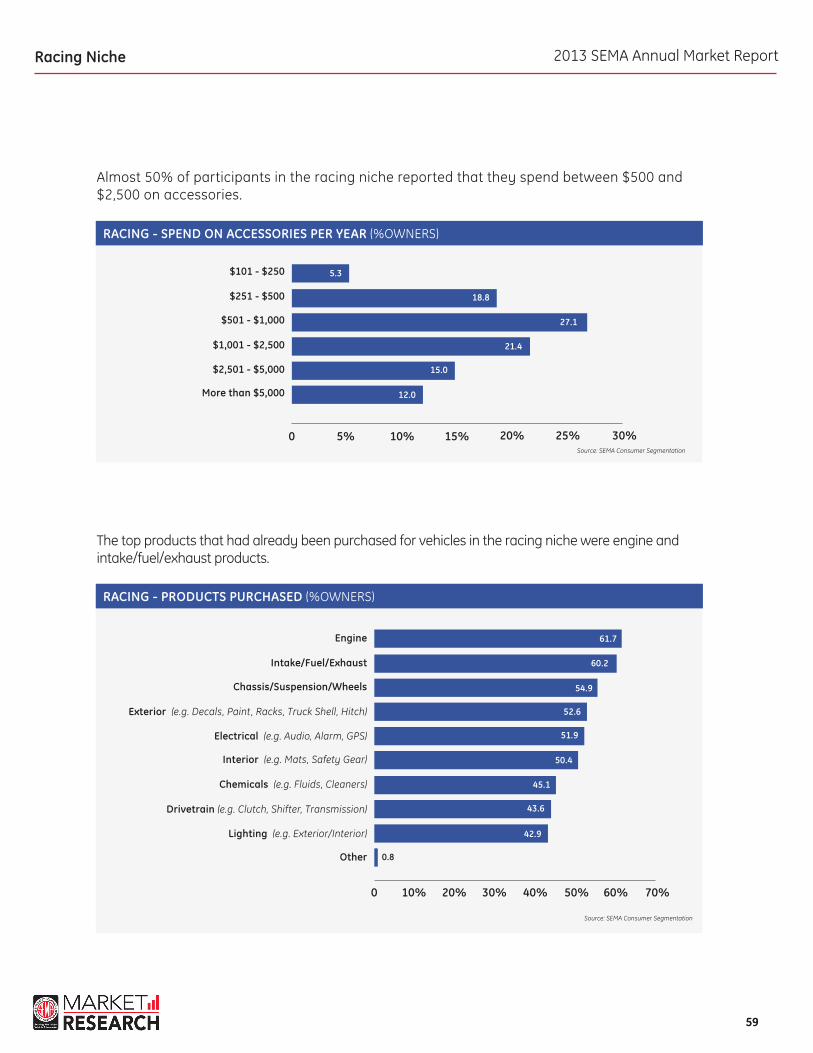
2013 SEMA Annual Market Report
5959
Racing Niche
Source: SEMA Consumer Segmentation
RACING - PRODUCTS PURChASED (%OWNERS)
0 10% 30% 40% 50% 60% 70%20%
Chassis/Suspension/Wheels
Chemicals (e.g. Fluids, Cleaners)
Intake/Fuel/Exhaust
Exterior (e.g. Decals, Paint, Racks, Truck Shell, Hitch)
Drivetrain (e.g. Clutch, Shifter, Transmission)
Electrical (e.g. Audio, Alarm, GPS)
Lighting (e.g. Exterior/Interior)
Interior (e.g. Mats, Safety Gear)
Engine
Other
54.9
45.1
60.2
51.9
42.9
52.6
43.6
50.4
61.7
0.8
Almost 50% of participants in the racing niche reported that they spend between $500 and $2,500 on accessories.
The top products that had already been purchased for vehicles in the racing niche were engine and intake/fuel/exhaust products.
RACING - SPEND ON ACCESSORIES PER YEAR (%OWNERS)
0 5% 15% 20% 25% 30%10%
$501 - $1,000
$251 - $500
$1,001 - $2,500
$2,501 - $5,000
More than $5,000
$101 - $250
27.1
18.8
15.0
21.4
12.0
5.3
Source: SEMA Consumer Segmentation
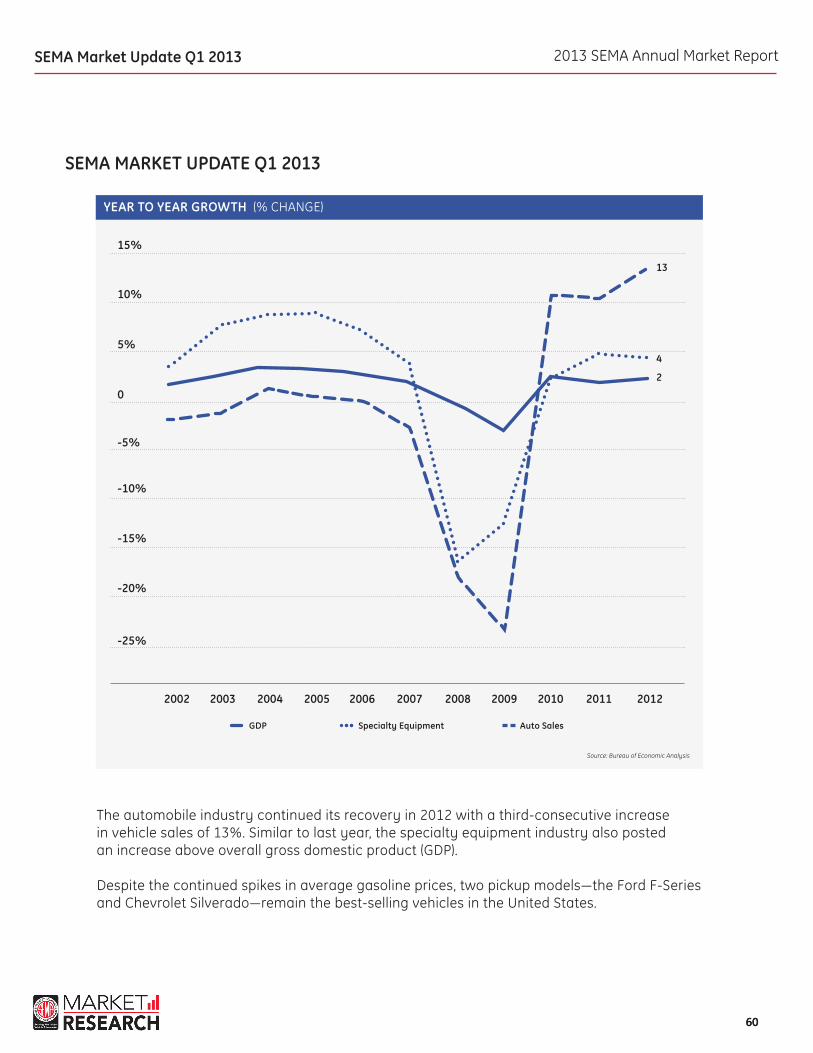
2013 SEMA Annual Market Report
6060
SEMA MARKET UPDATE Q1 2013
The automobile industry continued its recovery in 2012 with a third-consecutive increase in vehicle sales of 13%. Similar to last year, the specialty equipment industry also posted an increase above overall gross domestic product (GDP).
Despite the continued spikes in average gasoline prices, two pickup models—the Ford F-Series and Chevrolet Silverado—remain the best-selling vehicles in the United States.
SEMA Market Update Q1 2013
YEAR TO YEAR GROWTH (% CHANGE)
2005 20092003 2007 20112002 2006 20102004 2008 2012
-20%
-25%
-15%
-10%
-5%
0
5%
10%
15%
Source: Bureau of Economic Analysis
Specialty EquipmentGDP Auto Sales
13
4
2

2013 SEMA Annual Market Report
6161
While fluctuating quarterly, overall GDP has shown positive growth throughout the last two years. Forecasters predict continued, steady growth in GDP over the next several years.
SEMA Market Update Q1 2013
REAL GDP (%)
2
-10%
-8%
-6%
-4%
-2%
0
4%
6%
Source: Bureau of Economic Analysis
U.S. RETAIL GAS PRICES ($ PER GALLON)
$ 0.50
$ 1.00
$ 1.50
$ 2.50
$ 2.00
$ 3.00
$ 3.50
$ 4.00
$ 4.50
2003: Jan
2004: Jan
2005: Jan
2006: Jan
2007: Jan
2008: Jan
2009: Jan
2010: Jan
2011: Jan
2012: Jan
2013: Jan
Source: Energy Information Administration
REAL GDP (%)
2013:Q12013:Q22013:Q32013:Q42014:Q1
Quarterly Data:
Annual Data (projections are based on annual-average levels):
2013201420152016
1.72
2.72.8
N/A
22.72.9
N/A
2.12.32.62.52.7
1.92.82.9
3Source: Federal Reserve Bank of Philadelphia:
Survey of Professional Forecasters
Forecast
Previous New
2007: Jan
2008: Jan
2009: Jan
2010: Jan
2011: Jan
2012: Jan
2013: Jan
2.5
$ 3.61
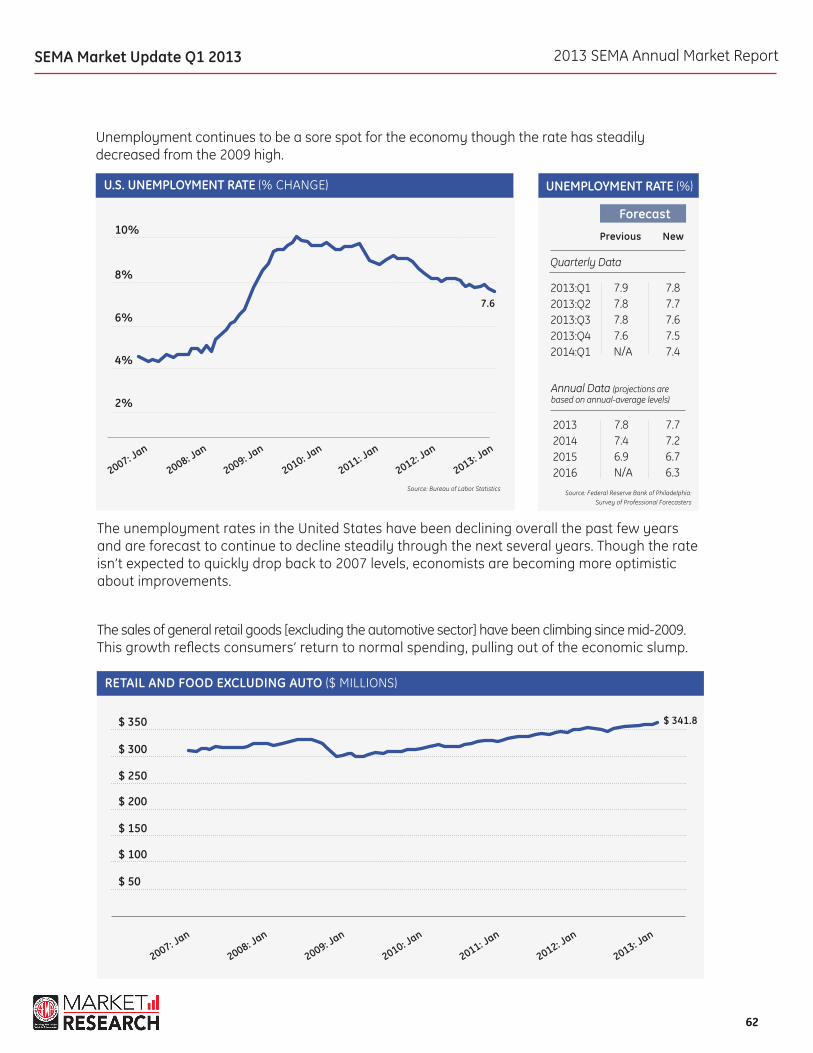
2013 SEMA Annual Market Report
6262
SEMA Market Update Q1 2013
Unemployment continues to be a sore spot for the economy though the rate has steadily decreased from the 2009 high.
U.S. UNEMPLOYMENT RATE (% CHANGE)
2007: Jan
2008: Jan
2009: Jan
2010: Jan
2011: Jan
2012: Jan
2013: Jan
10%
2%
4%
6%
8%
Source: Bureau of Labor Statistics
UNEMPLOYMENT RATE (%)
2013:Q12013:Q22013:Q32013:Q42014:Q1
Quarterly Data
Annual Data (projections are based on annual-average levels)
2013201420152016
7.97.87.87.6N/A
7.87.46.9N/A
7.87.77.67.57.4
7.77.26.76.3
Source: Federal Reserve Bank of Philadelphia: Survey of Professional Forecasters
Forecast
Previous New
The unemployment rates in the United States have been declining overall the past few years and are forecast to continue to decline steadily through the next several years. Though the rate isn’t expected to quickly drop back to 2007 levels, economists are becoming more optimistic about improvements.
The sales of general retail goods [excluding the automotive sector] have been climbing since mid-2009. This growth reflects consumers’ return to normal spending, pulling out of the economic slump.
RETAIL AND FOOD ExCLUDING AUTO ($ MILLIONS)
$ 50
$ 100
$ 150
$ 250
$ 300
$ 350
$ 200
2007: Jan
2008: Jan
2009: Jan
2010: Jan
2011: Jan
2012: Jan
2013: Jan
$ 341.8
7.6
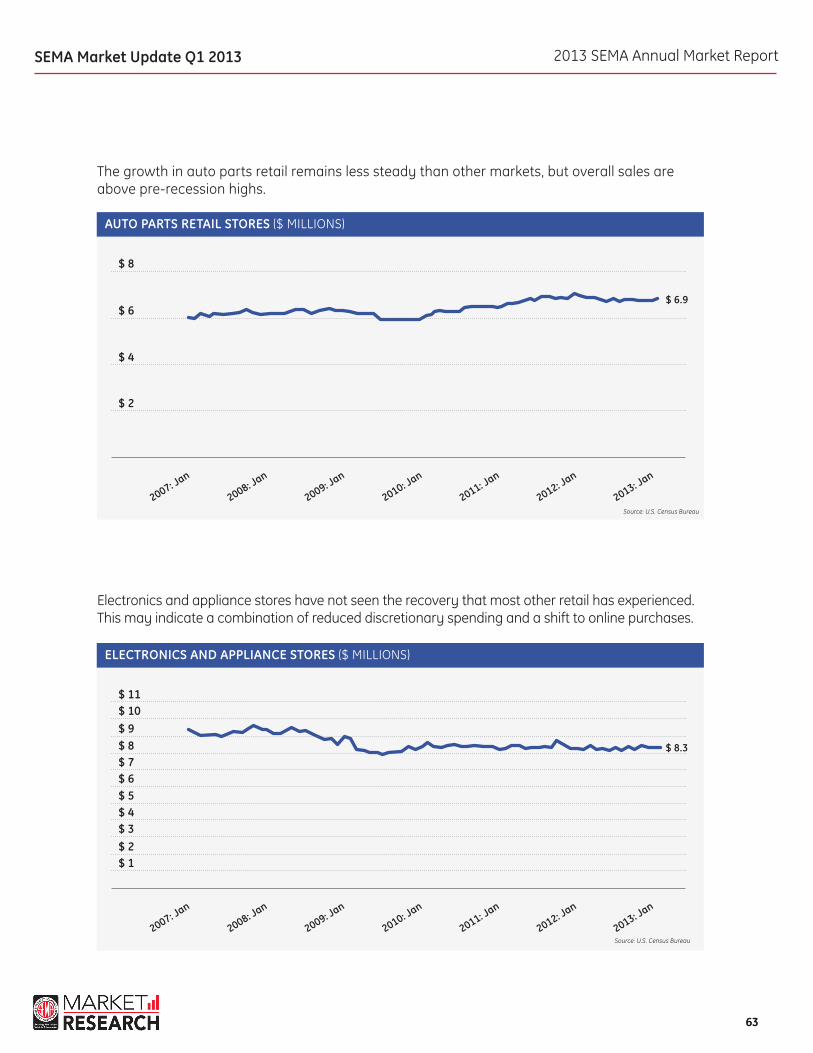
2013 SEMA Annual Market Report
6363
SEMA Market Update Q1 2013
The growth in auto parts retail remains less steady than other markets, but overall sales are above pre-recession highs.
Electronics and appliance stores have not seen the recovery that most other retail has experienced. This may indicate a combination of reduced discretionary spending and a shift to online purchases.
AUTO PARTS RETAIL STORES ($ MILLIONS)
ELECTRONICS AND APPLIANCE STORES ($ MILLIONS)
$ 2
$ 1
$ 4
$ 2
$ 6
$ 3
$ 5$ 6$ 7$ 8$ 9$ 10$ 11
$ 8
$ 4
2007: Jan
2007: Jan
2008: Jan
2008: Jan
2009: Jan
2009: Jan
2010: Jan
2010: Jan
2011: Jan
2011: Jan
2012: Jan
2012: Jan
2013: Jan
2013: Jan
Source: U.S. Census Bureau
Source: U.S. Census Bureau
$ 8.3
$ 6.9
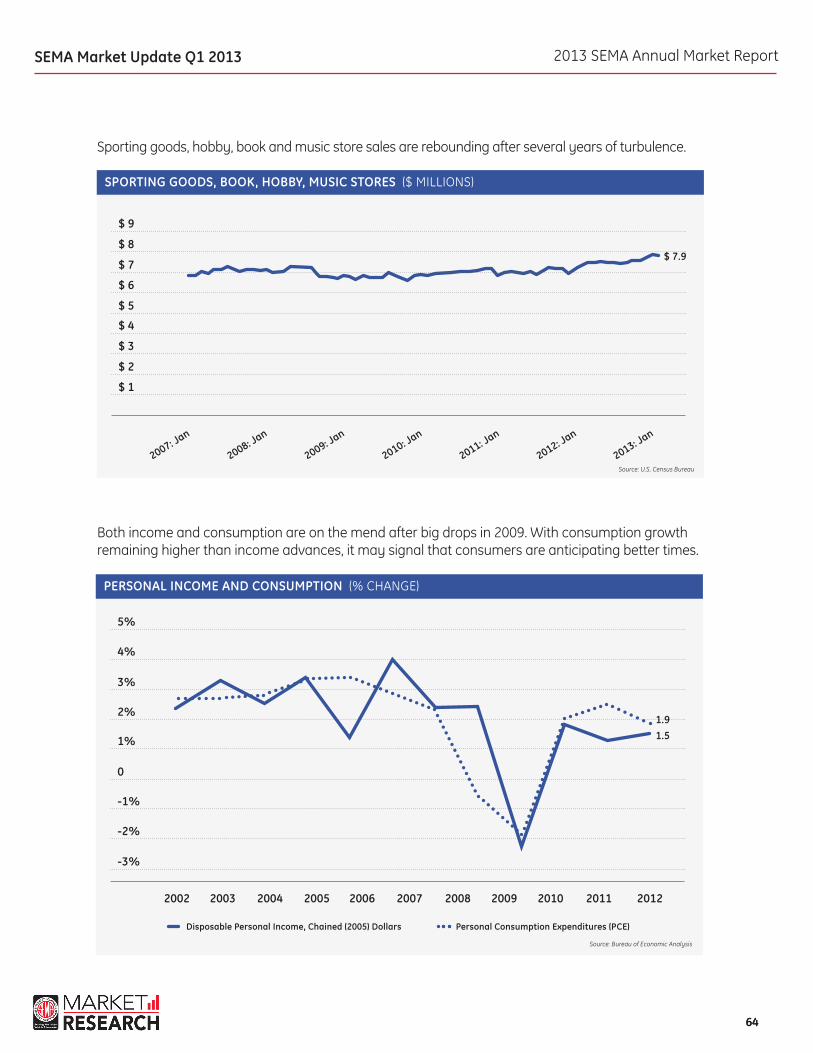
2013 SEMA Annual Market Report
6464
SEMA Market Update Q1 2013
PERSONAL INCOME AND CONSUMPTION (% CHANGE)
2005 20092003 2007 20112002 2006 20102004 2008 2012
-1%
-2%
-3%
0
1%
2%
3%
4%
5%
Personal Consumption Expenditures (PCE)Disposable Personal Income, Chained (2005) Dollars
Sporting goods, hobby, book and music store sales are rebounding after several years of turbulence.
Both income and consumption are on the mend after big drops in 2009. With consumption growth remaining higher than income advances, it may signal that consumers are anticipating better times.
SPORTING GOODS, BOOk, hOBBY, MUSIC STORES ($ MILLIONS)
$ 1
$ 2
$ 3
$ 4
$ 5
$ 6
$ 7
$ 8
$ 9
2007: Jan
2008: Jan
2009: Jan
2010: Jan
2011: Jan
2012: Jan
2013: Jan
Source: U.S. Census Bureau
Source: Bureau of Economic Analysis
1.51.9
$ 7.9
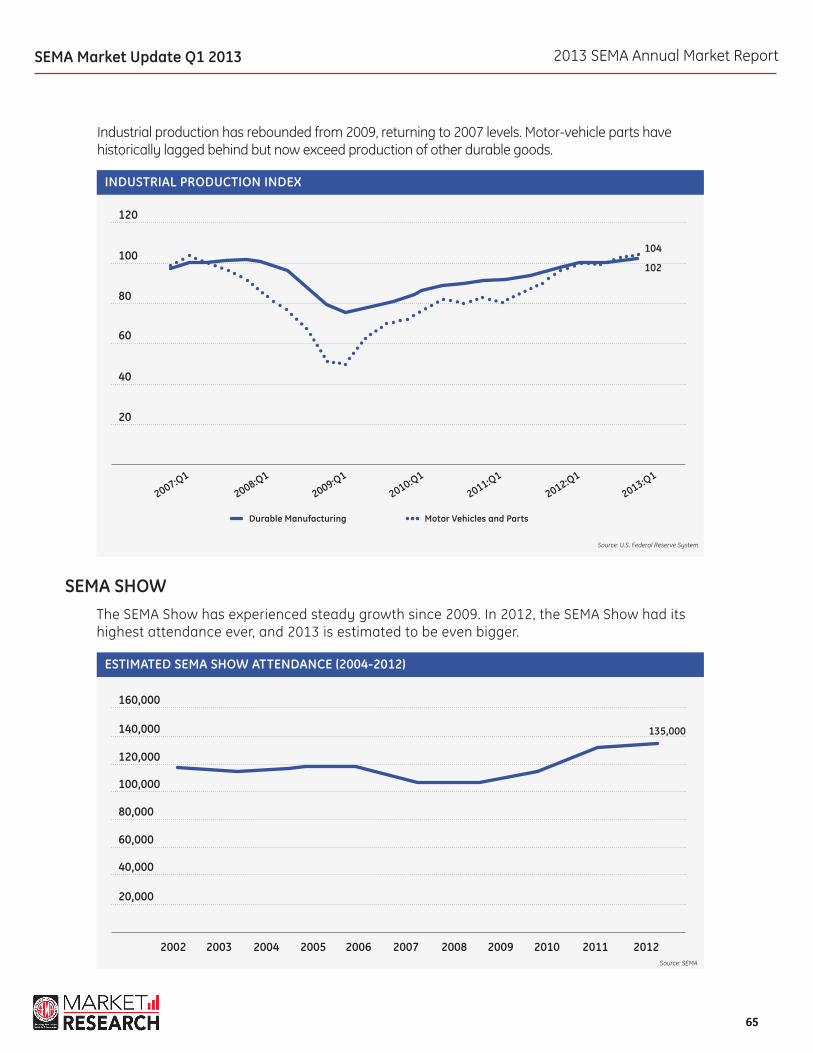
2013 SEMA Annual Market Report
6565
SEMA Market Update Q1 2013
2005 20092003 2007 20112002 2006 20102004 2008 2012
Motor Vehicles and PartsDurable Manufacturing
Industrial production has rebounded from 2009, returning to 2007 levels. Motor-vehicle parts have historically lagged behind but now exceed production of other durable goods.
INDUSTRIAL PRODUCTION INDEx
ESTIMATED SEMA ShOW ATTENDANCE (2004-2012)
20
20,000
40,000
40
60,000
60
80,000
80
100,000
100
120,000
120
160,000
140,000
SEMA SHOWThe SEMA Show has experienced steady growth since 2009. In 2012, the SEMA Show had its highest attendance ever, and 2013 is estimated to be even bigger.
2007:Q1
2008:Q1
2009:Q1
2010:Q1
2011:Q1
2012:Q1
2013:Q1
102
135,000
104
Source: U.S. Federal Reserve System
Source: SEMA

2013 SEMA Annual Market Report
6666
TOP 2012 SEMA SHOW DISPLAY VEHICLES
Ford MustangChevrolet CamaroScion FR-SChevrolet CorvetteChallenger, BMW 3-series, Porsche 911, Genesis
Jeep WranglerChevrolet SilveradoFord F-SeriesRamFord Raptor
Fiat 500Chevrolet SonicFord FiestaSubaru Impreza WRXChevrolet SparkVolkswagen Beetle
Mercedes-Benz C-ClassChrysler 300Ford FocusFord FusionCadillac CTS
Jeep WranglerChevrolet SilveradoFord F-SeriesFord Super DutyRam
Chevrolet CamaroChevrolet Bel AirFord MustangChevrolet ChevelleShelby Cobra
7473532214
10152473023
12111010
88
17151210
9
10152494830
2014121110
STREET PERFORMANCE
OFF-ROAD
COMPACT PERFORMANCE
RESTYLING
LIGhT-TRUCk
CLASSIC CAR
SEMA Market Update Q1 2013
Racing & PerformanceTrucks, SUVs & Off-RoadHot Rod AlleyRestyling & Car Care AccessoriesTools & EquipmentRestoration
Performance-Street ProductExterior Accessory ProductOff-Road/4-Wheel Drive ProductPerformance-Racing ProductTools & Equipment ProductVan/Pickup/Sport-Utility ProductEngineered New ProductFeatured ProductStreet Rod/Custom Car ProductInterior Accessory ProductWheel and Related ProductMobile Electronics ProductCollision Repair & Refinish ProductMerchandising DisplayPowersports ProductPackaging DisplayTire and Related Product
PERCENTAGE OF NEW PRODUCTS BY SEMA ShOW SECTION
TOTAL PERCENTAGE OF PRODUCTS BY ShOWCASE CATEGORY
2010
2010
2011
2011
2012
2012
39.4%14.4%
6.5%7.1%
--5.1%
14.5%7.9%
10.0%10.6%
5.0%5.4%5.6%7.5%6.9%4.8%4.3%3.7%4.1%2.7%2.5%2.2%2.1%
43.5%16.1%
7.1%6.1%
--5.5%
15.7%8.1%
10.6%11.1%
4.9%5.8%5.3%6.5%7.5%4.7%4.1%3.5%2.9%2.7%2.7%2.1%1.8%
40.3%18.8%
8.1%8.1%5.1%4.5%
17.5%10.6%10.3%
7.7%6.7%6.4%5.9%5.6%5.5%5.3%4.5%3.4%3.0%2.0%1.9%1.8%1.8%
Source: SEMA
Source: SEMA
SEMA SHOWNEW PRODUCTS SHOWCASE
There were a total of 1,929 unique entries in the New Products Showcase for the 2012 SEMA Show, and a total of 652 different companies submitted products for the Showcase. The following tables list the percentages of products by Show sections, as well as by the product categories of the New Products Showcase.
Not surprisingly, there were significantly more products submitted by companies in the Racing & Performance section of the SEMA Show compared to the other sections, since it’s the largest in terms of square footage and number of exhibitors.
Source: SEMA
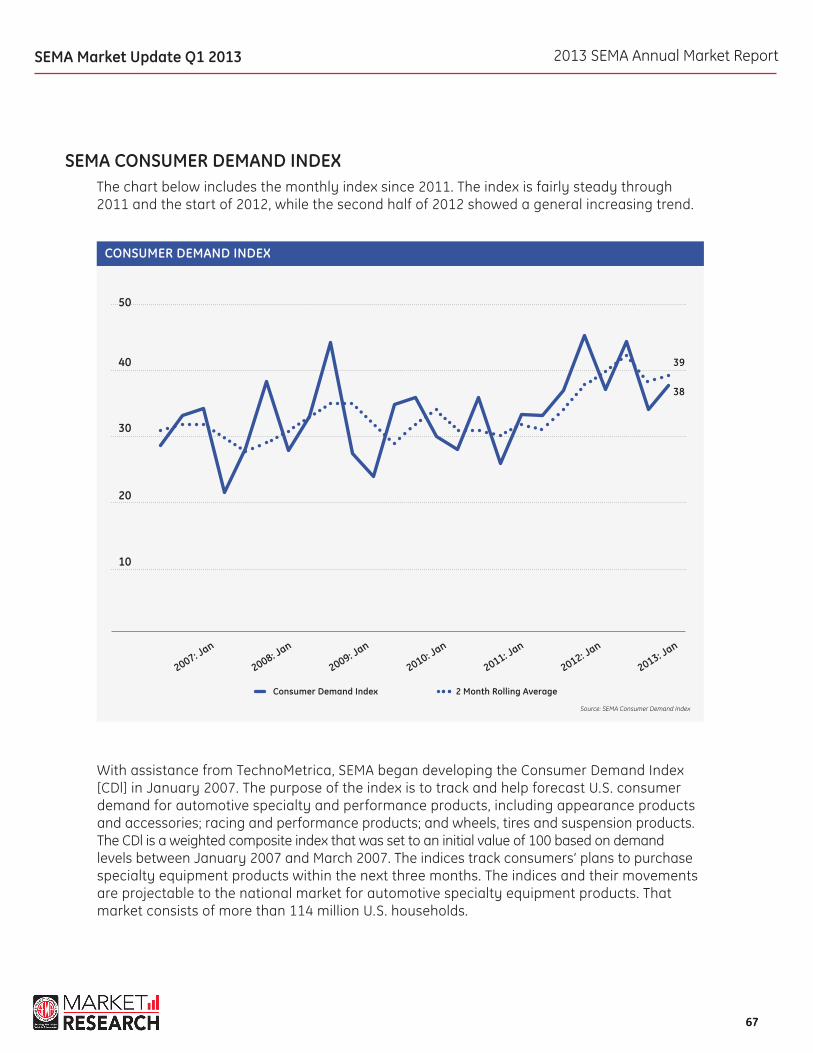
2013 SEMA Annual Market Report
6767
SEMA Market Update Q1 2013
2 Month Rolling AverageConsumer Demand Index
With assistance from TechnoMetrica, SEMA began developing the Consumer Demand Index [CDl] in January 2007. The purpose of the index is to track and help forecast U.S. consumer demand for automotive specialty and performance products, including appearance products and accessories; racing and performance products; and wheels, tires and suspension products. The CDl is a weighted composite index that was set to an initial value of 100 based on demand levels between January 2007 and March 2007. The indices track consumers’ plans to purchase specialty equipment products within the next three months. The indices and their movements are projectable to the national market for automotive specialty equipment products. That market consists of more than 114 million U.S. households.
CONSUMER DEMAND INDEx
10
20
30
40
50
SEMA CONSUMER DEMAND INDExThe chart below includes the monthly index since 2011. The index is fairly steady through 2011 and the start of 2012, while the second half of 2012 showed a general increasing trend.
Source: SEMA Consumer Demand Index
2007: Jan
2008: Jan
2009: Jan
2010: Jan
2011: Jan
2012: Jan
2013: Jan
38
39

2013 SEMA Annual Market Report
6868
SEMA Market Update Q1 2013
2011: Jan
2011: Jul
2012: Jan
2012: Jul
2013: Jan
YTD SALES COMPARISON FOR MANUFACTURERS (%)
10%
20%
30%
40%
50%
60%
70%
80%
SEMA FINANCIAL BENChMARkING
The SEMA Financial Benchmarking Program was developed in order to provide SEMA members with key, industry-specific performance indicators to help them measure and compare their business operations with others in the industry. Data is collected each month from three different market segments: manufacturers, distributors and retailers. Program manager Hedges & Company collects this data anonymously through an online SEMA Financial Benchmarking survey. Those companies that participate receive a free copy of the SEMA Financial Benchmarking Reports.
After seeing mostly positive growth in 2011 to recover from the downturn, 2012 showed more mixed results. The second half of 2012 showed a more downward trend in sales year over year. Both distributors and retailers are slowly recovering in Q1 of 2013 from the lackluster holiday season.
Source: SEMA Financial Benchmarking
DownUp Flat
19.4
22.6
58.1

2013 SEMA Annual Market Report
6969
YTD SALES COMPARISON FOR RETAILERS (%)
10%
20%
30%
40%
50%
60%
70%
80%
SEMA Market Update Q1 2013
YTD SALES COMPARISON FOR DISTRIBUTORS (%)
10%
20%
30%
40%
50%
60%
70%
80%
90%
Down
Down
Up
Up
Flat
Flat
18.2
31.8
50.0
26.1
26.1
47.8
2011: Jan
2011: Jan
2011: Jul
2011: Jul
2012: Jan
2012: Jan
2012: Jul
2012: Jul
2013: Jan
2013: Jan
Source: SEMA Financial Benchmarking
Source: SEMA Financial Benchmarking
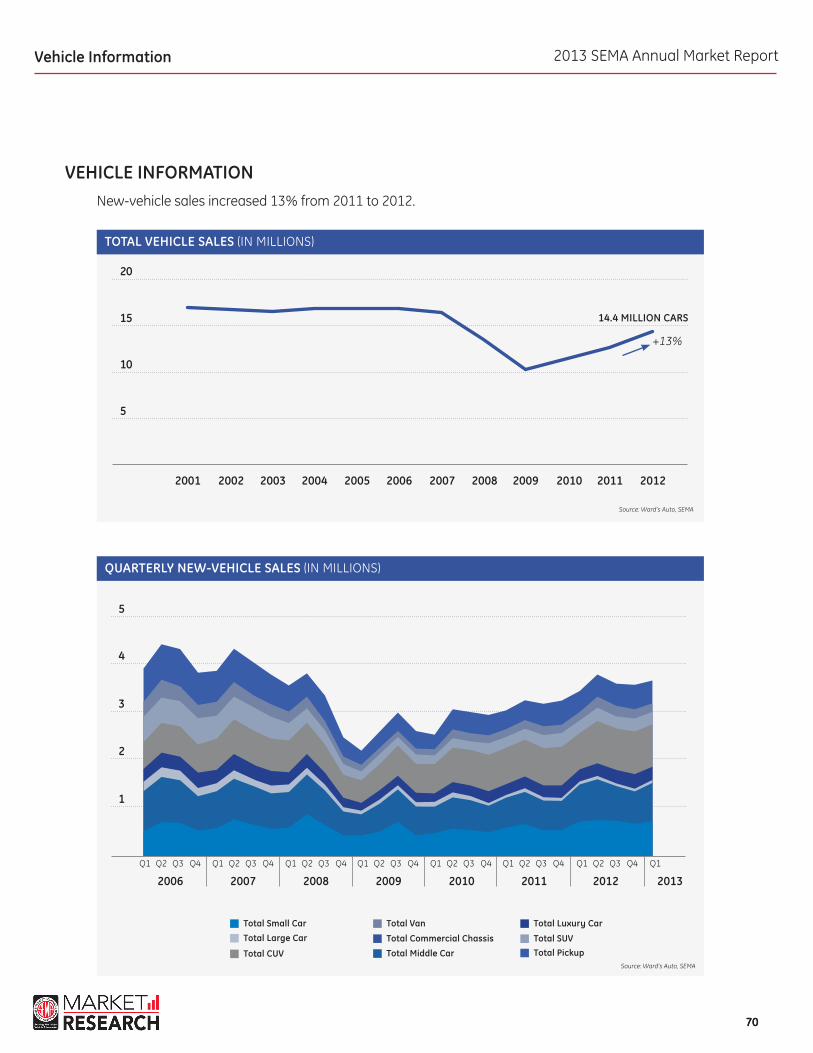
2013 SEMA Annual Market Report
7070
New-vehicle sales increased 13% from 2011 to 2012.
QUARTERLY NEW-VEhICLE SALES (IN MILLIONS)
1
2
3
4
5
Total Small Car
Total Commercial Chassis
Total CUV
Total Luxury Car
Total Large Car
Total Middle Car
Total Van
Total SUVTotal Pickup
Vehicle Information
Source: Ward’s Auto, SEMA
Source: Ward’s Auto, SEMA
TOTAL VEHICLE SALES (IN MILLIONS)
10
15
5
20
VEHICLE INFORMATION
14.4 MILLION CARS
2004 2008
2008
2002 2006
2006Q1 Q1 Q1 Q1 Q1 Q1 Q1 Q1Q3 Q3 Q3 Q3 Q3 Q3 Q3Q2 Q2 Q2 Q2 Q2 Q2 Q2Q4 Q4 Q4 Q4 Q4 Q4 Q4
2011
2011
2010
2010
2001 2005 2009
2009
2003 2007
2007
2012
2012 2013
+13%
Source: Ward’s Auto, SEMA
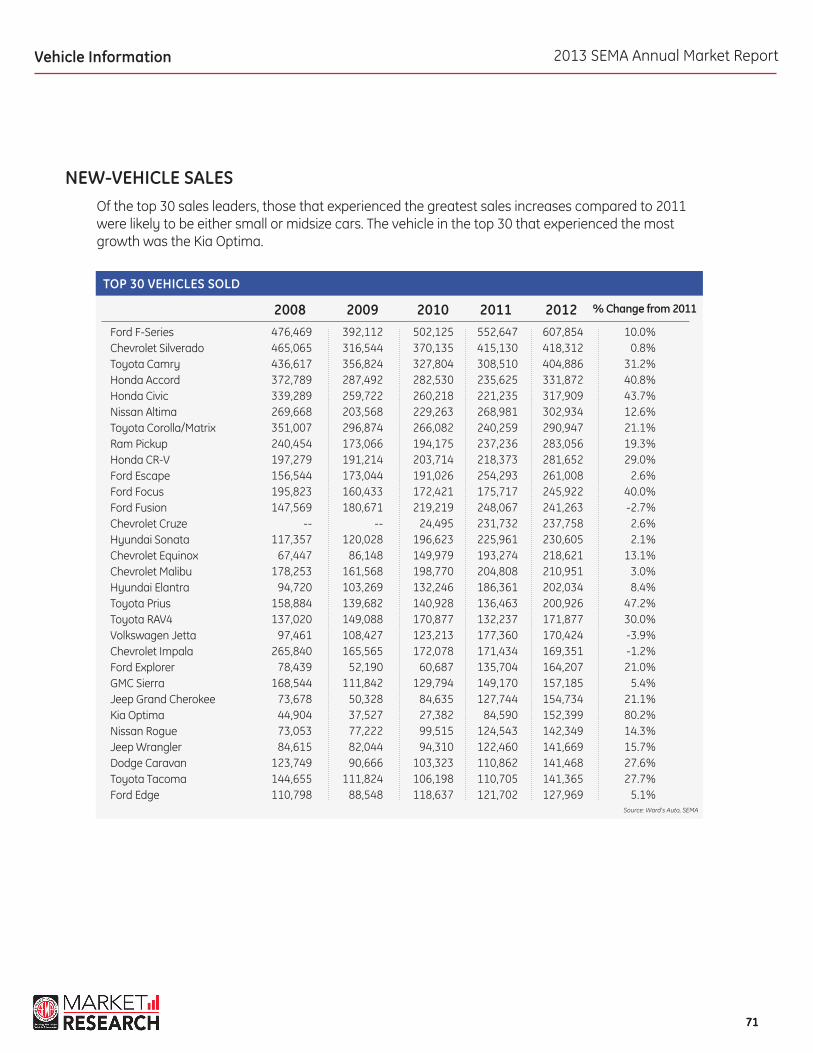
2013 SEMA Annual Market Report
7171
Of the top 30 sales leaders, those that experienced the greatest sales increases compared to 2011 were likely to be either small or midsize cars. The vehicle in the top 30 that experienced the most growth was the Kia Optima.
NEW-VEhICLE SALES
TOP 30 VEHICLES SOLD
2008 2009 2010 2011 2012 % Change from 2011
Ford F-SeriesChevrolet SilveradoToyota Camry Honda AccordHonda CivicNissan AltimaToyota Corolla/MatrixRam PickupHonda CR-VFord EscapeFord FocusFord FusionChevrolet CruzeHyundai SonataChevrolet EquinoxChevrolet MalibuHyundai ElantraToyota PriusToyota RAV4Volkswagen JettaChevrolet ImpalaFord ExplorerGMC SierraJeep Grand CherokeeKia OptimaNissan RogueJeep WranglerDodge Caravan Toyota TacomaFord Edge
476,469465,065436,617372,789339,289269,668351,007240,454197,279156,544195,823147,569
--117,357
67,447178,253
94,720158,884137,020
97,461265,840
78,439168,544
73,67844,90473,05384,615
123,749144,655110,798
392,112316,544356,824287,492259,722203,568296,874173,066191,214173,044160,433180,671
--120,028
86,148161,568103,269139,682149,088108,427165,565
52,190111,842
50,32837,52777,22282,04490,666
111,82488,548
502,125370,135327,804282,530260,218229,263266,082194,175203,714191,026172,421219,219
24,495196,623149,979198,770132,246140,928170,877123,213172,078
60,687129,794
84,63527,38299,51594,310
103,323106,198118,637
552,647415,130308,510235,625221,235268,981240,259237,236218,373254,293175,717248,067231,732225,961193,274204,808186,361136,463132,237177,360171,434135,704149,170127,744
84,590124,543122,460110,862110,705121,702
607,854418,312404,886331,872317,909302,934290,947283,056281,652261,008245,922241,263237,758230,605218,621210,951202,034200,926171,877170,424169,351164,207157,185154,734152,399142,349141,669141,468141,365127,969
10.0%0.8%
31.2%40.8%43.7%12.6%21.1%19.3%29.0%
2.6%40.0%-2.7%2.6%2.1%
13.1%3.0%8.4%
47.2%30.0%-3.9%-1.2%21.0%
5.4%21.1%80.2%14.3%15.7%27.6%27.7%
5.1%Source: Ward’s Auto, SEMA
Vehicle Information
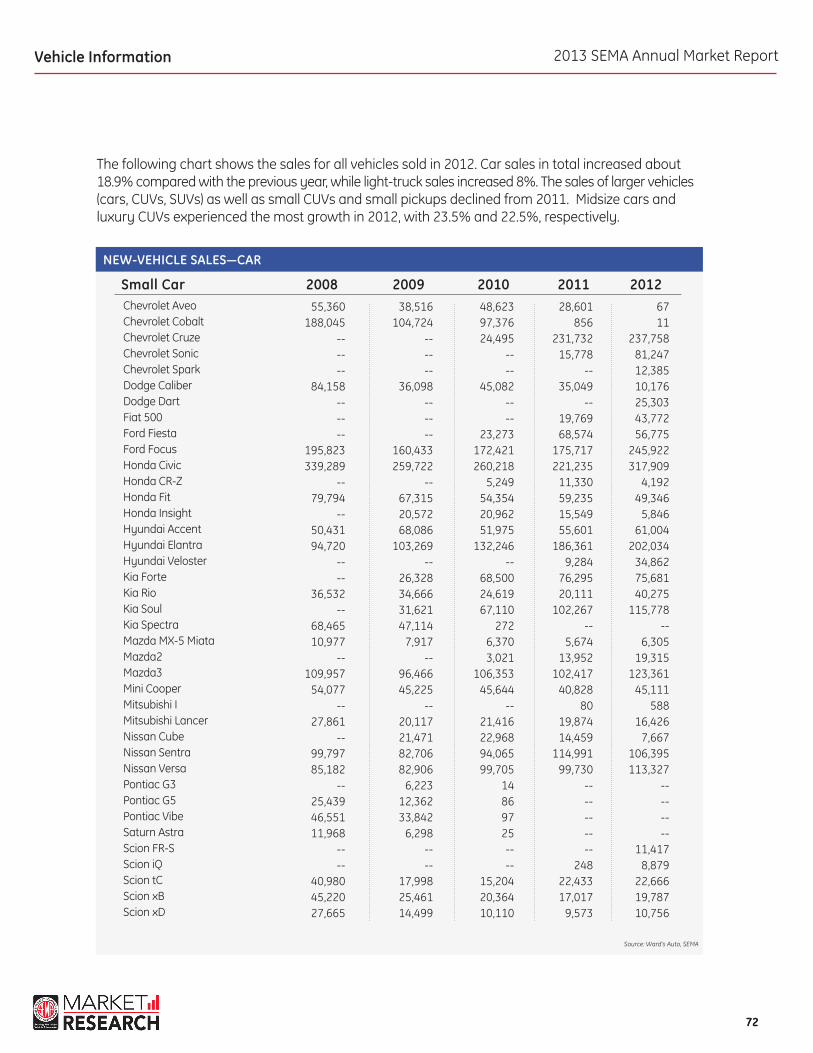
2013 SEMA Annual Market Report
7272
NEW-VEhICLE SALES—CAR
2008 Small Car 2009 2010 2011 2012 Chevrolet Aveo Chevrolet CobaltChevrolet CruzeChevrolet SonicChevrolet Spark Dodge CaliberDodge DartFiat 500Ford FiestaFord FocusHonda CivicHonda CR-Z Honda FitHonda Insight Hyundai Accent Hyundai Elantra Hyundai Veloster Kia Forte Kia Rio Kia Soul Kia Spectra Mazda MX-5 Miata Mazda2 Mazda3 Mini Cooper Mitsubishi I Mitsubishi Lancer Nissan Cube Nissan SentraNissan VersaPontiac G3 Pontiac G5Pontiac VibeSaturn Astra Scion FR-S Scion iQ Scion tC Scion xB Scion xD
55,360188,045
------
84,158------
195,823339,289
--79,794
--50,43194,720
----
36,532--
68,46510,977
--109,957
54,077--
27,861--
99,79785,182
--25,43946,55111,968
----
40,98045,22027,665
38,516104,724
------
36,098------
160,433259,722
--67,31520,57268,086
103,269--
26,32834,66631,62147,114
7,917--
96,46645,225
--20,11721,47182,70682,906
6,22312,36233,842
6,298----
17,99825,46114,499
48,62397,37624,495
----
45,082----
23,273172,421260,218
5,24954,35420,96251,975
132,246--
68,50024,61967,110
2726,3703,021
106,35345,644
--21,41622,96894,06599,705
14869725----
15,20420,36410,110
28,601856
231,73215,778
--35,049
--19,76968,574
175,717221,235
11,33059,23515,54955,601
186,3619,284
76,29520,111
102,267--
5,67413,952
102,41740,828
8019,87414,459
114,99199,730
----------
24822,43317,017
9,573
6711
237,75881,24712,38510,17625,30343,77256,775
245,922317,909
4,19249,346
5,84661,004
202,03434,86275,68140,275
115,778--
6,30519,315
123,36145,111
58816,426
7,667106,395113,327
--------
11,4178,879
22,66619,78710,756
Vehicle Information
The following chart shows the sales for all vehicles sold in 2012. Car sales in total increased about 18.9% compared with the previous year, while light-truck sales increased 8%. The sales of larger vehicles (cars, CUVs, SUVs) as well as small CUVs and small pickups declined from 2011. Midsize cars and luxury CUVs experienced the most growth in 2012, with 23.5% and 22.5%, respectively.
Source: Ward’s Auto, SEMA

2013 SEMA Annual Market Report
7373
NEW-VEhICLE SALES—CAR
2008 Small Car (cont .) 2009 2010 2011 2012 Smart Fortwo Subaru BRZ Subaru ImprezaSuzuki Forenza Suzuki SX4 Toyota Corolla/MatrixToyota Prius C Toyota Yaris Volkswagen BeetleVolkswagen Golf Volkswagen GTI Volkswagen JettaVolkswagen RabbitTOTAL SMALL CARS
24,622--
49,09820,79629,483
351,007--
102,32826,477
--12,23297,46120,070
2,512,514
14,595--
46,6113,769
20,704296,874
--63,74314,085
1,2117,932
108,4276,470
2,064,991
5,927--
44,39512
11,606266,082
--40,07616,53713,42613,755
123,2131,105
2,078,351
5,208--
41,196--
12,520240,259
--32,704
6,46817,83916,867
177,360--
2,342,554
10,0094,144
81,799--
12,860290,947
35,73330,59029,17424,57116,314
170,424--
2,825,284
Source: Lang Research
Vehicle Information
NEW-VEhICLE SALES—CAR
2008 Middle Car 2009 2010 2011 2012 Acura ILXBuick RegalBuick VeranoChevrolet CamaroChevrolet ImpalaChevrolet MalibuChrysler 200 SeriesChrysler Sebring SedanDodge AvengerDodge ChallengerFord C-MaxFord FusionFord MustangHonda AccordHonda FCX Hyundai Azera Hyundai SonataKia OptimaMazda RX-8 Mazda6Mercury MilanMitsubishi EclipseMitsubishi GalantNissan 350Z Nissan 370Z Nissan Altima
--------
265,840178,253
--71,66361,96317,423
--147,569
91,251372,789
1114,461
117,35744,904
3,36852,59031,39320,10726,94110,337
--269,668
------
61,648165,565161,568
--27,46038,92225,852
--180,671
66,623287,492
53,808
120,02837,527
2,21734,86627,403
6,67211,740
3,8759,242
203,568
--12,326
--81,299
172,078198,770
--38,58550,92336,791
--219,219
73,716282,530
173,051
196,62327,382
1,13435,66228,912
4,28211,492
--10,215
229,263
--40,144
26588,249
171,434204,808
87,0332,380
64,02339,534
--248,067
70,438235,625
21,524
225,96184,590
75935,711
--7,546
15,631--
7,328268,981
12,25124,61641,04284,391
169,351210,951125,476
--96,89043,11913,309
241,26382,995
331,8725
159230,605152,399
8033,756
--1,173
13,261--
7,338302,934
Source: Ward’s Auto, SEMA
Source: Ward’s Auto, SEMA

2013 SEMA Annual Market Report
7474
Vehicle Information
NEW-VEhICLE SALES—CAR
2008 Large Car 2009 2010 2011 2012 Buick LucerneChevrolet Caprice Chrysler 300 SeriesDodge ChargerFord Crown VictoriaFord TaurusKia Amanti Mercury Grand MarquisNissan MaximaToyota AvalonTOTAL LARGE CARS
54,930--
62,35297,36748,55752,667
3,61429,76647,07242,790
462,214
31,292--
38,60660,65133,25545,617
3,70424,78353,35126,935
324,563
26,459--
37,11675,39733,72268,859
28128,54347,94621,305
339,665
20,358880
36,28570,08946,72563,526
8248
----
238,119
9713,734
70,74782,592
4,42974,375
--------
236,848
Source: Lang Research
NEW-VEhICLE SALES—CAR
2008 Middle Car (cont .) 2009 2010 2011 2012 Subaru LegacySuzuki Kizashi Toyota Camry Toyota Prius Volkswagen CC Volkswagen PassatVolvo 30-Series Volvo 40-Series TOTAL MIDDLE CARS
22,614--
436,617158,884
2,10530,034
4,2999,687
2,765,707
30,97471
356,824139,682
23,87211,138
4,2677,957
2,212,714
38,7256,138
327,804140,928
27,98712,497
3,9065,623
2,279,618
42,4016,944
308,510136,463
29,50222,835
3,4712,984
2,455,630
47,1275,566
404,886200,926
21,646117,023
2,82751
3,032,912
NEW-VEhICLE SALES—CAR
2008 Luxury Car 2009 2010 2011 2012 Acura RL Acura TLAcura TSX Audi A3 Audi A4Audi A5 Audi A6Audi A7 Audi A8 Audi R8 Audi TT BMW 1-Series BMW 3-Series BMW 5-Series BMW 6-Series
4,51746,76631,998
4,75943,344
6,28211,956
--2,825
9004,486
12,018112,464
45,9156,533
2,04333,62028,650
3,87437,070
9,8006,786
--1,463
6991,935
11,18290,96040,109
3,549
2,03734,04932,076
6,55834,67216,379
8,675--
1,521799
1,53113,132
100,91039,488
2,418
1,09631,23730,935
6,56135,23415,38511,124
6,2705,7001,1452,2368,832
94,37151,491
3,903
37933,57228,865
7,20535,41517,27018,998
8,5986,002
8022,2267,689
99,60256,798
8,208
Source: Ward’s Auto, SEMA
Source: Ward’s Auto, SEMA
Source: Ward’s Auto, SEMA
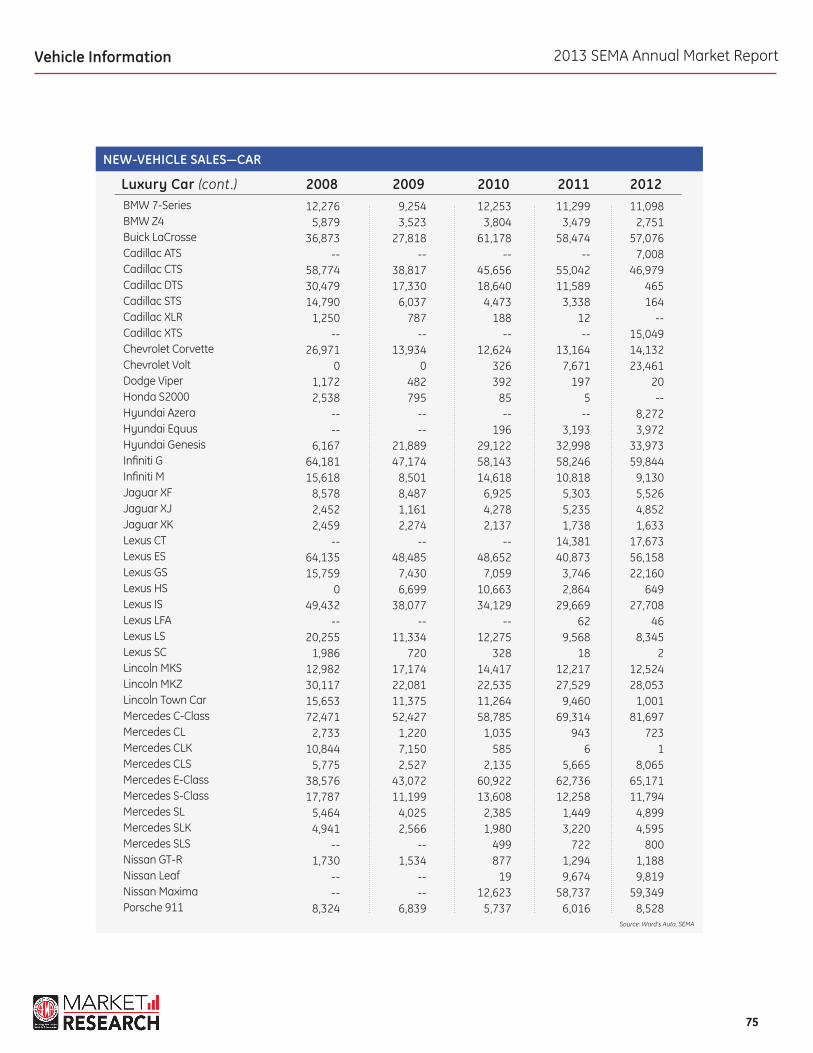
2013 SEMA Annual Market Report
7575
Vehicle Information
Source: Lang Research
NEW-VEhICLE SALES—CAR
2008 Luxury Car (cont .) 2009 2010 2011 2012 BMW 7-Series BMW Z4Buick LaCrosseCadillac ATSCadillac CTSCadillac DTSCadillac STSCadillac XLRCadillac XTSChevrolet CorvetteChevrolet VoltDodge ViperHonda S2000 Hyundai Azera Hyundai Equus Hyundai Genesis Infiniti G Infiniti M Jaguar XF Jaguar XJ Jaguar XK Lexus CT Lexus ES Lexus GS Lexus HS Lexus IS Lexus LFA Lexus LS Lexus SC Lincoln MKSLincoln MKZLincoln Town CarMercedes C-Class Mercedes CL Mercedes CLK Mercedes CLS Mercedes E-Class Mercedes S-Class Mercedes SL Mercedes SLK Mercedes SLS Nissan GT-R Nissan Leaf Nissan MaximaPorsche 911
12,2765,879
36,873--
58,77430,47914,790
1,250--
26,9710
1,1722,538
----
6,16764,18115,618
8,5782,4522,459
--64,13515,759
049,432
--20,255
1,98612,98230,11715,65372,471
2,73310,844
5,77538,57617,787
5,4644,941
--1,730
----
8,324
9,2543,523
27,818--
38,81717,330
6,037787
--13,934
0482795
----
21,88947,174
8,5018,4871,1612,274
--48,485
7,4306,699
38,077--
11,334720
17,17422,08111,37552,427
1,2207,1502,527
43,07211,199
4,0252,566
--1,534
----
6,839
12,2533,804
61,178--
45,65618,640
4,473188
--12,624
326392
85--
19629,12258,14314,618
6,9254,2782,137
--48,652
7,05910,66334,129
--12,275
32814,41722,53511,26458,785
1,035585
2,13560,92213,608
2,3851,980
499877
1912,623
5,737
11,2993,479
58,474--
55,04211,589
3,33812--
13,1647,671
1975--
3,19332,99858,24610,818
5,3035,2351,738
14,38140,873
3,7462,864
29,66962
9,56818
12,21727,529
9,46069,314
9436
5,66562,73612,258
1,4493,220
7221,2949,674
58,7376,016
11,0982,751
57,0767,008
46,979465164
--15,04914,13223,461
20--
8,2723,972
33,97359,844
9,1305,5264,8521,633
17,67356,15822,160
64927,708
468,345
212,52428,053
1,00181,697
7231
8,06565,17111,794
4,8994,595
8001,1889,819
59,3498,528
Source: Ward’s Auto, SEMA

2013 SEMA Annual Market Report
7676
NEW-VEhICLE SALES—CUV
2008 Small Cross/Utility 2009 2010 2011 2012 Chevrolet HHRChrysler PT CruiserHonda ElementHyundai Tucson Jeep CompassJeep PatriotKia Sportage MINI Countryman Mitsubishi Outlander SportNissan Juke Subaru XV Volkswagen Tiguan TOTAL SMALL CUV
96,05349,81626,44719,02725,34955,65432,754
--------
8,664313,764
70,84217,93914,88415,41111,73931,43242,509
--------
13,903218,659
75,4019,440
14,24739,59415,89438,62023,873
--1,6908,639
--20,946
248,344
37,0121,328
11,53447,23247,70954,64747,46316,68316,44335,886
--25,990
341,927
21--3
48,87840,23562,01036,35721,01218,09136,358
7,39631,731
302,092
Vehicle Information
NEW-VEhICLE SALES—CAR
2008 Luxury Car (cont .) 2009 2010 2011 2012 Porsche Boxster Porsche Cayman Porsche Panamera Saab 9-3 Saab 9-5 Toyota AvalonVolkswagen EosVolvo 50-Series Volvo 60-Series Volvo 70-SeriesVolvo 80-Series TOTAL LUxURY CARS
2,9823,513
--15,167
2,538--
12,8371,8568,9668,787
11,0381,028,672
1,9091,9661,2475,4281,034
--7,2042,1555,8956,9868,331
798,622
2,1771,3227,7414,533
8117,0856,6901,7201,4375,2637,224
937,798
1,7731,3776,8793,8471,496
28,9257,533
55521,282
4,9564,735
1,053,100
2,894462
7,614647413
29,5566,214
--23,356
4,4413,277
1,146,856
Source: Ward’s Auto, SEMA
TOTAL CARS 6,769,107 5,400,890 5,635,432 6,089,403 7,241,900
NEW-VEhICLE SALES—CUV
2008 Middle Cross/Utility 2009 2010 2011 2012 Chevrolet CaptivaChevrolet EquinoxDodge JourneyFord EdgeFord EscapeGMC TerrainHonda CrosstourHonda CR-V
--67,44747,097
110,798156,544
----
197,279
--86,14853,82688,548
173,04414,033
2,564191,214
--149,979
48,577118,637191,026
60,51928,851
203,714
7,038193,274
55,155121,702254,293
83,17917,974
218,373
36,935218,621
79,563127,969261,008
97,78620,848
281,652
Source: Lang Research
Source: Ward’s Auto, SEMA
Source: Ward’s Auto, SEMA
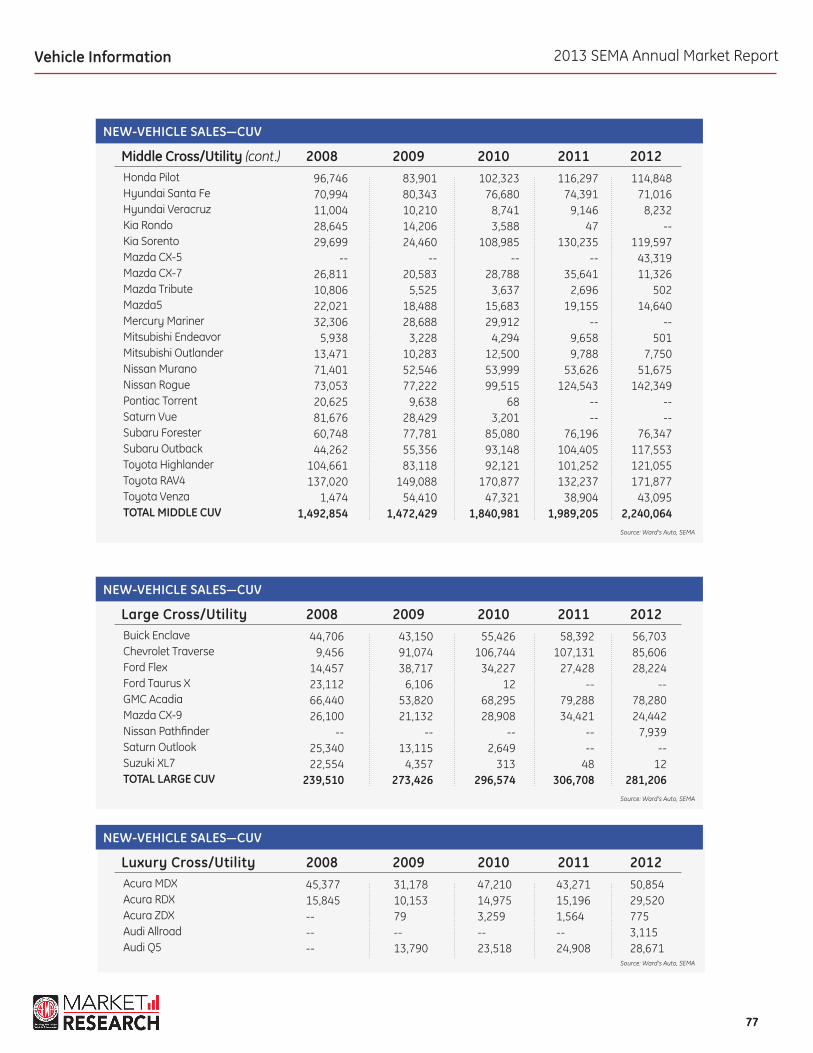
2013 SEMA Annual Market Report
7777
NEW-VEhICLE SALES—CUV
2008 Middle Cross/Utility (cont.) 2009 2010 2011 2012 Honda PilotHyundai Santa FeHyundai Veracruz Kia Rondo Kia SorentoMazda CX-5 Mazda CX-7 Mazda TributeMazda5 Mercury MarinerMitsubishi EndeavorMitsubishi Outlander Nissan Murano Nissan Rogue Pontiac TorrentSaturn VueSubaru Forester Subaru OutbackToyota HighlanderToyota RAV4Toyota VenzaTOTAL MIDDLE CUV
96,74670,99411,00428,64529,699
--26,81110,80622,02132,306
5,93813,47171,40173,05320,62581,67660,74844,262
104,661137,020
1,4741,492,854
83,90180,34310,21014,20624,460
--20,583
5,52518,48828,688
3,22810,28352,54677,222
9,63828,42977,78155,35683,118
149,08854,410
1,472,429
102,32376,680
8,7413,588
108,985--
28,7883,637
15,68329,912
4,29412,50053,99999,515
683,201
85,08093,14892,121
170,87747,321
1,840,981
116,29774,391
9,14647
130,235--
35,6412,696
19,155--
9,6589,788
53,626124,543
----
76,196104,405101,252132,237
38,9041,989,205
114,84871,016
8,232--
119,59743,31911,326
50214,640
--501
7,75051,675
142,349----
76,347117,553121,055171,877
43,0952,240,064
Vehicle Information
NEW-VEhICLE SALES—CUV
2008 Large Cross/Utility 2009 2010 2011 2012 Buick EnclaveChevrolet TraverseFord FlexFord Taurus XGMC AcadiaMazda CX-9 Nissan PathfinderSaturn OutlookSuzuki XL7TOTAL LARGE CUV
44,7069,456
14,45723,11266,44026,100
--25,34022,554
239,510
43,15091,07438,717
6,10653,82021,132
--13,115
4,357273,426
55,426106,744
34,22712
68,29528,908
--2,649
313296,574
58,392107,131
27,428--
79,28834,421
----
48306,708
56,70385,60628,224
--78,28024,442
7,939--
12281,206
NEW-VEhICLE SALES—CUV
2008 Luxury Cross/Utility 2009 2010 2011 2012 Acura MDXAcura RDXAcura ZDXAudi Allroad Audi Q5
45,37715,845------
31,17810,15379--13,790
47,21014,9753,259--23,518
43,27115,1961,564--24,908
50,85429,5207753,11528,671
Source: Ward’s Auto, SEMA
Source: Ward’s Auto, SEMA
Source: Ward’s Auto, SEMA

2013 SEMA Annual Market Report
7878
NEW-VEhICLE SALES—CUV
2008 Luxury Cross/Utility (cont.) 2009 2010 2011 2012 Audi Q7 BMW X1 BMW X3BMW X5BMW X6Cadillac SRXInfiniti EX Infiniti FX Infiniti JXLand Rover Evoque Lexus RXLincoln MKTLincoln MKXMercedes GLMercedes M-ClassMercedes R-ClassPorsche Cayenne Saab 9-4XSubaru TribecaVolkswagen TouaregVolvo XC60 Volvo XC70 Volvo XC90 TOTAL LUxURY CUV
13,209--
17,62231,858
4,54816,15612,87312,660
----
84,181--
29,07623,32834,320
7,733----
10,9756,755
--9,489
18,980388,230
7,299--
6,06727,071
4,78720,237
7,95011,024
----
93,3792,580
21,43336,95625,799
2,825----
5,9304,3929,2625,825
10,757354,381
7,976--
6,07535,776
6,25751,094
8,31210,420
----
95,7907,435
21,93240,88929,698
2,9373,245
--2,4724,713
12,0306,626
10,119449,689
8,998--
27,79340,547
6,19256,905
6,0309,939
--2,244
82,5955,024
23,39549,44935,835
2,38512,978
2672,7917,535
12,9325,716
10,609494,989
11,0088,947
35,17344,445
6,74957,485
3,49510,42421,674
8,90195,381
7,09425,10755,40638,101
1,47315,545
2212,075
10,55319,139
5,5139,513
606,357
Vehicle Information
TOTAL CUV 2,434,358 2,318,895 2,835,588 3,132,829 3,429,719Source: Ward’s Auto, SEMA
NEW-VEhICLES SALES—SUV
2008 Small Sport/Utility 2009 2010 2011 2012 Dodge NitroJeep LibertyJeep WranglerSuzuki Vitara TOTAL SMALL SUV
36,36866,91184,61511,936
229,529
17,44343,50382,044
7,557175,007
22,61849,56494,310
4,478171,753
24,43466,684
122,4604,980
218,558
3,26975,483
141,6694,954
225,375Source: Ward’s Auto, SEMA
NEW-VEhICLES SALES—SUV
2008 Middle Sport/Utility 2009 2010 2011 2012 Chevrolet Trail BlazerDodge DurangoFord ExplorerGMC EnvoyJeep CommanderJeep Grand CherokeeKia Borrego Mercury MountaineerNissan PathfinderNissan XterraToyota 4Runner Toyota FJ Cruiser TOTAL MIDDLE SUV
74,87821,42078,43923,87627,69473,678
1,86910,59633,55533,57947,87828,668
436,587
8,8293,521
52,1904,857
12,65550,32810,530
5,16918,34116,45519,67511,941
211,042
218572
60,68784
8,11584,635
9,8355,791
21,43820,52346,53114,959
272,816
3351,697
135,7045
105127,744
429--
25,93518,22144,31613,541
416,531
--42,589
164,207----
154,734----
34,68217,22248,75513,656
475,845Source: Ward’s Auto, SEMA
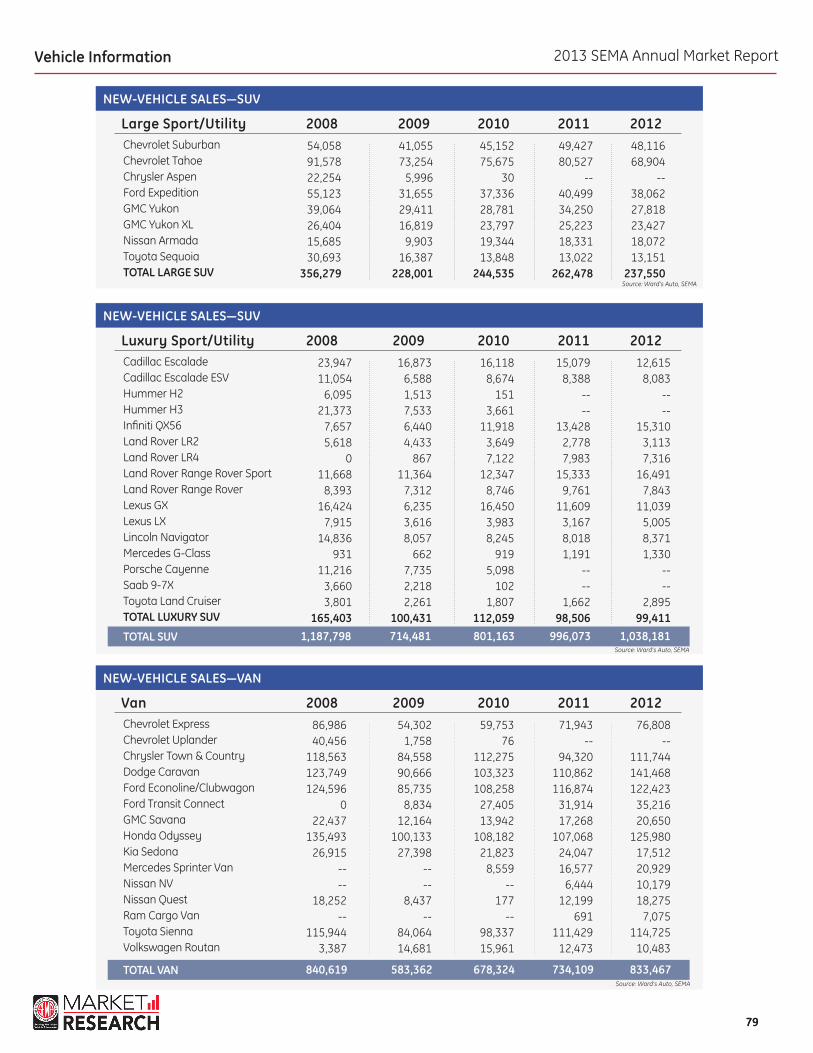
2013 SEMA Annual Market Report
7979
Vehicle Information
NEW-VEhICLE SALES—SUV
2008 Large Sport/Utility 2009 2010 2011 2012 Chevrolet SuburbanChevrolet TahoeChrysler AspenFord ExpeditionGMC YukonGMC Yukon XLNissan ArmadaToyota SequoiaTOTAL LARGE SUV
54,05891,57822,25455,12339,06426,40415,68530,693
356,279
41,05573,254
5,99631,65529,41116,819
9,90316,387
228,001
45,15275,675
3037,33628,78123,79719,34413,848
244,535
49,42780,527
--40,49934,25025,22318,33113,022
262,478
48,11668,904
--38,06227,81823,42718,07213,151
237,550Source: Ward’s Auto, SEMA
NEW-VEhICLE SALES—SUV
2008 Luxury Sport/Utility 2009 2010 2011 2012 Cadillac EscaladeCadillac Escalade ESVHummer H2Hummer H3Infiniti QX56Land Rover LR2 Land Rover LR4 Land Rover Range Rover Sport Land Rover Range Rover Lexus GX Lexus LX Lincoln NavigatorMercedes G-Class Porsche Cayenne Saab 9-7XToyota Land Cruiser TOTAL LUxURY SUV
23,94711,054
6,09521,373
7,6575,618
011,668
8,39316,424
7,91514,836
93111,216
3,6603,801
165,403
16,8736,5881,5137,5336,4404,433
86711,364
7,3126,2353,6168,057
6627,7352,2182,261
100,431
16,1188,674
1513,661
11,9183,6497,122
12,3478,746
16,4503,9838,245
9195,098
1021,807
112,059
15,0798,388
----
13,4282,7787,983
15,3339,761
11,6093,1678,0181,191
----
1,66298,506
12,6158,083
----
15,3103,1137,316
16,4917,843
11,0395,0058,3711,330
----
2,89599,411
TOTAL SUV 1,187,798 714,481 801,163 996,073 1,038,181Source: Ward’s Auto, SEMA
NEW-VEhICLE SALES—VAN
2008 Van 2009 2010 2011 2012 Chevrolet Express Chevrolet UplanderChrysler Town & CountryDodge Caravan Ford Econoline/ClubwagonFord Transit Connect GMC Savana Honda OdysseyKia Sedona Mercedes Sprinter Van Nissan NVNissan Quest Ram Cargo VanToyota SiennaVolkswagen Routan
TOTAL VAN
86,98640,456
118,563123,749124,596
022,437
135,49326,915
----
18,252--
115,9443,387
840,619
54,3021,758
84,55890,66685,735
8,83412,164
100,13327,398
----
8,437--
84,06414,681
583,362
59,75376
112,275103,323108,258
27,40513,942
108,18221,823
8,559--
177--
98,33715,961
678,324
71,943--
94,320110,862116,874
31,91417,268
107,06824,04716,577
6,44412,199
691111,429
12,473
734,109
76,808--
111,744141,468122,423
35,21620,650
125,98017,51220,92910,17918,275
7,075114,725
10,483
833,467Source: Ward’s Auto, SEMA

2013 SEMA Annual Market Report
8080
NEW-VEhICLE SALES—PICkUP
NEW-VEhICLE SALES—PICkUP
2008
2008
Small Pickup
Large Pickup
2009
2009
2010
2010
2011
2011
2012
2012
Chevrolet ColoradoFord RangerGMC CanyonHonda RidgelineMitsubishi RaiderNissan FrontierRam DakotaSuzuki EquatorToyota TacomaTOTAL SMALL PICKUP
Cadillac Escalade EXTChevrolet AvalancheChevrolet SilveradoFord F-SeriesGMC SierraNissan TitanRam PickupToyota TundraTOTAL LARGE PICKUP
TOTAL PICKUP
54,34665,87214,97433,8752,93544,99726,04413144,655392,043
4,70935,003
465,065476,469168,544
34,053240,454137,249
1,566,177
1,958,220
32,41355,60010,10716,4641,94428,41510,6902,221111,824270,348
2,42316,432
316,544392,112111,842
19,042173,066
79,3851,110,993
1,381,341
24,64255,3647,99216,142940,42713,0471,447106,198265,278
2,08220,515
370,135502,125129,794
23,416194,175
93,3091,335,551
1,600,829
31,02670,8329,5909,759--51,70012,1562,127110,705297,895
2,03620,088
415,130552,647149,170
21,994237,236
82,9081,481,209
1,779,104
36,84019,3668,73514,068--55,4354901,966141,365278,265
1,93423,995
418,312607,854157,185
21,576283,056101,621
1,615,533
1,893,798
Vehicle Information
TOTAL LIGhT-TRUCkSTOTAL NEW VEHICLES
6,425,63413,194,741
5,000,79210,401,682
5,919,08511,554,517
6,645,02112,734,424
7,198,16014,440,060
Source: Ward’s Auto, SEMA
Source: Ward’s Auto, SEMA
Source: Ward’s Auto, SEMA
TOTAL CARS 6,769,107 5,400,890 5,635,432 6,089,403 7,241,900
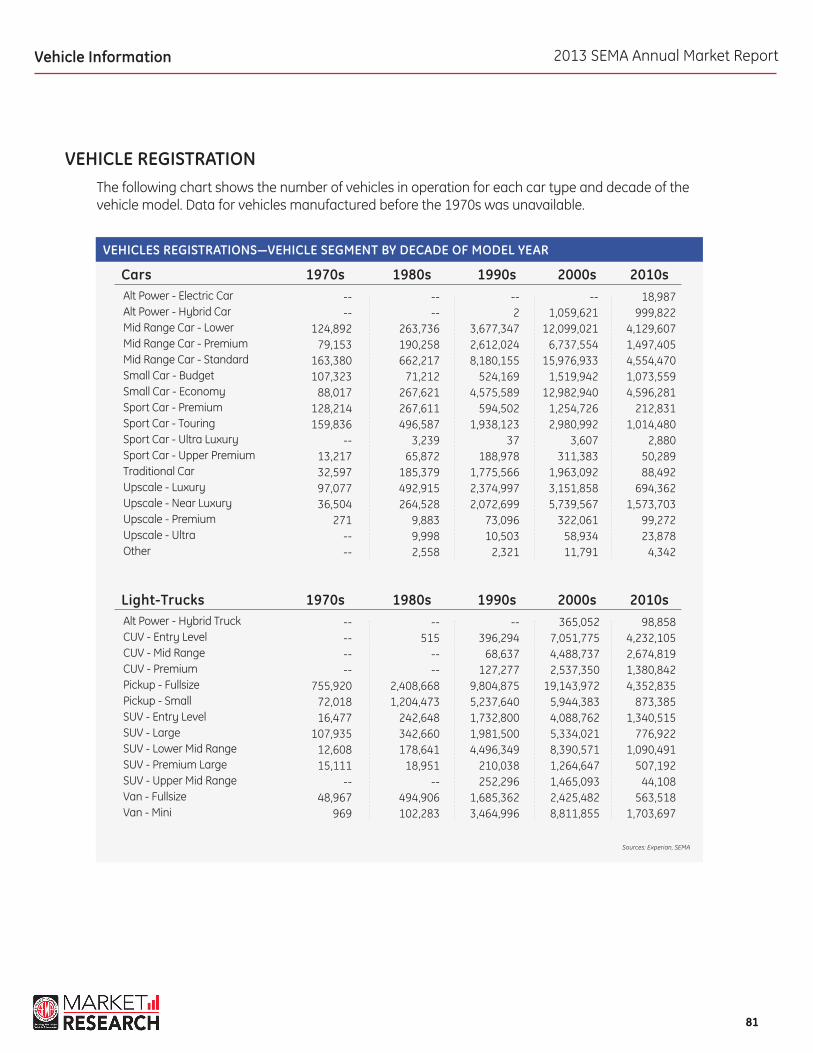
2013 SEMA Annual Market Report
8181
VEhICLES REGISTRATIONS—VEhICLE SEGMENT BY DECADE OF MODEL YEAR
1970s
1970s
Cars
Light-Trucks
1980s
1980s
1990s
1990s
2000s
2000s
2010s
2010s
Alt Power - Electric CarAlt Power - Hybrid CarMid Range Car - LowerMid Range Car - PremiumMid Range Car - StandardSmall Car - BudgetSmall Car - EconomySport Car - PremiumSport Car - TouringSport Car - Ultra LuxurySport Car - Upper PremiumTraditional CarUpscale - LuxuryUpscale - Near LuxuryUpscale - PremiumUpscale - UltraOther
Alt Power - Hybrid TruckCUV - Entry LevelCUV - Mid RangeCUV - PremiumPickup - FullsizePickup - SmallSUV - Entry LevelSUV - LargeSUV - Lower Mid RangeSUV - Premium LargeSUV - Upper Mid RangeVan - FullsizeVan - Mini
----
124,89279,153
163,380107,323
88,017128,214159,836
--13,21732,59797,07736,504
271----
--------
755,92072,01816,477
107,93512,60815,111
--48,967
969
----
263,736190,258662,217
71,212267,621267,611496,587
3,23965,872
185,379492,915264,528
9,8839,9982,558
--515
----
2,408,6681,204,473
242,648342,660178,641
18,951--
494,906102,283
--2
3,677,3472,612,0248,180,155
524,1694,575,589
594,5021,938,123
37188,978
1,775,5662,374,9972,072,699
73,09610,503
2,321
--396,294
68,637127,277
9,804,8755,237,6401,732,8001,981,5004,496,349
210,038252,296
1,685,3623,464,996
--1,059,621
12,099,0216,737,554
15,976,9331,519,942
12,982,9401,254,7262,980,992
3,607311,383
1,963,0923,151,8585,739,567
322,06158,93411,791
365,0527,051,7754,488,7372,537,350
19,143,9725,944,3834,088,7625,334,0218,390,5711,264,6471,465,0932,425,4828,811,855
18,987999,822
4,129,6071,497,4054,554,4701,073,5594,596,281
212,8311,014,480
2,88050,28988,492
694,3621,573,703
99,27223,878
4,342
98,8584,232,1052,674,8191,380,8424,352,835
873,3851,340,515
776,9221,090,491
507,19244,108
563,5181,703,697
Sources: Experian, SEMA
Vehicle Information
The following chart shows the number of vehicles in operation for each car type and decade of the vehicle model. Data for vehicles manufactured before the 1970s was unavailable.
VEHICLE REGISTRATION

2013 SEMA Annual Market Report
8282
SEMA Market Update Regularly published report that tracks industry and economic trends affecting the $31 billion specialty equipment industry. Each update contains current topics that provide SEMA members with new research or information sources to better understand changes in the industry.
Financial Benchmarking Report The monthly SEMA Financial Benchmarking Program allows participants to measure the performance of their company against industry benchmarks in areas such as gross margin, marketing expenses, inventory turns, product returns and more.
SEMA Consumer Demand Index This monthly report measures specialty equipment purchase intentions of consumers [both enthusiast and mainstream] in the coming quarter.
Consumer Research Reports Consumer research reports covering a variety of industry issues are available for download. Examples of consumer research available include vehicle owner reports [i.e. pickups] and enthusiast lifestyle reports.
Visit www.SEMA.org/research for more information on these reports.
SEMA MARKET RESEARCH
SEMA Market Research
As a member benefit, SEMA conducts research on the $31 billion specialty equipment market. SEMA market research projects help members understand sales trends, consumer needs and the influence of economic and auto industry changes. The majority of SEMA Market Research reports are available for download to SEMA members at no charge.
Other research reports available for download: