2013 Data Science Salary Survey
23
Tools, Trends, What Pays (and What Doesn’t) for Data Professionals John King & Roger Magoulas 2013 Data Science Salary Survey
Transcript of 2013 Data Science Salary Survey
Tools, Trends, What Pays (and What Doesn’t) for Data Professionals
John King & Roger Magoulas
2013 Data Science Salary Survey
Take the Strata DataScience Salary andTools SurveyAs data scientists and statisticians—asprofessionals who like nothing better thanpetabytes of rich data—we find ourselves in a strange spot: We know very little about ourselves.
But that’s changing. This salary and tools survey is the second in an annual series. To keep the insights flowing, we need one thing: People like you to take the survey. Anonymous and secure, the survey will continue to provide insight into the demographics, work environments, tools, and compensation of practitioners in our field.
We hope you’ll consider it a civic service. We hope you’ll participate today.
John King and Roger Magoulas
2013 Data ScienceSalary Survey
Tools, Trends, What Pays (and WhatDoesn’t) for Data Professionals
2013 Data Science Salary Surveyby John King and Roger Magoulas
Copyright © 2014 O’Reilly Media. All rights reserved.
Printed in the United States of America.
Published by O’Reilly Media, Inc., 1005 Gravenstein Highway North, Sebastopol, CA95472.
O’Reilly books may be purchased for educational, business, or sales promotional use.Online editions are also available for most titles (http://my.safaribooksonline.com). Formore information, contact our corporate/institutional sales department: 800-998-9938or [email protected].
January 2014: First Edition
Revision History for the First Edition:
2014-01-13: First release
Nutshell Handbook, the Nutshell Handbook logo, and the O’Reilly logo are registeredtrademarks of O’Reilly Media, Inc. 2013 Data Science Survey and related trade dressare trademarks of O’Reilly Media, Inc.
Many of the designations used by manufacturers and sellers to distinguish their prod‐ucts are claimed as trademarks. Where those designations appear in this book, andO’Reilly Media, Inc., was aware of a trademark claim, the designations have beenprinted in caps or initial caps.
While every precaution has been taken in the preparation of this book, the publisherand authors assume no responsibility for errors or omissions, or for damages resultingfrom the use of the information contained herein.
ISBN: 978-1-491-94914-6
[LSI]
The future belongs to the companies
and people that turn data into products
Mike Loukides
What is Data
Science?The future belongs to the companies
and people that turn data into products
What is Data
Science?
The Art of Turning Data Into Product
DJ Patil
DataJujitsu
The Art of Turning Data Into ProductJujitsuA CIO’s handbook to
the changing data landscape
O’Reilly Radar Team
Planning
for Big Data
Table of Contents
2013 Data Science Salary Survey. . . . . . . . . . . . . . . . . . . . . . . . . . . . . . . 1Executive Summary 1Salary Report 3Tool Usage 6Conclusion 16
iii
2013 Data Science Salary Survey
Executive SummaryO’Reilly Media conducted an anonymous salary and tools survey in2012 and 2013 with attendees of the Strata Conference: Making DataWork in Santa Clara, California and Strata + Hadoop World in NewYork. Respondents from 37 US states and 33 countries, representinga variety of industries in the public and private sector, completed thesurvey.
We ran the survey to better understand which tools data analysts anddata scientists use and how those tools correlate with salary. Not allrespondents describe their primary role as data scientist/data analyst,but almost all respondents are exposed to data analytics. Similarly,while just over half the respondents described themselves as technicalleads, almost all reported that some part of their role included tech‐nical duties (i.e., 10–20% of their responsibilities included data anal‐ysis or software development).
We looked at which tools correlate with others (if respondents use one,are they more likely to use another?) and created a network graph ofthe positive correlations. Tools could then be compared with salary,either individually or collectively, based on where they clustered onthe graph.
1
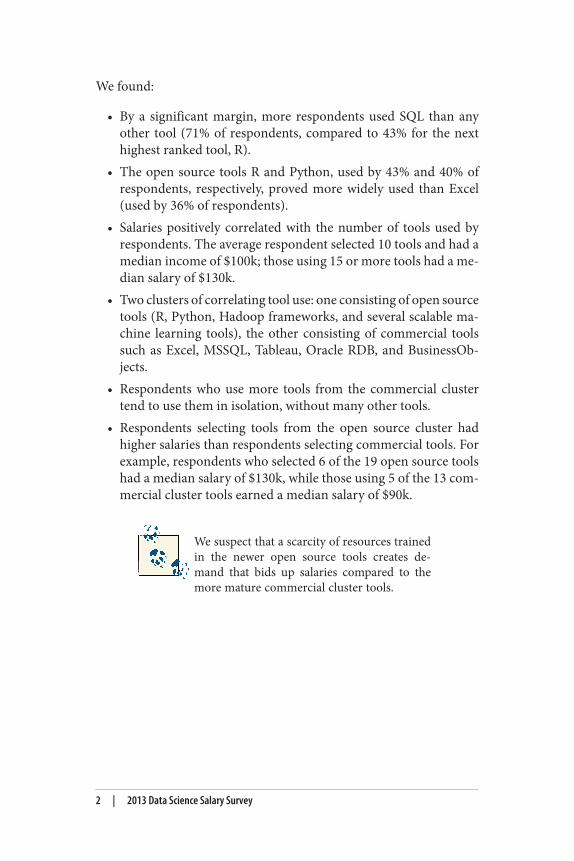
We found:
• By a significant margin, more respondents used SQL than anyother tool (71% of respondents, compared to 43% for the nexthighest ranked tool, R).
• The open source tools R and Python, used by 43% and 40% ofrespondents, respectively, proved more widely used than Excel(used by 36% of respondents).
• Salaries positively correlated with the number of tools used byrespondents. The average respondent selected 10 tools and had amedian income of $100k; those using 15 or more tools had a me‐dian salary of $130k.
• Two clusters of correlating tool use: one consisting of open sourcetools (R, Python, Hadoop frameworks, and several scalable ma‐chine learning tools), the other consisting of commercial toolssuch as Excel, MSSQL, Tableau, Oracle RDB, and BusinessOb‐jects.
• Respondents who use more tools from the commercial clustertend to use them in isolation, without many other tools.
• Respondents selecting tools from the open source cluster hadhigher salaries than respondents selecting commercial tools. Forexample, respondents who selected 6 of the 19 open source toolshad a median salary of $130k, while those using 5 of the 13 com‐mercial cluster tools earned a median salary of $90k.
We suspect that a scarcity of resources trainedin the newer open source tools creates de‐mand that bids up salaries compared to themore mature commercial cluster tools.
2 | 2013 Data Science Salary Survey
Salary ReportBig data can be described as both ordinary and arcane. The basicpremise behind its genesis and utility are as simple as its name: efficientaccess to more—much more—data can transform how we understandand solve major problems for business and government. On the otherhand, the field of big data has ushered in the arrival of new, complextools that relatively few people understand or have even heard of. Butis it worth learning them?
If you have any involvement in data analytics and want to develop yourcareer, the answer is yes. At the last two Strata conferences (New York2012 and Santa Clara 2013), we collected surveys from our attendeesabout, among other things, the tools they use and their salaries. Here’swhat we found:
• Several open source tools used in analytics such as R and Pythonare just as important, or even more so, than traditional data toolssuch as SAS or Excel.
• Some traditional tools such as Excel, SAS, and SQL are used inrelative isolation.
• Using a wider variety of tools—programming languages, visuali‐zation tools, relational database/Hadoop platforms—correlateswith higher salary.
• Using more tools tailored to working with big data, such as MapR,Cassandra, Hive, MongoDB, Apache Hadoop, and Cloudera, alsocorrelates with higher salary.
We should note that Strata attendees comprise a special group and donot form an unbiased sample of everyone who seriously works withdata. These are people deeply involved with or interested in big data,seeking to network with others on the field’s cutting edge and learnabout the new technologies defining it—in short, they are ahead of thecurve. If a trend observed in the sample is not consistent with whatwould be observed in the larger population (of analysts, data scientists,and so on), then this trend could represent the direction big data isheaded. This is likely to be the case for tool usage.
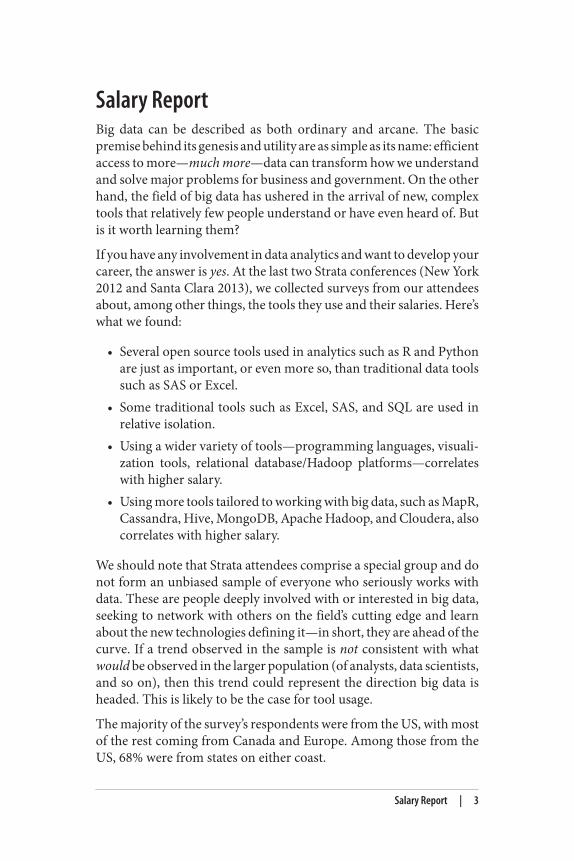
The majority of the survey’s respondents were from the US, with mostof the rest coming from Canada and Europe. Among those from theUS, 68% were from states on either coast.
Salary Report | 3
Our sample represented a wide range of ages, with most respondentsin their thirties and forties. About 40% of respondents were based inthe West, while the rest of the respondents were evenly distributed inthe Northeast, Mid-Atlantic, South, and Midwest regions. California,Maryland, and Washington had the highest median salaries, while re‐spondents in the South and Midwest reported the lowest median sal‐aries.
4 | 2013 Data Science Salary Survey
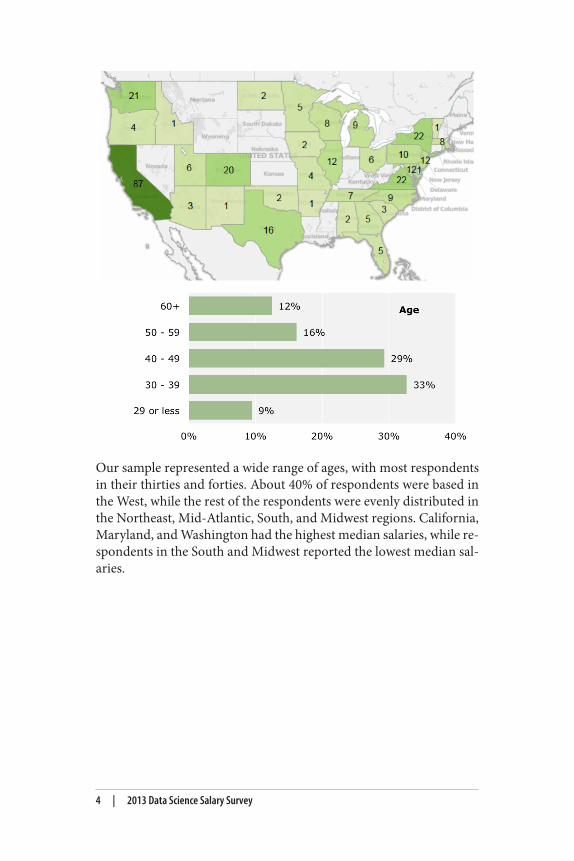
1. 60% of government and education respondents selected the “not applicable” categoryfor company type.
Twenty-three industries were represented (those with at least 10 re‐spondents are shown above) and about one-fifth came from startups.A significant share of respondents, 42%, work in software-orientedsegments: software and application development, IT/solutions/VARs,data and information services, and manufacturing/design (IT/OEM).Government and education represent 14% of respondents.1 About21% of those responding work for startups—with early startups, sur‐prisingly, showing the highest median salary, $130k. Public companieshad a median salary of $110k, private companies $100k and N/A(mostly government and education) at $80k.
Salary Report | 5
2. SQL/Relational Databases and Hadoop are categories of tools: respondents are in‐cluded in their usage counts if they reported using at least one tool from the categories.The SQL/RDB list consists of 18 tools, the Hadoop list consists of 9.
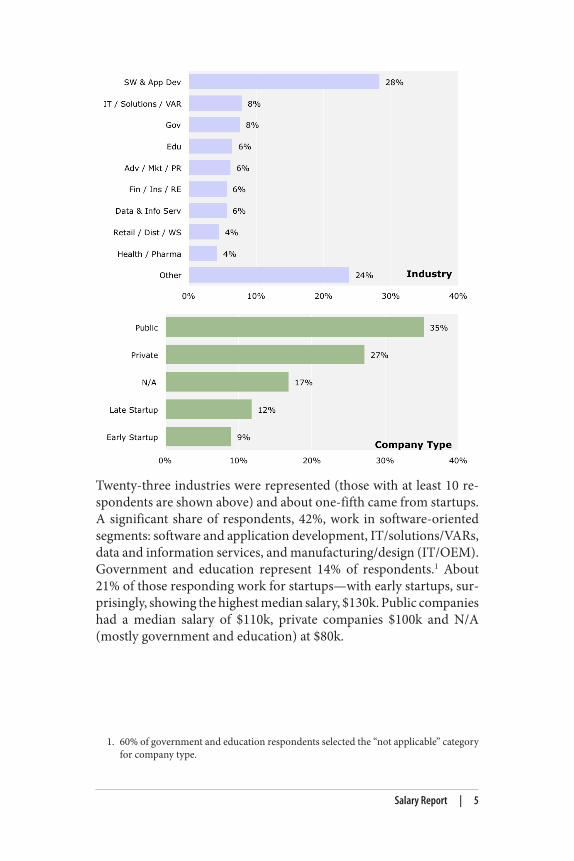
Most respondents (56%) describe themselves as data scientists/analysts. Choosing from four broad position categories—non-managerial, tech lead, manager, and executive—over half of the re‐spondents reported their position as technical lead. The survey askedrespondents to describe what share of their jobs was spent on varioustechnical and analytic roles: 80% of respondents spend at least 40% oftheir time on roles like statistician, software developer, coding analyst,tech lead, and DBA. In other words, this was a very technical crowd—even those who were primarily managers and executives.
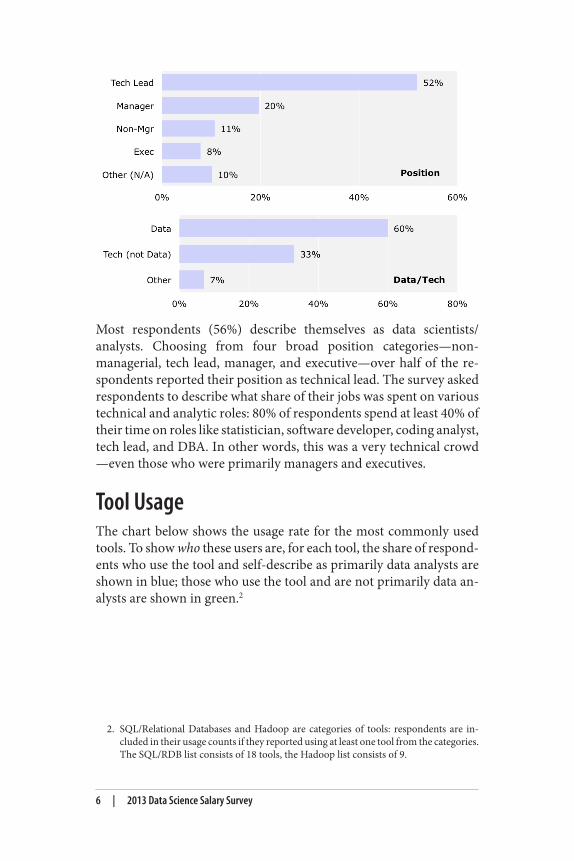
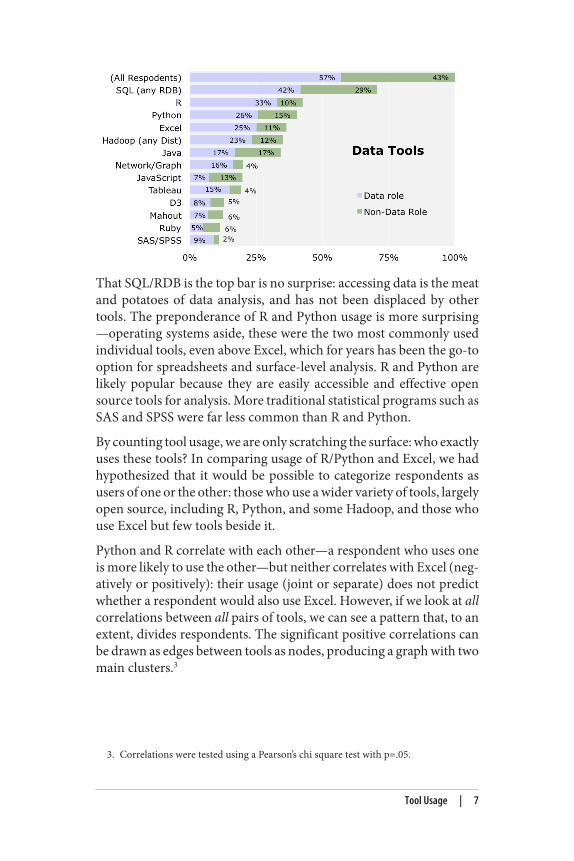
Tool UsageThe chart below shows the usage rate for the most commonly usedtools. To show who these users are, for each tool, the share of respond‐ents who use the tool and self-describe as primarily data analysts areshown in blue; those who use the tool and are not primarily data an‐alysts are shown in green.2
6 | 2013 Data Science Salary Survey
3. Correlations were tested using a Pearson’s chi square test with p=.05.
That SQL/RDB is the top bar is no surprise: accessing data is the meatand potatoes of data analysis, and has not been displaced by othertools. The preponderance of R and Python usage is more surprising—operating systems aside, these were the two most commonly usedindividual tools, even above Excel, which for years has been the go-tooption for spreadsheets and surface-level analysis. R and Python arelikely popular because they are easily accessible and effective opensource tools for analysis. More traditional statistical programs such asSAS and SPSS were far less common than R and Python.
By counting tool usage, we are only scratching the surface: who exactlyuses these tools? In comparing usage of R/Python and Excel, we hadhypothesized that it would be possible to categorize respondents asusers of one or the other: those who use a wider variety of tools, largelyopen source, including R, Python, and some Hadoop, and those whouse Excel but few tools beside it.
Python and R correlate with each other—a respondent who uses oneis more likely to use the other—but neither correlates with Excel (neg‐atively or positively): their usage (joint or separate) does not predictwhether a respondent would also use Excel. However, if we look at allcorrelations between all pairs of tools, we can see a pattern that, to anextent, divides respondents. The significant positive correlations canbe drawn as edges between tools as nodes, producing a graph with twomain clusters.3
Tool Usage | 7
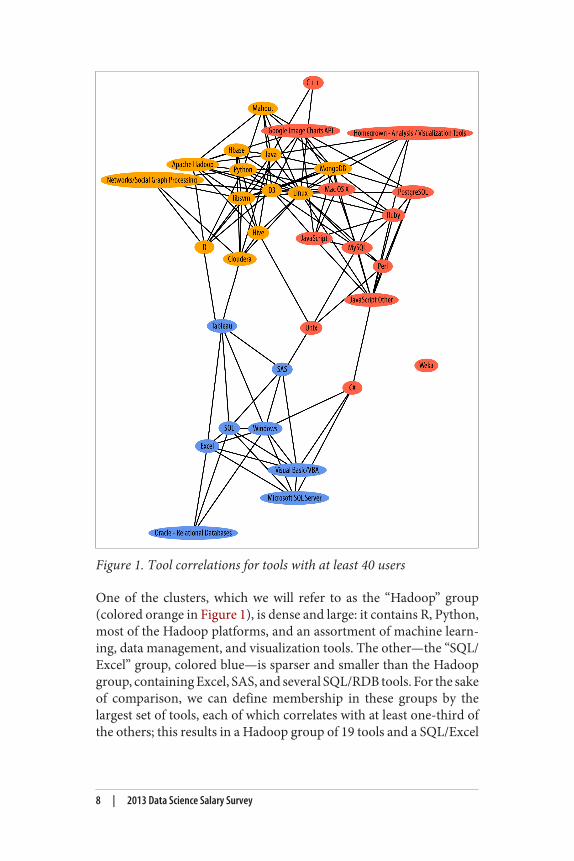
Figure 1. Tool correlations for tools with at least 40 users
One of the clusters, which we will refer to as the “Hadoop” group(colored orange in Figure 1), is dense and large: it contains R, Python,most of the Hadoop platforms, and an assortment of machine learn‐ing, data management, and visualization tools. The other—the “SQL/Excel” group, colored blue—is sparser and smaller than the Hadoopgroup, containing Excel, SAS, and several SQL/RDB tools. For the sakeof comparison, we can define membership in these groups by thelargest set of tools, each of which correlates with at least one-third ofthe others; this results in a Hadoop group of 19 tools and a SQL/Excel
8 | 2013 Data Science Salary Survey
4. This criteria for membership is somewhat arbitrary, especially for the Hadoop cluster—the level of internal connectedness increases gradually from the periphery to thecore. For example, with a stricter (higher) proportion, we would define multiple,smaller, overlapping “Hadoop” clusters that span the previously defined cluster (pro‐portion=.33), and include a number of other tools. The proportion of one third waschosen because the resulting sets are dense enough to be meaningful, they are unique(only one such set exists for each cluster, and these two sets are disjoint), and mosttools with many users are included in at least one of them (e.g., 69% of tools with >50users). Note that the graph shows only tools with at least 40 users, but we are consid‐ering all tools in the tool clusters. Most of the tools left out of the graph would be inred, but about a third of each cluster is not shown.
5. A negative correlation between two tools X and Y means that if a respondent uses X,she is less likely to use Y as well. Of the 3,570 tools pairs, 141 have negative correlations—about 4%. Compare this to 51 negative correlations between the 247 pairs betweenthe two clusters.
group of 13 tools.4 Tools in red are in neither of the two major clusters,but most of these clearly form a periphery of the Hadoop cluster.
The two clusters have no tools in common and are quite distant interms of correlation: only four positive correlations exist between thetwo sets (mostly through Tableau), while there are a whopping 51negative correlations.5 Interestingly, each cluster included a mix ofdata access, visualization, statistical, and machine learning–readytools. The tools in each cluster are listed below.
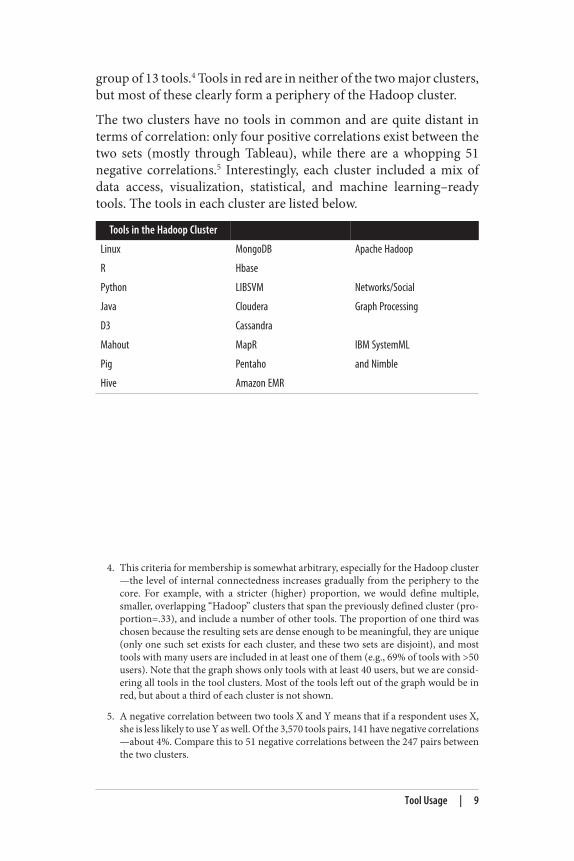
Tools in the Hadoop Cluster
Linux MongoDB Apache Hadoop
R Hbase
Python LIBSVM Networks/Social
Java Cloudera Graph Processing
D3 Cassandra
Mahout MapR IBM SystemML
Pig Pentaho and Nimble
Hive Amazon EMR
Tool Usage | 9

6. The total number of tools used by each respondent roughly followed a normal distri‐bution, with a mean of 10.0 tools and a standard deviation of 3.7.
Tools in the SQL/Excel Cluster
Windows Microsoft SQL Server
Excel Oracle RDB
SQL Visual Basic/VBA
Tableau BusinessObjects
SAS Cognos
IBM DB2 Netezza (IBM)
Teradata
The two clusters show a significant pattern of tool usage tendencies.No respondent reported using all tools in either cluster, but manygravitated toward one or the other—much more than expected if nocorrelation existed. In this way, we can usefully categorize respondentsby counting how many tools from each cluster a respondent used, andthen we can see how these measures interact with other variables.
One pattern that follows logically from the asymmetry of the twoclusters involves the total number of tools a respondent uses.6 Re‐spondents who use more tools in the Hadoop cluster—the larger anddenser of the two—are more likely to use more tools in general (shownin Figure 2).
Figure 2. Tools (from Hadoop cluster)
10 | 2013 Data Science Salary Survey
7. These bins were chosen to have a sufficient number of respondents in each.
8. Both variables are counting tools: each total tool count value contributing to the aver‐age (for the y-value) cannot be less than the in-cluster count (the x-value). A similargraph using a random set of tools would almost always produce a rising pattern, albeitnot as steep as the one shown by the Hadoop cluster.
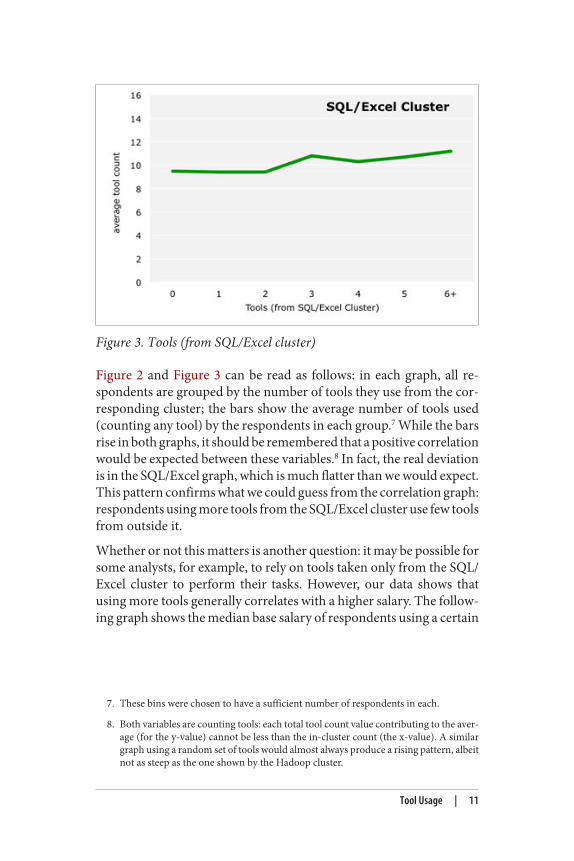
Figure 3. Tools (from SQL/Excel cluster)
Figure 2 and Figure 3 can be read as follows: in each graph, all re‐spondents are grouped by the number of tools they use from the cor‐responding cluster; the bars show the average number of tools used(counting any tool) by the respondents in each group.7 While the barsrise in both graphs, it should be remembered that a positive correlationwould be expected between these variables.8 In fact, the real deviationis in the SQL/Excel graph, which is much flatter than we would expect.This pattern confirms what we could guess from the correlation graph:respondents using more tools from the SQL/Excel cluster use few toolsfrom outside it.
Whether or not this matters is another question: it may be possible forsome analysts, for example, to rely on tools taken only from the SQL/Excel cluster to perform their tasks. However, our data shows thatusing more tools generally correlates with a higher salary. The follow‐ing graph shows the median base salary of respondents using a certain
Tool Usage | 11

9. Salary figures are for US respondents only.
number of tools. Median base salary is constant at $100k for thoseusing up to 10 tools, but increases with new tools after that.9
Given the two patterns we have just examined—the relationships be‐tween cluster tools and respondents’ overall tool counts, and betweentool counts and salary—it should not be surprising that there is a sig‐nificant difference in how each cluster correlates with salary. Usingmore tools from the Hadoop cluster correlates positively with salary,while using more tools from the SQL/Excel cluster correlates (slightly)negatively with salary.
12 | 2013 Data Science Salary Survey
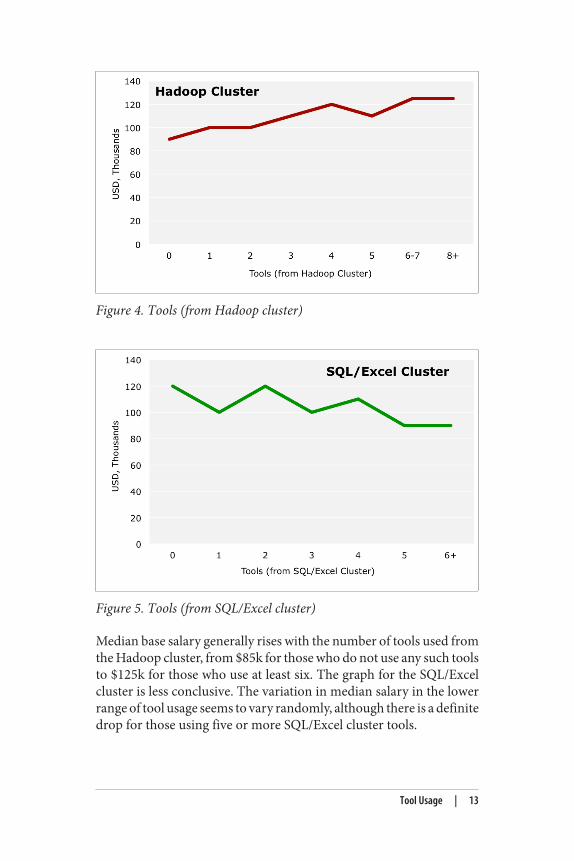
Figure 4. Tools (from Hadoop cluster)
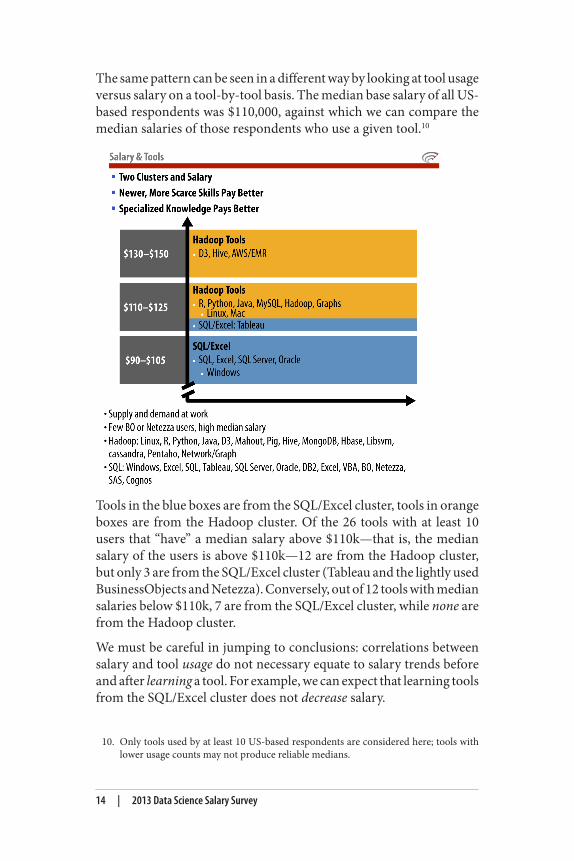
Figure 5. Tools (from SQL/Excel cluster)
Median base salary generally rises with the number of tools used fromthe Hadoop cluster, from $85k for those who do not use any such toolsto $125k for those who use at least six. The graph for the SQL/Excelcluster is less conclusive. The variation in median salary in the lowerrange of tool usage seems to vary randomly, although there is a definitedrop for those using five or more SQL/Excel cluster tools.
Tool Usage | 13
10. Only tools used by at least 10 US-based respondents are considered here; tools withlower usage counts may not produce reliable medians.
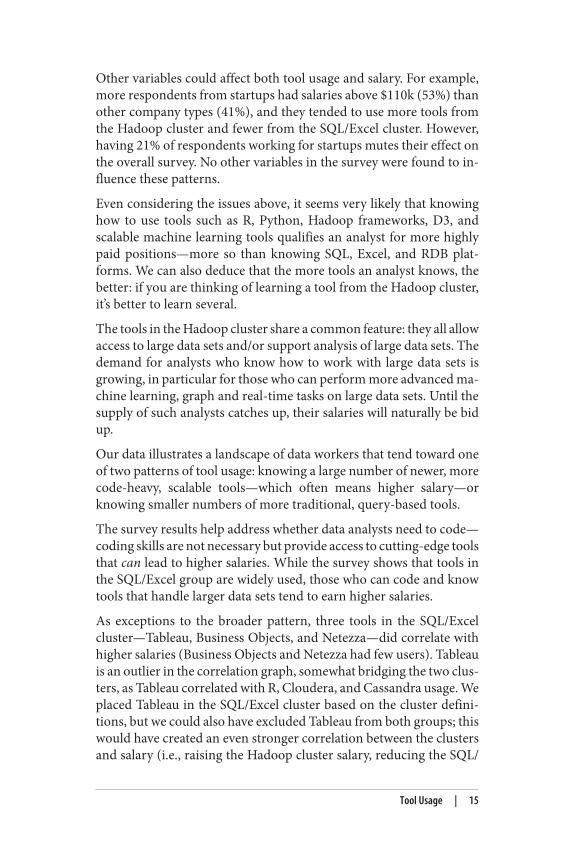
The same pattern can be seen in a different way by looking at tool usageversus salary on a tool-by-tool basis. The median base salary of all US-based respondents was $110,000, against which we can compare themedian salaries of those respondents who use a given tool.10
Tools in the blue boxes are from the SQL/Excel cluster, tools in orangeboxes are from the Hadoop cluster. Of the 26 tools with at least 10users that “have” a median salary above $110k—that is, the mediansalary of the users is above $110k—12 are from the Hadoop cluster,but only 3 are from the SQL/Excel cluster (Tableau and the lightly usedBusinessObjects and Netezza). Conversely, out of 12 tools with mediansalaries below $110k, 7 are from the SQL/Excel cluster, while none arefrom the Hadoop cluster.
We must be careful in jumping to conclusions: correlations betweensalary and tool usage do not necessary equate to salary trends beforeand after learning a tool. For example, we can expect that learning toolsfrom the SQL/Excel cluster does not decrease salary.
14 | 2013 Data Science Salary Survey
Other variables could affect both tool usage and salary. For example,more respondents from startups had salaries above $110k (53%) thanother company types (41%), and they tended to use more tools fromthe Hadoop cluster and fewer from the SQL/Excel cluster. However,having 21% of respondents working for startups mutes their effect onthe overall survey. No other variables in the survey were found to in‐fluence these patterns.
Even considering the issues above, it seems very likely that knowinghow to use tools such as R, Python, Hadoop frameworks, D3, andscalable machine learning tools qualifies an analyst for more highlypaid positions—more so than knowing SQL, Excel, and RDB plat‐forms. We can also deduce that the more tools an analyst knows, thebetter: if you are thinking of learning a tool from the Hadoop cluster,it’s better to learn several.
The tools in the Hadoop cluster share a common feature: they all allowaccess to large data sets and/or support analysis of large data sets. Thedemand for analysts who know how to work with large data sets isgrowing, in particular for those who can perform more advanced ma‐chine learning, graph and real-time tasks on large data sets. Until thesupply of such analysts catches up, their salaries will naturally be bidup.
Our data illustrates a landscape of data workers that tend toward oneof two patterns of tool usage: knowing a large number of newer, morecode-heavy, scalable tools—which often means higher salary—orknowing smaller numbers of more traditional, query-based tools.
The survey results help address whether data analysts need to code—coding skills are not necessary but provide access to cutting-edge toolsthat can lead to higher salaries. While the survey shows that tools inthe SQL/Excel group are widely used, those who can code and knowtools that handle larger data sets tend to earn higher salaries.
As exceptions to the broader pattern, three tools in the SQL/Excelcluster—Tableau, Business Objects, and Netezza—did correlate withhigher salaries (Business Objects and Netezza had few users). Tableauis an outlier in the correlation graph, somewhat bridging the two clus‐ters, as Tableau correlated with R, Cloudera, and Cassandra usage. Weplaced Tableau in the SQL/Excel cluster based on the cluster defini‐tions, but we could also have excluded Tableau from both groups; thiswould have created an even stronger correlation between the clustersand salary (i.e., raising the Hadoop cluster salary, reducing the SQL/
Tool Usage | 15
Excel salary), as Tableau is one of the few SQL/Excel tools that corre‐lates positively with salary.
Open source tools such as R and Python are not popular just becausethey are free—they are powerful and flexible and can make a big dif‐ference in what an analyst can do. Furthermore, their usage has ex‐panded enough that employers are likely to begin assuming theirknowledge when considering job candidates. As for Hadoop, it is nota fad: new technologies that handle Big Data are transformative, andthose who know how to operate them should be among the most in-demand workers of our increasingly data-driven society.
ConclusionWhile the results of this survey clearly indicate certain patterns of toolusage and salary, we should remember some of the limitations of thisdata. Sampled from attendees at two conferences, these results capturea particular category of professionals: those who are heavily involvedin big data or highly motivated to become so, often using the mostadvanced tools that the industry has to offer. This study shows oneperspective of modern data science, but there are others.
We would like to continue this study in several ways. Comparing theseresults with data from job postings, or more in-depth investigationsof individuals’ exact tool usage within their workflow, could expandour findings in interesting ways. More fundamentally, we will continueto ask our Strata attendees about their tool usage at subsequent con‐ferences. Some new tools with only a handful of users among the re‐spondents at last year’s event would be expected to have dozens thistime around. The required tasks of big data change rapidly, requiringongoing attention to how these changes are reflected in the data toollandscape.
16 | 2013 Data Science Salary Survey

About the AuthorsJohn King is a data analyst at O’Reilly Media. Having previouslyworked on survey-based sociolinguistic research in the Republic ofGeorgia, he now runs surveys at O’Reilly, using the results not just forinternal use but also to share his findings with the public.
Roger Magoulas is research director at O’Reilly Media and co-chairof the Strata conferences. Roger and his team build the analytic infra‐structure and provide analysis services, including technology trendanalysis, to business decision makers at O’Reilly and beyond.