2012 Wisconsin Yearly Weather Summary 2012 Wisconsin Yearly Weather Summary Warmest Jan Long Total...
22
1 2012 Wisconsin Yearly Weather Summary Item # 11 was updated. 1. Winter Storms of Jan 12-13, Jan 20-21, Jan 23-24 There were only 3 storms in January of any consequence: a. The system that produced the greatest amount of snow for any system in the state in the 2011- 12 winter was the January 12-13 th storm. It dumped 12 to 34 inches of snow in the counties of Ashland and Iron. In Iron County, Gile picked up 34 inches – mostly lake-effect snow showers. Elsewhere, 5 to 8 inches fell over the east-central and southeast parts of the state. b. The January 20 th system deposited 5 to 6.5 inches over the southwest corner. c. The January 23-24 th system left 5 to 9.5 inches over the north-counties of Vilas, Oneida, Forest and Florence. http://www.crh.noaa.gov/arx/?n=jan1212 http://www.crh.noaa.gov/news/display_cmsstory.php?wfo=arx&storyid=77925&source=2 http://www.crh.noaa.gov/images/dlh/StormSummaries/2012/January%2023,%202012%20Snowfall.jpg http://www.crh.noaa.gov/news/display_cmsstory.php?wfo=dlh&storyid=77623&source=2 http://www.crh.noaa.gov/news/display_cmsstory.php?wfo=mkx&storyid=77471&source=2 http://www.crh.noaa.gov/news/display_cmsstory.php?wfo=mkx&storyid=77927&source=2 2. Leap Year Feb 29 th Winter Storm Northern Wisconsin A strong winter storm produced a large area of heavy, wet snow across parts of northern Wisconsin and Minnesota on February 28-29, 2012. A widespread snowfall of 8 to 16 inches, with locally higher amounts along with frequent wind gusts over 30 mph were reported. Snow fell at two to three inches per hour in the heaviest bands! The wet snow and strong winds caused power outages to as many as 14,000 homes and businesses at the height of the storm. In addition, some roads in northern Wisconsin were nearly impassable for a period of time. The snow developed as low pressure moved from Colorado to Wisconsin. Copious amounts of moisture moved into the region from the Gulf of Mexico. The storm system also produced killer tornadoes and severe thunderstorms from Kansas into Kentucky. http://www.crh.noaa.gov/grb/?n=120229_storm1 http://www.crh.noaa.gov/dlh/?n=2012feb29_heavysnowblizzard http://www.crh.noaa.gov/arx/?n=feb2812 http://www.crh.noaa.gov/news/display_cmsstory.php?wfo=arx&storyid=79610&source=2 http://www.crh.noaa.gov/news/display_cmsstory.php?wfo=mpx&storyid=79889&source=2 Capsule Summary 2011-12 Winter - warm & below normal snowfall Insane warmth in March with early green-up Frosts/Freezes in April wipe out much of Door County cherry crop Warmest Jan-June on record Long-duration, killer heat wave July 1-7 June heavy rain & flood event northwest Only 4 tornadoes – 2 nd lowest yearly number since 1950 Moderate to extreme drought in summer & fall seasons – crop yields down Warmest summer on record some locations Near-record low water levels on Lake Michigan end of October Hurricane Sandy’s gusty winds affected Eastern Wisconsin & Lake Michigan Long stretches of no measurable snow between spring and fall season Warmest year on-record at many locations 15 directly-related weather fatalities (2 indirect) & 351 injured people Total estimated property & crop losses = $33.375 Million+ Temperature extremes: -31F and 106 F
Transcript of 2012 Wisconsin Yearly Weather Summary 2012 Wisconsin Yearly Weather Summary Warmest Jan Long Total...

1
2012 Wisconsin Yearly Weather Summary
Item # 11 was updated.
1. Winter Storms of Jan 12-13, Jan 20-21, Jan 23-24 There were only 3 storms in January of any consequence:
a. The system that produced the greatest amount of snow for any system in the state in the 2011-12 winter was the January 12-13th storm. It dumped 12 to 34 inches of snow in the counties of Ashland and Iron. In Iron County, Gile picked up 34 inches – mostly lake-effect snow showers. Elsewhere, 5 to 8 inches fell over the east-central and southeast parts of the state.
b. The January 20th system deposited 5 to 6.5 inches over the southwest corner. c. The January 23-24th system left 5 to 9.5 inches over the north-counties of Vilas, Oneida, Forest
and Florence. http://www.crh.noaa.gov/arx/?n=jan1212 http://www.crh.noaa.gov/news/display_cmsstory.php?wfo=arx&storyid=77925&source=2 http://www.crh.noaa.gov/images/dlh/StormSummaries/2012/January%2023,%202012%20Snowfall.jpg http://www.crh.noaa.gov/news/display_cmsstory.php?wfo=dlh&storyid=77623&source=2 http://www.crh.noaa.gov/news/display_cmsstory.php?wfo=mkx&storyid=77471&source=2 http://www.crh.noaa.gov/news/display_cmsstory.php?wfo=mkx&storyid=77927&source=2
2. Leap Year Feb 29th Winter Storm Northern Wisconsin
A strong winter storm produced a large area of heavy, wet snow across parts of northern Wisconsin and Minnesota on February 28-29, 2012. A widespread snowfall of 8 to 16 inches, with locally higher amounts along with frequent wind gusts over 30 mph were reported. Snow fell at two to three inches per hour in the heaviest bands! The wet snow and strong winds caused power outages to as many as 14,000 homes and businesses at the height of the storm. In addition, some roads in northern Wisconsin were nearly impassable for a period of time. The snow developed as low pressure moved from Colorado to Wisconsin. Copious amounts of moisture moved into the region from the Gulf of Mexico. The storm system also produced killer tornadoes and severe thunderstorms from Kansas into Kentucky. http://www.crh.noaa.gov/grb/?n=120229_storm1 http://www.crh.noaa.gov/dlh/?n=2012feb29_heavysnowblizzard http://www.crh.noaa.gov/arx/?n=feb2812 http://www.crh.noaa.gov/news/display_cmsstory.php?wfo=arx&storyid=79610&source=2 http://www.crh.noaa.gov/news/display_cmsstory.php?wfo=mpx&storyid=79889&source=2
Capsule Summary 2011-12 Winter - warm & below normal snowfall
Insane warmth in March with early green-up Frosts/Freezes in April wipe out much of Door County cherry crop
Warmest Jan-June on record Long-duration, killer heat wave July 1-7 June heavy rain & flood event northwest
Only 4 tornadoes – 2nd lowest yearly number since 1950 Moderate to extreme drought in summer & fall seasons – crop yields down
Warmest summer on record some locations Near-record low water levels on Lake Michigan end of October
Hurricane Sandy’s gusty winds affected Eastern Wisconsin & Lake Michigan Long stretches of no measurable snow between spring and fall season
Warmest year on-record at many locations 15 directly-related weather fatalities (2 indirect) & 351 injured people
Total estimated property & crop losses = $33.375 Million+ Temperature extremes: -31F and 106 F

2
3. Summary of 2011-12 Snow Season Snowfall across Wisconsin during the 2011-12 winter season was below normal and ranged from 11 inches at Newton 1S in Manitowoc County to 106.2 inches at Upson in Iron County. Except for the far northern counties most locations received 15 to 30 inches. To view a detailed snowfall map, use this URL: http://www.crh.noaa.gov/images/mkx/pcpn/2012/1112snow.gif http://www.crh.noaa.gov/images/mkx/climate/avg_30_year_snowfall.png
4. Coldest Temperature in 2012 The lowest temperature this calendar year was -31 degrees F at Upson in Iron County on January 20th. Data courtesy of Wisconsin State Climatology Office. http://www.aos.wisc.edu/~sco/
5. Record Warmth in March March, 2012, was the warmest March on record for the U.S. Wisconsin shared in the warmth as temperatures rose 15 to 30 degrees above normal on most of the days between the 6th and 28th. Maximum temperatures during the month peaked in the lower to mid-80s on the 20th and 21st across the southern two-thirds of the state. Snowfall was well below normal, and there was no snow in southern Wisconsin after March 8th. Trees, flowers, shrubs, bushes and fruit orchards bloomed early which set the stage for frost-freeze damage later in April. Overall, the average monthly temperatures were 13 to 16 degrees above normal. The average monthly temperature for all of Wisconsin was 45.3, which shattered the old record of 40.7 set back in 1910. The image shows the temperature departure from normal for the period of March 14-24th; note how Wisconsin has a core of the greatest temperature departures. http://mrcc.isws.illinois.edu/news/releases/2012/20120326_EarlyWarmth2012.pdf http://www.ncdc.noaa.gov/sotc/national/2012/3/supplemental
6. Growing Season Starts in March & Then Killing Frost/Freeze in April
The warm start to spring, with numerous record March temperatures set across Wisconsin, prompted plants to “green-up” earlier than usual. As the normal spring freezes occurred in April, crops that came out of dormancy much earlier than usual sustained damage. Cherry crops in particular were hit hard. In Door County, it was estimated that the tart cherry harvest was only 7 to 10 percent of 2011. Map of last freeze of spring in Midwest: http://mcc.sws.uiuc.edu/cliwatch/GIS_plots/frz_spring/freeze_32_stn_Central.png Map of median date of last freeze: http://mcc.sws.uiuc.edu/cliwatch/GIS_plots/frz_spring/frzmed_32_shd_Central.png
7. May 2-3 West-central Wisconsin Severe Weather A stalled frontal system produced several rounds of severe weather in early May, especially during the evening hours of May 2nd and again on May 3rd. Storms moved in from southeast Minnesota on May 2nd and produced quarter-size hail and damaging winds of 60 to 75 mph into parts of western Wisconsin before weakening. The storms were strongest as they moved through Trempealeau County producing a swath of wind damage in communities like Arcadia, Whitehall and Blair. Damage was worst in Blair which included roof damage to homes and the school, along with numerous trees down in town. Hail was over an inch in diameter at times. Additionally, collectively about 31 acres of alfalfa and corn were damaged. Estimated property and crop losses were about $3.7 Million.

3
Another round of storms during the afternoon of May 3rd produced mainly large hail over parts of southern Wisconsin. Hail reached golf ball size at times.
8. May 3rd Heavy Rains and Flooding Event in Winnebago/Calumet Counties Thunderstorms with very heavy rain developed along a slow moving front over central Wisconsin during the early morning hours of May 3, 2012. Several storms moved along the same general area, producing copious amounts of rainfall. Over four inches of rain fell across Winnebago County, with nearly that much in Calumet County. Two to four inches fell in nearby Manitowoc County. The heavy rain resulted in flash flooding and urban flooding early in the morning of May 3. At the official observation site in Oshkosh, 3.75" of rain fell, beginning late on May 2. A new daily all-time May record was set in Oshkosh, as 3.07" of that total fell on May 3rd alone (records kept since 1893). Winnebago County emergency management reported 5.25" a couple miles west of Oshkosh!
http://www.crh.noaa.gov/grb/?n=120503_rain
9. May 24th Severe Storms Episode over West-central &Central Wisconsin
A powerful cold front moved across the region resulting in widespread wind damage. Wind damage was reported over many counties - numerous large trees were either up-rooted or snapped off, some buildings, barns, vehicles and power-lines/poles were damaged and a 200’ tower was knocked over. Wind gusts reached 60 to 85 mph. Only one tornado (EF0) was reported in Marathon County near Rib Mountain in Marathon County and it damaged only some trees. Locations of damage reports are shown in the image. http://www.crh.noaa.gov/images/mpx/NewsStory_May24.pdf
10. June 18-20 Early-Season Killer Heat in Milwaukee Area
A hot, humid air-mass settled over southern Wisconsin in mid-June which resulted in two directly-related heat deaths in the city of Milwaukee. Although the heat index reached only 95 to 96 on June 18th through the 20th, it was the long duration and “early in the season” factors that led to the fatalities. Additionally, nighttime heat indices dropped to only 75 to 79. The actual air temperatures in Milwaukee maxed out at 93 to 94 during the day and dropped to only 72 to 77 at night.
11. July 1-7 Killer Heat Wave
The July 1-7, 2012 heat wave was arguably one of the Top-3 worst heat waves to affect Wisconsin in recorded weather history in terms of maximum temperatures and duration. One has to go back to the July 12-14, 1995 heat wave to find a comparable heat wave. Due to mitigation efforts since the 1995 heat wave, only 24 fatalities were attributed to the 2012 heat wave – 18 direct and 6 indirect. The 1995 heat wave resulted in 154 heat-related fatalities. Additionally, the 2012 heat wave forced an estimated 350 people to seek medical treatment.
Wildlife specialists reported some fish and bird die-offs as water temperatures of inland lakes and rivers soared. Many ponds and marshes dried up. Buckled road pavements were noted and many cities/villages enacted burning and fireworks restrictions. The peak of the heat wave was during the period of July 4-6th when maximum temperatures reached 105 to 106 at scattered locations in the southern half of the state. Heat index values peaked at 110 to

4
115. Many new daily record high temperatures and record high minimum temperatures were set - in excess of 3000. Some details are provided in the links below.
http://www.crh.noaa.gov/news/display_cmsstory.php?wfo=mkx&storyid=85227&source=2 http://www.crh.noaa.gov/news/display_cmsstory.php?wfo=mkx&storyid=84930&source=2 http://www.crh.noaa.gov/news/display_cmsstory.php?wfo=mkx&storyid=85075&source=2 http://www.crh.noaa.gov/news/display_cmsstory.php?wfo=mkx&storyid=85625&source=2 http://www.crh.noaa.gov/news/display_cmsstory.php?wfo=mkx&storyid=86229&source=2 http://www.crh.noaa.gov/arx/?n=jul0412 http://www.nws.noaa.gov/om/assessments/pdfs/heat95.pdf Ultimately, July 2012 was the warmest July for the continental U.S., blasting the Dust Bowl July of 1936. For Wisconsin July 2012 was tied for the 4th warmest on record. http://www.ncdc.noaa.gov/sotc/national/2012/7/supplemental/page-2/
12. Summer-Fall Drought
A cruel drought affected nearly all of Wisconsin during the 2012 summer and fall season, resulting in reduced crop yields and forced sell-off of some dairy and cattle herds. Alfalfa hay crops also suffered and the reduced and costly feed amounts were a factor in the sell-offs. There were many reports of water wells drying up and some people had to drill their wells deeper in order to find water. The drought was generated by a large, warm blocking high pressure in the upper-levels of the atmosphere which was centered over the nation’s mid-section in May and June. Part of this high pressure expanded north into the western Great Lakes region in July, forcing the storms to stay mostly north of Wisconsin as the summer progressed. This drought started across the southern third tier of counties in June and steadily expanded north during July and August. Eventually by the end of July and early August much of the southern two-thirds of the state was in a severe (D2) to extreme (D3) drought status. Droughts are rated with D0 to D4 designations. The drought continued into December thanks to a very dry November. Maximum areal coverage in the state for the drought categories peaked at different times in 2012: D3 coverage – 19.69% on Jul 24th D2-D3 coverage – 51.29% on Oct 9th D1-D2-D3 coverage - 87.24% on Oct 9th D0-D1-D2-D3 coverage - 100 % Sep 11th through Sep 18th To the right is a graphic of the July 2nd peak of 19.69% of Wisconsin in extreme (D3) drought status. D0 (abnormally dry) is yellow, D1 (moderate) is tan, D2 (severe) is orange, and D3 (extreme) is red. Little change occurred in September since rainfall remained below normal in that month. During the late summer and fall season, parts of the southern third of Wisconsin were 6 to 10 inches below normal for the yearly precipitation amounts. Soaking rains of 1 to 5 inches across the southern two-thirds of the state during the period of October 12-14th finally put a dent into the drought. Additional rains in November kept the improving trend going over much of the state. However, by the end of November, parts of the southern tier of counties and the west-central counties still remained in a severe drought status (D2).

5
June 2012 was the driest June on record in Madison, and in Milwaukee it was the 6th driest. Below is a table of monthly rainfall amounts at selected cities along with departures from normal for the months of June through September, 2012. Note how monthly rainfall amounts across northern Wisconsin drop off as one goes from late summer into the fall season.
City Jun Rain Jun Dept Jul Rain Jul Dept Aug Rain Aug Dept Sep Rain Sep Dept
Milwaukee 0.90 -3.00 3.56 -0.11 2.75 -1.22 2.31 -0.87
Madison 0.31 -4.23 4.00 -0.18 1.58 -2.69 1.33 -1.80
Green Bay 1.71 -2.17 6.01 +2.51 3.66 +0.29 1.09 -1.95
La Crosse 3.24 -1.10 2.04 -2.22 2.17 -2.12 1.14 -2.42
Eau Claire 3.73 -0.40 1.60 -2.28 2.06 -2.41 1.01 -2.67
Wausau 3.94 -0.37 2.93 -0.90 2.71 -1.45 1.61 -2.29
Rhinelander 3.74 -0.15 5.97 +1/95 1.49 -1.80 1.65 -2.05
Duluth 10.03 +5.80 3.09 -0.76 1.42 -2.28 0.84 -3.27
Minneapolis 3.59 -0.66 4.90 +0.86 1.38 -2.92 0.30 -2.78
Dubuque 1.42 -2.98 0.46 -3.85 4.01 -0.39 1.17 -2.29
http://www.crh.noaa.gov/news/display_cmsstory.php?wfo=mkx&storyid=84023&source=2 http://www.crh.noaa.gov/news/display_cmsstory.php?wfo=mkx&storyid=85625&source=2 http://nidis1.ncdc.noaa.gov/portal/server.pt/community/drought_gov/202 http://www.crh.noaa.gov/arx/?n=drought
13. June 19-20 Northwest Wisconsin Heavy Rain & Flood Event From June 17 to 20, the Arrowhead of Minnesota and northwest Wisconsin were inundated with 8-10 inches of rain. In Duluth, 7.24” of rain fell the 19th & 20th, the wettest two-day period on record. Massive flooding swept through the region. A preliminary round of cold-front-induced thunderstorms moved through the area on the 17th leaving ½ to ¾ inch of rain. This rain saturated the soils and primed the area for runoff in the extreme rain event of the 19th & 20th. On Tuesday, June 19th another front slowly approached northeastern Minnesota. This front continuously formed thunderstorms that developed over east central Minnesota and tracked northeast into the Duluth area, the north shore of Lake Superior and into northwestern Wisconsin. The official rainfall in Duluth on the 19th was 4.14 inches and on the 20th it was 3.10”. Superior received 8.15 inches of rain. The governor declared a state of emergency in Douglas, Bayfield and Ashland counties, mainly due to widespread road damage.
http://www.crh.noaa.gov/dlh/?n=june2012_duluth_flood
6
14. July 18th Southern Wisconsin Severe Weather A cluster of storms that originated along the Minnesota-Iowa border west of the state, moved across southern Wisconsin during mainly the afternoon of July 18th. Although there were some reports of large hail, damaging wind gusts were the main threat with numerous reports in the 60 to 80 mph range. Biggest impact was experienced in counties like Crawford, Sauk, and Dane with lots of tree damage. A wind gust of 71 mph in Mt. Horeb (Dane Co.) led to a minor injury when a tree fell on a person. One of the benefits from the storms was the much needed rain that mainly hit the southern parts of the state. Many areas observed rain of 1 to 2 inches which helped during the drought conditions.
http://www.crh.noaa.gov/news/display_cmsstory.php?wfo=arx&storyid=85516&source=2
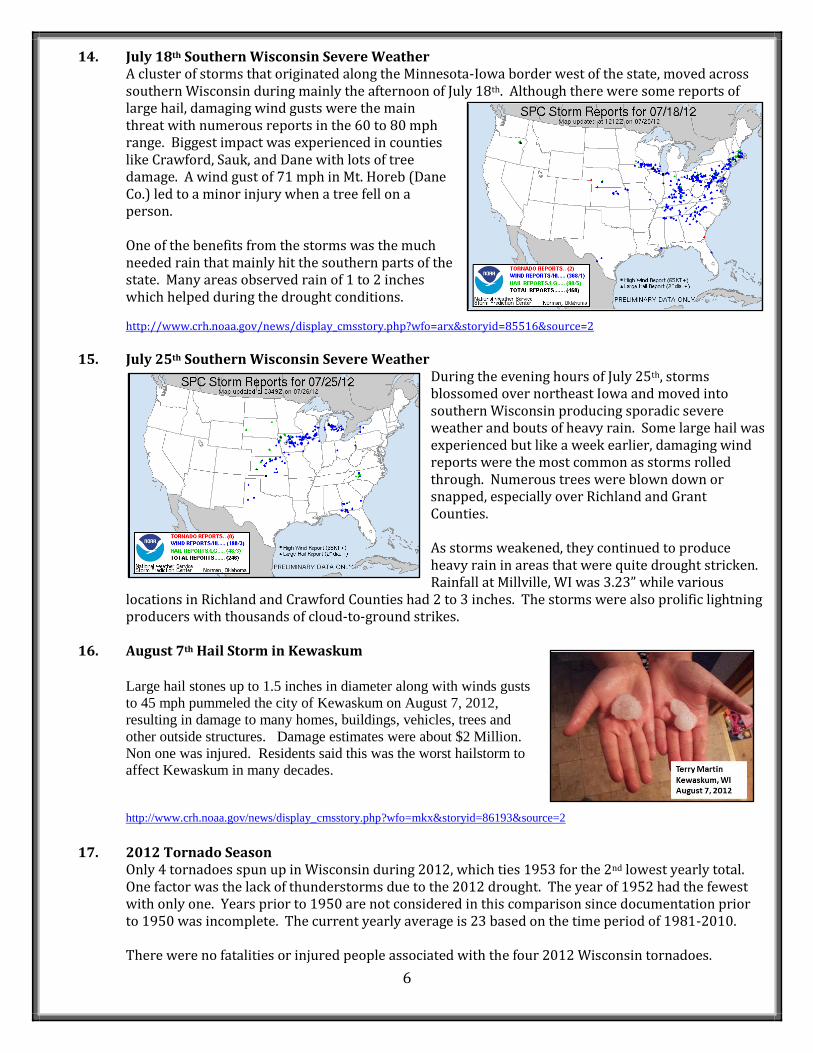
15. July 25th Southern Wisconsin Severe Weather
During the evening hours of July 25th, storms blossomed over northeast Iowa and moved into southern Wisconsin producing sporadic severe weather and bouts of heavy rain. Some large hail was experienced but like a week earlier, damaging wind reports were the most common as storms rolled through. Numerous trees were blown down or snapped, especially over Richland and Grant Counties.
As storms weakened, they continued to produce heavy rain in areas that were quite drought stricken. Rainfall at Millville, WI was 3.23” while various
locations in Richland and Crawford Counties had 2 to 3 inches. The storms were also prolific lightning producers with thousands of cloud-to-ground strikes.
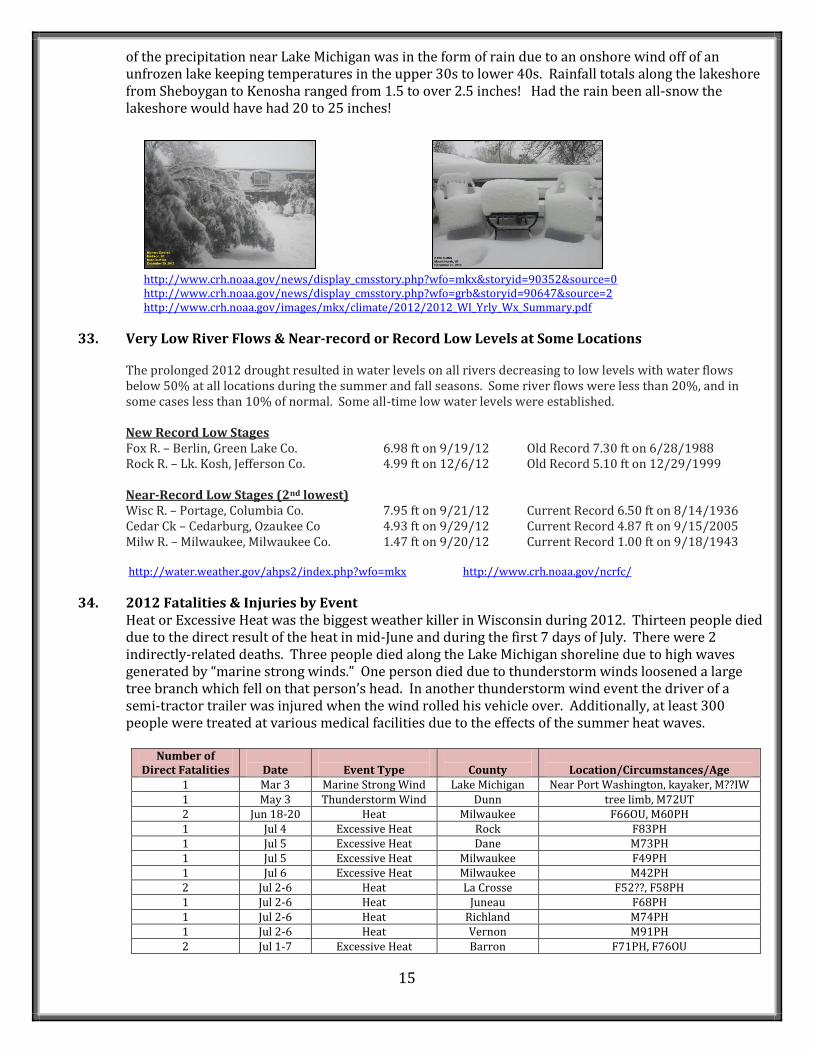
16. August 7th Hail Storm in Kewaskum
Large hail stones up to 1.5 inches in diameter along with winds gusts
to 45 mph pummeled the city of Kewaskum on August 7, 2012,
resulting in damage to many homes, buildings, vehicles, trees and
other outside structures. Damage estimates were about $2 Million.
Non one was injured. Residents said this was the worst hailstorm to
affect Kewaskum in many decades.
http://www.crh.noaa.gov/news/display_cmsstory.php?wfo=mkx&storyid=86193&source=2
17. 2012 Tornado Season Only 4 tornadoes spun up in Wisconsin during 2012, which ties 1953 for the 2nd lowest yearly total. One factor was the lack of thunderstorms due to the 2012 drought. The year of 1952 had the fewest with only one. Years prior to 1950 are not considered in this comparison since documentation prior to 1950 was incomplete. The current yearly average is 23 based on the time period of 1981-2010. There were no fatalities or injured people associated with the four 2012 Wisconsin tornadoes.

7
The first three tornadoes were minimal in strength and rated as EF0 with winds perhaps to 65 mph. The Marathon County tornado damaged only trees. The Polk County tornado spun up in a marsh. The Douglas County tornado started as a waterspout over Lake Superior and then moved on to Baker Island but didn’t damage anything. The Grant County tornado briefly intensified to EF2 strength with estimated winds of 115 to 120 mph. This tornado affected only one property and damaged a house, barn, some outbuildings and several trees. http://www.spc.noaa.gov/climo/online/
# County Date Time Dir Location Mag PL PW
1 Marathon 05/24/12 7:01 PM NE 3.7 SSE Marathon City EF0 5.94 miles 75 yds
7:07 PM 4.8 ENE Marathon City
2 Polk 05/27/12 8:13 PM NE 1.8 NNE Luck EF0 0.19 25
8:15 PM 2.0 NE Luck
3 Douglas 08/09/12 11:19 AM SW 2.4 E Superior EF0 0.05 20
11:19 AM
4 Grant 9/4/12 7:37 PM SE 1.9 SW Patch Grove EF2 0.72 75
7:43 PM 2.0 SSW Patch Grove

8
18. Near-Record Low Lake Michigan Water Level The 2012 drought obviously didn’t help water levels on Lake Michigan. At the end of October it was near record low mean water levels according to the U.S. Army Corps of Engineers. Their information
indicated the water level to be 576.57 feet, or 0.13 feet (about 1.56 inches) above the record low October
monthly mean level of 576.44 feet set 1964.
The end of October monthly mean level was 28 inches below the long-term average (1918-2011) of 578.87
feet for the month of October. It is also a little over one foot (1.12 feet) below the monthly mean of October
2011 of 577.69 feet. The forecast mean water level is expected to remain near-record lows for November 2012 through April 2013 per U.S. Army Corps of Engineers projections. http://www.crh.noaa.gov/news/display_cmsstory.php?wfo=mkx&storyid=89401&source=2
19. Highest Temperature in Wisconsin for 2012
The highest temperature was 106 degrees F at Milwaukee/Sullivan Weather Forecast Office in Jefferson County on July 5th and at Paddock Lake in Kenosha County on July 7th. Data courtesy of Wisconsin State Climatology Office. http://www.aos.wisc.edu/~sco/
20. 2012 Summer Was Warmest on Record Over Parts of Wisconsin
Due to the major July 1-7th heat wave and several other hot periods during the months of June, July and August, the 2012 summer was the warmest on record in Milwaukee and the 3rd warmest in Madison. For the 2012 year, Milwaukee ended up with a maximum temperature 90F or higher 20 times (4th highest total on record), while this happened 39 times in Madison (highest total on record) and 44 at the NWS Milwaukee Forecast Office near Sullivan. http://www.crh.noaa.gov/news/display_cmsstory.php?wfo=mkx&storyid=85625&source=2 http://www.crh.noaa.gov/news/display_cmsstory.php?wfo=mkx&storyid=87177&source=2 http://www.crh.noaa.gov/news/display_cmsstory.php?wfo=grb&storyid=80903&source=2
21. Sep 4-5th Severe Weather Southern Wisconsin A weakening low pressure trough pushed through the region and triggered thunderstorms with large hail and damaging winds and even one strong tornado. The strong EF2 tornado occurred in Grant County.
The thunderstorms moved across south-central and southeast Wisconsin between 7 pm and 11 pm CDT. The large hail threat diminished as the thunderstorm s coalesced into mostly a single line that "bowed out" as it moved east.
Scattered damaging wind events were the most common type of severe weather over southern Wisconsin, with wind gusts in the 60 to 75 mph range. Large trees were pushed over or uprooted and downed power-lines left at least 13,000 customers out of power. Rainfall amounts
ranged from ½ to 1.5 inches, but 2.5 to over 5 inches fell from Grant County east to southern Dane County. The greatest rain totals were in Grant County. The storms and wind gusts weakened as they reached the Lake Michigan shoreline.
http://www.crh.noaa.gov/arx/?n=sep0412 http://www.crh.noaa.gov/news/display_cmsstory.php?wfo=mkx&storyid=87035&source=2

9
22. Early Freeze in Mid-September A cold Canadian air mass settled into Wisconsin in mid-September. Morning low temperatures across much of the northern Wisconsin dropped to near or below freezing by September 19, which is about a week earlier than normal. Later in the month, parts of southern Wisconsin experienced their first freeze, also a week earlier than normal. Map of first freeze of autumn in Midwest: http://mcc.sws.uiuc.edu/cliwatch/GIS_plots/frz_fall/freeze_32_stn_Central.png
Map of median date of first freeze: http://mcc.sws.uiuc.edu/cliwatch/GIS_plots/frz_fall/frzmed_32_shd_Central.png
23. October 12-14th Soaking Rains of 1 to 5 inches Southeast Two-Thirds of State
Beneficial rains of 1 to 5 inches fell over a 3-day period across the southeast two-thirds of the state. This rain didn’t end the drought, but it put a dent into it. The greatest amounts of 3 to 5 inches occurred in the central and east-central into northeast Wisconsin. http://www.crh.noaa.gov/news/display_cmsstory.php?wfo=mkx&storyid=88158&source=2 http://www.crh.noaa.gov/news/display_cmsstory.php?wfo=arx&storyid=88204&source=2
24. October 25th Late-season Severe Storms Central Wisconsin
A broken line of severe thunderstorms developed ahead of a strong cold front during the morning and raced northeast across central and north-central Wisconsin. Radar data indicated that a bowing line segment ("bow echo" ) developed over eastern Taylor County and raced northeast (at nearly 70 mph) across western and central Marathon County producing damaging winds up to 75 mph and large hail. Several structures in Marathon County were damaged.
http://www.crh.noaa.gov/news/display_cmsstory.php?wfo=grb&storyid=88732&source=2
25. October 30th – Effects of Hurricane Sandy Over Eastern Wisconsin
The remnants of Hurricane Sandy moved primarily through the Ohio River Valley and New England States. However, the outer edges of the system did affect eastern Wisconsin and Lake Michigan with north-northwest winds gusting to 35 to 47 mph for most of October 30th. Big waves of 5 to 10 feet crashed into the Lake Michigan shoreline. Other than some minor beach erosion there was no property damage. This low impact was related to the water level of Lake Michigan being 2 feet below normal at that time. Of course, had the winds been out of the northeast the waves would have been taller and there may have been more damage.
http://www.crh.noaa.gov/news/display_cmsstory.php?wfo=mkx&storyid=88811&source=2

10
26. Lake Michigan & Lake Superior - Water Temperatures & Waterspouts The very warm and dry conditions experienced over Wisconsin and the Great Lakes during the spring and summer caused average Lake Michigan and Lake Superior water temperatures to run 2 to as much as 8o C above the 20-year average (1992 through 2011). The warmest average lake temperatures occurred during late July and August, with a secondary lower peak in September.
These warmer than normal lake temperatures would result in an increased likelihood for waterspouts developing over the western Great Lakes during the late summer and autumn as colder air intrusions became more common. Six waterspouts were sighted just off the Wisconsin shoreline in July, August and September. Most of the waterspouts remained offshore and did not cause any damage. The first waterspout of the season observed in the Wisconsin waters of Lakes Michigan and Superior was viewed the morning of July 27th just northeast of Milwaukee Harbor. The waterspout was observed for 25 minutes and remained offshore. Four waterspouts occurred on August 9th. The most vigorous waterspout of the season developed 2 miles offshore from the Superior Wisconsin shoreline. This waterspout then moved southwest and crossed Minnesota Point, affecting Sky Harbor Airport. The waterspout continued to move southwest and made landfall as a weak tornado affecting Barkers Island on the Superior Wisconsin shore. The waterspout/tornado weakened as it made landfall and did not cause any damage. The last waterspout of the season was observed just west of Sister Bay Wisconsin in Green Bay on September 18th. http://www.crh.noaa.gov/news/display_cmsstory.php?wfo=mkx&storyid=85206&source=2 http://www.crh.noaa.gov/news/display_cmsstory.php?wfo=mkx&storyid=85853&source=2 http://www.crh.noaa.gov/news/display_cmsstory.php?wfo=mkx&storyid=86474&source=2

11
27. Number of Days in 2012 With Maximum Temperatures 100F or Higher (and 90F+) Many locations in the southern half of Wisconsin peaked at 100F or higher on several days. Locations near Lake Michigan had fewer days due to the cooling influence of the lake-breeze. Below is a partial listing. The number within parentheses indicates the number of days with maximum temperatures of 90F or higher. 8 Days Baraboo (33) 7 Days Boscobel (47), Monroe (50) 6 Days 3SE Sullivan – WFO MKX (42), Darlington (37), Montello (30), Paddock Lake (43) 5 Days Arlington (35), Berlin (29), Brodhead (38), Lone Rock (39), Mt. Mary College (35),
Town of Westford-Beaver D. (23) 4 Days Madison (37), Arboretum (30, UW-MSN), Beaver Dam (25), Charmony Farms UW-MSN (30),
Clinton (31), Ft. Atkinson (41), Germantown (28), Hales Corner (35), Horicon (23), Jefferson (39), Kenosha Airport (35), Lake Mills (39), Lodi (40), Oconomowoc (32), Portage (36), Reedsburg (29), Richfield (26), Stoughton (40), Union Grove (25), Watertown (30), Whitewater (38), Wisconsin Dells (39)
3 Days Milwaukee (20), Afton (45), Beloit (34), Burlington (22), Fond du Lac (26), Hartford (25), La Crosse (37), Racine (17), Waukesha (23)
2 days Sheboygan Airport (25), Dodgeville (28), Plymouth (20) 1 Day Sheboygan WWTP (7), Saukville (14), Gibbsville (11), Ripon (18)

12
Below is a plot of the number of days in 2012 with maximum air temperatures of 90F or higher over southern Wisconsin. Normally, there are 7 to 15 days per year with such conditions, with the lower frequency near Lake Michigan.
28. Consecutive Months With Above Average Temperatures Starting with October, 2011, and ending with August, 2012, the cities of Milwaukee, Madison, Green Bay, La Crosse, Wausau, and Rhinelander had 11 consecutive months with average monthly temperatures above normal. While the streak of 11 consecutive months is remarkable, it is not the longest streak for all of these cities. The record number of consecutive months with above normal temperatures for Milwaukee and Madison is actually 20 (from December 1997 to July 1999). The Twin Cities and Duluth, MN, had streaks of 16 and 15 consecutive months, respectively, with above normal temperatures through September, 2012. It is safe to assume the far west-central and northwestern Wisconsin counties experienced the same streak. Even though temperatures in September, 2012, across Wisconsin averaged slightly below normal, September, 2012, marked the 16th consecutive month with above-average temperatures for the Lower 48 States. The contiguous U.S. averaged below normal in October, 2012. The October 2011-September 2012 period was the warmest such 12-month period on record for the contiguous U.S., with an average temperature of 55.3°F, 3.3°F above average. http://www.crh.noaa.gov/news/display_cmsstory.php?wfo=mpx&storyid=88826&source=2 http://www.ncdc.noaa.gov/sotc/national/2012/9/supplemental/page-6/ http://www.climatewatch.noaa.gov/image/2012/october-2012-ends-16-month-stretch-of-above-average-nationwide-temps

13
29. Long Stretches Without Measurable Snow Due to a record-warm March and the lack of snow in Wisconsin in October and November, 2012, long stretches of days with no measurable snow occurred in some locations. Some sites set new all-time longest streaks during the month of December.
Milwaukee – 288 days ending 12/17/12 1
st longest Started March 5th
Madison – 246 days ending 11/05/12 9th longest Started March 5th
Kenosha - 291 days ending 12/19/12 2nd
longest Started March 4th Racine – 298 days ending 12/27/12 2
nd longest Started March 5th
Fond du Lac – 280 days ending 12/08/12 3rd
longest Started March 4th West Bend – 280 days ending 12/08/12 2
nd longest Started March 4th
Waukesha – 290 days ending 12/17/12 1st longest Started March 3rd
Watertown – 279 days ending 12/08/12 2nd longest Started March 5th Portage – 279 days ending 12/08/12 4
th longest Started March 5th
Baraboo – 276 days ending 12/08/12 3rd
longest Started March 8th Dodgeville – 255 days ending 11/13/12 T6
th longest Started March 3rd
Monroe – 281 days ending 12/08/12 T 1st longest Started March 3rd
Whitewater – 280 days ending 12/08/12 T 4th longest Started March 4th
Burlington – 292 days ending 12/19/12 1st longest Started March 3rd
Green Bay – 260 days ending 11/23/12 T4th longest Started March 9th
Appleton – 261 days ending 11/24/12 2nd
longest Started March 9th
Oshkosh – 275 days ending 12/4/12 3
rd longest Started March 9th
La Crosse – 252 days ending 11/11/12 9th longest Started March 5th
Boscobel – 253 days ending 12/08/12 unknown Started March 4th Eau Claire – 252 days ending 11/11/12 4
th longest Started March 5th
30. Record or Near-Record Warmth in Early December Warm air pushed into southern Wisconsin during the first 4 days of December, 2012. Most locations peaked in the 50s and on one day reached into the lower to mid-60s! Madison peaked at 65 on Monday December 3rd, which was a new record for the entire month of December (old one was 64 on Dec 5th in 2001). The old daily record was 61 set back in 1998. Milwaukee set a record high of 65 degrees on Monday, December 3rd. This broke the previous daily record high of 64, set in 1998. Likewise, Green Bay tied their daily record of 62 set in 1998. La Crosse set a new record of 64, breaking the old one of 61 set in 1961. The graphic to the right depicts the departure from normal for the average daily temperature for the period of December 1-6th. Note that Wisconsin was 9 to 14 degrees above normal. The above normal trend continued into the 2nd week of December. http://www.crh.noaa.gov/news/display_cmsstory.php?wfo=mkx&storyid=89841&source=0

14
31. Dec 8-9th Winter Storm Northern and Central Wisconsin This was the first, significant, widespread winter storm to affect Wisconsin during the 2012-13 winter-season with accumulations of 6 inches or more. Generally 4-6 inches fell over the northeast and east-central parts of the state increasing to 10 to over 14 inches over the west-central counties. The maximum amount was 16.2 inches at Menomonie 1.5E (Dunn County). The 12.5 inches measured in Eau Claire on Dec 9th broke the old record of 7.2 inches set back in 2009. Numerous vehicle accidents occurred as motorists re-acquainted themselves with winter driving techniques. http://www.crh.noaa.gov/news/display_cmsstory.php?wfo=mkx&storyid=90176&source=0 http://www.crh.noaa.gov/news/display_cmsstory.php?wfo=grb&storyid=90171&source=0 http://www.crh.noaa.gov/arx/?n=dec0912 http://www.crh.noaa.gov/news/display_cmsstory.php?wfo=mpx&storyid=90169&source=0 http://www.crh.noaa.gov/dlh/?n=dec_8_to_9_2012_snow
32. December 19-20th Winter Storm/Blizzard Southeast Two-Thirds of Wisconsin A major winter storm affected the southeast two-
thirds of Wisconsin from the evening hours of December 19th through the evening hours of December 20th. Blizzard or near-blizzard conditions were reported over some of the southwest and south-central counties. Snow accumulations ranged up to 12 to 22 inches in a broad swath from Grant County northeast to Fond du Lac and Washington Counties. Top 2-day accumulations were 21.9 and 21.5 inches in Cottage Grove and Mt. Horeb. Additionally, there was another swath of snow accumulations of 8 to 15 inches from Trempealeau County northeast to Langlade County.
Northwest wind gusts to 35 to nearly 50 mph coupled with moderate to heavy snow intensities of 1 to 2 inches per hour to reduce visibilities to 1/4 mile or
less in some rural locations. Thunder-snow was reported over the southern counties. Snowplow crews had a difficult time keeping roads open due to drifting snow and some roads became nearly impassable. Snow drifts reached 3 to 5 feet in height. Hundreds of vehicle accidents were reported, and dozens of vehicles were stranded. Due to surface temperatures in the 29 to 33 degree range the snow was rather heavy and wet. This led to scattered power outages due snapped power lines thanks to impact of broken tree branches or the weight of the snow itself. Nearly 35,000 customers lost electrical power in southern Wisconsin. Much
15
of the precipitation near Lake Michigan was in the form of rain due to an onshore wind off of an unfrozen lake keeping temperatures in the upper 30s to lower 40s. Rainfall totals along the lakeshore from Sheboygan to Kenosha ranged from 1.5 to over 2.5 inches! Had the rain been all-snow the lakeshore would have had 20 to 25 inches!
http://www.crh.noaa.gov/news/display_cmsstory.php?wfo=mkx&storyid=90352&source=0 http://www.crh.noaa.gov/news/display_cmsstory.php?wfo=grb&storyid=90647&source=2 http://www.crh.noaa.gov/images/mkx/climate/2012/2012_WI_Yrly_Wx_Summary.pdf
33. Very Low River Flows & Near-record or Record Low Levels at Some Locations
The prolonged 2012 drought resulted in water levels on all rivers decreasing to low levels with water flows below 50% at all locations during the summer and fall seasons. Some river flows were less than 20%, and in some cases less than 10% of normal. Some all-time low water levels were established. New Record Low Stages Fox R. – Berlin, Green Lake Co. 6.98 ft on 9/19/12 Old Record 7.30 ft on 6/28/1988 Rock R. – Lk. Kosh, Jefferson Co. 4.99 ft on 12/6/12 Old Record 5.10 ft on 12/29/1999 Near-Record Low Stages (2nd lowest) Wisc R. – Portage, Columbia Co. 7.95 ft on 9/21/12 Current Record 6.50 ft on 8/14/1936 Cedar Ck – Cedarburg, Ozaukee Co 4.93 ft on 9/29/12 Current Record 4.87 ft on 9/15/2005 Milw R. – Milwaukee, Milwaukee Co. 1.47 ft on 9/20/12 Current Record 1.00 ft on 9/18/1943
http://water.weather.gov/ahps2/index.php?wfo=mkx http://www.crh.noaa.gov/ncrfc/
34. 2012 Fatalities & Injuries by Event Heat or Excessive Heat was the biggest weather killer in Wisconsin during 2012. Thirteen people died due to the direct result of the heat in mid-June and during the first 7 days of July. There were 2 indirectly-related deaths. Three people died along the Lake Michigan shoreline due to high waves generated by “marine strong winds.” One person died due to thunderstorm winds loosened a large tree branch which fell on that person’s head. In another thunderstorm wind event the driver of a semi-tractor trailer was injured when the wind rolled his vehicle over. Additionally, at least 300 people were treated at various medical facilities due to the effects of the summer heat waves.
Number of
Direct Fatalities
Date
Event Type
County
Location/Circumstances/Age 1 Mar 3 Marine Strong Wind Lake Michigan Near Port Washington, kayaker, M??IW 1 May 3 Thunderstorm Wind Dunn tree limb, M72UT 2 Jun 18-20 Heat Milwaukee F66OU, M60PH 1 Jul 4 Excessive Heat Rock F83PH 1 Jul 5 Excessive Heat Dane M73PH 1 Jul 5 Excessive Heat Milwaukee F49PH 1 Jul 6 Excessive Heat Milwaukee M42PH 2 Jul 2-6 Heat La Crosse F52??, F58PH 1 Jul 2-6 Heat Juneau F68PH 1 Jul 2-6 Heat Richland M74PH 1 Jul 2-6 Heat Vernon M91PH 2 Jul 1-7 Excessive Heat Barron F71PH, F76OU

16
Number of Indirect
Fatalities
Date
Event Type
County
Location/Circumstances/Age
1 Jul 6 Excessive Heat Rock F75PH 1 Jul 18 Heat Kewaunee M71 – died in hospital
Number of
Direct Injuries Date Event Type County Location/Circumstances
1 May 26 Thunderstorm Wind Trempealeau Semi-tractor rolled over 50 (est.) Jun 18-20 Heat Various received medical treatment
300 (est.) Jul 1-7 Heat/Excessive Heat Various received medical treatment
Key: M=Male, F=Female, PH=Permanent Home, OU=Outside, IW=In Water, UT=Under Tree
35. 2012 Property & Crop Losses A variety of weather elements inflicted damage on property or crops. Vehicle accident damage due to snow-covered or icy roads is not included. Property losses (power-lines & poles) due to tornadoes, thunderstorm winds and lightning are not available. (Table below – through end of October, 2012)
Weather Element Property Damage Crop Damage Total Damage Tornado $420K $8K $420K
Flash Flood $600K 0 $600K Flood $21.07M 0 $21.07M
Thunderstorm Wind $5.955M $170K $6.125M Hail $2.669M $50K $2.719M
Lightning $2.178M 0 $2.178M High Wind $30K 0 $30K
Strong Wind $244K 0 $244K Wild Fire $70K 0 $70K
Heavy Snow $10K 0 $10K Drought unknown* unknown* unknown*
Frost/Freeze unknown* unknown* unknown* Totals $33.147M $228K $33.375M
*unknown – crop losses are not available; however, based on previous droughts, it’s safe to assume it’s in the millions of dollars. Property damage is possible due to drying of soils which leads to cracking of foundations as the ground shifts. Additionally, the drought led to agricultural losses due to partial or full liquidation of dairy cows or beef cattle. Frost/freeze numbers are not available.
36. Very Warm Calendar Year Many locations across the state experienced one of the Top-3 warmest years on record. In fact, Madison and Eau Claire had their warmest year on record, while Milwaukee and Green Bay tied for first. Collectively, for all of Wisconsin, 2012 will probably go into the books as the warmest year on record, or at least a Top-3 warmest year. Below are the Top-5 rankings for Milwaukee, Madison, Green Bay, Wausau, La Crosse and Eau Claire.
Milwaukee Madison
Rank Value (F) Year Rank Value (F) Year
1 51.9 2012, 1931 1 51.3 2012
3 50.9 1998 2 51.0 1931
4 50.8 1921 3 49.9 1998, 1878
5 50.4 2010 4 49.6 1921

17
Green Bay Wausau
Rank Value (F) Year Rank Value (F) Year
1 49.4 2012, 1931 1 48.7 1998
3 48.2 1998, 1921 2 47.9 2012
5 47.6 1987 3 47.7 1931
4 47.1 1987
5 46.4 1999
La Crosse Eau Claire
Rank Value (F) Year Rank Value (F) Year
1 51.9 1998 1 48.6 2012
2 51.7 1931 2 48.1 2006
3 51.3 2012 3 47.7 1987
4 50.7 1878 4 46.5 2005
5 50.5 1987 5 46.2 2010
http://www.ncdc.noaa.gov/sotc/ http://www.ncdc.noaa.gov/sotc/national/2012/11
37. 2012 Precipitation
The 2012 Drought (#12 in this document) had a big impact on precipitation amounts across Wisconsin. The driest part of the state was in the Wisconsin River Valley where Lone Rock picked up only 22.95 inches, or about 15 inches below normal! In contrast, Superior in Douglas County was the wettest part of the state with a yearly total of 39.14 inches, thanks to their big rain event in mid-June. Milwaukee had 29.29 inches, or 5.47 below normal, 51st driest year on record Madison had 26.36 inches, or 8.12 inches below normal, 30th driest year on record Green Bay had 31.53 inches, or 2.01 inches above normal La Crosse had 26.68 inches, or 6.38 inches below normal, tied 34th driest year on record Eau Claire had 24.26 inches, or 6.72 inches below normal, 12th driest year on record Wisconsin average yearly precipitation map:
http://www.crh.noaa.gov/images/mkx/climate/avg_30_year_precip.png
(Much smoothing and estimation used)
18
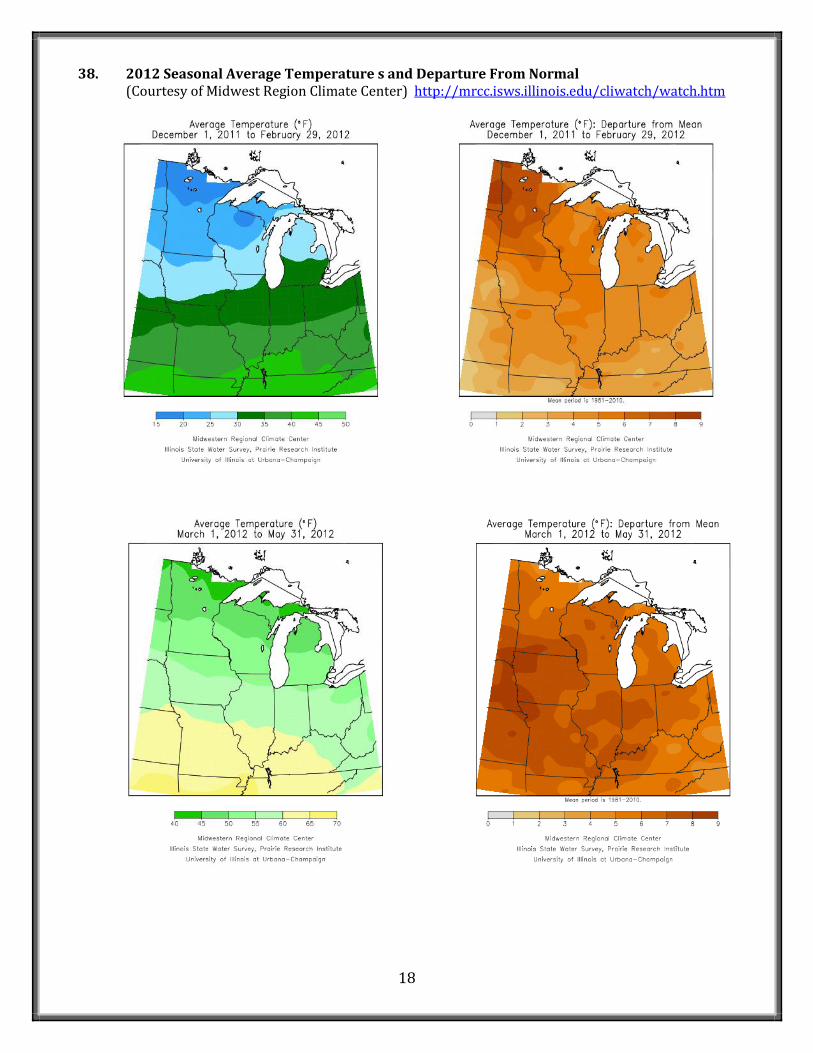
38. 2012 Seasonal Average Temperature s and Departure From Normal
(Courtesy of Midwest Region Climate Center) http://mrcc.isws.illinois.edu/cliwatch/watch.htm

19

20
39. 2012 Seasonal Precipitation and Departure From Normal
(Courtesy of Midwest Region Climate Center) http://mrcc.isws.illinois.edu/cliwatch/watch.htm

21

22
Information in this document is current through December 31, 2012. Items are not in order of importance.
Contributors: Kapela, Last, Shea, Krause, Christenson, Kavinsky, McMahon, Hahn, Hopkins, Wood, Brooks, Townsend, Wolf, Stangeland.