
2012 Bergmann Geoph
15
Case History Surface-downhole electrical resistivity tomography applied to monitoring of CO 2 storage at Ketzin, Germany Peter Bergmann 1 , Cornelia Schmidt-Hattenberger 1 , Dana Kiessling 2 , Carsten Rücker 3 , Tim Labitzke 1 , Jan Henninges 4 , Gunther Baumann 4 , and Hartmut Schütt 5 ABSTRACT Surface-downhole electr ical resistivity tomogra phy (SD- ERT) surveys were repeatedly carried out to image CO 2 injected at the pilot storage Ketzin, Germany. The experimental setup combines surface with downhole measurements by using a per- manent electrode array that has been deployed in three wells. We performed one baseline and three repeat experiments; the first survey was performed during the site startup and the sub- sequent surveys during the first year of CO 2 injection. By the time of the third repeat, approximately 13,500 tons of CO 2 had been injected into the reservoir sandstones at about 650 m depth. Field data and inverted resistivity models showed a resistivity increase over time at the CO 2 injector. The lateral extent of the related resistivity signature indicated a preferential CO 2 migration toward the northwest. Using an experimental resistiv- ity-sat uration relationship , we mapped CO 2 satura tions by means of the resistivity index method. For the latest repeat, CO 2 saturations show values of up to 70% near the injection well, which matches well with CO 2 saturations determined from pulsed neutron-gamma logging. The presence of environmental noise, reservoir heterogeneities, and irregularities in the well completions are the main sources of uncertainty for the interpre- tations. The degradation of the permanently installed downhole components is monitored by means of frequently performed resista nce checks. In consis tency with the SD-ERT data, these resista nce checks indica te a long-te rm resist ivity increase near the CO 2 injector. In conclusion, the investigations demonstrate the capability of surface-downhole electrical resistivity tomo- graphy to image geologica lly stored CO 2 at the Ketzin site. INTRODUCTION The capture and storage of CO 2 in deep geologic formations is an opt ion for reduc ing gre enh ous e gas emi ssio ns into the atmosph ere (IPCC, 200 5). Reli abl e lon g-t erm storage req uire s monitoring of CO 2 migration and related processes, e.g., brine displacement. In general, geophysical methods provide the images of physical parameters in regions of the subsurface that are other- wise inaccessible for direct observations. Time-lapse measurements allow for imaging of changes of these physical parameters over time, thus, offering an opportunity for long-term monitoring of CO 2 storage. Electrical resistivity tomography (ERT) is suitable in this context because the electric resistivity of porous sediments significantly increases when electrically conductive brine is dis- placed by CO 2 . Depending on the phase of the CO 2 , dissolution in brine and uptake of dissolved solids can adversely decrease Manusc ript recei ved by the Editor 19 Dece mber 2011; revised manuscr ipt receive d 27 April 2012; published online 18 September 2012. 1 GFZ German Research Centre for Geosciences, Helmholtz Centre Potsdam, Centre for CO 2 Storage, Potsdam, Germany. E-mail: bergmann@gfz-potsdam .de; [email protected]; [email protected]. 2 Univ ersit y of Leipz ig, Institu te of Geoph ysics and Geolog y, Leipzig, German y and GFZ German Research Centre for Geosc ience s, Helmholtz Centre Potsdam, Centre for CO2 Storage, Potsdam, Germany. E-mail: [email protected]. 3 Technical University Berlin, Department of Applied Geophysics, Berlin, Germany. E-mail: [email protected]. 4 GFZ German Research Centre for Geosciences, Helmholtz Centre Potsdam, Reservoir Technologies, Potsdam, Germany. E-mail: [email protected]; [email protected]. 5 Formerly GFZ German Research Centre for Geosciences, Helmholtz Centre Potsdam, Centre for CO 2 Storage, Potsdam, Germany; presently Statoil ASA, Stavanger, Norway. E-mail: [email protected]. © 2012 Society of Explor ation Geophysic ists. All rights reserv ed. B253 GEOPHYSICS, VOL. 77, NO. 6 (NOVEMBER-DECEMBER 2012); P. B253 –B267, 12 FIGS., 1 TABLE. 10.1190/GEO2011-0515.1 Downloaded 12 Oct 2012 to 141.35.154.128. Redistribution subject to SEG license or copyright; see Terms of Use at http://segdl.org/
-
Upload
ignacio-fernandez-paba -
Category
Documents
-
view
229 -
download
0
Transcript of 2012 Bergmann Geoph
8/13/2019 2012 Bergmann Geoph
http://slidepdf.com/reader/full/2012-bergmann-geoph 1/15
Case History
Surface-downhole electrical resistivity tomography applied tomonitoring of CO2 storage at Ketzin, Germany
Peter Bergmann1, Cornelia Schmidt-Hattenberger 1, Dana Kiessling2, Carsten Rücker 3,
Tim Labitzke1, Jan Henninges4, Gunther Baumann4, and Hartmut Schütt5
ABSTRACT
Surface-downhole electrical resistivity tomography (SD-ERT) surveys were repeatedly carried out to image CO2 injectedat the pilot storage Ketzin, Germany. The experimental setupcombines surface with downhole measurements by using a per-manent electrode array that has been deployed in three wells.We performed one baseline and three repeat experiments; thefirst survey was performed during the site startup and the sub-sequent surveys during the first year of CO2 injection. By the
time of the third repeat, approximately 13,500 tons of CO
2 hadbeen injected into the reservoir sandstones at about 650 m depth.Field data and inverted resistivity models showed a resistivityincrease over time at the CO2 injector. The lateral extent of the related resistivity signature indicated a preferential CO2
migration toward the northwest. Using an experimental resistiv-ity-saturation relationship, we mapped CO2 saturations bymeans of the resistivity index method. For the latest repeat,CO2 saturations show values of up to 70% near the injectionwell, which matches well with CO2 saturations determined frompulsed neutron-gamma logging. The presence of environmentalnoise, reservoir heterogeneities, and irregularities in the wellcompletions are the main sources of uncertainty for the interpre-tations. The degradation of the permanently installed downholecomponents is monitored by means of frequently performed
resistance checks. In consistency with the SD-ERT data, theseresistance checks indicate a long-term resistivity increase near the CO 2 injector. In conclusion, the investigations demonstratethe capability of surface-downhole electrical resistivity tomo-graphy to image geologically stored CO2 at the Ketzin site.
INTRODUCTION
The capture and storage of CO2 in deep geologic formationsis an option for reducing greenhouse gas emissions into theatmosphere (IPCC, 2005). Reliable long-term storage requiresmonitoring of CO2 migration and related processes, e.g., brinedisplacement. In general, geophysical methods provide the imagesof physical parameters in regions of the subsurface that are other-
wise inaccessible for direct observations. Time-lapse measurementsallow for imaging of changes of these physical parameters over time, thus, offering an opportunity for long-term monitoring of CO2 storage. Electrical resistivity tomography (ERT) is suitablein this context because the electric resistivity of porous sediments
significantly increases when electrically conductive brine is dis-placed by CO2. Depending on the phase of the CO2, dissolutionin brine and uptake of dissolved solids can adversely decrease
Manuscript received by the Editor 19 December 2011; revised manuscript received 27 April 2012; published online 18 September 2012.1GFZ German Research Centre for Geosciences, Helmholtz Centre Potsdam, Centre for CO2 Storage, Potsdam, Germany. E-mail: bergmann@gfz-potsdam
.de; [email protected]; [email protected] of Leipzig, Institute of Geophysics and Geology, Leipzig, Germany and GFZ German Research Centre for Geosciences, Helmholtz Centre
Potsdam, Centre for CO2 Storage, Potsdam, Germany. E-mail: [email protected] University Berlin, Department of Applied Geophysics, Berlin, Germany. E-mail: [email protected] German Research Centre for Geosciences, Helmholtz Centre Potsdam, Reservoir Technologies, Potsdam, Germany. E-mail: [email protected];
[email protected] GFZ German Research Centre for Geosciences, Helmholtz Centre Potsdam, Centre for CO2 Storage, Potsdam, Germany; presently Statoil ASA,
Stavanger, Norway. E-mail: [email protected].© 2012 Society of Exploration Geophysicists. All rights reserved.
B253
GEOPHYSICS, VOL. 77, NO. 6 (NOVEMBER-DECEMBER 2012); P. B253–B267, 12 FIGS., 1 TABLE.10.1190/GEO2011-0515.1
Downloaded 12 Oct 2012 to 141.35.154.128. Redistribution subject to SEG license or copyright; see Terms of Use at http://segdl.org/

8/13/2019 2012 Bergmann Geoph
http://slidepdf.com/reader/full/2012-bergmann-geoph 2/15
the resistivity. However, as an example for the reservoir conditionsat the Ketzin site, laboratory data published by Fleury andDeschamps (2008) show that the effect of CO2 dissolution on elec-trical brine conductivity — and therefore, bulk reservoir resistivity— is negligible. However, only short-term data are reported and,thus, additional physico-chemical fluid-solid interactions may af-fect the resistivity in the long-term.
Considering the rapid development of geoelectric instrumentsand inversion tools over the last few decades (e.g., Daily et al.,2004), ERT becomes an attractive monitoring option. The useful-ness of time-lapse ERT is well documented, e.g., for steam injection(Ramirez et al., 1993), leak detection (Ramirez et al., 1996), salt tracer tracking (e.g., Slater et al., 2000; Kemna et al., 2002; Cassianiet al., 2006), and other processes related to subsurface fluid flow(LaBrecque et al., 2004; Nimmer et al., 2007; Clément et al.,2010). These applications are of high relevance for CO2 storagemonitoring because the methodical aspects and many practical pro-blems are similar. Of special interest, however, are previous studiesfocused on the ERT imaging of subsurface CO2 migration. Severalmodeling studies pointed out the potential for CO2 storage moni-toring by means of ERT (Ramirez et al., 2003; Christensen et al.,
2006; al Hagrey, 2011). Practical application is being tested at theNagaoka site in Japan (Xue et al., 2009; Nakatsuka et al., 2010), theSECARB Cranfield site in the USA (Carrigan et al., 2009), and theKetzin site in Germany (Kiessling et al., 2010).
It is remarkable that most of these theoretical and practicalstudies deal with crosswell setups. This is because crosswell setupscan be realized by permanent electrodes, which offer cost-compe-titive and environmentally sound long-term monitoring. In this ar-ticle, we present the ERT surveys at the Ketzin site, which include acombination of well-based and surface-based data acquisition. Suc-cessful application of surface-based ERT for large- and midscaleresistivity imaging are reported by Brunner et al. (1999), Storzet al. (2000), and Schütze et al. (2002). At the Ketzin site, large-
scale geoelectrical measurements are adapted to the demand of high-resolution monitoring of the Ketzin storage reservoir by joint
operation with a permanent borehole electrode array (Schmidt-Hattenberger et al., 2011; C. Schmidt-Hattenberger, P. Bergmann,T. Labitzke, S. Schröder, K. Krüger, C. Rücker, and H. Schütt, per-sonal communication, 2012), which allows for additional surface-downhole ERT (SD-ERT) data acquisition.
In this paper, we report the results of the SD-ERT surveys cover-ing the startup of the Ketzin site and the first year of CO2 injection
by two baseline and three repeat surveys. The article is structured asfollowed: first, we give an overview on the Ketzin project and con-tinue with the description of the SD-ERT surveys. We then describethe preprocessing and inversion of the field data. Subsequently, weestimate CO2 saturations and compare them with results of pulsed-neutron-gamma logs. Finally, we discuss the value, implications,and limitations of SD-ERT for CO2 plume tracking.
GEOELECTRICAL SURVEYING AT THE
KETZIN SITE
Site description
The Ketzin project provides an experimental test site for the geo-logic storage of CO2 in an onshore saline aquifer near Berlin
(Schilling et al., 2009; Würdemann et al., 2010; Martens et al.,2011). Supercritical CO2 is injected into Triassic sandstones of theStuttgart Formation at approximately 650-m depth. Site operationswere initiated by the CO2SINK project in 2007, which was succeededby the CO2MAN project in 2010, both of which are here referred to asthe Ketzin project. The objective of the Ketzin project is the improvedunderstanding of in situ processes and the provision of practical ex-perience for future geological storage of CO2 (Giese et al., 2009). Aprimary task is the development and testing of geophysical monitor-ing procedures. Therefore, a wide range of activities is performed,such as active seismic experiments (e.g., Juhlin et al., 2007; Ivanovaet al., 2012), combined active and passive seismic experiments (Artset al., 2011), geoelectric experiments (Kiessling et al., 2010; Schmidt-
Hattenberger et al., 2011), and electromagnetic experiments (Girardet al., 2011; Streich et al., 2011).The Ketzin site is situated in the eastern part
of the Roskow-Ketzin double anticline, whichformed above a salt pillow situated at a depthof 1500–2000 m (Förster et al., 2006). One injec-tion well (Ktzi201) and two observation wells(Ktzi200 and Ktzi202) have been drilled eachto a depth of about 800 m. The wells are arrangedin a rectangular triangle geometry (Figure 1a).All wells were drilled through the Stuttgart For-mation, which is located in the depth range of about 630–700 m for the well Ktzi201. The Stutt-gart Formation consists of sandstone channel-fa-
cies rocks with good reservoir propertiesalternating with muddy floodplain-facies rocksof poor reservoir quality (Förster et al., 2006;Norden et al., 2010). CO2 has been injected intothe saline-water-bearing sandstone units since 30June 2008 via Ktzi201. The caprock overlyingthe Stuttgart Formation is the Weser Formation,which mainly consists of clayey and sandy silt-stones alternating with carbonates and evaporites(Beutler and Nitsch, 2005). A high clay mineralcontent and the observed pore-space geometrymake these rocks a suitable seal for the CO2
a) b)
Figure 1. (a) Acquisition geometry for the SD-ERT. Surface dipoles E01-E08 are de-ployed on a circle with a radius of 800 m and surface dipoles E09-E16 are deployed oncircle with a radius of 1500 m. Location of the injection site is shown by a star. (b) Sche-matic cross section through the Ketzin anticline and setup of the combined surface-downhole ERT experiments. Aquifer units are depicted in light gray, aquitard unitsin dark gray. The approximate position of the cross section is illustrated by a dottedline in the subfigure in (a). Upper inlay in (b) shows the TSQ-4 power source (propertyof Leipzig University). Lower inlay shows a VERA electrode mounted on the electri-cally insulated well pipe.
B254 Bergmann et al.
Downloaded 12 Oct 2012 to 141.35.154.128. Redistribution subject to SEG license or copyright; see Terms of Use at http://segdl.org/
8/13/2019 2012 Bergmann Geoph
http://slidepdf.com/reader/full/2012-bergmann-geoph 3/15
storage reservoir (Förster et al., 2006). A 10–20 m thick anhydritelayer, known as K2 (Keuper), outlines the top of the Weser Forma-tion. The Weser Formation is overlain by mud/clay-carbonates of the Arnstadt Formation, which exhibits similar sealing properties.Until the year 2000, the shallower Hettangium formation (300–400 m) was used for industrial storage of natural gas (for further details, see Juhlin et al., 2007; Kazemenei et al., 2009).
Drilling operations started in summer 2007 with the sinking of the well Ktzi200. Well completion was performed with steel casingsand preperforated screens in the reservoir zone (Prevedel et al.,2009).
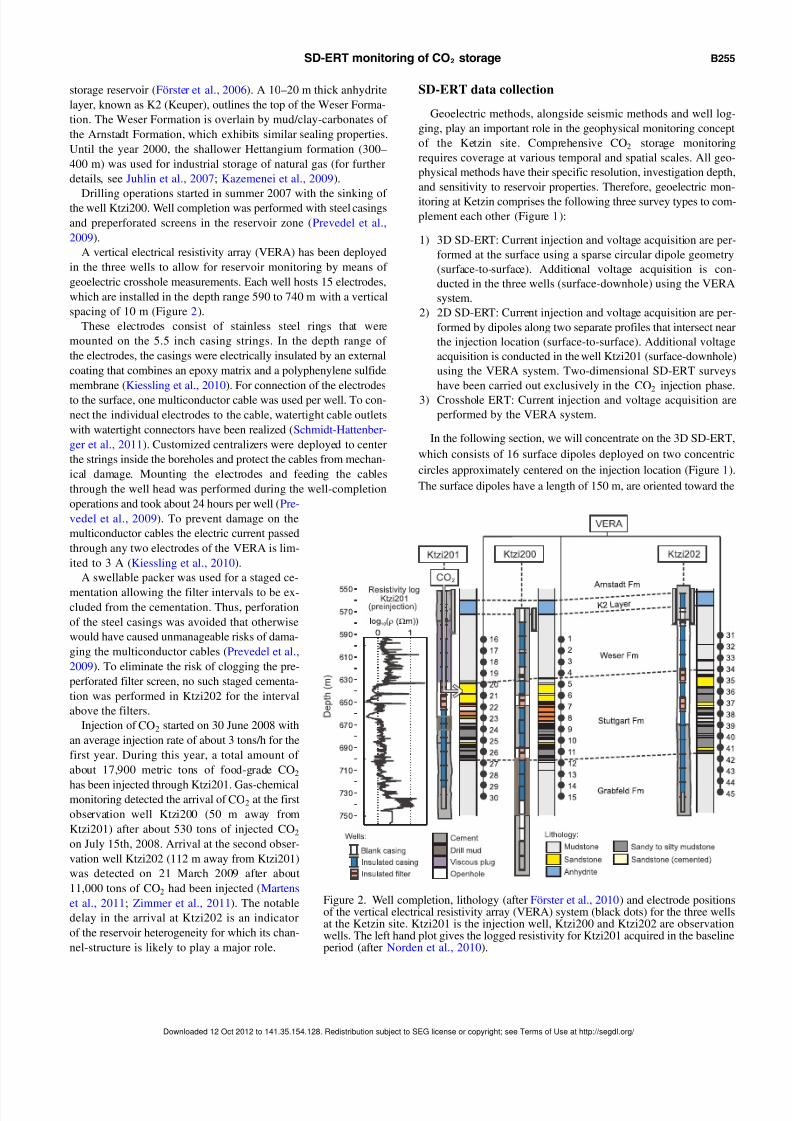
A vertical electrical resistivity array (VERA) has been deployedin the three wells to allow for reservoir monitoring by means of geoelectric crosshole measurements. Each well hosts 15 electrodes,which are installed in the depth range 590 to 740 m with a verticalspacing of 10 m (Figure 2).
These electrodes consist of stainless steel rings that weremounted on the 5.5 inch casing strings. In the depth range of the electrodes, the casings were electrically insulated by an externalcoating that combines an epoxy matrix and a polyphenylene sulfidemembrane (Kiessling et al., 2010). For connection of the electrodesto the surface, one multiconductor cable was used per well. To con-nect the individual electrodes to the cable, watertight cable outletswith watertight connectors have been realized (Schmidt-Hattenber-ger et al., 2011). Customized centralizers were deployed to center the strings inside the boreholes and protect the cables from mechan-ical damage. Mounting the electrodes and feeding the cablesthrough the well head was performed during the well-completionoperations and took about 24 hours per well (Pre-vedel et al., 2009). To prevent damage on themulticonductor cables the electric current passedthrough any two electrodes of the VERA is lim-ited to 3 A (Kiessling et al., 2010).
A swellable packer was used for a staged ce-
mentation allowing the filter intervals to be ex-cluded from the cementation. Thus, perforationof the steel casings was avoided that otherwisewould have caused unmanageable risks of dama-ging the multiconductor cables (Prevedel et al.,2009). To eliminate the risk of clogging the pre-perforated filter screen, no such staged cementa-tion was performed in Ktzi202 for the intervalabove the filters.
Injection of CO2 started on 30 June 2008 withan average injection rate of about 3 tons/h for thefirst year. During this year, a total amount of about 17,900 metric tons of food-grade CO2
has been injected through Ktzi201. Gas-chemicalmonitoring detected the arrival of CO2 at the first observation well Ktzi200 (50 m away fromKtzi201) after about 530 tons of injected CO2
on July 15th, 2008. Arrival at the second obser-vation well Ktzi202 (112 m away from Ktzi201)was detected on 21 March 2009 after about 11,000 tons of CO2 had been injected (Martenset al., 2011; Zimmer et al., 2011). The notabledelay in the arrival at Ktzi202 is an indicator of the reservoir heterogeneity for which its chan-nel-structure is likely to play a major role.
SD-ERT data collection
Geoelectric methods, alongside seismic methods and well log-ging, play an important role in the geophysical monitoring concept of the Ketzin site. Comprehensive CO2 storage monitoringrequires coverage at various temporal and spatial scales. All geo-physical methods have their specific resolution, investigation depth,and sensitivity to reservoir properties. Therefore, geoelectric mon-
itoring at Ketzin comprises the following three survey types to com-plement each other (Figure 1):
1) 3D SD-ERT: Current injection and voltage acquisition are per-formed at the surface using a sparse circular dipole geometry(surface-to-surface). Additional voltage acquisition is con-ducted in the three wells (surface-downhole) using the VERAsystem.
2) 2D SD-ERT: Current injection and voltage acquisition are per-formed by dipoles along two separate profiles that intersect near the injection location (surface-to-surface). Additional voltageacquisition is conducted in the well Ktzi201 (surface-downhole)using the VERA system. Two-dimensional SD-ERT surveyshave been carried out exclusively in the CO2 injection phase.
3) Crosshole ERT: Current injection and voltage acquisition areperformed by the VERA system.
In the following section, we will concentrate on the 3D SD-ERT,which consists of 16 surface dipoles deployed on two concentriccircles approximately centered on the injection location (Figure 1).The surface dipoles have a length of 150 m, are oriented toward the
Figure 2. Well completion, lithology (after Förster et al., 2010) and electrode positionsof the vertical electrical resistivity array (VERA) system (black dots) for the three wellsat the Ketzin site. Ktzi201 is the injection well, Ktzi200 and Ktzi202 are observationwells. The left hand plot gives the logged resistivity for Ktzi201 acquired in the baselineperiod (after Norden et al., 2010).
SD-ERT monitoring of CO2 storage B255
Downloaded 12 Oct 2012 to 141.35.154.128. Redistribution subject to SEG license or copyright; see Terms of Use at http://segdl.org/

8/13/2019 2012 Bergmann Geoph
http://slidepdf.com/reader/full/2012-bergmann-geoph 4/15
injection site, and are used for current injection and for voltage ac-quisition. Current injection was performed by a TSQ-4 (ScintrexLimited, Canada) power source with a maximum power of 10kW. Electrical currents of up to 11 A at a voltage of up to3.3 kV were used. Injection was performed by a pulsed square-wavedirect current (DC) with changing polarity (4s on +, 4s off, 4s on −,4s off), with a signal period of 16 s. At each location, currents were
injected for a period of approximately 45–
60 minutes. These per-iods were divided into three intervals that were used for sequentialvoltage acquisition in the three wells. Voltage registration was rea-lized by Texan-125 recorders (Refraction Technology Inc., USA).Survey crews typically consisted of five people and the surveyswere usually completed within five working days.
The SD-ERT surveys were performed on a periodic basis andaligned to the arrival times of the CO2 at the observation wellsand operational circumstances (e.g., harvesting periods). The first baseline survey was performed in October 2007 and aimed to pro-vide a noise test with full data acquisition. It showed a strong pre-sence of environmental noise, with a particular source identified aspulsed electrical anticorrosion currents of a nearby gas pipeline. Asan outcome of the noise analysis, the following surveys were per-
formed within break periods that were arranged with the pipelineoperator. A second baseline survey was carried out in April2008 and showed an improved signal-to-noise ratio (S/N), whichwe will use as reference baseline. The first repeat survey was carriedout in July 2008 after the detection of CO 2 at the first observation
well Ktzi200. A second repeat survey was performed in November 2008 and a third repeat survey in April 2009 after CO2 had beendetected at the second observation well Ktzi202.
ERT DATA PROCESSING
Preinversion processing
There are a number of infrastructural facilities near the Ketzin sitethat lead to a moderate S/N for the acquired voltage time series.Decentralized surface dipoles allowed to avoid long cable layoutsthat consequently reduced the risk of antenna effects and cablefaults. However, significant noise remained and was addressedby a selective stacking approach after Storz et al. (2000). The ap-proach aims to stack the acquired voltage time-series into singlecycles and was implemented in the following steps:
1) noise removal (drift correction, despiking)2) notch filtering (2.8 Hz, 8.4 Hz, and 16 Hz)3) phase correction4) alpha-trimmed median stack (10%)5) windowing
6) determination of resistance and error
Phase correction was applied to align the voltage time-series to therespective current time-series. As the underlying crosscorrelationcould easily produce sign switches, we continued with the absolutevalues of the apparent resistivities. Step four stacks the voltage time-series into 16-s cycles. The signal plateaus were then partitioned intotime windows for identification of polarization asymptotes. Error va-lues were estimated considering the voltage variation within the win-dows, as well as the voltage variation among the windows.Respecting the wide range of signal quality found in the stackedSD-ERT data, we estimate the average ratio of effective signal to ef-fective noise to be about 10, which yields an average S/N of about
20 dB. An example of representative field data is given in Figure 3.The pseudosections of the four SD-ERT surveys are shown inFigure 4. They allow for a first qualitative assessment with the fol-lowing major findings: First, the best S/N can be found for the sur-face-downhole readings (Figure 4, upper part). Second, apparent resistivities obtained by current injection at the inner circle(Figure 4, abscissa E01-E08) are, on average, slightly higher thanapparent resistivities with current injection at the outer circle(Figure 4, abscissa E09-E16). Third, an increase in resistivity over time can be seen for the electrodes that are deployed near the CO2
injector in Ktzi201. Fourth, the third repeat shows an increase inresistivity for the Ktzi202 electrodes 31–34. Fifth, Ktzi202 electro-des 38–45 show remarkably low values. Sixth, Ktzi200 electrode 11yields high apparent resistivities, which appears inconsistent with
the adjacent electrodes.
Quality assessment by means of contact resistance checks
Operation of the VERA and electrode arrays at similar depthsraises two questions: (1) Did any mechanical damage occur duringthe installation and (2) What is the operational lifetime?
The latter of these questions is determined by the reservoir con-ditions, which build an environment that is likely to cause metalcorrosion and embrittlement of the nonmetallic cable elements,and is not yet conclusively assessable. To track the degradationof the subsurface electrodes, resistance checks were carried out
Figure 3. Example of a SD-ERT voltage time-series (top) and cor-responding result after selective stacking (bottom).
B256 Bergmann et al.
Downloaded 12 Oct 2012 to 141.35.154.128. Redistribution subject to SEG license or copyright; see Terms of Use at http://segdl.org/

8/13/2019 2012 Bergmann Geoph
http://slidepdf.com/reader/full/2012-bergmann-geoph 5/15
before and during the CO2 injection. These checks measure the re-sistances between adjacent electrodes and use them simultaneouslyfor currents and voltages. Therefore, these checks are more sensitiveto the contact resistances than to reservoir resistivity and serve hereas an indicator of the condition of the electrodes and materials inclose contact (Figure 5). Resistance checks werefirst performed on a daily basis shortly before the
start of the CO2 injection, and continued withabout one measurement per week since Septem-ber 2008.
Figure 4 shows the conspicuous behavior of electrodes 39–45. In the following, we put someemphasis on them because they are an examplefor technical influences found in the SD-ERTdata. The pseudosections show very low valuesfor electrodes 39–45 (Figure 4), which seems tobe confirmed by the rather low values found inthe resistance checks (Figure 5). During the op-eration of the VERA system, we observed smallamounts of brine at the surface termination of the multiconductor cable. Further investigationshowed that this brine originated from the cablestrands of electrodes 39–45. We suppose that thebrine has penetrated the cable through a weak-ness of the insulation and has been moved up-ward by the subsurface overpressure. Figure 4shows this behavior to be present from the begin-ning of the resistance checks. We consider it possible that the cable insulation has been me-chanically damaged during the installation. Anabrasion might have opened a pathway for thebrine to enter the cable strands, which is plausi-ble because the strands for electrodes 39–45 areplaced adjacently within the cable. This damage
is further supposed to be located between electro-des 38 and 39, ultimately disconnecting the dee-per electrodes (>39). Subsequently, this couldhave created a short circuit, which would explainthe low resistivities observed in the SD-ERT dataand resistance checks. In conclusion, we decidedthe readings taken at electrodes 39–45, and for similar reasons, electrode 11, to be excludedfrom further processing.
Aside from these defects, the resistance checksallow us to draw some remarkable conclusionsregarding resistivity increases found in the SD-ERT data. First, contact resistances and SD-
ERT apparent resistivities display a steady in-crease for electrodes close to the CO2 injectionpoint (compare Figure 4 and Figure 5 at the ar-rows indicating the CO2 injection). Both obser-vations, although they reflect different effects(electrode degradation as opposed to a changein formation properties), are likely to be a con-sequence of the electrodes near the injectionpoint coming into contact with the CO2. Sec-ondly, we find an abrupt increase in apparent resistivity at the Ktzi202 electrodes 31–34(Figure 4). This increase appears with the third
SD-ERT repeat survey, whereas the previous surveys indicated low-er values at a relatively good repeatability. This abruptness becomesclearer in the resistance checks, which narrows the occurrence to thetime interval 18–25 March 2009. This agrees with the chemicallydetected CO2 arrival at this well on 21 March 2009.
Figure 4. Pseudosections showing the apparent resistivities of the SD-ERT surveys.Abscissa shows the location of current injection at the surface dipoles E01-E16(Figure 1). Ordinate shows the potential dipoles with the VERA electrodes 1–45(Figure 2) and surface dipoles E01-E16.
Resistance check - Survey number
Figure 5. Resistance checks (upper plot) shown for the timeline of injection (lower plot). Black dots in time line indicate the cumulative mass of injected CO2 (left ordi-nate), gray line shows the duration of injection in days (right ordinate). The lower plot isparameterized by the index of the resistivity check, which leads to a nonequidistant axisfor the dates. Specific choice of the color map reveals that electrodes 11 and 39–45 arecharacterized by rather low resistances, presumably since the installation.
SD-ERT monitoring of CO2 storage B257
Downloaded 12 Oct 2012 to 141.35.154.128. Redistribution subject to SEG license or copyright; see Terms of Use at http://segdl.org/

8/13/2019 2012 Bergmann Geoph
http://slidepdf.com/reader/full/2012-bergmann-geoph 6/15
We have developed the following working hypothesis for thisabrupt resistivity increase: Because there is no cementation inthe interval above the filter screens of Ktzi202 (Figure 2), the arriv-ing CO2 displaced the brine in the annulus. This, in turn, caused theelectrodes to lose contact with the formation, which the resistancechecks indicate to have happened for electrodes 31–34 shortly be-fore the third repeat survey. Further, we suppose the CO2 uptake to
have lasted a few weeks until having filled the annulus because theresistance checks stabilized at rather high levels within four to fivemeasurement cycles (Figure 5).
ERT inversion
Given that the vertical spacing of the VERA electrodes is in theorder of meters and the diameter of the outer electrode circle is inthe order of kilometers, the volume to be inverted covers a range of scales. Thus, we required a nonequidistant parametrization to allowfor efficient 3D inversions. To overcome these geometric con-straints, we apply the triple-grid inversion technique (Günther et al., 2006) provided by the open-source software package BERT(boundless electrical resistivity tomography, www.resistivity.net ).
BERT combines a finite-element forward operator (Rücker et al.,2006) and a Gauss-Newton algorithm with inexact line search
(Günther et al., 2006) and has been successfully applied in severalcase studies dealing with single-state, as well as time-lapse ERTdata sets (e.g., Heincke et al., 2010; Coscia et al., 2011).
To define the inversion domain, we constructed a volume with aside length of 5 km and a depth of 2 km. This cube has then beenpopulated with a parameter mesh of about 22,000 unstructured tet-rahedral cells using the noncommercial mesh generator TetGen
(Si, 2003). The resulting cell volumes were forced to be smallest near the electrodes and to coarsen toward the cube faces.Inversion parameters have been determined successively by run-
ning inversions for which single parameters were varied. Fromthese, we ascertain that the choices of the regularization parameter and the vertical roughness gradient weight have the largest impact on the inversion result. Large regularization parameters have thetendency to produce oversmoothed inversion results with poor datafits. Inversion with lower regularization parameters produce better data fits by means of increased model roughness. Finally, too weakregularizations generate mainly spurious structures. To foster thechoice, we ran additional inversion sequences with variant regular-ization. From these, we selected a realization for which the inver-sion achieved an acceptable error, produced a result that isconsistent with the preinversion data, and showed inverted resistiv-ities to be stable for a relatively wide range of realizations. Follow-ing these criteria, we selected the regularization parameter equal to20. We further assessed the choice of the regularization parameter by means of an L-curve analysis (Hansen and O’Leary, 1993;Figure 6). The inversion program aims to minimize the objectivefunction which considers the data misfit Φd and the model misfit Φm (Günther et al., 2006). Contributions of both misfits to the ob- jective function are balanced by the regularization parameter λ. Acommonly used L-curve criterion suggests the optimum regulariza-tion parameter to be found where the offset of the function Φd (Φm)to the origin is minimal (e.g., Aster et al., 2005). According to thiscriterion, we assess from Figure 6 a lower regularization parameter
of about 2.5 to be justified as well. However, we retained a regu-larization parameter of 20 because that resulted in a better continu-ity in the time-lapse images (i.e., resistivity ratios). This, of course,leads to larger values for the objective function and χ 2 (final valuesare in the range of 4.7 to 7.8). Nevertheless, the relevant features inthe resistivity images remain. The advantage of using stronger reg-ularization is a better stability in the resistivity ratios. This is mainlydue to the weakened impact of outliers, which can have a deterior-ating impact when adverse perturbations occur in the numeratorsand denominators of the resistivity ratios.
In our case, these low fits are partly attributed to the heteroge-neous coverage in the inversion volume. Large parts of the inversionvolume are being poorly covered by the acquisition geometry. At
some distance to the array, we do not expect to find a meaningfulresistivity image. This is reflected in the fact that the low-coverageparts of the inversion volume do not show significant resistivitychanges over time, which is principally acceptable.
The weight for vertical roughness gradients allows, to some ex-tent, the incorporation of knowledge about the degree of geologicstratification. It can be used to stimulate an anisotropic appearanceof the resulting resistivity image (e.g., Ellis and Oldenburg, 1994),which seems reasonable in view of the predominantly horizontallayering of the Ketzin reservoir. However, it will be shown later that the limited angle variation in the SD-ERT acquisition geometrycauses a directional trend in the sensitivity patterns. In consequence,
0 500 1000 1500
1
2
3
4
5
6
x 104
λ = 1
λ = 2
λ = 3. 9
8 λ =
7. 9 4
λ = 1 5
. 8 5 λ = 3 1
. 6 2 λ = 6
3. 1
λ = 1 2
5. 8 9
λ = 2 5
1. 1 9
λ = 5 0
1. 1 9
λ = 1 0
0 0
Model roughness Φ m
D a t a f i t Φ
d
100 101 102 103
103
104
105
Regularization parameter λ
O b j e c t i v e f u n c t i o n ; O f f s e t
Obj. function: Φ d
+λ .Φ m
Offset: (Φ d
2+Φ
m
2)0.5
a)
b)
Figure 6. (a) An L-curve for the inversion of the second baselinedata set and (b) L-curve parameters parameterized by the regular-ization. Circles indicate the solution for a regularization parameter of 20.
B258 Bergmann et al.
Downloaded 12 Oct 2012 to 141.35.154.128. Redistribution subject to SEG license or copyright; see Terms of Use at http://segdl.org/

8/13/2019 2012 Bergmann Geoph
http://slidepdf.com/reader/full/2012-bergmann-geoph 7/15
the sensitivity patterns already inherit an emphasis of lateralstructures in the inverted images. Because a further enhancement of this effect was not intended, we have opted for an almost isotro-pic roughness gradient. Although the code offers the definition of different regions with separate inversion parameters, we concen-trated on selecting a set of global inversion parameters with respect to the reservoir geology. Inversion parameters are summarized
in Table 1 and corresponding resistivity sections are shown inFigure 7 from which we make the following observations:
• Baseline 2: The east –west plane indicates a lower resistivityabove and below the storage reservoir (Figure 7a). Thenorth–south plane shows high resistances for Ktzi202(at electrode 37), possibly extending into the reservoir (Figure 7b and 7c).
• Repeat 1: Figure 7c shows, compared with the baseline im-age, a rather similar resistivity in line with a slight resistivitydecrease near the injector (Figure 7d).
• Repeat 2: A resistive structure appears centered at Ktzi201near the injector (Figure 7g).
• Repeat 3: The resistive structure at Ktzi201 shows a more
significant appearance (Figure 7j). A second strong resistiv-ity increase appears at the upper electrodes of Ktzi202(Figure 7k and 7l).
The model sensitivity, i.e., the Jacobi matrix containing the de-rivatives of the synthetic data with respect to changes in the modelcell resistivities, was recalculated after each iteration, which was themost time consuming part of the inversion. The time-lapse proce-dure consists of taking the baseline resistivity inversion as the initialmodel for the subsequent repeats. The final baseline model was ap-proached in five iterations, whereas the subsequent repeats modelsapproached their final states after three to four iterations. As thenumber of iterations per repeat data set was not constant, we
decided to keep the regularization fixed throughout the inversions.The initial model resistivity of the baseline was set to the median of the apparent resistivity of the field data, which is about 6.94 Ωm for the baseline data set.
We found that the incorporation of the data error, directly derivedfrom the time-series, is not desirable for the temporal stability of theinversion results. After testing different error schemes, we decided to
keep the data error as a threshold criterion for the individual readings.Unfortunately, due to the limited currents allowed for the boreholecables, it was not possible to realize reciprocal measurements, whichcould have been used for error estimation (e.g., Ramirezet al., 1996; LaBrecque et al., 2004). In consequence, we used anerror estimation suggested by Friedel (2003). This error estimationis based on the minimum resolvable voltage Umin, which is to be
known from equipment specifications and noise analysis of field data.Because the standard deviation usually increases as the measured vol-tage approaches Umin, readings become mainly random. This beha-vior is considered by an error drawn from the percentage ratio of theactual voltage and Umin, which is added to a percentage base-levelerror. Together with the data error drawn from the selective stackingand the electrode rejection based on the resistance checks, this esti-mated error is the third step in the data quality assessment.
INTERPRETATION
The resistivity increase at the injector is the most notable featurein Figure 7. This increase is generally consistent with the resistancechecks, except for the resistivity decrease in repeat 1, for which we
cannot provide a reasonable explanation yet. To the east, the resis-tivity increase can be traced to reach out to the observation wellKtzi200 (Figure 7g and 7h). To the west of Ktzi201 we find thissignature to smear out, which indicates that it is somewhat less re-solved outside the VERA.
The second resistive structure, appearing with the third repeat at Ktzi202, reflects the uptake of CO2 into the uncemented annulus (Fig-ure 7k and 7l). Because the annulus is a feature that is clearly belowthe resolution limit of the SD-ERT, we find its image as a spurioussignature of increased resistivity in the formation.
Generally, the resistivity image is strongly affected by sensitiv-ities that are related to the acquisition geometry. The typical sensi-tivity pattern of the SD-ERT arrangement is given in Figure 8a andappears as a tilted quadrupole with elongated cones. From this pat-tern, we find that the resolution is decreasing with distance toVERA electrodes, which makes imaging of thin-layered CO2 mi-gration at a distance of several electrode spacings unfeasible.
The data coverage is defined by the sum of the absolute sensi-tivities for all measurements (Figure 8b), and serves as a measurefor the information content of the individual model cells. Due to thesparse surface-electrode arrangement, we can observe relatively
Table 1. Parameters for mesh definition and inversion.
Parameter Setting Remark
Mesh definition:
Parameter mesh 5 km × 5 km × 2 km Inversion domain
Secondary mesh 20 km × 20 km × 10 km Forward modeling domain
Spatial growth rate of cells 1.12 BERT: Para3Dquality
Inversion:
Regularization strength ( λ) 20
λ decrease 1 Constant regularization
Z weight 0.9 Almost isotropic
Lower/upper resistivity bound 0.1∕2000 Ωm
SD-ERT monitoring of CO2 storage B259
Downloaded 12 Oct 2012 to 141.35.154.128. Redistribution subject to SEG license or copyright; see Terms of Use at http://segdl.org/

8/13/2019 2012 Bergmann Geoph
http://slidepdf.com/reader/full/2012-bergmann-geoph 8/15
poor coverages in the volume overlying the VERA. As the regionaround the VERA electrodes shows the best coverage, it shouldyield the best resolution in the inversion image.
Impact of the large-scale heterogeneities and reservoirintercalations
By comparison of SD-ERT data with well-logged resistivities(Figure 2), we found two inconsistencies. First, SD-ERT resistiv-ities (Figure 4) are, on average, one order of magnitude larger than
logged resistivities. Second, the baseline SD-ERT (Figure 7a)shows the reservoir to be a zone of increased resistivity.
To understand these observations, we investigated a conceptualmodel comprising 15 electrodes situated in the subsurface and twocurrent dipoles at the surface (Figure 9, left). The geometry waschosen to resemble the Ketzin SD-ERT setup with a single well.It further comprises the following elements: (a) a near-surface layer
representing quaternary deposits, (b) a horizontal layer representingthe K2 anhydrite, (c) a vertical layer embedding the well electrodesrepresenting a simplified well completion, and (d) a layer of 2-m
thickness representing a reservoir intercalationof cemented sandstone. The base model assumesa homogeneous resistivity of 2 Ωm for the back-ground and all elements. Each of the subsequent resistivity modelings were conducted with one of the elements perturbed and compared against theresults of the base model (Figure 9, right).
Model 1 investigates the impact of a near-sur-face layer that has its resistivity increased by afactor of 50. This factor was drawn from ashort-spread resistivity survey, in which wefound an average resistivity of about 100 Ωmup to a depth of 25 m. Corresponding syntheticapparent resistivities interestingly show a rather insignificant change. This lets us conclude that weathering-related moisture fluctuations in thenear-surface might be of minor importance tothe SD-ERT surveys, if they affect the surfacedipoles equally. Model 2 incorporates a deeper layer that mimics the K2 anhydrites. It leadsto a notable offset, shifting apparent resistivitiestoward smaller values. This offset seems to beincreasing with decreasing distance between cur-rent injection and well head, and leads to a reduc-
tion of the apparent background resistivity bymore than 50% in our model. The layer actsas a current barrier, which could be an explana-tion for the difference in SD-ERT resistivitieswith current injections performed at both cir-cle radii.
The simplified well completion of model 3 as-sumes a homogeneous concrete column of 200 Ω
m to be surrounding the electrodes. It leads todecreased resistivities at the top of the electrodearray and slightly increased resistivities at thebottom. The effect is somewhat asymmetric withrespect to the center of the downhole electrode
arrangement and shows a magnitude of roughly−25%. However, the transferability of model 3 tothe situation in Ketzin is limited due to the irre-gular completions of the Ketzin wells. We see aneed for further investigation of completion-re-lated effects following the approach of Doetschet al. (2010). Effects of damages to the externalcoating of the steel casings, facilitating conduc-tive coupling between the casing and the electro-des, need particular attention.
Model 4 incorporates a thin resistive layer be-tween electrodes 4 and 5. This model addresses
a) b) c)
d) e) f)
g) h) i)
j) k) l)
Figure 7. Inverted resistivity models for time-lapse SD-ERT data sets. The electrodenext to the CO2 injection is marked in (a). Black line shows the depth of top of theStuttgart Formation as interpreted from seismic investigations (Juhlin et al., 2007). East-ing and northing are referenced to Ktzi200. The main regions of resistivity increase aresituated at the CO2 injector (g and j) and in the upper part of Ktzi202 (k). The resistivezone at Ktzi202 is probably due to unsufficient contact of the respective electrodes to theformation (b, e, and h). Resistivity ratios for the observation plane Ktzi200/201 are givenin Figure 11.
B260 Bergmann et al.
Downloaded 12 Oct 2012 to 141.35.154.128. Redistribution subject to SEG license or copyright; see Terms of Use at http://segdl.org/

8/13/2019 2012 Bergmann Geoph
http://slidepdf.com/reader/full/2012-bergmann-geoph 9/15
reservoir intercalations of cemented sandstone of which at least three are present within the reservoir at Ktzi201 (Figure 2). Cemen-ted layers of the reservoir sandstone act not only as relatively re-sistive intervals in the resistivity logs (Figure 2), but are alsolow-permeability constraints to the fluid migration (Wiese et al.,2010). Apparent resistivities of model 4 show a strong but highly
localized increase with a maximum effect on the background resis-tivity of nearly þ100% at the voltage dipole measuring across thelayer. This, in turn, leads to the reservoir being imaged as an ap-parently resistive zone.
Although these models describe implications of resistive struc-tures that can realistically be expected in the geologic setting of
–200 –100 0 100 200 300
800
700
600
500
400
300
a)
– 0 . 2
– 0
. 2
0
0
0 . 2
0 . 2
0. 2
0 0
- 0 .2
0. 4
0. 4
0 .4
0 .4
- 0. 4
– 0 . 4
– 0 . 4
- 0. 4
0 . 6 0
. 6
- 0 . 6
- 0 . 6
0 . 8 0
. 8
– 0 . 8
- 0
. 8
Easting (m)
D e p t h ( m ) (+)
(+)
(–)
(–)
b)
Figure 8. (a) Sensitivity pattern of a dipole-dipole SD-ERT measurement near the electrodes (black dots) of well Ktzi200 and Ktzi201. (b) Slicethrough the coverage volume embedded in the inversion mesh. The bright central part of the slice shows the highest coverage region near theVERA electrodes (black dots). Note that the average cell volumes decreases towards the VERA electrodes, to generate a low cell density at theboundary of the volume.
Figure 9. Left: Conceptual model comprising two current injections at the surface, 15 subsurface electrodes (black dots), and elements a–dused for resistivity modeling. Geometry is not drawn to scale. Right: Apparent resistivities from forward modeling. Gray bar in model 4 showsthe voltage dipole which measures across the intercalation at a depth of 630 m.
SD-ERT monitoring of CO2 storage B261
Downloaded 12 Oct 2012 to 141.35.154.128. Redistribution subject to SEG license or copyright; see Terms of Use at http://segdl.org/

8/13/2019 2012 Bergmann Geoph
http://slidepdf.com/reader/full/2012-bergmann-geoph 10/15
the survey area, none of them can explain the consistently higher resistivity values compared to those found in the logs. We consider the likelihood that this observation is caused by the logging as rather low because the available logs are in good agreement, althoughbeing partly acquired by different logging operators. To evaluatepotential technical reasons, we acquired additional SD-ERT datawith different equipment, using a VIP10000 current transmitter
(IRIS instruments) and Earth Data logger (GFZ Potsdam), but founda resistivity range that is consistent with our initial data. Thus, weconsider it likely that the mismatch is a matter of the prospectedscale and possibly anisotropy. There are, unfortunately, only a
few references addressing the comparability of resistivity readingsmade on different spatial scales (e.g., Anderson et al., 1994; Jones,1995; Aggelopoulos et al., 2005). However, it is widely acceptedthat there are scale-dependent effects involved when comparingdata from well logs and surface-based surveys.
In the end, it is important to note that time-lapse application of SD-ERT surveying has the potential to reduce effects of static
background heterogeneities.
CO2 saturation estimation
Several petrophysical experiments have investigated the interde-pendence of CO2 saturation and electric resistivity for the sand-stones of the Ketzin reservoir (e.g., Schütt et al., 2005; Fleuryet al., 2010; Zemke et al., 2010). Kummerow and Spangenberg(2011) constituted a relation between resistivity increase and satura-tion of pure CO2 for the sandstone of the Ketzin reservoir (Figure 10), which will be used below.
Although the quantitative impact of the interfering effects is un-certain, we observe relative resistivity changes that appear consistent with these laboratory results. Thus, we use them to estimate the CO2
saturation and subsequently conduct a validation with CO2
saturations drawn from well logging. We follow the approach of Na-katsuka et al. (2010) by using the resistivity index (RI), i.e., the ratioof repeat resistivity and baseline resistivity. This approach requires noexplicit knowledge about Archie parameters except for the saturationindex n which is reported from laboratory experiments under in situconditions to be about 1.62 (Kummerow and Spangenberg, 2011).Resistivity indexes and CO2 saturation estimates for the observationplane Ktzi200/Ktzi201 are given in Figure 11.
1 10
0
0.2
0.4
0.6
0.8
C O 2
S a t u r a t i o n ,
S C O 2
Resistivity index, RI
S CO2
=1−RI−(1/ n )
Figure 10. Resistivity index versus CO2 saturation for the Ketzinreservoir sandstone modified after Kummerow and Spangenberg(2011). The solid line is plotted with n ¼ 1.62.
–
–
–
–
–
–
–
– –
– – – – – –
– –
–
–
–
–
–
a) b) c)
d) e) f)
Figure 11. Resistivity index (top row) and estimated CO2 saturation (bottom row) for the investigation plane Ktzi201/200. Dashed lines showthe spatial extent of the reservoir sandstones schematically. CO2 saturation estimation is constrained to the reservoir sandstones, for which thepetrophysical relation given in Figure 10 was used.
B262 Bergmann et al.
Downloaded 12 Oct 2012 to 141.35.154.128. Redistribution subject to SEG license or copyright; see Terms of Use at http://segdl.org/

8/13/2019 2012 Bergmann Geoph
http://slidepdf.com/reader/full/2012-bergmann-geoph 11/15
The resistivity indexes given in Figure 11 show a dominant re-sistivity increase in the upper part of Ktzi201. This increase has asimilar appearance as in Ktzi202 and, thus, might reflect proble-matic coupling conditions of the electrodes to the formation.
Due to this similarity, we consider it likely that CO2 penetrated intothe well annulus of Ktzi201. We will return to this issue in the sub-sequent comparison with logging results. The third repeat interest-ingly shows this increase to diminish, and further, a notable
Figure 12. Comparison of CO 2 saturations derived from SD-ERT and pulsed neutron-gamma measurements for the injection well Ktzi201(panels i–vi) and the observation well Ktzi200 (panels vii–xii). Panels show: Schematic well completion (i, vii), lithology after Förster et al.(2010) (ii, viii), resistivity ratio of baseline and repeated SD-ERT surveys (rat_r1, rat_r2, rat_r3 in iii, ix), SIGMA logs from baseline (b) andsecond repeat (r2) PNG runs (SIGM_b, SIGM_r2 in iv,x), porosities after Norden et al. (2010) (v, xi), and minimum and maximum scenarioCO2 saturations from PNG runs (S_RST_min, S_RST_max in vi, xii) overlain with the CO2 saturations from the third SD-ERT repeat (S_ERT_r3 in vi, xii). VERA electrodes are shown by black symbols in the schematic well completions.
SD-ERT monitoring of CO2 storage B263
Downloaded 12 Oct 2012 to 141.35.154.128. Redistribution subject to SEG license or copyright; see Terms of Use at http://segdl.org/

8/13/2019 2012 Bergmann Geoph
http://slidepdf.com/reader/full/2012-bergmann-geoph 12/15
resistivity increase in the sandstone interval. Corresponding CO2
saturations range from up to 30% for the first repeat, 30%–50%for the second repeat, to up to 70% for the third repeat.
Comparison with pulsed neutron-gamma logging
For a validation of the estimated CO2 saturations, we comparethem with results from time-lapse pulsed neutron-gamma (PNG)logging performed in the Ketzin wells. The PNG technique usescontrolled neutron bursts that interact with the nuclei of the sur-rounding borehole and formation. After elastic and inelastic scatter-ing, the neutrons are finally captured, mainly by hydrogen andchloride with a corresponding emission of gamma rays. The macro-scopic capture cross section, SIGMA (Σ), is given in capture units(c.u.) and derives from the temporal decline of gamma rays. Thehigh contrast of SIGMA between saline formation brine and gasesmakes the PNG technique well suited for detection of saturationchanges during CO2 injection in saline aquifers (Sakuraiet al., 2005).
Baseline PNG logging was conducted on 9–10 June 2008, andseveral repeat logs were subsequently acquired. All of these logging
runs were carried out with the Reservoir Saturation Tool (RST, Tra-demark of Schlumberger). For the purpose of this study, the secondrepeat run performed in June 2009 is evaluated because it is chron-ologically closest to the SD-ERT repeat 3. CO2 saturations based onthe PNG logs have been computed for a maximum scenario withstandard environmental corrections and a minimum scenario usingempirical corrections to consider the uncemented annuli. Details onthe saturation calculations and corrections are given in Ivanova et al.(2012). Maximum and minimum scenario CO2 saturations wereaveraged for a number of depth intervals that are compared against the CO2 saturation estimates of the SD-ERT (Figure 12).
In the Ktzi201 and 200 wells (Figure 12), the main reservoir sandstone interval is separated by an intercalation of cementedsandstone at a depth of about 643 m (Norden et al., 2010). The in-tercalation is characterized by low porosities and low SIGMAvalues during the baseline RST run (Figure 12, iv and x), and se-parates the sandstone interval in an upper and a lower compartment (denoted as A/D and B/E, respectively, in Figure 12), both with athickness of about 8–9 m.
For Ktzi201, PNG measurements yield CO2 saturations of 61%–
82% in the upper compartment (A), which compares to the range of 60%–70% estimated by the SD-ERT. In the lower compartment (B),PNG measurements yield CO2 saturations in the range of 43%–
58%. Corresponding CO2 saturations based on SD-ERT are inthe range of about 70%. Comparing the saturations derived fromboth methods, the SD-ERT appears to result in an overestimationhere. In general, the SD-ERT indicates a major saturation increase
to be situated within the lower compartment in contrast to the PNGlogs, which indicate most significant saturations to occur in theupper compartment. This discrepancy may be due to the individualdepth positions of the two electrodes (electrode 20 at 635 m depthand electrode 21 at 645 m depth) in the reservoir (Figure 12). Wefind electrode 21 to be situated relatively centered within the sand-stone reservoir. Compared to that, we find electrode 20 at a short distance below the caprock, which produces weaker resistivity ra-tios than an electrode that is centered in the sandstone interval. Wesuppose that this is the reason for the smaller CO2 saturation in theupper sandstone compartment compared to the lower compartment.There is a deeper interval in Ktzi201 (C) for which the PNG
measurements yield CO2 saturations in the range of 4%–23%. Thisinterval is, however, not recognizable in the resistivity ratios. Be-cause this can probably be attributed to the low thickness of thisinterval and the rather low CO2 saturations at this depth, it givessome indication about the detection threshold provided by theSD-ERT.
In Figure 11, we observed a significant resistivity increase at
Ktzi201 in the mudstone caprock at depths of about 600–
630 m.The PNG SIGMA measurements show systematic offset of about 2.4–7 c.u. between the baseline and repeat measurements within theuncemented interval above the reservoir section of both wells(Ktzi201 and Ktzi202). This is interpreted as an effect related toa buoyancy-driven displacement of brine by CO2 within these un-cemented intervals of the well annuli because the otherwise requireddisplacement within the mudstone caprock itself is physically not plausible at the given low effective porosities and permeabilities.The previous conclusions regarding the invasion of CO2 intoKtzi201 and Ktzi202 are therefore confirmed by the PNG mea-surements.
For Ktzi200, we find PNG-based CO2 saturations of 43%–58%in the upper sandstone compartment (D) and 10%–23% in the lower
compartment (E), respectively. Although there is a reasonablematch between the maximum values of the PNG logged CO2 sa-turations and the saturations estimated from SD-ERT, we findthe respective signature in the SD-ERT resistivity ratios to extendover a vertical distance of about 30 m (620–650 m). Under the as-sumption that the CO2 in the upper compartment dominates the re-sistivity increase, the vertical extent of this resistivity increase might be an indicator for the relatively low vertical resolution. Accord-ingly, we estimate the SD-ERT to provide a vertical resolutionof about three times the vertical electrode spacing. In contrast tothat, vertical resolution and penetration depth of the PNG logsare in the order of a few decimeters. In consequence, it appears at-tractive to address future work on the calibration of ERT-based CO2
saturations by the PNG measurements to gain saturation constraintsat some distance to the wells.
CONCLUSIONS
This article presents the acquisition, inversion, and interpretationof the SD-ERT experiments that were conducted for monitoring of the Ketzin CO2 storage pilot, Germany. We analyzed one baselinesurvey and three repeat surveys that were performed during the first year of site operation. Over the time of the three repeat surveys, theinjected CO 2 amounted to 0.6 kt, 4.5 kt, and 13.5 kt, respectively.SD-ERT acquisitions were carried out in a dipole-dipole configura-tion with 16 current injections arranged on two concentric circlescentered at the injection site. Current injections were performed at
the surface with simultaneous voltage acquisition at the surface aswell as downhole. Downhole voltages were measured using theVERA system, which provides 45 permanent electrodes withinthe injection well and two observation wells. Since the beginningof the CO2 injection routine contact resistance checks are being car-ried out regularly to monitor the technical integrity of the VERAsubsurface installations.
Inversion of the SD-ERT data was performed on an unstructuredtetrahedral mesh, which was a crucial prerequisite for an efficient handling of the inverse problem. This applies in particular becausethe model, with a lateral extent of several kilometers, is requiredto incorporate the VERA electrodes that represent an arrangement
B264 Bergmann et al.
Downloaded 12 Oct 2012 to 141.35.154.128. Redistribution subject to SEG license or copyright; see Terms of Use at http://segdl.org/

8/13/2019 2012 Bergmann Geoph
http://slidepdf.com/reader/full/2012-bergmann-geoph 13/15
on the 1–10 m scale. As of the second repeat survey, the invertedmodels image an increase in resistivity around the CO2 injector. Ananalysis of the lateral distribution of the resistivity increase indicatesa preferential CO2 migration in a northwesterly direction. We find aclear impact of the sensitivity patterns and consequential coveragein the resistivity images. There is a gradual decrease in sensitivityoutside the VERA volume, leading to a rather low-resolved resis-
tivity image at some distance to the wells.We further used the imaged resistivity changes to estimateCO2 saturations by means of the resistivity index method. This es-timation was based on an established petrophysical relation, the Ar-chie model, which was calibrated with lab data acquired under representative in situ conditions from the Ketzin reservoir sand-stone. For the third repeat survey, estimated CO2 saturationsshowed values of up to 70% near the injector, which was confirmedby a comparison with CO2 saturations obtained independently fromPNG logging.
Our investigations revealed the following three key issues con-cerning the reliability of the imaged resistivities. (1) The SD-ERTdata showed a moderate S/N. This was addressed by sequential ap-plication of a selective stacking approach to the voltage time-series,contact resistance checks, and incorporation of error weights in theinversion. (2) The Ketzin reservoir is characterized by a rather pro-nounced heterogeneity and features several thin highly resistivelayers of cemented sandstone. Due to their subhorizontal orienta-tion, they cause apparently high resistivities in the SD-ERT imageof the reservoir. The effects of selected background structures on theinversion results have been tested systematically with simple mod-els. Time-lapse imaging has the potential to largely reduce effects of such background heterogeneities. (3) Realization of the Ketzin wellcompletions was determined by the operational constraints. For in-stance, perforation of well casings after installation was not per-mitted due to uncontrollable risks for permanently installedinhole sensors. Therefore, a staged cementation procedure was con-
ducted to prevent clogging of the preperforated filter-screens. Inconsequence, the Ketzin wells comprise uncemented intervals that produced significant time-lapse signals in the SD-ERT data whenswept with CO2. Thus, it was possible to identify time-lapse sig-natures in Ktzi201 and Ktzi202, which can likely be explainedby CO2 occupying these parts of the annuli. For a more detailedinterpretation of the situation in Ktzi201, a comparison withPNG logs proved to be useful since providing information about the near-wellbore conditions.
We consequently underline three important aspects for practicalrealizations of deep ERT monitoring projects with downhole elec-trodes: (1) implementation of well completions that provide mini-mal irregularity, and (2) use of robust materials and installation
designs that resist the corrosive environment in brine and CO 2 sa-turated reservoirs over the lifetime of the monitoring project. (3) Werecommend additional quality controls for the electrodes, such asthe described resistance checks.
Beside these technical results, our study has shown that imaging of CO2 at the Ketzin site is possible by means of repeatedSD-ERT surveys with a satisfactory resolution and sensitivity. Adetailed analysis of the SD-ERT data sets showed not only itscapability of detecting CO2, but also, to some extent, reliable quan-tification of CO2 saturations. With respect to our rather sparse sur-vey layout, we see perspective improvement by the deployment of additional current dipoles, increased current dipole spacings,
surface-downhole current injections, and electrode installations inpotentially deviated wells.
Due to the abundance of aspects for the crosswell ERT surveys, it was not possible to give a comparison with the SD-ERT alreadyhere. It is, however, worth noting that surface-downhole surveyingis a particular option for situations where broad azimuth coverage isdemanded or only single wells are available. The use of perma-
nently installed downhole electrodes proved to be crucial to achievesufficient coverage and resolution at the target reservoir. Further-more, the VERA realization of such electrodes at the Ketzin sitehas proved to offer diverse opportunities for alternative geoelectricand electromagnetic surveys. In this regard, we see a promising per-spective in the collaboration of frequently repeated crosshole ERTand periodical SD-ERT. Moreover, there is multiple potential for integration of SD-ERT results with other monitoring methods. Inthis context, we will address continuing investigations on a com-bined interpretation with the time-lapse seismic data acquired at the Ketzin site, as well as the incorporation of seismic structuralconstraints into the SD-ERT inversion.
Based on the presented outcomes and the practical experiencegained at the Ketzin site, we consider SD-ERTas a promising meth-
od that can contribute to monitoring of CO2 storages within a suiteof geophysical methods. Finally, there is a potential for SD-ERT tobe an easily applicable supplement to borehole ERT, which is alsoof interest for monitoring of other subsurface fluid migration pro-cesses that lead to sufficient resistivity changes.
DATA ACCESS
The presented SD-ERT data can be retrieved from 10.2312/GFZ.b103-12,051.1 and further technical descriptions at Labitzke et al.(2012). Here, one will find the raw field data (voltage time-series),the preprocessed data (apparent resistivities), and the scripts that were used for processing and inversion of the data.
ACKNOWLEDGMENTS
We express thanks to the landowners for permitting access totheir properties. We are also grateful to the many people involvedin the surveys, in particular Erik Danckwardt, Roland Hohberg,Martin Seidel, Günter Petzold, Marco Pohle, and René Voigt of Leipzig University. Kay Krüger (GFZ) is acknowledged for valu-able technical comments and Birgit Schöbel (GFZ) for support in operational and logistic matters. Dat Vu-Hoang and Karl Schwab(Schlumberger) are acknowledged for their cooperation on the in-terpretation of the PNG logging data. We thank the reviewers (Oli-ver Kuras and two anonymous reviewers) for their constructive
criticism that helped to improve this paper.We would like to thank all partners of the Ketzin project for their
continued support and contributions. The project CO2SINK and itsfollow-up CO2MAN receive their funding from the European Com-mission (Sixth Framework Program, FP6), two German ministries— the Federal Ministry of Economics and Technology (COORE-TEC Program) and the Federal Ministry of Education and Research(GEOTECHNOLOGIEN Program) — as well as from industrypartners. We acknowledge the COSMOS project for funding theVERA system. The first author would like to thank the GeoEn pro- ject (Grant 03G0671A/B/C), a national scientific initiative in thefield of energy research.
SD-ERT monitoring of CO2 storage B265
Downloaded 12 Oct 2012 to 141.35.154.128. Redistribution subject to SEG license or copyright; see Terms of Use at http://segdl.org/
8/13/2019 2012 Bergmann Geoph
http://slidepdf.com/reader/full/2012-bergmann-geoph 14/15
REFERENCES
Aggelopoulosa, C., P. Klepetsanisa, M. A. Theodoropouloub, K. Pomonic,and C. D. Tsakiroglou, 2005, Large-scale effects on resistivity index of porous media: Journal of Contaminant Hydrology, 77, 299–323, doi: 10.1016/j.jconhyd.2005.02.002.
al Hagrey, S. A., 2011, 2D optimized electrode arrays for borehole resistivitytomography and CO2 sequestration modelling: Pure and Applied Geophy-sics, 1–10, doi: 10.1007/s00024-011-0369-0.
Anderson, B., I. Bryant, M. Lülig, B. Spies, and K. Helbig, 1994, Oilfieldanisotropy: Its origins and electrical characteristics: Oilfield Review, 6,no. 4, 48–56.
Arts, R., J. Meekes, J. Brouwer, M. van der Werf, R. Noorlandt, B. Paap, W.Visser, V. Vandeweijer, S. Lüth, R. Giese, and J. Maas, 2011, Results of amonitoring pilot with a permanent buried multicomponent seismic arrayat Ketzin: Energy Procedia, 4, 3588–3595, doi: 10.1016/j.egypro.2011.02.288.
Aster, R. C., C. H. Thurber, and B. Borchers, 2005, Parameter estimationand inverse problems: Academic Press Inc.
Beutler, G., and E. Nitsch, 2005, Paläographischer Überblick, in G. Beutler,N. Hauschke, E. Nitsch, and U. Vath, eds., Stratigraphie von DeutschlandIV, Keuper: Courier Forschungsinstitut Senckenberg, 253, 15–30.
Brunner, I., S. Friedel, F. Jacobs, and E. Danckwardt, 1999, Investigation of a tertiary maar structure using 3-D resistivity imaging: Geophysical Jour-nal International, 136, 771–780, doi: 10.1046/j.1365-246x.1999.00770.x.
Carrigan, C. R., A. L. Ramirez, R. L. Newmark, R. Aines, and S. J.Friedmann, 2009, Application of ERT for tracking CO2 plume growthand movement at the SECARB Cranfield site: Presented at the 8th Annual
Conference on Carbon Capture and Sequestration.Cassiani, G., V. Bruno, A. Villa, N. Fusi, and A. M. Binley, 2006, A salinetrace test monitored via time-lapse surface electrical resistivity tomogra-phy: Journal of Applied Geophysics, 59, 244–259, doi: 10.1016/j.jappgeo.2005.10.007.
Christensen, N. B., D. Sherlock, and K. Dodds, 2006, Monitoring CO2
injection with crosshole electrical resistivity tomography: ExplorationGeophysics, 37, 38–42, doi: 10.1071/EG06044.
Clément, R., M. Descloitres, T. Günther, L. Oxarango, C. Morra, J.-P.Laurent, and J.-P. Gourc, 2010, Improvement of electrical resistivity to-mography for leachate injection monitoring: Waste Management, 30,452–464, doi: 10.1016/j.wasman.2009.10.002.
Coscia, I., S. A. Greenhalgh, N. Linde, J. Doetsch, L. Marescot, T. Günther,T. Vogt, and A. G. Green, 2011, 3D crosshole ERT for aquifer character-ization and monitoring of infiltrating river water: Geophysics, 76, no. 2,G49–G59, doi: 10.1190/1.3553003.
Daily, W., A. Ramirez, A. Binley, and D. LaBrecque, 2004, Electrical re-sistance tomography: The Leading Edge, 23, 438–442, doi: 10.1190/1.1729225.
Doetsch, J. A., I. Coscia, S. A. Greenhalgh, N. Linde, A. G. Green, and T.Günther, 2010, The borehole-fluid effect in electrical resistivity imaging:Geophysics, 75, no. 4, F107–F114, doi: 10.1190/1.3467824.
Ellis, R., and D. Oldenburg, 1994, Applied geophysical inversion: Geophy-sical Journal International, 116, 5–11, doi: 10.1111/gji.1994.116.issue-1.
Fleury, M., and H. Deschamps, 2008, Electrical conductivity and viscosityof aqueous NaCl solutions with dissolved CO2: Journal of Chemical andEngineering Data, 53, 2505–2509, doi: 10.1021/je8002628.
Fleury, M., S. Gautier, N. Gland, P. Boulin, B. Norden, and C. Schmidt-Hattenberger, 2010, Petrophysical measurements for CO2 storage: Appli-cation to the Ketzin site: International Symposium of the Society of CoreAnalysts, SCA2010-06, p. 12.
Förster, A., B. Norden, K. Zinck-Jørgensen, P. Frykman, J. Kulenkampff, E.Spangenberg, J. Erzinger, M. Zimmer, J. Kopp, G. Borm, C. Juhlin, C.Cosma, and S. Hurter, 2006, Baseline characterization of the CO 2SINKgeological storage site at Ketzin, Germany: Environmental Geosciences,13, 3, 145–161, doi: 10.1306/eg.02080605016.
Förster, A., R. Schöner, H.-J. Förster, B. Norden, A.-W. Blaschke, J.
Luckert, G. Beutler, R. Gaupp, and D. Rehde, 2010, Reservoir character-ization of a CO 2 storage aquifer: The upper Triassic Stuttgart Formationin the northeast German Basin: Marine and Petroleum Geology, 27,2156–2172, doi: 10.1016/j.marpetgeo.2010.07.010.
Friedel, S., 2003, Resolution, stability and efficiency of resistivity tomogra-phy estimated from a generalized inverse approach: Geophysical JournalInternational, 153, 305–316, doi: 10.1046/j.1365-246X.2003.01890.x.
Giese, R., J. Henninges, S. Lüth, D. Morozova, C. Schmidt-Hattenberger, H.Würdemann, M. Zimmer, C. Cosma, and Ch. Juhlin, CO 2SINK Group2009, Monitoring at the CO2SINK site: A concept integrating geophysics,geochemistry and microbiology: Energy Procedia, 1, 2251–2259, doi: 10.1016/j.egypro.2009.01.293.
Girard, J. F., N. Coppo, J. Rohmer, B. Bourgeois, V. Naudet, and C.Schmidt-Hattenberger, 2011, Time-lapse CSEM monitoring of the Ketzin(Germany) CO2 injection using 2 MAM configuration: Energy Procedia,4, 3322–3329, doi: 10.1016/j.egypro.2011.02.253.
Günther, T., C. Rücker, and K. Spitzer, 2006, Three-dimensional modellingand inversion of DC resistivity data incorporating topography II. Inver-sion: Geophysical Journal International, 166, 506–517, doi: 10.1111/ gji.2006.166.issue-2.
Hansen, P. C., and D. P. O’Leary, 1993, The use of the L-curve in the reg-ularization of discrete ill-posed problems: SIAM Journal on ScientificComputing, 14, 1487–1503, doi: 10.1137/0914086.
Heincke, B., T. Günther, E. Dahlsegg, J. S. Rønning, G. Ganerød, and H.Elvebakk, 2010, Combined three-dimensional electric and seismictomography study on the Åknes rockslide in western Norway: Journal
of Applied Geophysics, 70, no. 4, 292–
306, doi: 10.1016/j.jappgeo.2009.12.004.IPCC, B. Metz, O. Davidson, H. C. de Coninck, M. Loos, and L. Meyer,
eds., 2005, IPCC special report on carbon dioxide capture and storage:Working group III of the intergovernmental panel on climate change:Cambridge University Press.
Ivanova, A., A. Kashubin, N. Juhonjuntti, J. Kummerow, J. Henninges, Ch.Juhlin, S. Lüth, and M. Ivandic, 2012, Monitoring and volumetric estima-tion of injected CO2 using 4D seismic, petrophysical data, core measure-ments and well logging: A case study at Ketzin, Germany: GeophysicalProspecting, 60, 1–17, doi:10.1111/j.1365-2478.2012.01045.x.
Jones, J. W., 1995, Scale-dependent resistivity measurements of Oraclegranite: Geophysical Research Letters, 22, 1453–1456, doi: 10.1029/ 95GL01495.
Juhlin, C., R. Giese, K. Zinck-Jørgensen, C. Cosma, H. Kazemeini, N. Ju-hojuntti, S. Lüth, B. Norden, and A. Förster, 2007, 3D baseline seismics at Ketzin, Germany: The CO 2SINK project: Geophysics, 72, no. 5, B121–132, doi: 10.1190/1.2754667.
Kazemeini, S. H., C. Juhlin, K. Zinck-Jørgensen, and B. Norden, 2009, Ap-
plication of the continuous wavelet transform on seismic data for mappingof channel deposits and gas detection at the CO 2SINK site, Ketzin, Ger-many: Geophysical Prospecting, 57, 111–123, doi: 10.1111/gpr.2008.57.issue-1.
Kemna, A., B. Kulessa, and H. Vereecken, 2002, Imaging and characterisa-tion of subsurface solute transport using electrical resistivity tomography(ERT) and equivalent transport models: Journal of Hydrology, 267, 125–146, doi: 10.1016/S0022-1694(02)00145-2.
Kiessling, D., C. Schmidt-Hattenberger, H. Schütt, F. Schilling, K. Krüger,B. Schöbel, E. Danckwardt, and J. Kummerow, the CO 2SINK Group,2010, Geoelectrical methods for monitoring geological CO2 storage:First results from cross-hole and surface-downhole measurementsfrom the CO2SINK test site at Ketzin (Germany): International Journalof Greenhouse Gas Control, 4, 816–826, doi: 10.1016/j.ijggc.2012.05.001.
Kummerow, J., and E. Spangenberg, 2011, Experimental evaluation of theimpact of the interactions of CO2 − SO2, brine, and reservoir rock on pet-rophysical properties: A case study from the Ketzin test site, Germany:Geochemistry Geophysics Geosystems, 12, Q05010, doi: 10.1029/ 2012GC003469.
Labitzke, T., P. Bergmann, D. Kiessling, and C. Schmidt-Hattenberger,2012, 3D surface-downhole electrical resistivity tomography data setsof the Ketzin CO2 storage pilot from the CO2SINK project phase: Scien-tific Technical Report — Data, 12/05, doi: 10.2312/GFZ.b103-12051.
LaBrecque, D. J., G. Heath, R. Sharpe, and R. Versteeg, 2004, Autonomousmonitoring of fluid movement using 3D electrical resistivity tomography:Journal of Environmental and EngineeringGeophysics, 9, no. 3, 167–176,doi: 10.4133/JEEG9.3.167.
Martens, S., A. Liebscher, F. Möller, H. Würdemann, F. Schilling, and M.Kühn, , Ketzin Group, 2011, Progress report on the first European on-shore CO2 storage site at Ketzin (Germany) — Second year of injection:Energy Procedia, 4, 3246–3253, doi: 10.1016/j.egypro.2011.02.243.
Nakatsuka, Y., Z. Xue, H. Garcia, and T. Matsuoka, 2010, Experimentalstudy on CO2 monitoring and quantification of stored CO2 in salineformations using resistivity measurements: International Journal of Greenhouse Gas Control, 4, 209–216, doi: 10.1016/j.ijggc.2010.01.001.
Nimmer, R. E., J. L. Osiensky, A. M. Binley, K. F. Sprenke, and B. C. Wil-liams, 2007, Electrical resistivity imaging of conductive plume dilution infractured rock: Hydrogeology Journal, 15, 877–890, doi: 10.1007/ s10040-007-0159-z.
Norden, B., A. Förster, D. Vu-Hoang, F. Marcelis, N. Springer, and I. Le Nir,2010, Lithological and petrophysical core-log interpretation in CO2SINK,The European onshore research storage and verification project: SPE Re-servoir Evaluation and Engineering, 13, 179–192, doi: 10.2118/115247-PA.
Prevedel, B., L. Wohlgemuth, B. Legarth, J. Henninges, H. Schütt, C.Schmidt-Hattenberger, B. Norden, A. Förster, and S. Hurter, 2009,The CO2SINK boreholes for geological CO2-storage testing: Energy Pro-cedia, 1, 2087–2094.
Ramirez, A., W. Daily, A. Binley, D. LaBrecque, and D. Roelant, 1996, De-tection of leaks in underground storage tanks using electrical resistance
B266 Bergmann et al.
Downloaded 12 Oct 2012 to 141.35.154.128. Redistribution subject to SEG license or copyright; see Terms of Use at http://segdl.org/

8/13/2019 2012 Bergmann Geoph
http://slidepdf.com/reader/full/2012-bergmann-geoph 15/15
methods: Journal of Environmental and Engineering Geophysics, 1,189–203, doi: 10.4133/JEEG1.3.189.
Ramirez, A., W. Daily, D. LaBrecque, E. Owen, and D. Chesnut, 1993,Monitoring an underground steam injection process using electrical-resis-tance tomography: Water Resources Research, 29, 73–87, doi: 10.1029/ 92WR01608.
Ramirez, A. L., R. L. Newmark, and W. D. Daily, 2003, Monitoring carbondioxide floods using electrical resistance tomography (ERT): Sensitivitystudies: Journal of Environmental and Engineering Geophysics, 8, no. 3,187–208, doi: 10.4133/JEEG8.3.187.
Rücker, C., T. Günther, and K. Spitzer, 2006, Three-dimensional modellingand inversion of DC resistivity data incorporating topography I. Model-ing: Geophysical Journal International, 166, 495–505, doi: 10.1111/gji.2006.166.issue-2.
Sakurai, S., T. S. Ramakrishnan, A. Boyd, N. Mueller, and S. Hovorka,2005, Monitoring saturation changes for C O2 sequestration: Petrophysi-cal support of the Frio brine pilot experiment: Presented at the 46thAnnual Logging Symposium Transactions, SPWLA.
Schilling, F. R., G. Borm, H. Würdemann, F. Möller, and M. Kühn,CO2SINK Group, 2009, Status report on the first Europeanon-shore CO2 storage site at Ketzin (Germany): Energy Procedia, 1,2029–2035.
Schmidt-Hattenberger, C., P. Bergmann, D. Kiessling, K. Krüger, C. Rücker,and H. Schütt, CO2SINK Group, 2011, Application of a verticalelectrical resistivity array (VERA) for monitoring CO2 migration at the Ketzin site: First performance evaluation: Energy Procedia, 4,3363–3370.
Schütt, H., M. Wigand, and E. Spangenberg, 2005, Geophysical and geo-chemical effects of supercritical CO2 on sandstones, in D. C. Thomas, and
S. Benson, eds., Carbon dioxide capture for storage in deep geologic for-mations-results from the CO2 capture project: Elsevier, 767–786, doi: 10.1016/B978-008044570-0/50133-1.
Schütze, C., and Ch. Flechsig, 2002, Structural investigation of an activehydrothermal system beneath the Long Valley Caldera, California, using
DC-resistivity imaging methods: Zeitschrift für Geologische Wis-senschaften, 30, 119–129.
Si, H., 2003, TETGEN: A 3D delaunay tetrahedral mesh generator, http:// tetgen.berlios.de, accessed 01 December 2010.
Slater, L., A. M. Binley, W. Daily, and R. Johnson, 2000, Crosshole elec-trical imaging of a controlled saline tracer injection: Journal of AppliedGeophysics, 44, no. 2–3, 85–102, doi: 10.1016/S0926-9851(00)00002-1.
Storz, H., W. Storz, and F. Jacobs, 2000, Electrical resistivity tomography toinvestigate geological structures of the earth’s upper crust: GeophysicalProspecting, 48, 455–471, doi: 10.1046/j.1365-2478.2000.00196.x.
Streich, R., M. Becken, U. Matzander, and O. Ritter, 2011, Strategies for land-based controlled-source electromagnetic surveying in high-noise re-gions: The Leading Edge, 30, 1174–1181, doi: 10.1190/1.3657078.
Wiese, B., J. Böhner, C. Enachescu, H. Würdemann, and G. Zimmermann,2010, Hydraulic characterisation of the Stuttgart Formation at the pilot test site for CO2 storage, Ketzin, Germany: International Journal of Greenhouse Gas Control, 4, 960–971, doi: 10.1016/j.ijggc.2010.06.013.
Würdemann, H., F. Möller, M. Kühn, G. Borm, and F. Schilling, CO2SINK-Group, 2010, The field-laboratory for CO2 storage “CO2SINK” at Ketzin(Germany): Site preparation, baseline surveys and the first year of opera-tion: International Journal of Greenhouse Gas Control, 4, 938–951.
Xue, Z., J. Kim, S. Mito, K. Kitamura, and T. Matsuoka, 2009, Detectingand monitoring CO2 with P-wave velocity and resistivity from both la-boratory and field scales: SPE International Conference on CO2 Capture,Storage and Utilization, SPE 126885.
Zemke, K., A. Liebscher, and M. Wandrey, CO2SINK Group, 2010, Petro-physical analysis to investigate the effects of carbon dioxide storage in asubsurface saline aquifer at Ketzin, Germany (CO2SINK): InternationalJournal of Greenhouse Gas Control, 4, 990–999, doi: 10.1016/j.ijggc
.2010.04.008.Zimmer, M., J. Erzinger, and C. Kujawa, CO2SINK-Group, 2011, The gasmembrane sensor (GMS): A new method for gas measurements in deepboreholes applied at the CO2SINK site: International Journal of Green-house Gas Control, 5, 995–1001, doi: 10/1016/j/ijggc.2010.11.007.
SD-ERT monitoring of CO2 storage B267