2010 12 th Annual REAP Meeting October 15, 2010 Four Seasons, Landisville, PA 2010 12 th Annual REAP...
113
2010 2010 12 12 th th Annual REAP Annual REAP Meeting Meeting October 15, 2010 October 15, 2010 Four Seasons, Landisville, PA Four Seasons, Landisville, PA REG’s new office
-
Upload
jamari-wilber -
Category
Documents
-
view
213 -
download
0
Transcript of 2010 12 th Annual REAP Meeting October 15, 2010 Four Seasons, Landisville, PA 2010 12 th Annual REAP...

201020101212thth Annual REAP Meeting Annual REAP Meeting
October 15, 2010October 15, 2010
Four Seasons, Landisville, PAFour Seasons, Landisville, PA
REG’s new office

AgendaAgenda IntroIntro The Economy…what in the world?The Economy…what in the world? Energy Market UpdateEnergy Market Update BreakBreak REAP Performance REAP Performance Demand Side Response Demand Side Response Technologies and LightingTechnologies and Lighting Act 129 ImplementationAct 129 Implementation PUC/Regulatory IssuesPUC/Regulatory Issues AwardsAwards LunchLunch Golf-Scramble FormatGolf-Scramble Format

Refer a Friend PrizesRefer a Friend Prizes
Most Referrals = IPadMost Referrals = IPad
Other Referral prizes:Other Referral prizes:$200 Lowes Gift Card$200 Lowes Gift Card$50 Ticketmaster Gift Card$50 Ticketmaster Gift Card$50 Sheetz Gas Card$50 Sheetz Gas Card

Refer a FriendRefer a Friend
There’s still time! But not muchThere’s still time! But not muchYellow Sheets in your packetYellow Sheets in your packetMust turn in yellow sheets before our mid-Must turn in yellow sheets before our mid-
morning break is overmorning break is over

Meet Richards Energy Group (REG)Meet Richards Energy Group (REG) StaffStaff
Pete RichardsPete Richards Tina GentzlerTina Gentzler Mike FreyMike Frey Steph BaylorSteph Baylor Lew KneppLew Knepp Michele LeabhartMichele Leabhart Travis KeeneyTravis Keeney Greg SteinmetzGreg Steinmetz
Study TeamStudy Team Don HornungDon Hornung Al NeunerAl Neuner Ed BrignoleEd Brignole Bob AbbatoBob Abbato
Andrew FritzAndrew Fritz Linda UlmerLinda Ulmer Victor WueschinskiVictor Wueschinski Charlie GoedkenCharlie Goedken Gary GearhartGary Gearhart Mary RichardsMary Richards Frank RichardsFrank Richards
AdvisorsAdvisors Bob CookBob Cook Jeff DoaneJeff Doane

Platinum SponsorsPlatinum Sponsors
Direct EnergyDirect EnergyCustomized Energy SolutionsCustomized Energy SolutionsConstellation New EnergyConstellation New Energy
Silver SponsorsSilver SponsorsPPL Energy PlusPPL Energy PlusLiberty PowerLiberty Power

Contributing SponsorsContributing Sponsors
Amelia’s: Gift CardAmelia’s: Gift Card Brenneman Enterprises: Bowling Brenneman Enterprises: Bowling
Party for 10Party for 10 RW Connection: Tool Kit and hatRW Connection: Tool Kit and hat PPL+: JacketPPL+: Jacket Fulton Financial: BillfoldFulton Financial: Billfold Constellation: Jacket, Shirts, LED Constellation: Jacket, Shirts, LED
solar flashlightssolar flashlights

The Economy_ What’s Going On?The Economy_ What’s Going On?
Tom WeberTom WeberSr. VP Fulton Financial AdvisorsSr. VP Fulton Financial Advisors

Economic and Market Insights
G. Thomas WeberSenior Vice President
October 15, 2010717 291-2556

General Themes
Economy stable but fragile Not typical recession – lower interest rates
are ineffective Consumer challenged – Employment,
housing, slowed by thrift and productivity Too much capacity – Inflation or deflation?

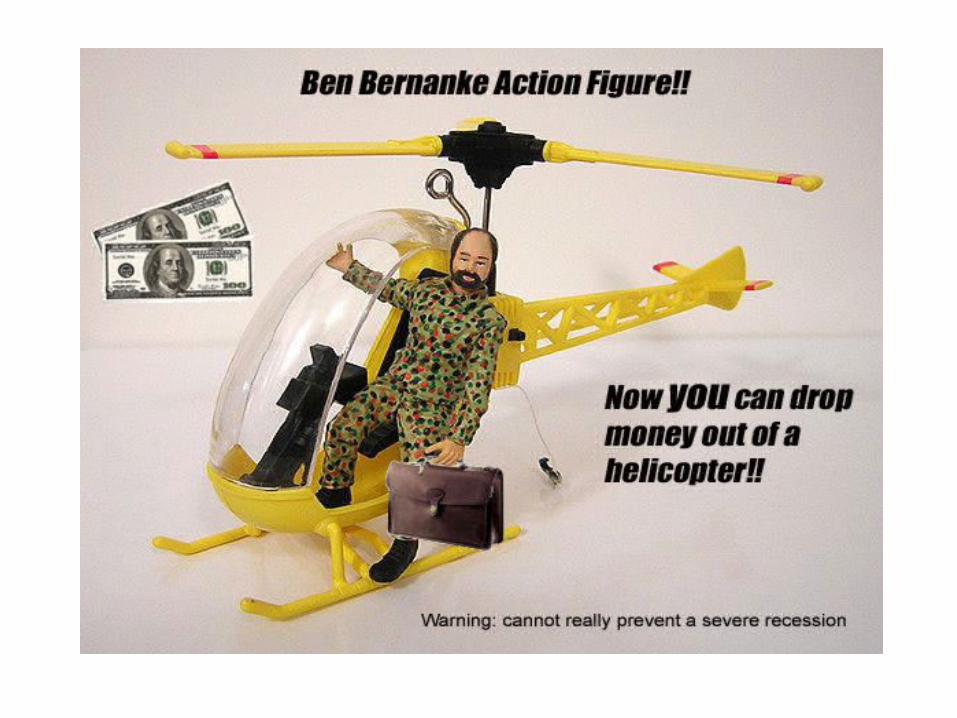
“Like gold, US dollars have value only to the extent that they are strictly limited in supply. But the US government has a technology, called a printing press (or today, its electronic equivalent) that allows it to produce as many US dollars as it wishes at essentially no cost. By increasing the number of US dollars in circulation, or even by credibly threatening to do so, the US government can also reduce the value of a dollar in terms of goods and services, which is equivalent to raising the prices in dollars of those goods and services. We conclude that, under a paper-money system, a determined government can always generate higher spending and hence positive inflation.”
-Ben S. Bernanke, FED GovernorNovember 21, 2002
Before the National Economists Club, Washington, DC“Deflation: Making Sure “It” Doesn’t Happen Here”

1943-1965 1974-1999 2003-2007
Real GDP 4.3% 3.2% 2.7%Ave Ann Growth Rate
Indus. Production 4.9% 2.7% 2.0%Av Ann % Change
Capacity Utilization 90.0% 81.5% 81.0%end of period
Unemployment 4.9% 6.5% 5.2%
Personal Sav Rate 8% 4.40% 0.40%ave last third
Fed Budget Deficit 0 120 billion 300 billionave annual
Debt % of GDP 150% 270% 340%
Household Debt 59% 80% 114%% personal Income
Source: Elliott Wave, FED Reserve, NDR
Key Economic Measures
1.2
3.2 3.6
2.1
-0.7
1.5
-2.7
-5.4-6.4
-0.7
2.2
5.9
3.7
1.6
-8
-6
-4
-2
0
2
4
6
Q107
Q207
Q307
Q407
Q108
Q208
Q308
Q408
Q109
Q209
Q309
Q409
Q110
Q210
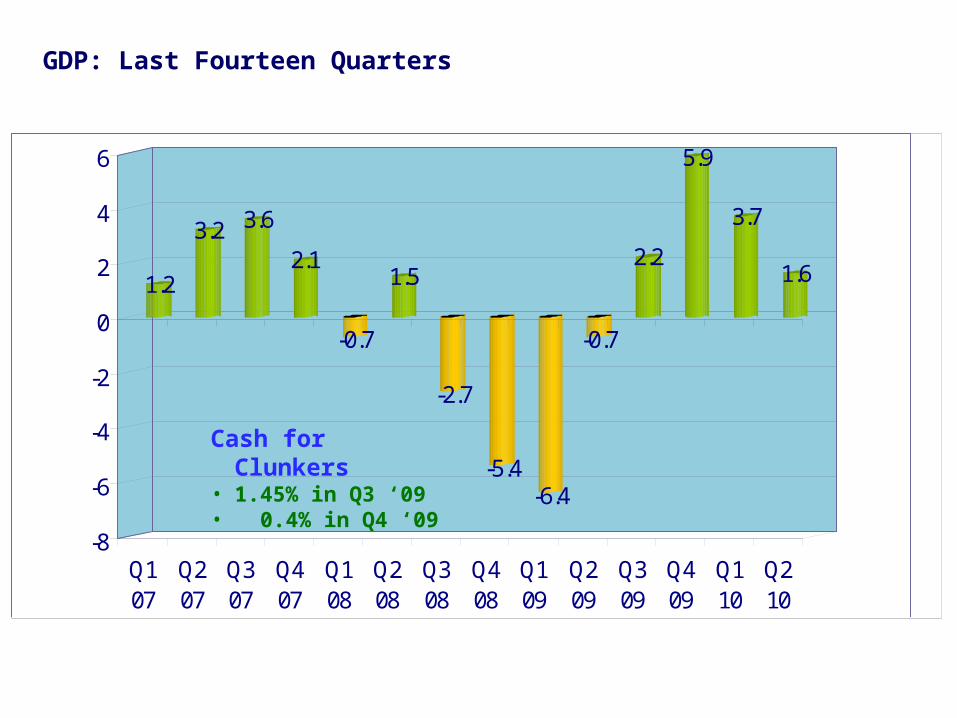
GDP: Last Fourteen Quarters
Cash for Clunkers• 1.45% in Q3 ‘09• 0.4% in Q4 ‘09

1.2
3.2 3.6
2.1
-0.7
1.5
-2.7
-5.4-6.4
-0.7
0.75
5.5
3.7
1.6
-8
-6
-4
-2
0
2
4
6
Q107
Q207
Q307
Q407
Q108
Q208
Q308
Q408
Q109
Q209
Q309
Q409
Q110
Q210
GDP: Last Fourteen Quarters – Ex. Cash for Clunkers
Cash for Clunkers• 1.45% in Q3 ‘09• 0.4% in Q4 ‘09
Change in Private Inventories• .7% in Q3 ’09• 3.9% in Q4 ‘09• 1.7% in Q1 '10

1.2
3.2 3.6
2.1
-0.7
1.5
-2.7
-5.4-6.4
-0.70.1
1.6 2.01.0
-8
-6
-4
-2
0
2
4
6
Q107
Q207
Q307
Q407
Q108
Q208
Q308
Q408
Q109
Q209
Q309
Q409
Q110
Q210
GDP: Last Fourteen Quarters – Ex. Cash for Clunkers and Inventory
Change in Private Inventories• .7% in Q3 ’09• 3.9% in Q4 ‘09• 1.7% in Q1 '10
Cash for Clunkers• 1.45% in Q3 ‘09• 0.4% in Q4 ‘09


Institutional Sales Material. Not to be reproduced or distributed to the public.Source: Ned Davis Research
Past performance is no guarantee of future results
164%1929 Stock Market
Top
260%1933 when FDR devalued
U.S. Dollar 40%
268%2000 Stock Market
Peak
370%As of 9/30/09
Sep
-09


Quarterly Data 3/31/1957 - 9/30/2009
(DAVIS131)
9/30/2009 = 51.4%
52.75-Year Mean = 100.3%
556065707580859095
100 105 110 115 120 125 130 135 140 145 150 155 160 165 170 175
556065707580859095
100 105 110 115 120 125 130 135 140 145 150 155 160 165 170 175
9/30/2009 Debt = $52. 6 Trillion9/30/2009 GDP = $14. 2 Trillion
= 369.4%
144.7
158.2
Data Subject To Revisions ByThe Federal Reserve Board
52.75-Year Mean = 205.3%
140
160
180
200
220
240
260
280
300
320
340
360
140
160
180
200
220
240
260
280
300
320
340
360
1960 1965 1970 1975 1980 1985 1990 1995 2000 2005
Nominal GDP (Ten-Year % Change)
Total Credit Market Debt (All Sectors) as a % of GDP
Chart has been modified.
Copyright 2010 Ned Davis Research, Inc. Further distribution prohibited without prior permission. All Rights Reserved. . www.ndr.com/vendorinfo/ . For data vendor disclaimers refer to www.ndr.com/copyright.htmlSee NDR Disclaimer at
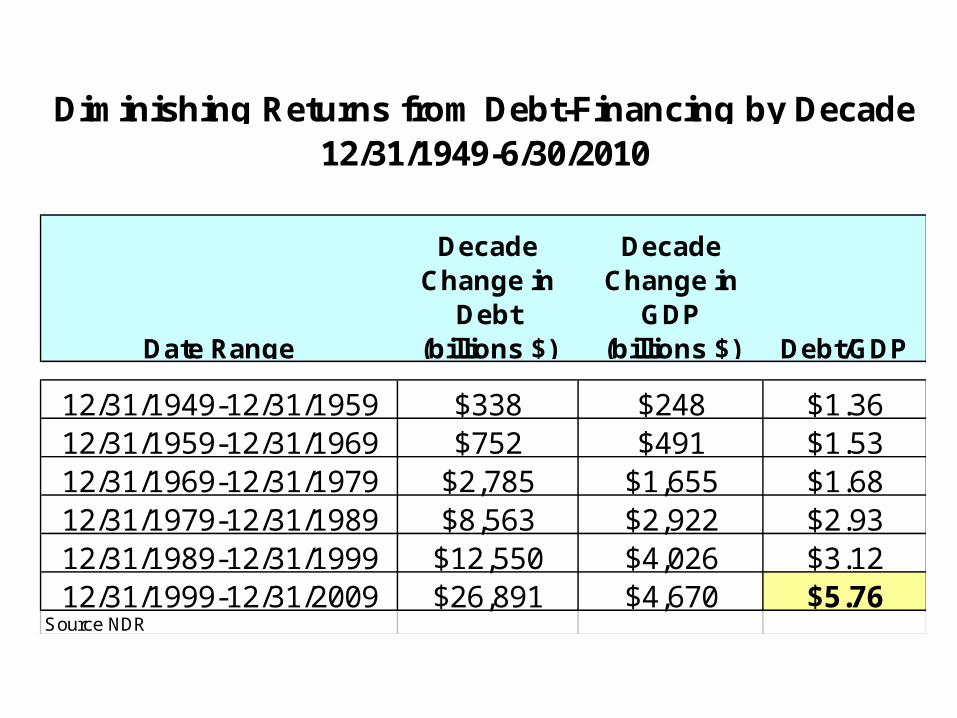
Diminishing Returns from Debt-Financing by Decade12/31/1949-6/30/2010
Date Range
Decade Change in
Debt (billions $)
Decade Change in
GDP (billions $) Debt/GDP
12/31/1949-12/31/1959 $338 $248 $1.3612/31/1959-12/31/1969 $752 $491 $1.5312/31/1969-12/31/1979 $2,785 $1,655 $1.6812/31/1979-12/31/1989 $8,563 $2,922 $2.9312/31/1989-12/31/1999 $12,550 $4,026 $3.1212/31/1999-12/31/2009 $26,891 $4,670 $5.76
Source NDR
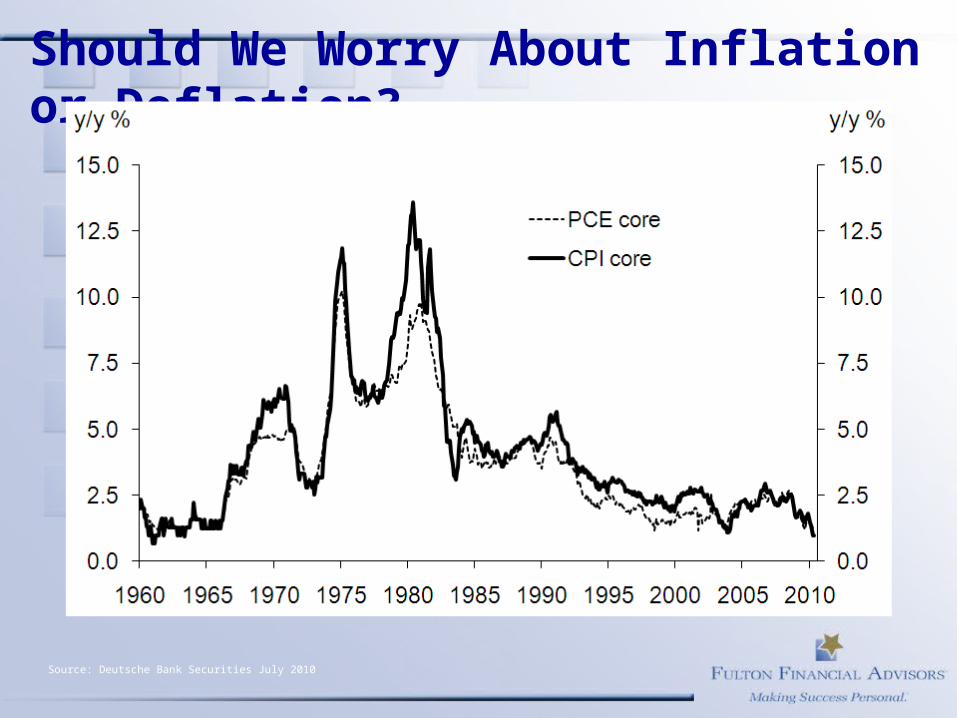
Should We Worry About Inflation or Deflation?
Source: Deutsche Bank Securities July 2010


(E0028A)
Monthly Data 6/30/2007 - 9/30/2011
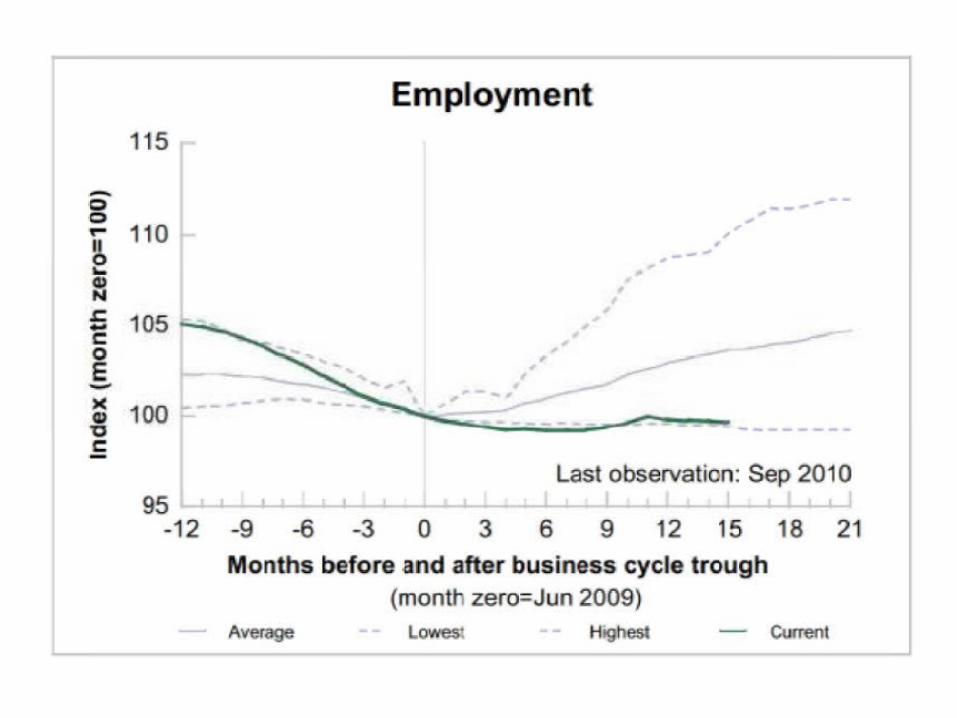
*Dates used for determining economic expansionsare those designated by the National Bureau ofEconomic Research. The data has been adjustedfor ease of comparison with the current cycle.Expansion starting dates used: November 1970, March 1975, July 1980, November 1982, March 1991, and November 2001.
Recession ended in June 2009.
Current Expansion ( )
2001 Expansion ( )
1991 Expansion ( )
Average of Last Six Post World War II Expansions*
( )
"Jobless Recoveries"
99.2
99.4
99.6
99.8
100.0
100.2
100.4
100.6
100.8
101.0
101.2
101.4
101.6
101.8
102.0
102.2
102.4
102.6
102.8
103.0
103.2
103.4
103.6
103.8
104.0
104.2
104.4
104.6
104.8
105.0
105.2
105.4
105.6
99.2
99.4
99.6
99.8
100.0
100.2
100.4
100.6
100.8
101.0
101.2
101.4
101.6
101.8
102.0
102.2
102.4
102.6
102.8
103.0
103.2
103.4
103.6
103.8
104.0
104.2
104.4
104.6
104.8
105.0
105.2
105.4
105.6
S D 2008
M J S D 2009
M J S D 2010
M J S D 2011
M J S
Performance of Nonfarm Payrolls vs 1991, 2001 and Average of Last Six Expansions
Copyright 2010 Ned Davis Research, Inc. Further distribution prohibited without prior permission. All Rights Reserved. . www.ndr.com/vendorinfo/ . For data vendor disclaimers refer to www.ndr.com/copyright.htmlSee NDR Disclaimer at

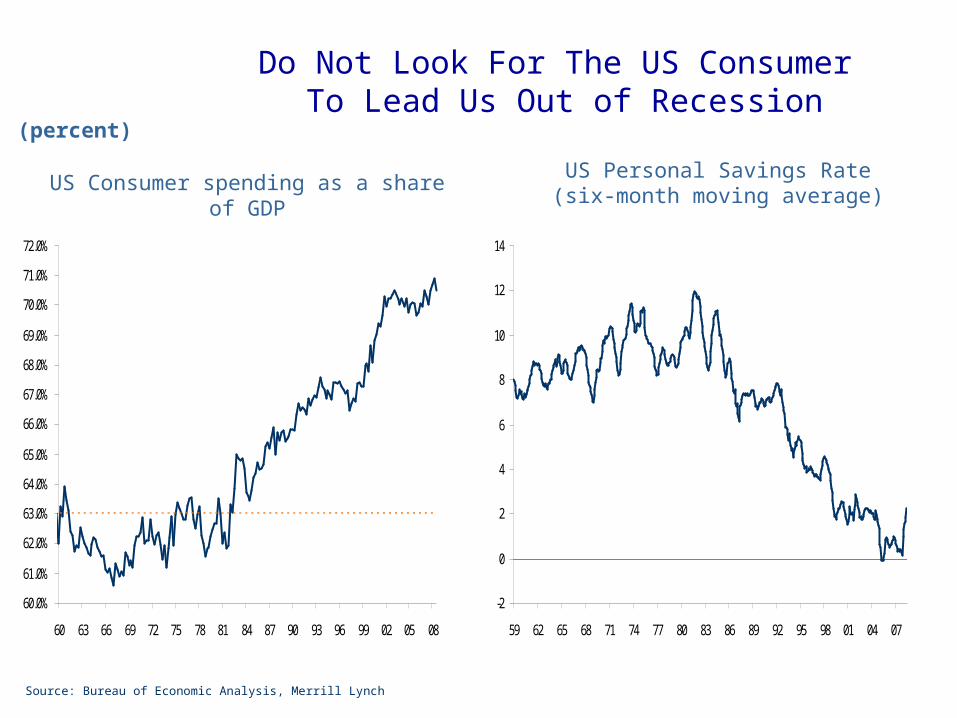
Source: Bureau of Economic Analysis, Merrill Lynch
Do Not Look For The US Consumer To Lead Us Out of Recession
60.0%
61.0%
62.0%
63.0%
64.0%
65.0%
66.0%
67.0%
68.0%
69.0%
70.0%
71.0%
72.0%
60 63 66 69 72 75 78 81 84 87 90 93 96 99 02 05 08
-2
0
2
4
6
8
10
12
14
59 62 65 68 71 74 77 80 83 86 89 92 95 98 01 04 07
US Consumer spending as a share of GDP
US Personal Savings Rate(six-month moving average)
(percent)

Valuations are Not Cheap

Monthly Data 12/31/1924 - 9/30/2010 (Log Scale)
(S702A)
8/31/1929 = 86.6%
6/30/1932 = 26.6%
11/30/1936 = 71.6%
4/30/1942 = 19.4%
12/31/1965 = 72.4%
11/30/1968 = 76.6%1/31/1973 = 79.8%
9/30/1974 = 36.4%
7/31/1982 = 32.3%
10/31/1990 = 43.8%
3/31/2000 = 168.8%
Very Undervalued
Overvalued
Bubble Territory
NDR Estimated value of 4100 U.S. common stocks: $13. 34 trillionU.S. Gross Domestic Income (latest figure): $14. 40 trillionCurrent ratio for 9/30/2010 (solid line): 92. 6 %
GDP used prior to December 1946 (NDR Estimates prior to December 1928)Gross Domestic Income used after December 1946
Calculation uses NDR Estimated Common Stock Market Capitalization of U.S.-based Companies Dow Jones Total Stock Market Capitalization used from January 1973 through September 1980
NYSE Market Capitalization used prior to January 1973
20
22
24
26
28
31
34
37
40
44
48
53
58
63
69
75
82
90
98
108
118
129
141
154
168
20
22
24
26
28
31
34
37
40
44
48
53
58
63
69
75
82
90
98
108
118
129
141
154
168
19
25
19
30
19
35
19
40
19
45
19
50
19
55
19
60
19
65
19
70
19
75
19
80
19
85
19
90
19
95
20
00
20
05
20
10
Stock Market Capitalization as a Percentage of Gross Domestic Income
Copyright 2010 Ned Davis Research, Inc. Further distribution prohibited without prior permission. All Rights Reserved. . www.ndr.com/vendorinfo/ . For data vendor disclaimers refer to www.ndr.com/copyright.htmlSee NDR Disclaimer at

Leading Indicator Warns


Consumers Have Lots of Cash

Companies Have Lots of Cash

US: We’ve Already Lost A Decade
Source: Strategas, January 2010 CAGR=Compound Annual Growth Rate.Past Performance is no guarantee of future results. This chart is for illustrative purposes only and is not representative of any specific investment.

You are Here
Source: Strategas, March 2010

High Dividends Worked During Japan’s Lost Decades
Source: RBC Capital Markets, Kenneth R. FrenchPast performance is no guarantee of future results. This chart is for illustrative purposes only and is not representative of performance for any specific investment. There are no guarantees that
dividend paying stocks will continue to pay dividends. In addition, dividend paying stocks may not experience the same capital appreciation potential as non-dividend paying stocks.

What to Do? Old Normal -- Stay the course New Normal - 5 ways to approach new
normal– Diversify (correlations different)– Lower equity exposure because of higher risk– Introduce alternatives– Emphasize High Quality stocks, high dividends– Use Prudent Bear Fund (negative correlation)
Disclaimer:The opinions expressed are those of the presenter and not necessarily the opinion of Fulton Financial Advisors. Investments and returns mentioned are not reflective of any specific account or fund. Information is believed to be reliable but is not guaranteed.

Energy Market UpdateEnergy Market Update
John BodineJohn Bodine Info provided by Direct Energy Info provided by Direct Energy

44
NYMEX Natural Gas Prompt Month

45
Energy Market Correlations – 2011 Gas versus Power
$4
$5
$6
$7
$8
$9
$10
$11
$45
$55
$65
$75
$85
$95
$105
$115
May-06 Nov-06 May-07 Nov-07 May-08 Nov-08 May-09 Nov-09 May-10
$/M
Mb
tu
$/M
Wh
PJM PPL Zone On-Peak PJM PECO Zone On-Peak NYMEX Natural Gas

46
PJM Generation Stack
Installed CapacityCoal 41.0%
Natural Gas 29.0%
Nuclear 18.5%
Oil 6.6%
Hydroelectric 4.4%
Other 0.5%
Total 100.0%
15-20% of coal plants are more than 40 years old.
Increased coal versus gas competition due to:
• Low natural gas prices
• Increased regional gas supply
• Cleaner emissions from gas plants
• Gas plants have greater dispatch flexibility

47
Energy Market Correlations – Oil versus Gas

48
Current Price Environment
Natural Gas Correlations– Strong and consistent correlation with electricity prices all markets
– Weak correlation with oil and related products
Wholesale energy is the largest component of total energy costs– Largest and most volatile compared to adders and T&D
Ongoing low price environment– Sustained prompt natural gas futures prices below $6.00 for first time since
2001 – 2003
– Long-term prices also posting new lows despite premium
49
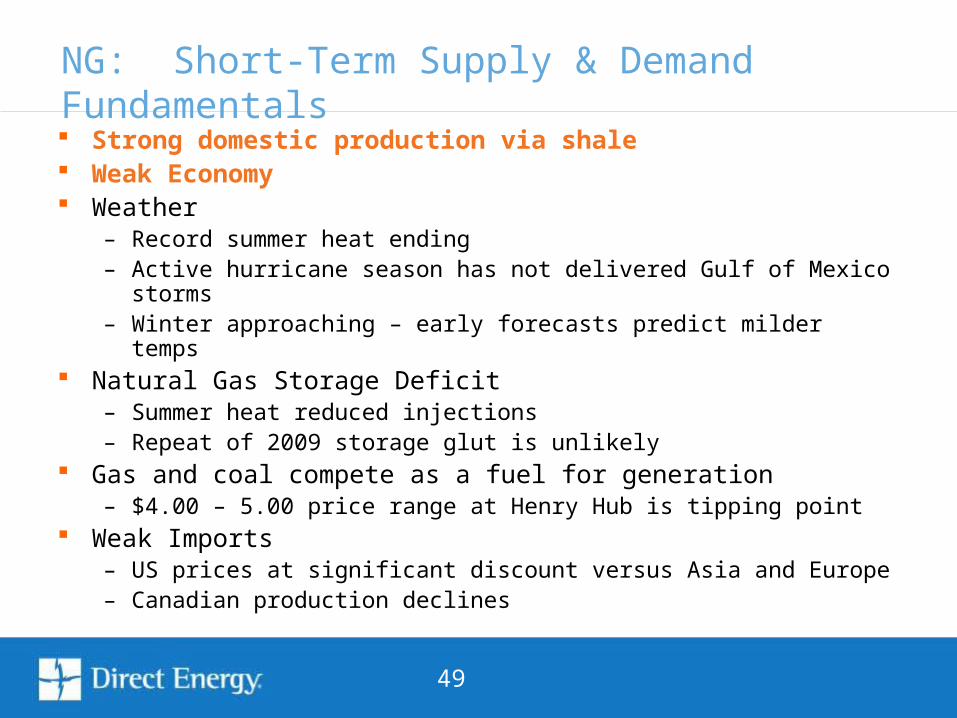
Strong domestic production via shale Weak Economy Weather
– Record summer heat ending– Active hurricane season has not delivered Gulf of Mexico storms– Winter approaching – early forecasts predict milder temps
Natural Gas Storage Deficit– Summer heat reduced injections– Repeat of 2009 storage glut is unlikely
Gas and coal compete as a fuel for generation– $4.00 – 5.00 price range at Henry Hub is tipping point
Weak Imports– US prices at significant discount versus Asia and Europe– Canadian production declines
NG: Short-Term Supply & Demand Fundamentals

50
U.S. Natural Gas Storage Inventories
1,000
1,500
2,000
2,500
3,000
3,500
4,000
Jan-10 Mar-10 May-10 Jul-10 Sep-10 Nov-10
Working Storage This Year (2010) Working Gas Stock Last Year (2009) 5-Year Average (2005-2009)
Current inventory through 9/24/10 = 3,340 Bcf-4.1% below one year ago.6.7% above 5-year average.
Source: E.I.A.

51
0
200
400
600
800
1,000
1,200
1,400
1,600
1,800
Previous Year (08-09) Currrent Year (09-10)
Source: Baker Hughes
Rig count up 35% versus a year ago.
Drilling slowdown due to low prices: U.S. Gas Rig Count is down slightly since April 2010 (973 to 962 rigs).
Natural Gas Rig Count
Rig count basics:Measure of drilling activity for additional supplies.Depends on viable supply opportunities (geology) and market economics.Usually lags the market price.

52
Horizontal Rig Count
0
100
200
300
400
500
600
700
800
900
1,000
Previous Year (08-09) Currrent Year (09-10)
Source: Baker Hughes
Rig count up 106% versus a year ago.
Shale Drilling continues to increase dramatically despite low prices

53
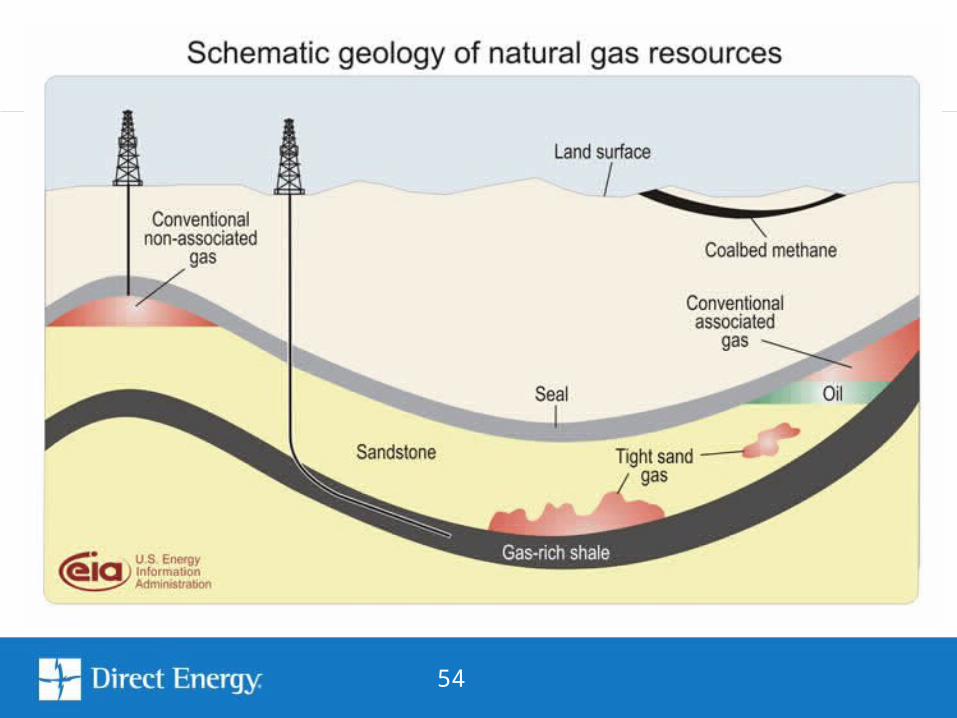
54

55
US Natural Gas Supplies
-
10.0
20.0
30.0
40.0
50.0
60.0
70.0
2007 2012 2017 2022 2027 2032
Bcf
per
day
Crude Associated Conventional Shale Gas Coalbed Methane
Lower 48 Offshore Alaska Canada LNG
Source: EIA Annual Energy Outlook 2010 - Early Release
Shale increases from 7% of US supply in 2007 to 12% in 2010 to 20% in 2020.
Conventional and offshore production are currently 59% of US Supply and remain above 50% through 2035.
Shale production is increasing, but conventional supplies will remain majority of North American supply for the long-term.
56
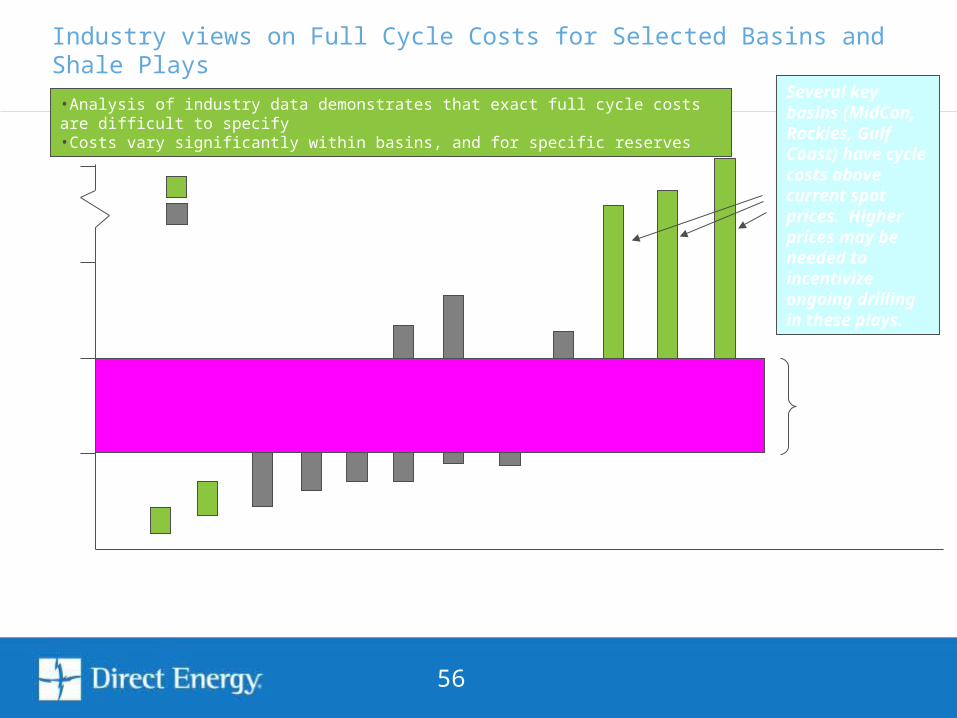
Industry views on Full Cycle Costs for Selected Basins and Shale Plays
4
6
8
12
West
Co
ast
US
Asso
ciated
Gas O
ffsho
re/Gu
lf C
oast
Barnett
Marcellu
s*
Hayn
esville
Ro
ckies
Mid
C
on
tinen
t
Wo
od
ford
Eag
le F
ord
**
Ho
rn
River
Fayettevil
le
*Based on very limited data, compared to size of play** inclusion of oil revenues reflects economics but not true gas cost
Sources: IHS/CERA, Woodmac, Ross Smith, ScotiaWaterous, Company reports, DE analysis
Current range within which forward HH curve is trading
•Analysis of industry data demonstrates that exact full cycle costs are difficult to specify•Costs vary significantly within basins, and for specific reserves
Conventional gasShale gas
$/m
mb
tu
Several key basins (MidCon, Rockies, Gulf Coast) have cycle costs above current spot prices. Higher prices may be needed to incentivize ongoing drilling in these plays.

57
LNG (Liquified Natural Gas)– Potential for additional supply due to record growth (+26%) in
international LNG capacity during 2010
– US import capacity 10 - 12 Bcf/day and growing
– Henry Hub at a severe discount vs. National Balancing Point (NBP)
– Summer imports fallen to near 1.0 Bcf/day
Canadian Pipeline Imports– Exports to U.S. peaked at 9.76 Bcf/Day in 2003
– 2010 exports averaging 6.5 Bcf/Day
– Declines due to:
• Geology – mostly conventional supply (vertical)
• Resource depletion
• Steep Provincial Royalties
Natural Gas Imports

58
All periods have recently posted all-time lows– Strong domestic supply– Weak economy
Contango Forward Curve Key risk #1 – Supply
– Reduced drilling incentive due to low prices - despite rapid growth, shale gas is less than 25% of US supply while the bulk of US supply has higher finding costs.
– Reduced imports– Shale production is also vulnerable to low prices, accelerated depletion rates,
and environmental & tax regulations Key risk #2 – Demand
– US market is currently demand challenged due to weak industrial demand– Growth and “greening” of the US economy could increase US demand for natural
gas Key risk #3 – Surprises
– Geopolitical events– Impact of equity and currency market trading and speculation
Long-Term Price Trends

59
Market Outlook
Bearish Bearish supply outlook due to Shale Slow recovery by economy
Bullish Non-shale production declines Disappointing Imports Coal versus gas competition
Wildcards Storage inventories Winter Weather Financial market impacts

60
Wholesale Power Price Analysis
Conclusions Forward prices remain near all-time lows. Forward prices for all terms have sustained huge declines since July 2008.
All prices in $ per MWh and represent wholesale price component only.
The Current Percentile represents the percentage of days during the reference period in which the market prices has been below the current price.
Transaction Point: PJM PPL Zone, ATC
Data Range
From: 9/5/2007 9/5/2007 10/8/2008
To: 10/5/2010 10/5/2010 10/5/2010
2011 2012 2013
Current Price $43.89 $46.93 $49.79
Current Percentile 1.3% 2.4% 3.0%
Minimum Price $43.48 $45.68 $48.03
Date of Minimum 9/28/10 9/28/10 9/28/10
Maximum Price $94.49 $95.33 $74.53
Date of Maximum 7/2/08 7/2/08 10/8/08
25th Percentile $53.81 $55.97 $52.69
50th Percentile $62.46 $65.38 $60.00
75th Percentile $72.88 $73.92 $67.24

61
$30
$40
$50
$60
$70
$80
$90
$100
$110
Jan Feb Mar Apr May Jun Jul Aug Sep Oct Nov Dec
$ p
er
MW
h
2011 FWD 2010 DA 2009 DA 2008 DA 5-Yr Avg DA
2011 Forwards versus Historical Day-Ahead Prices
PPL Zone

62
Energy prices have been trending lower with little volatility for almost two years.
Reasons not to buy– Longer term prices are higher than near-term
– Bearish natural gas supply outlook due to shale production
– Prevailing trend of price declines since mid-2008
– Weak day-ahead prices
But to ignore the risks in the energy markets is a mistake
Reasons customers are not buying

63
1. Historically low prices2. Reduced Long-Term price premium3. Winter weather risk4. Domestic supply risks due to low prices5. Environmental & tax risks to shale drilling6. Weak imports via LNG and Canada7. Potential for economic recovery8. Comparison of Forward versus Index Prices9. Risk of market volatility10.Difficulty in timing a market bottom
Balance business considerations with market considerations to form a strategy
Top 10 Reasons to Buy Energy Now

15 minute Break15 minute Break
Get your Referral sheet returnedGet your Referral sheet returnedVisit Sponsor TablesVisit Sponsor TablesCoffee/continental breakfast/mid-morning Coffee/continental breakfast/mid-morning
snacksnack

REAP ReportREAP Report
446 Members (+180)446 Members (+180)1,561 Electric Meters 1,561 Electric Meters $90 Million of electric bills$90 Million of electric bills$6 million Shopping Savings year to date$6 million Shopping Savings year to date$65,000 non-shopping Found Savings year $65,000 non-shopping Found Savings year
to dateto date$1+ million non-shopping Ongoing Savings $1+ million non-shopping Ongoing Savings

Fall 2009 ApproachFall 2009 Approach
Layered Blended PoolLayered Blended Pool500 million KWH500 million KWH
Fixed Price or Block and IndexFixed Price or Block and Index200 million KWH200 million KWH

Gas Prompt Month, 2000-2010Gas Prompt Month, 2000-2010

Market ShiftMarket Shift

Fall 2010 ApproachFall 2010 Approach
Market has shifted dramatically downwardMarket has shifted dramatically downward7 year lows on futures market7 year lows on futures marketFixed price contracts result in 28 month Fixed price contracts result in 28 month
price stability at historic lowsprice stability at historic lows
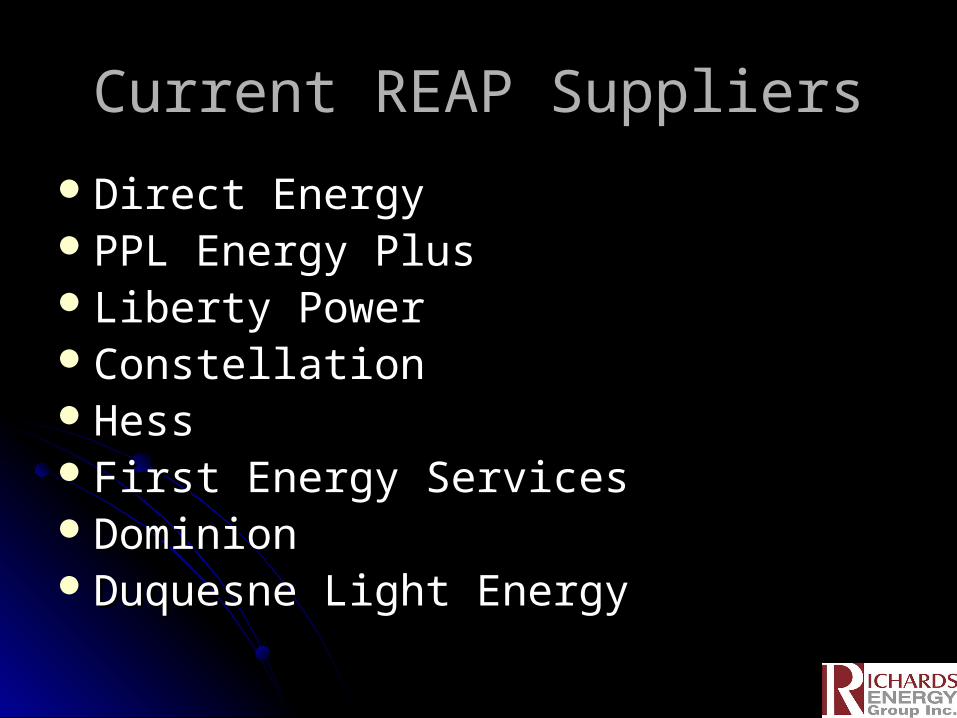
Current REAP SuppliersCurrent REAP Suppliers
Direct EnergyDirect EnergyPPL Energy PlusPPL Energy PlusLiberty Power Liberty Power ConstellationConstellationHessHessFirst Energy ServicesFirst Energy ServicesDominionDominionDuquesne Light EnergyDuquesne Light Energy

PPL REAP Pool to DatePPL REAP Pool to Date
MONTHMONTH Pool AveragePool Average PPL POLR (GS)PPL POLR (GS)
JanuaryJanuary 8.80 cents/kwh8.80 cents/kwh 9.97 cents/kwh9.97 cents/kwh
FebruaryFebruary 8.87 cents/kwh8.87 cents/kwh 9.97 cents/kwh9.97 cents/kwh
MarchMarch 8.43 cents/kwh8.43 cents/kwh 9.97 cents/kwh9.97 cents/kwh
AprilApril 8.45 cents/kwh8.45 cents/kwh 9.97 cents/kwh9.97 cents/kwh
MayMay 8.51 cents/kwh8.51 cents/kwh 9.97 cents/kwh9.97 cents/kwh
JuneJune 8.94 cents/kwh8.94 cents/kwh 9.97 cents/kwh9.97 cents/kwh
JulyJuly 9.70 cents/kwh9.70 cents/kwh 9.97 cents/kwh9.97 cents/kwh
AugustAugust 9.04 cents/kwh9.04 cents/kwh 9.97 cents/kwh9.97 cents/kwh
SeptemberSeptember 8.54 cents/kwh8.54 cents/kwh 9.97 cents/kwh9.97 cents/kwh
October (thru 10/7)October (thru 10/7) 8.28 cents/kwh8.28 cents/kwh 9.97 cents/kwh9.97 cents/kwh

Pool Performance To DatePool Performance To Date
Blended YTD average = 8.80 Cents/kwh $4,000,000 Dollars saved YTD Over 150 Wholesale Purchases made

Fixed Price Performance-PPLFixed Price Performance-PPL
Price range 8.2-9.7Price range 8.2-9.7Most in 9.1-9.6 rangeMost in 9.1-9.6 range10.4 PTC10.4 PTC

Price to ComparePrice to Compare
Becoming ExtinctBecoming ExtinctUtilities moving to Utilities moving to
QuarterlyQuarterlyMonthly Monthly or Hourly pricing or Hourly pricing

Price to Compare - PPLPrice to Compare - PPL
Rate Class2010 2011
Jan-May2011
Jun-Aug
Estimated 10/5/10
RS 10.448 9.426 ↑↑↑
GS1 10.402 9.764 ↑↑↑
GS3 10.402 9.764 ↑↑↑
over 500 kw n/a Hourly Hourly
LP4 9.59 9.466 ↑↑↑
over 500 kw n/a Hourly Hourly
LP5 9.31 Hourly Hourly

Price to Compare Increases (est.)Price to Compare Increases (est.)
• Met EdMet Ed• 2010 2010 ~~ 7.7 7.7 ¢¢/kwh/kwh• 2011 2011 ~~ 8.5 8.5 ¢¢/kwh/kwh
• AlleghenyAllegheny• 2010 2010 ~~ 6 to 8 6 to 8 ¢¢/kwh /kwh • 2011 2011 ~~ 7 7 ¢¢/kwh/kwh
• PenelecPenelec• 2010 2010 ~~ 6.2 6.2 ¢¢/kwh/kwh• 2011 2011 ~~ 7.5 7.5 ¢¢/kwh/kwh
• PECOPECO• 2010 2010 ~~ 6 to 9 6 to 9 ¢¢/kwh/kwh• 2011 2011 ~~ 8.5 to 9 8.5 to 9 ¢¢/kwh/kwh

PPL RS ShoppingPPL RS Shopping
8.698.69

Shopping Stats 10/1/10Shopping Stats 10/1/10

PJM ProgramsPJM Programs
Demand Side Response (DSR)Demand Side Response (DSR)Bypass UtilityBypass UtilityDeal through Customized Energy Deal through Customized Energy
Solutions (Curtailment Service Provider)Solutions (Curtailment Service Provider)CapacityCapacityEnergy Energy Synchronous ReserveSynchronous Reserve

PJMPJM

Who’s doing PJM DSR this year?Who’s doing PJM DSR this year?Bailey Farms Geisinger Health Systems Melmar Acres Farm
Bally Block Green Springs Trout Farm Michael H. Musser Farm
Bleacher Farms Herr Family Farm Morrill Curtis Farm
Bridge Valley Farm High Farms NEP Cold Storage
Brubaker Farms Hill Top Acres Farm Mkt Noah O. Wenger Farm
Chickes Creek Farm Homewood Retirement Pendu Manufacturing
Cleason Sensenig Farm J.L.Moyer & Sons Pequea Lawn Farms
Cold Spring Rental / Farm Joe Jurgielewitz & Son Ridge Valley Farms
Conestoga Wood Joel Frey Farm Risser's Poultry Farm
Country Fresh Onions Joel Rutt Farm Sight & Sound
Daniel Fellenbaum Farm John F. Martin & Sons SKH
Denver Cold Storage Karl Martin Farm Wenger Feeds
Donald Newcomer Keen Transport WFMZ
Dutch Valley Food Dist. Kirby Horst Farm What A View Farm
Eberly Farms Lamar Moyer Farm White Oak Mills
Egg Basket Longeneckers Hatchery Willow Valley Retirement
Fairmount Homes Mahoning Valley Home Zimmerman's Farm

What are these 51 receiving this year?What are these 51 receiving this year?
$669,000!$669,000!Program defined for at least another 3 Program defined for at least another 3
yearsyears

DSR Payout for 1,000kWDSR Payout for 1,000kW
2010-11: $48,7002010-11: $48,7002011-12: $32.3002011-12: $32.3002012-13: $38,3002012-13: $38,3002013-14: $62,0002013-14: $62,000
Total:Total: $181,300 or $181,300 or
Average:Average: $3,800/month $3,800/month

What does it take?What does it take?
Ability to reduce loadAbility to reduce loador run backup generationor run backup generation25kW minimum25kW minimumJune 1-Sept 30June 1-Sept 30Up to 10 interruptions for 6 hours eachUp to 10 interruptions for 6 hours eachMonthly paymentsMonthly payments


Platinum SponsorsPlatinum Sponsors
Customized Energy SolutionsCustomized Energy Solutions

Analyze. Simplify. Implement.
Customized Energy Solutions Ltd.1528 Walnut Street, 22nd FloorPhiladelphia, PA 19102 USA
Phone: 215-875-9440Fax: [email protected]
Confidential (www.ces-ltd.com)
Customized Energy Solutions
87Confidential (www.ces-ltd.com)

Analyze. Simplify. Implement.
Confidential (www.ces-ltd.com)
Customized Energy SolutionsCustomized Energy Solutions
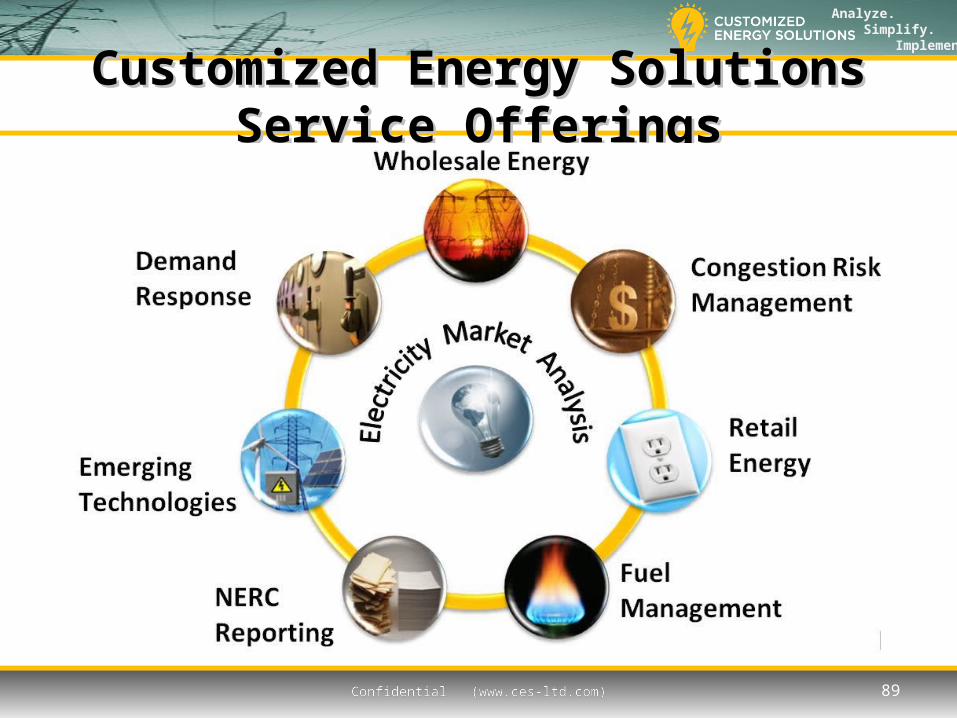
– What do we do for our clients?• Provide wholesale market services that enable our clients to
provide value added services for their customers• Examples
– LSEs– Aggregators (REAP)– Munis, Coops
• Provide additional value to REAP Services
– We are independent and provide services to a broad spectrum of participants in the energy markets
Confidential (www.ces-ltd.com) 88
Analyze. Simplify. Implement.
Confidential (www.ces-ltd.com)
Customized Energy Solutions Service OfferingsCustomized Energy Solutions Service Offerings
Confidential (www.ces-ltd.com) 89

Analyze. Simplify. Implement.
Confidential (www.ces-ltd.com)
PJM Load Response ProgramsPJM Load Response Programs
– Economic Program• REAP Electrical Agreement provides economic benefits to
Customers who reduce load at high prices
– Emergency Program • ISO or Utility calls interruption• Payment based on load reduction capability• Performance test required if no event occurs• Payment will offset portion of fixed charges under REAP
contract for energy
Confidential (www.ces-ltd.com) 90

Analyze. Simplify. Implement.
Confidential (www.ces-ltd.com)
Ancillary Service ProgramsAncillary Service Programs– Supplement value of REAP Services– Synchronous or Spinning Reserves
• Load reduction must be achieved in 10 minutes• Good Value for participation• Remote start for back-up generation or automated
notification of event for customer to reduce load• Value depends on hours of participation
– Regulation Service• Battery technology or flywheel technology• Typically a difficult service for loads but value is significant
Confidential (www.ces-ltd.com) 91

Platinum SponsorsPlatinum Sponsors
Direct EnergyDirect EnergyJo Anna KendrickJo Anna Kendrick

Tariff Issues and ChangesTariff Issues and Changes
PPLPPLREG participatingREG participatingDistribution Filing will raise RS rates in 1/11, Distribution Filing will raise RS rates in 1/11,
GS and LP rates flatGS and LP rates flatRTS increase limited…DSR possible?RTS increase limited…DSR possible?CTC will finally be goneCTC will finally be goneGS1GS1GS3 gouging by PPL will be mitigatedGS3 gouging by PPL will be mitigated

Tariff Issues and ChangesTariff Issues and Changes
Met EdMet Ed Rate Filing effective 1/11Rate Filing effective 1/11 PTC 8% increase expectedPTC 8% increase expected CTC gone but partially replaced by “NUG”CTC gone but partially replaced by “NUG”
Rate unchanged or decreased depending on load factorRate unchanged or decreased depending on load factor
Seasonal Rate Gone as of 1/11Seasonal Rate Gone as of 1/11 12 hour or 8 hour 12 hour or 8 hour TOD window lockedTOD window locked 12 hour kW rate same as 8 hour12 hour kW rate same as 8 hour > 400kW getting interval meter installed> 400kW getting interval meter installed
Tariff IssuesTariff Issues
Met EdMet EdGSL 400 kW criteria being challengedGSL 400 kW criteria being challengedReturn to Default 1 year requirementReturn to Default 1 year requirement

Lighting RetrofitsLighting Retrofits
Pete RichardsPete Richards

Act 129Act 129
Implementation - PPLImplementation - PPLEnergy Conservation PlanEnergy Conservation PlanBig Rebate $ from all electric utilities in PABig Rebate $ from all electric utilities in PA2% of total revenue2% of total revenue
Fully Recovered from _____?Fully Recovered from _____?

All lights are not created All lights are not created equalequal
Peter RichardsPeter Richards
Richards Energy Group, Inc.Richards Energy Group, Inc.

Original System
Type Watts
TROFFER 4' - 4F34T12CWES 144
INDUSTRIAL 8' - 2F96T12CWES 125
HID - 360W Metal Halide 415
Currently
Annual Calculated kWh (Based on Above Readings)
419,853.20
Annual Calculated Cost (Based on Above Readings)
$ 38,339.19

Supplier 1
TypeWatts Measured by
LTL, Inc % of Origional
Retrofit to TROFFER 4' - 2F32T8841XPHBF Mirro 4
75.56 52%
Retrofit to INDUSTRIAL 8' - 2F32T8841XPHBF Mirro 4
77.53 62%
New Fixture - HBF - 6F32T8841XPHBF Mirro 4 228.00 55%
Supplier 1 Proposed
Annual Calculated kWh (Based on Above Readings)
244,881.47 58%
Annual Calculated Cost (Based on Above Readings)
$ 22,424.02 58%
Annual Savings $ 15,915.17
Turnkey Project Cost (Materials, Labor, and Recycling)
$ 69,920.23
Sales Tax $ 4,195.21
Total Project Cost $ 74,115.45
Payback Period (years - current rates) 4.66
Payback Period (years - projected increase) 2.36

Supplier 2
TypeWatts Measured by
LTL, Inc% of Origional
Wattage
Replace with Troffer 4' - 3F32T8741 LBF white 88.95 62%
Replace with Industrial 8' - 4F32T8741 LBF white 108.67 87%
New Fixture - HBF - 6F54T5HO841 Mirro 4 323.20 78%
Supplier 2 Proposed
Annual Calculated kWh (Based on Above Readings) 329,552.86 78%
Annual Calculated Cost (Based on Above Readings) $ 30,656.96 80%
Annual Savings $ 7,682.23
Turnkey Project Cost (Materials, Labor, and Recycling)
$ 49,000.00
Sales Tax $ 2,940.00
Total Project Cost $ 51,940.00
Payback Period (years - current rates) 6.76
Payback Period (years - projected increase) 4.83

Lighting - ConcernsLighting - Concerns
MercuryMercury Toxic MetalToxic Metal Many Lamps ContainMany Lamps Contain
Mercury LifecycleMercury Lifecycle Proper Disposal Proper Disposal
RequiredRequired Local DistributorLocal Distributor Home DepotHome Depot
White LED LightingWhite LED Lighting
100,000 Hours!!!!100,000 Hours!!!!Driver Life 15-20,000 HoursDriver Life 15-20,000 Hours Integrated DriversIntegrated Drivers
CALiPER program by DOECALiPER program by DOE ““Reliable, unbiased product performance Reliable, unbiased product performance
information” information”

PA ACT 129PA ACT 129
House Bill 2200House Bill 2200 Mandatory Reduction Plan for most EDC’sMandatory Reduction Plan for most EDC’s 3% usage reduction over next 4 years3% usage reduction over next 4 years 4.5% Peak 100 Hours Demand Reduction 4.5% Peak 100 Hours Demand Reduction Funded by 2% of Gross 2007 revenues Funded by 2% of Gross 2007 revenues
Fully Recovered from _____?Fully Recovered from _____?
PPLPPL Variety of Rebate Options for EE&CVariety of Rebate Options for EE&C Retroactive to 7/1/2009Retroactive to 7/1/2009

PPL ACT 129PPL ACT 129
1. Efficient Equipment Incentive Program 1. Efficient Equipment Incentive Program 2. Residential Energy Assessment & Weatherization 2. Residential Energy Assessment & Weatherization 3. Compact Fluorescent Lighting Campaign 3. Compact Fluorescent Lighting Campaign 4. Appliance Recycling Program 4. Appliance Recycling Program 5. ENERGY STAR® New Homes Program 5. ENERGY STAR® New Homes Program 6. Renewable Energy Program 6. Renewable Energy Program 7. Direct Load Control Program 7. Direct Load Control Program 8. Time of Use Rates 8. Time of Use Rates 9. Energy-efficiency Behavior & Education 9. Energy-efficiency Behavior & Education 10. Low-income WRAP 10. Low-income WRAP 11. Low-income E-Power Wise 11. Low-income E-Power Wise 12. Commercial and Industrial Custom Incentive Program12. Commercial and Industrial Custom Incentive Program13. HVAC Tune-Up Program 13. HVAC Tune-Up Program 14. Load Curtailment Program 14. Load Curtailment Program


Lighting Retrofits-Lighting Retrofits-who’s doing them?who’s doing them?
Adhesives ResearchAdhesives Research High IndustriesHigh Industries Phillips GroupPhillips Group ECORE (Dodge-Regupol)ECORE (Dodge-Regupol) GSM Industrial (Gooding)GSM Industrial (Gooding) Amelia’s Grocery OutletAmelia’s Grocery Outlet Willow Valley Retirement Willow Valley Retirement
Comm.Comm. Wayside PresbyterianWayside Presbyterian USA SparesUSA Spares Homewood Retirement Homewood Retirement
CommunityCommunity St. Anne’sSt. Anne’s
Cooper ToolsCooper Tools Elixir IndustriesElixir Industries Good’s StoreGood’s Store Leonhardt Mfg.Leonhardt Mfg. Eden ResortEden Resort Ken’s RestorationKen’s Restoration Electron EnergyElectron Energy IREX Corp.IREX Corp. Shank’sShank’s James V Brown LibraryJames V Brown Library How about YOU?How about YOU?

Referral Awards!Referral Awards!
IPadIPad$200 Lowes card$200 Lowes card$50 Ticketmaster$50 Ticketmaster$50 Sheetz Gas card$50 Sheetz Gas card

PrizesPrizes

REG’s New Home