2009 Annual Report to BOG - Florida International...
48
2009 Annual Report to BOG
Transcript of 2009 Annual Report to BOG - Florida International...

2009 Annual Report to BOG

· Baccalaureate Degrees Awarded and Graduate Degrees Awarded: Graduate degrees include master’s, research doctoral, and professional doctoral programs. Source: SUS Student Instruction File
Data DefinitionsGOAL 1:
· # and % Baccalaureate Degrees Awarded (Non-Hispanic Blacks and Hispanics): The number of baccalaureate degrees granted to non-Hispanic black students or Hispanic students. The percentage is the number of baccalaureate degrees awarded to each group divided by the total number of degrees awarded, excluding those awarded to non-resident aliens and those not reporting race/ethnicity. Source: SUS Student Instruction File
· # and % Baccalaureate Degrees Awarded (Pell Recipients): The number of baccalaureate degrees awarded to federal Pell grant recipients, an indicator of low family income. For this report, a Pell grant recipient is defined as a student who received Pell within six years of graduation. The percentage is the number of baccalaureate degrees awarded to Pell recipients as listed above divided by the total number of degrees awarded, excluding those awarded to non-resident aliens. Sources: SUS Student Instruction File and Student Financial Aid File

· Federally Financed and Total Academic Research and Development Expenditures: The National Science Foundation conducts an annual survey of colleges and universities regarding research and development expenditures. These amounts combine reported science and engineering R&D expenditures with reported non-science and engineering expenditures. Dollars are in nominal dollars (i.e., not inflation-adjusted). Source: http://webcaspar.nsf.gov/
· Licensing Income Received: License issue fees, payments under options, annual minimums, running royalties, termination payments, amount of equity received when cashed-in, and software and biological material end-user license fees of $1,000 or more, but not research funding, patent expense reimbursement, valuation of equity not cashed-in, software and biological material end-user license fees of less than $1,000, or trademark licensing royalties from university insignia. Source: AUTM Licensing Survey
GOAL 3:
GOAL 2:
· Pass Rates on Professional Licensure Examinations: Many professional licensure data, gathered by the respective licensing boards and housed within the Department of Business and Professional Regulation, are not currently formatted and do not contain sufficient information to match to SUS data. Board of Governors staff will work with individuals from the appropriate agencies to try to get data in the needed format.
· # Licenses/Options Executed: Count of the number of licenses/options executed in the fiscal year for all technologies. Each license agreement is counted separately. Source: AUTM Licensing Survey
· # Degrees Awarded in Select Areas of Strategic Emphasis: Degrees as reported above by six-digit Classification of Instruction Program. The areas of strategic emphasis were selected by the Board of Governors staff in consultation with business and industry groups.
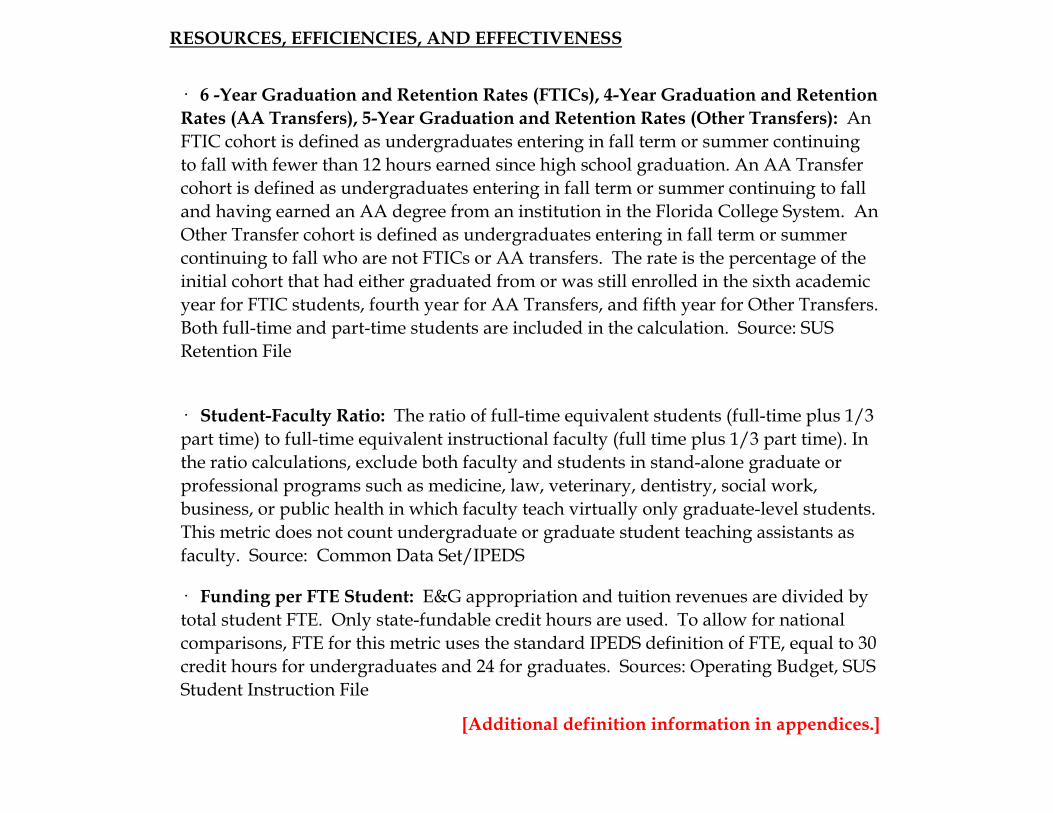
· Student-Faculty Ratio: The ratio of full-time equivalent students (full-time plus 1/3 part time) to full-time equivalent instructional faculty (full time plus 1/3 part time). In the ratio calculations, exclude both faculty and students in stand-alone graduate or professional programs such as medicine, law, veterinary, dentistry, social work, business, or public health in which faculty teach virtually only graduate-level students. This metric does not count undergraduate or graduate student teaching assistants as faculty. Source: Common Data Set/IPEDS
· Funding per FTE Student: E&G appropriation and tuition revenues are divided by total student FTE. Only state-fundable credit hours are used. To allow for national comparisons, FTE for this metric uses the standard IPEDS definition of FTE, equal to 30 credit hours for undergraduates and 24 for graduates. Sources: Operating Budget, SUS Student Instruction File
[Additional definition information in appendices.]
· 6 -Year Graduation and Retention Rates (FTICs), 4-Year Graduation and Retention Rates (AA Transfers), 5-Year Graduation and Retention Rates (Other Transfers): An FTIC cohort is defined as undergraduates entering in fall term or summer continuing to fall with fewer than 12 hours earned since high school graduation. An AA Transfer cohort is defined as undergraduates entering in fall term or summer continuing to fall and having earned an AA degree from an institution in the Florida College System. An Other Transfer cohort is defined as undergraduates entering in fall term or summer continuing to fall who are not FTICs or AA transfers. The rate is the percentage of the initial cohort that had either graduated from or was still enrolled in the sixth academic year for FTIC students, fourth year for AA Transfers, and fifth year for Other Transfers. Both full-time and part-time students are included in the calculation. Source: SUS Retention File
RESOURCES, EFFICIENCIES, AND EFFECTIVENESS

Enrollments Headcount %
TOTAL(Fall 2008)
Black 4,839 12% 67Hispanic 23,401 60% 81
White 6,601 17% 28 Enrollment Profile: High undergraduate
Other 4,305 11% 3 Undergraduate Profile: Medium full-time four-year, selective, lower transfer-in
Full-Time 23,286 59% Size and Setting: Large four-year, primarily nonresidentialPart-Time 15,860 41%
Undergraduate 30,428 78% TOTAL 817 13Graduate 6,629 17% Tenure/T. Track 646 8
Unclassified 2,089 5% Non-Ten. Track 171 5
Comprehensive doctoral (no medical/veterinary)Master’s & Specialist’s
N/A
Faculty (Fall 2008) Full-Time
Graduate Instructional Program:
Professional Doctorates
Baccalaureate
Degree Programs Offered (2008-09) Carnegie Classification
39,146 100% TOTAL Balanced arts & sciences/professions, high graduate coexistence
Undergraduate Instructional Program:
179
Florida International University 2009 Annual Report
BOARD OF GOVERNORS – STATE UNIVERSITY SYSTEM GOAL 1:ACCESS TO AND PRODUCTION OF DEGREES
Part-Time
Basic: Research Universities (high research activity)
Elective Classification:
Sites and Campuses University Park Campus, Biscayne Bay Campus, Pines Center Site
Research Doctorates
4,400
4,600
4,800
5,000
5,200
5,400
5,600
5,800
Bachelor's
Baccalaureate DegreesAwarded
2004-05 2008-09
0
500
1,000
1,500
2,000
2,500
Graduate Degrees Awarded
2004-05 2008-09
Master'sResearch & Professional Doctorates
0
500
1,000
1,500
2,000
2,500
3,000
3,500
4,000
4,500
2004-05 2008-09 2004-05 2008-09
Baccalaureate Degrees Awarded by Group
Pell Hispanic Black
14.4% 12.8%
43.8% 47.5%
61.6% 66.5%
0%10%20%30%40%50%60%70%80%90%
2004-05 2008-09 2004-05 2008-09
Baccalaureate by Group as Percentage of Total
FIU Baccalaureates*
Black Hispanic Pell
Excluding Non-Resident Aliens (NRA) & Unreported for Race/Ethnicity & NRA for Pell Comparisons

BOARD OF GOVERNORS – STATE UNIVERSITY SYSTEM GOAL 3:BUILDING WORLD-CLASS ACADEMIC PROGRAMS AND RESEARCH CAPACITY
BOARD OF GOVERNORS – STATE UNIVERSITY SYSTEM GOAL 2:MEETING STATEWIDE PROFESSIONAL AND WORKFORCE NEEDS
$-
$20
$40
$60
$80
$100
$120
Federal Only Total - All Sources
MillionsAcademic Research and Development
Expenditures
2003-04 2007-08
10%Increase
43%Increase
0
1
$0$5
$10$15$20$25$30$35$40$45
2004 2005 2006 2007 2008 Lice
nses
& O
ptio
ns E
xecu
ted
Lice
nsin
g In
com
eThousands
University Innovations Generating Revenue Through Technology Transfer:
Licenses and Licensing Revenue
Licensing Income Licenses & Options Executed
41211
934
0200400600800
1,0001,2001,400
Bachelor's
Baccalaureate Degrees Awarded in Select Areas
of Strategic Emphasis, 2008-09
STEMHealth ProfessionsEducation-Critical Shortage Areas
112
284
538
590
200
400
600
800
1,000
Graduate Degrees Awarded in Select Areas of Strategic Emphasis, 2008-
09
Education-Critical Shortage AreasHealth ProfessionsSTEM
Master's Doctorates
Pass Rates on Licensure ExaminationsBoard of Governors staff are working to match cohorts of university graduates with engineering, accounting, and other professional licensure data, which are gathered by the respective licensing boards and housed within the Department of Business and Professional Regulation. Historically, teacher certification examination pass rates have been reported for program completers only, resulting in a nearly 100% pass rate (because state-approved programs require passage of the certification exams for completion). Board staff are also developing an alternative measure of the effectiveness of educator preparation programs. For this year, nursing exam (NCLEX) first-time pass rates are the only meaningful licensure metrics available for bachelor’s degree programs.
In 2008, FIU had 181 NCLEX test takers from its nursing bachelor’s program, with a first-time pass rate of 89%.

BOARD OF GOVERNORS – STATE UNIVERSITY SYSTEM GOAL 4:MEETING COMMUNITY NEEDS AND FULFILLING UNIQUE INSTITUTIONAL RESPONSIBILITIES
FIU's innovative Neighborhood HELP (Health Education Learning Program), which runs through the entire four years of medical school, will put medical students in teams with students of other disciplines. They will work together to address real medical, social and ethical issues experienced by disadvantage families in South Florida.
[More information is available regarding this Goal in the subsequent narrative section of this report.]
Key University Achievements
► Student awards/achievements • FIU Physics students won the BandWidth Challenge at the Super Computing 2009 conference in Portland Oregon. • FIU College of Law students placed second best brief in 2009 Skadden, Arps Foreign Direct Investment Moot competition in Frankfurt. • At the 2009 National Model United Nations Conference, the FIU Model United Nations (MUN) team received the Outstanding Delegation Award, the highest accolade possible.
► Faculty awards/achievements• Professor Pedro Jose "Joe" Greer, Chair of the Department of Humanities, Health & Society at Florida International University’s Herbert Wertheim College of Medicine, received the Presidential Medal of Freedom. • Suzanne Koptur, Professor in the Department of Biological Sciences, Alex Stepick, Director, Immigration & Ethnicity Institute, & Professor of Anthropology and Sociology, Matthew Mirow, Professor of Law at the College of Law, and Bianca Premo, Associate Professor, Department of History received Fulbright awards. • Madavan Nair, professor and chair of immunology and associate dean of biomedical research, and Barry P. Rosen, professor and associate dean for research & graduate studies, both at the FIU Herbert Wertheim College of Medicine, have received NIH MERIT awards.
► Program awards/achievements • FIU’s International Business Program ranked in top 15 in US News and World Report.
• FIU’s Hospitality Management program in association with Tianjin University of Commerce ranked in the top 10 programs in China by the Ministry of Education. • The Patricia and Phillip Frost Art Museum has been named Best Art Museum, and its Kenan-Flagler Family Discovery Gallery as The Best Place for Kids to Unleash Their Creativity, by the Miami New Times.
► Research awards/achievements• The Center for the Study of Matters at Extreme Condition (CeSMEC) at FIU led an international group of scientists that synthesized and characterized a single-element compound, Boron Boride (B28). • A team of four universities led by FIU’s Fernando Miralles-Wilhelm received a $5 million grant from NASA for ecosystem research on the Everglades and Sian Ka’an wetlands in Mexico. • Dr. Gary Rand, professor in the Department of Earth and Environment, and Dr. Piero Gardinali, associate professor in the Department of Chemistry and Biochemistry recently received a $2.75 million agreement with the Miami-Dade County Water and Sewer Department to provide environmental research and analysis. Their groundbreaking project, only the second of its kind in the country, will determine the feasibility of using highly-treated reclaimed water for the Biscayne Bay Coastal Wetlands Rehydration Project.
► Institutional awards/achievements•FIU was ranked #1 in the nation in awarding STEM degrees to underrepresented minorities in a recent study published by The Commission on Professionals in Science and Technology.
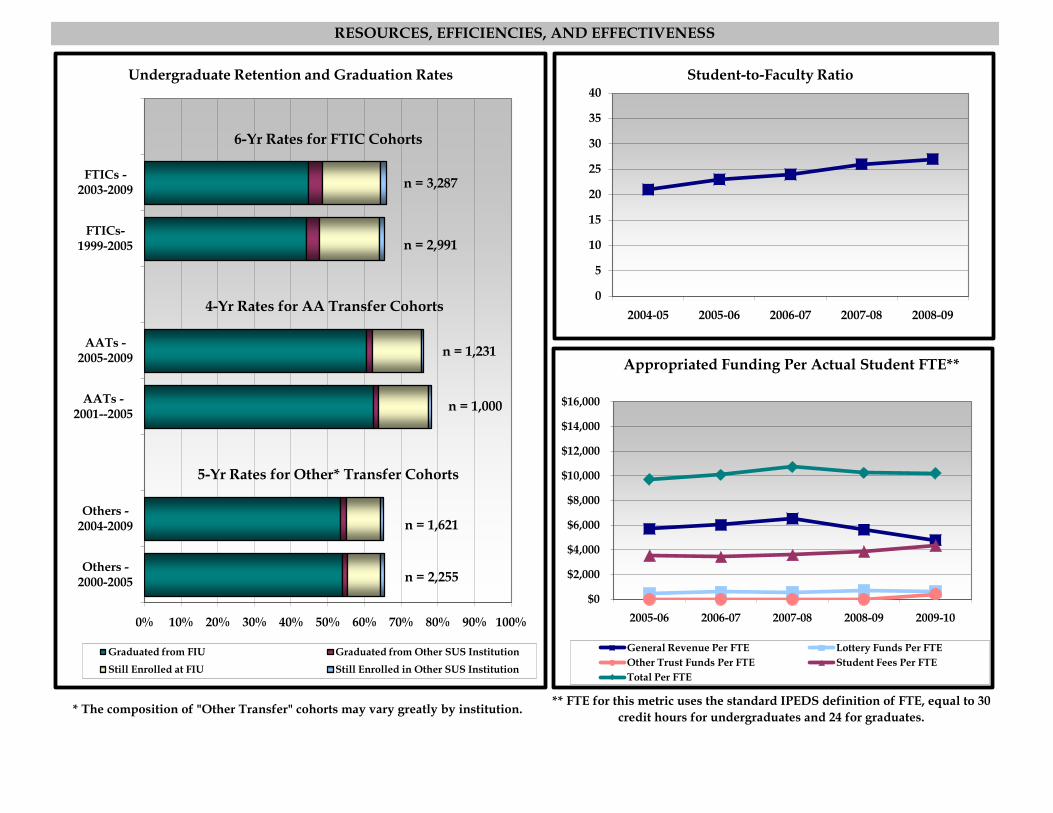
* The composition of "Other Transfer" cohorts may vary greatly by institution. ** FTE for this metric uses the standard IPEDS definition of FTE, equal to 30 credit hours for undergraduates and 24 for graduates.
RESOURCES, EFFICIENCIES, AND EFFECTIVENESS
0% 10% 20% 30% 40% 50% 60% 70% 80% 90% 100%
Others -2000-2005
Others -2004-2009
AATs -2001--2005
AATs -2005-2009
FTICs-1999-2005
FTICs -2003-2009
Undergraduate Retention and Graduation Rates
Graduated from FIU Graduated from Other SUS InstitutionStill Enrolled at FIU Still Enrolled in Other SUS Institution
6-Yr Rates for FTIC Cohorts
n = 3,287
n = 2,991
n = 1,231
n = 1,000
4-Yr Rates for AA Transfer Cohorts
5-Yr Rates for Other* Transfer Cohorts
n = 1,621
n = 2,255
0
5
10
15
20
25
30
35
40
2004-05 2005-06 2006-07 2007-08 2008-09
Student-to-Faculty Ratio
$0
$2,000
$4,000
$6,000
$8,000
$10,000
$12,000
$14,000
$16,000
2005-06 2006-07 2007-08 2008-09 2009-10
Appropriated Funding Per Actual Student FTE**
General Revenue Per FTE Lottery Funds Per FTEOther Trust Funds Per FTE Student Fees Per FTETotal Per FTE
Introduction ► Mission
Florida International University is an urban, public, multi-campus research university serving South Florida, the state, the nation, and the international community. Our mission is to impart knowledge through excellent teaching, promote public service, discover new knowledge, solve problems through research, and foster creativity. ► Vision
A leading student-centered urban public research university that is locally and globally engaged. ► Other Contextual Introductory Comments As an anchor public institution in South Florida, FIU is committed to providing quality learning, state-of-the-art research and creative activity, and problem-solving engagement. As an institution of higher learning, Florida International University is committed to
Freedom of thought and expression Excellence in teaching and in the pursuit, generation
dissemination, and application of knowledge Respect for the dignity of the individual Respect for the environment Honesty, integrity, and truth Diversity Strategic, operational, and service excellence
BOARD OF GOVERNORS – STATE UNIVERSITY SYSTEM GOAL 1: ACCESS TO AND PRODUCTION OF DEGREES
Provide enhanced academic, personal and cultural support, and assistance to qualified elementary, middle and high school students in Miami-Dade County that will result in increased graduation rates and eventual enrollment in a postsecondary institution FIU has leveraged Federal educational opportunity outreach programs to motivate and support students from disadvantaged backgrounds to enroll and succeed in college. The Pre-College Programs at Florida International University (FIU) give students the chance to explore careers and build their educational foundation in a variety of disciplines, including Science, Technology, Engineering, Mathematics (STEM), Social Sciences, English Literature and Grammar, and Foreign Languages. Students also become acclimated to college by taking classes on campus and adapting to the behavioral norms of college students. Additionally, participants in three of our programs are given the opportunity to have a residential summer experience and live on campus from 2 to 6 weeks. Through the pre-collegiate programs, students can experience a genuine college classroom environment, with tough courses to challenge their young minds. This reinforces the curriculum from high school, exposes students to college level work, and improves their study skills. The ultimate goal is to develop students who are intellectually prepared for the collegiate experience and the world around them.

GOAL 1: ACCESS TO AND PRODUCTION OF DEGREES (Continued) Establish an advanced placement/dual enrollment public high school on the FIU Modesto Maidique campus The Office of Undergraduate Education has developed an exciting new partnership with Miami-Dade County Public Schools (MDCPS) that allows top high school students take classes at FIU. FIU’s Academy for Advanced Academics offers an all-day university/high school experience on the FIU campus for 100 MDCPS students from five senior high schools. The goal of this collaboration is to increase FIU’s engagement with the South Florida community and to encourage these top students to form relationships with the university and continue their studies here. The university also helps prepare these students to achieve academic success in college so that we can retain them through graduation. To be considered for admission into the program, students must have a GPA of at least a 3.0 and top scores on the PSAT. Students at the Academy for Advanced Academics take all of their classes at the Modesto Maidique Campus, and build class schedules based on their academic interests. In the morning, the high school students attend college classes taught by FIU professors alongside FIU undergraduates. They stay on campus in the afternoon for their Advanced Placement classes— college-level courses taught by high-school teachers. By the time the students graduate from high school, they will have completed up to two full years of college.
BOARD OF GOVERNORS – STATE UNIVERSITY SYSTEM GOAL 2: MEETING STATEWIDE PROFESSIONAL AND WORKFORCE NEEDS Increase the number of medical doctors in the State of Florida. The Herbert Wertheim College of Medicine entered its first class of 43 students in 2009. That number will increase to 120 in 2013. By the nature of our innovative curriculum in NeighborhoodHELPTM communities (see below-Goal 4), it is anticipated that a majority of graduates will pursue a residency in a primary care specialty. Increase the number of nurses in the State of Florida The nation’s first foreign-educated physicians to professional nurses program, pioneered at FIU in 2002 and expanded through distance learning technology to Orlando in 2004 and to Tampa in 2007, continues to transform foreign-educated physicians into nurses with their Bachelor of Science in Nursing degree through a fast-track, specialized curriculum. Building on the medical training these individuals have had in their home countries, they can become registered nurses after completing 5 semesters, a little more than 1 ½ years of classroom, clinical and community education and practice. Not only do these graduates address the nursing shortage, but because 75% of them have immigrated from the Caribbean, Central and South America with 20% more having immigrated from prior Soviet Union countries, India, and China, they contribute to diversifying the nursing workforce. Minorities constitute 32% of the population of Florida (82% of population of Miami Dade County), but only 18% of Florida nurses are from these ethnic groups. Through 2009, 378 nurses have entered the workforce through this program: 12 cohorts in Miami, 1 in Orlando (2004), and 2 in Tampa (2007 and 2009) and 122 graduates of this program are now enrolled in the MSN program. The program has been supported both by Federal grants and by hospitals that employ the graduates.
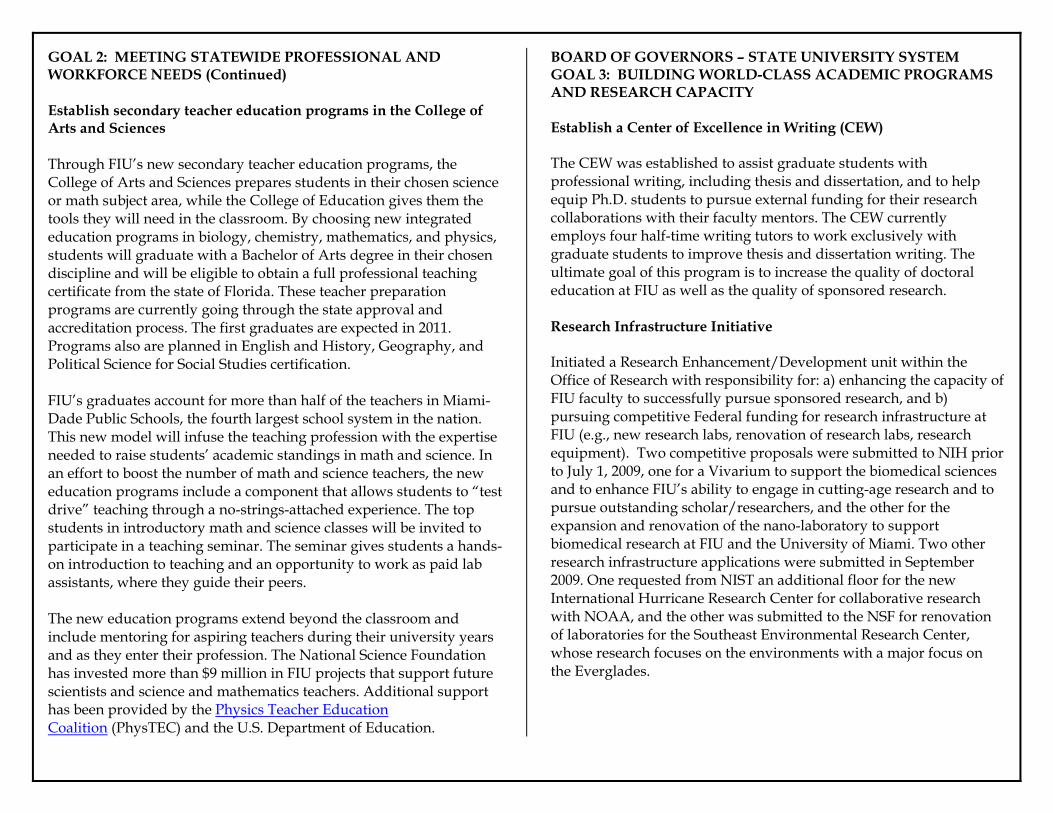
GOAL 2: MEETING STATEWIDE PROFESSIONAL AND WORKFORCE NEEDS (Continued) Establish secondary teacher education programs in the College of Arts and Sciences Through FIU’s new secondary teacher education programs, the College of Arts and Sciences prepares students in their chosen science or math subject area, while the College of Education gives them the tools they will need in the classroom. By choosing new integrated education programs in biology, chemistry, mathematics, and physics, students will graduate with a Bachelor of Arts degree in their chosen discipline and will be eligible to obtain a full professional teaching certificate from the state of Florida. These teacher preparation programs are currently going through the state approval and accreditation process. The first graduates are expected in 2011. Programs also are planned in English and History, Geography, and Political Science for Social Studies certification. FIU’s graduates account for more than half of the teachers in Miami-Dade Public Schools, the fourth largest school system in the nation. This new model will infuse the teaching profession with the expertise needed to raise students’ academic standings in math and science. In an effort to boost the number of math and science teachers, the new education programs include a component that allows students to “test drive” teaching through a no-strings-attached experience. The top students in introductory math and science classes will be invited to participate in a teaching seminar. The seminar gives students a hands-on introduction to teaching and an opportunity to work as paid lab assistants, where they guide their peers. The new education programs extend beyond the classroom and include mentoring for aspiring teachers during their university years and as they enter their profession. The National Science Foundation has invested more than $9 million in FIU projects that support future scientists and science and mathematics teachers. Additional support has been provided by the Physics Teacher Education Coalition (PhysTEC) and the U.S. Department of Education.
BOARD OF GOVERNORS – STATE UNIVERSITY SYSTEM GOAL 3: BUILDING WORLD-CLASS ACADEMIC PROGRAMS AND RESEARCH CAPACITY Establish a Center of Excellence in Writing (CEW) The CEW was established to assist graduate students with professional writing, including thesis and dissertation, and to help equip Ph.D. students to pursue external funding for their research collaborations with their faculty mentors. The CEW currently employs four half-time writing tutors to work exclusively with graduate students to improve thesis and dissertation writing. The ultimate goal of this program is to increase the quality of doctoral education at FIU as well as the quality of sponsored research. Research Infrastructure Initiative Initiated a Research Enhancement/Development unit within the Office of Research with responsibility for: a) enhancing the capacity of FIU faculty to successfully pursue sponsored research, and b) pursuing competitive Federal funding for research infrastructure at FIU (e.g., new research labs, renovation of research labs, research equipment). Two competitive proposals were submitted to NIH prior to July 1, 2009, one for a Vivarium to support the biomedical sciences and to enhance FIU’s ability to engage in cutting-age research and to pursue outstanding scholar/researchers, and the other for the expansion and renovation of the nano-laboratory to support biomedical research at FIU and the University of Miami. Two other research infrastructure applications were submitted in September 2009. One requested from NIST an additional floor for the new International Hurricane Research Center for collaborative research with NOAA, and the other was submitted to the NSF for renovation of laboratories for the Southeast Environmental Research Center, whose research focuses on the environments with a major focus on the Everglades.

GOAL 3: BUILDING WORLD-CLASS ACADEMIC PROGRAMS AND RESEARCH CAPACITY (Continued) Establish a strategic Cluster Hiring Initiative Program Cluster hiring is a process by which faculty are recruited in groups built around common research and academic themes. The initiative will enhance cross-disciplinary student learning and benefit our local and state economy. Additionally, cluster hiring affords a means of advancing the University in strategically targeted areas. One Cluster Hire in the area of ADHD (Attention Deficit Hyperactivity Disorder) was accomplished. This Cluster enhances a strong existing applied developmental psychology program and connects it to the new College of Medicine. The Cluster consists of three (3) positions across two units and colleges (Psychiatry in Medicine and Psychology in Arts & Sciences). The group will relocate a renowned ADHD research center from SUNY Buffalo to FIU and transfer over $10 million in external funding. In addition to enhancing research capacity at FIU, this group will: a) establish collaborative programs to address ADHD and childhood problems with the Miami-Dade County Public School system, b) relocate to FIU a well-known ADHD summer treatment program that attracts clients from throughout the U.S. and the world, and c) establish a ADHD clinic at FIU which will serve the local community. Research Space Allocation & Laboratory Renovation Research space is a precious and finite resource. Quality research laboratories and facilities is a prerequisite to build world-class academic and research programs. To accomplish this, FIU has established a system for the allocation of research space and has begun a process of laboratory renovation and outfitting in conjunction with the new College of Medicine and the Cluster Hiring Initiative. Extensive renovations have been completed for laboratories in the life sciences and in environmental research. This program will continue for several years in efforts to attract world-class research faculty and cutting-edge sponsored research.
BOARD OF GOVERNORS – STATE UNIVERSITY SYSTEM GOAL 4: MEETING COMMUNITY NEEDS AND FULFILLING UNIQUE INSTITUTIONAL RESPONSIBILITIES Initiate the NeighborhoodHELPTM Program The Florida International University Herbert Wertheim College of Medicine is spearheading a unique undergraduate medical education program in collaboration with our colleges of public health, social work and nursing and our community partners to prepare physicians to assess and address the non-medical factors that affect health outcomes. FIU will be preparing physicians to practice medicine in an interdisciplinary and comprehensive manner through a curriculum that integrates the ethical foundations of medicine, social determinants of health, cultural competency, public health principles, and sustained community based participatory service-learning experiences. To our knowledge, this is the only medical school program in the US that will allow students the opportunity to be immersed in the community developing interdisciplinary community partnerships over the entire course of their medical education. Students will work with community organizations, interdisciplinary teams and neighborhood households to identify and address existing healthcare needs and gaps in services by acting as advocates, facilitators and patient educators. The Green Family Medicine & Society program will run longitudinally throughout the four years of training with eight courses vertically integrated with the clinical Family Medicine curriculum throughout the four years of medical school. Medical students will be introduced to local issues of health disparities and community needs through hands on experiences through lectures, case-based small group discussions, and immersion in the community. Over 1000 households have already been interviewed and baseline data collected to establish their eligibility for participation in this program

GOAL 4: MEETING COMMUNITY NEEDS AND FULFILLING UNIQUE INSTITUTIONAL RESPONSIBILITIES (Continued) Community Summits In Fall 2009, FIU President Mark B. Rosenberg initiated an unprecedented community engagement effort, bringing together 100 of South Florida’s top education, business and civic leaders in two summits to discuss FIU’s future. The gatherings were convened to engage a discussion of how FIU can best serve the community and to elicit input on critical issues that will shape the university’s future direction. The summits yielded thoughtful assessments of FIU’s strengths and challenges and a wealth of ideas for the future. Everglades Restoration FIU’s Southeast Environmental Research Center is leading several federally funded initiatives to restore the Everglades. The center’s research includes studies of seagrass, mangrove and wetland ecology, microbiology, ecosystem exposure to toxic chemicals, climate change and water quality. Among the largest research initiatives is the Florida Coastal Everglades Long-Term Ecological Research project, a $10 million collaboration involving more than 50 scientists who are investigating the estuarine ecosystem of the Everglades. Honors College Partnership with City of Sweetwater, FL In Fall 2009, FIU’s Honors College launched a sweeping partnership with the city of Sweetwater, FL, that will build students’ leadership skills and improve the quality of life in that city. Honors College students will participate in diverse projects including tutoring children, helping to launch an athletic program for girls, and working with the elderly. A “green team” of students will promote environmental awareness with recycling and energy conservation programs and improve the aesthetic appearance of the city with neighborhood cleanups and by planting flowers and trees in parks and recreation areas.
Additional Information on Quality, Resources, Efficiencies, and Effectiveness FIU is a national resource for graduating minorities. FIU grants more bachelor’s degrees to minorities than any other university in the country. It ranks third in master’s degrees awarded to minorities (after University of Phoenix and University of Southern California) and second in the total of both bachelor’s and master’s degrees awarded to minorities. The government of the People’s Republic of China selected Florida International University School of Hospitality Management from a group of elite hospitality schools in the U.S. and Europe as its partner in establishing a hospitality and tourism management campus in Tianjin, the third largest city in China which serves as the seaport for the capital, Beijing. The $100 million FIU Tianjin Center, which was fully funded by the Chinese government, sits on 80 acres of land and contains more than 450,000 square feet of air conditioned space, including a dormitory tower 20 stories high, which can accommodate 1,000 students. The center has total capacity for 2,000 students. The Marriott Tianjin China Program opened in September 2006 and has graduated 183 students to date. Mark B. Rosenberg was appointed the fifth president of FIU. All three finalists in the presidential search are currently serving as presidents of research universities. President Rosenberg identified his initial vision and goals in a document titled “Hit the Ground Running” that focused on four components: Revitalize and expand financial base; Achieve results-oriented student-centered academic excellence; Enhance quality and impact of research and creative initiatives; and Engage the community. These four components formed the basis for white papers drafted by faculty, staff, and administration work groups. The College of Arts and Sciences has been reorganized through the creation of three schools: School of International and Public Affairs; School of the Environment and Society; and School of Integrated Life Sciences.

Additional Information on Quality, Resources, Efficiencies, and Effectiveness (continued) The Landon Undergraduate School of Business was named one of the top undergraduate business programs by BusinessWeek; its Accounting program was ranked eighteenth and its Operations Management program ranked ninth. U.S. News & World Report has rated our undergraduate business program among the top fifteen in the country for the last five years – most recently we were ranked twelfth. Hispanic Business ranked the Chapman Graduate School of Business at Florida International University (FIU) in eighth place in the country for Hispanic MBAs. In its 2009 ranking of exceptional graduate programs globally and in Latin America, América Economía, the leading business magazine in Latin America, placed our Chapman Graduate School twentieth on the global list and fourteenth in the United States Global Learning for Global Citizenship is the Quality Enhancement Plan (QEP) portion of FIU’s reaccreditation process for the Southern Association of Colleges and Schools. It is a university-wide initiative that has been embraced by FIU's faculty, students, and administration as integral to achieving the founding purposes of the institution: education of students, service to the community, and greater international understanding. Program goals focus on providing global learning courses and co-curricular opportunities across the undergraduate curriculum, faculty and staff development for global learning, and the human, physical, and financial resources necessary to develop, implement, and sustain the QEP. The new building to house the College of Nursing and Health Sciences was completed on time and under budget and was built to LEED Silver environmental quality standard.
Additional Resources
► Carnegie Classification Basic: Research Universities (high research activity) Undergraduate Instructional Program: Balanced arts &
sciences/professions, high graduate coexistence Graduate Instructional Program: Comprehensive doctoral (no medical/veterinary)
Enrollment Profile: High undergraduate Undergraduate Profile: Medium full-time four-year, selective,
lower transfer-in Size and Setting: Large four-year, primarily nonresidential
http://www.carnegiefoundation.org/classifications/sub.asp?key=748&subkey=13889&start=782
► Voluntary System of Accountability College Portrait
http://www.collegeportraits.org/FL/FIU
► Common Data Set http://w3.fiu.edu/irdata/portal/cds.htm
► College Navigator
http://nces.ed.gov/collegenavigator/?q=florida+international+university&s=all&id=133951
► FIU Office of Research
http://osra.fiu.edu/ ► University Strategic Plan
http://w3.fiu.edu/irdata/portal/strat_plan.htm ► University Data Sources
FIU Office of Planning and Institutional Research http://w3.fiu.edu/irdata/portal/
FIU Fact Book: http://w3.fiu.edu/irdata/portal/factbook.htm FIU Quick Facts http://w3.fiu.edu/irdata/portal/quickfacts.htm

List of Tables
1 – Budget2 – Federal Stimulus Dollars (ARRA)3 – Other Core Resources4 – Enrollment and Funding5 – Undergraduate Education Data
A. Baccalaureate Degree Programs Implemented or TerminatedB. First-Year Persistence RatesC. Undergraduate Progression and Graduation RatesD. Baccalaureate Degrees AwardedE. Baccalaureate Degrees Awarded in Areas of Strategic EmphasisF. Baccalaureate Degrees Awarded to Underrepresented GroupsG. Baccalaureate Completions Without Excess Credit HoursH. Undergraduate Course OfferingsI. Faculty Teaching UndergraduatesJ. Undergraduate Instructional Faculty CompensationK. Student-Faculty RatiosL. Licensure Examination Pass Rates (Undergraduate)M. Tuition Differential
6 – Graduate Education DataA. Graduate Degree Programs Implemented or TerminatedB. Graduate Degrees AwardedC. Graduate Degrees Awarded in Areas of Strategic EmphasisD. Licensure Examination Pass Rates (Graduate)
7 – Research and Economic Development DataA. Research and Development ExpendituresB. Other Research and Economic Development OutcomesC. Centers of ExcellenceD. Commercialization Assistance Grants
8 – Voluntary Support of Higher Education9 - Progress on Other Primary Institutional Goals and Metrics As Outlined in the University Work Plan
Appendices

Education and General
E&G Revenues
State Funds (Recurring GR & Lottery) $191,003,950 $216,006,580 $221,572,071 $206,029,070 $180,171,788
State Funds (Non-Recurring GR &
Lottery)$476,554 $1,500,000 $12,384,962 $9,587,997 $1,202,411
Tuition (Resident/Non-Resident) $107,547,110 $121,088,321 $122,206,561 $128,413,296 $141,115,209
Tuition Differential (UG) $0 $0 $0 $2,566,323 $5,983,993
Other (Include Revenues from Misc.
Fees & Fines)$2,487,956 $2,453,429 $2,478,005 $2,640,819 $2,567,067
Phosphate Research Trust Fund $0 $0 $0 $0 $0
Federal Stimulus Funds $0 $0 $0 $0 $14,250,535
TOTAL $301,515,570 $341,048,330 $358,641,599 $349,237,505 $345,291,003
E&G ExpendituresInstruction/Research $176,366,352 $182,584,783 $190,058,978 $192,502,152 $206,019,636
Institutes and Research Centers $805,859 $807,777 $2,219,037 $1,190,150 $743,027
PO&M $30,043,881 $32,957,519 $34,478,199 $33,195,211 $33,102,540Administration and
Support Services $34,296,517 $42,797,098 $46,159,437 $41,085,034 $44,175,791
Radio/TV $0 $0 $0 $0 $0Library/Audio Visual $12,485,724 $16,332,904 $16,579,532 $16,259,156 $16,155,728
Museums and Galleries $3,086,425 $3,158,294 $3,081,449 $3,102,438 $3,093,386
Agricultural Extension $0 $0 $0 $0 $0Allied Clinics $0 $0 $0 $0 $0
Student Services $20,555,264 $21,450,686 $21,999,030 $20,751,117 $21,809,917
Intercollegiate Athletics $463,420 $496,734 $493,112 $497,435 $497,217
TOTAL $278,103,442 $300,585,795 $315,068,774 $308,582,693 $325,597,242
2008-09 Actual
2009-10 Estimates
2009-10 Estimates
2005-06 Actual
2006-07 Actual
2007-08 Actual
1 - Budget2005-06 Actual
2006-07 Actual
2007-08 Actual
2008-09 Actual

05-06 Actual 06-07 Actual 07-08 Actual 08-09 Actual 2009-10 Estimates
Contracts and Grants
Revenues $102,177,782 $116,404,932 $101,593,689 $103,332,747 $111,159,114
Expenditures $90,684,117 $110,792,960 $98,407,954 $105,487,682 $111,245,873
Auxiliary Enterprises
Revenues $119,149,687 $161,571,396 $167,654,586 $166,757,480 $166,593,232
Expenditures $105,567,834 $141,666,048 $156,364,887 $160,309,345 $165,616,408
Local Funds
Revenues $143,146,345 $142,880,313 $123,831,359 $134,714,848 $131,313,975
Expenditures $149,793,366 $137,997,387 $119,254,124 $137,798,965 $131,437,960
TOTAL REVENUES $665,989,384 $761,904,971 $751,721,233 $754,042,580 $754,357,324
TOTAL EXPENDITURES $624,148,759 $691,042,190 $689,095,739 $712,178,685 $733,897,483
Other:TOTAL $14,250,535
2 - Federal Stimulus Dollars (ARRA)
Proposed Operating Budget DetailJobs Saved/Created
Proposed 2009-10271.83
$11,387,220
# Jobs Saved/Created
ScholarshipsLibrary ResourcesBuilding Repairs/Alterations
Financial Aid to Medical Students
Motor VehiclesPrintingFurniture & EquipmentInformation Technology Equipment
$946,871
$676,295
$838,149 $402,000

Education and GeneralE&G Revenues
State Funds (Recurring GR & Lottery) $0 $0 $5,272,250 $11,465,084 $21,402,853
State Funds (Non-Recurring GR & Lottery) $0 $0 $0 $0 $0
Tuition (Resident/Non-Resident) $0 $0 $0 $0 $993,000
Tuition Differential (UG) $0 $0 $0 $0 $0
Other (Include Revenues from Misc. Fees & Fines) $0 $0 $0 $42,350 $52,769
Phosphate Research Trust Fund $0 $0 $0 $0 $0
Federal Stimulus Funds $0 $0 $0 $0 $866,405
TOTAL $0 $0 $5,272,250 $11,507,434 $23,315,027
E&G ExpendituresInstruction/Research $0 $0 $5,031,611 $6,668,490 $14,948,882
Institutes and Research Centers $0 $0 $0 $0 $0
PO&M $0 $0 $4,200 $0 $0
Administration and Support Services $0 $0 $77,355 $2,161,089 $4,729,066
Radio/TV $0 $0 $0 $0 $0
Library/Audio Visual $0 $0 $0 $735,925 $1,122,917
Museums and Galleries $0 $0 $0 $0 $0
Agricultural Extension $0 $0 $0 $0 $0
Allied Clinics $0 $0 $0 $0 $0
Student Services $0 $0 $0 $1,242,530 $1,920,840
Teaching Hospital $0 $0 $0 $0 $0
TOTAL $0 $0 $5,113,166 $10,808,034 $22,721,705
2005-06 Actual
2006-07 Actual
2007-08 Actual
2008-09 Actual
2009-10 Estimates
1 - Budget (Medical)2005-06 Actual
2006-07 Actual
2007-08 Actual
2008-09 Actual
2009-10 Estimates

05-06 Actual
06-07 Actual
07-08 Actual
08-09 Actual
2009-10 Estimates
Contracts and Grants
Revenues $0 $0 $0 $0 $0
Expenditures $0 $0 $0 $0 $0
Auxiliary Enterprises
Revenues $0 $0 $0 $0 $0
Expenditures $0 $0 $0 $0 $0
Local Funds
Revenues $0 $0 $0 $0 $0
Expenditures $0 $0 $0 $0 $0
TOTAL REVENUES $0 $0 $5,272,250 $11,507,434 $23,315,027
TOTAL EXPENDITURES $0 $0 $5,113,166 $10,808,034 $22,721,705
TOTAL $866,405
Financial Aid to Medical StudentsOther:
Furniture & EquipmentInformation Technology Equipment
Motor VehiclesPrinting
Library ResourcesBuilding Repairs/Alterations
Jobs Saved/Created $866,405
Scholarships
# Jobs Saved/Created 8.25
Proposed Operating Budget Detail
2 - Federal Stimulus Dollars (ARRA)Proposed 2009-10

FT PT FT PT FT PT FT PT FT PT
628 4 596 10 606 9 656 3 646 8
141 33 146 27 134 27 172 6 171 5
839 851 922 1036 985
436 31 484 22 518 0 517 3 571 6
775 44 820 0 914 20 960 35 1028 32
840 32 801 30 783 26 962 32 954 29
178.44Space Utilization Percentage (Classrooms)
Total Graduate Assistants/ Associates
Total Executive/ Ad-ministrative/ Managerial
Fall 2004
Total Other Professional
Total Non-Professional
Space
$5,638
$720
Total Tenure/ Tenure-track Faculty
Total Non-Tenure Track Faculty
$454
$0
$3,548
$583
General Revenue per FTE
Lottery Funds per FTE
$4,357
$10,206$10,720
$0
$3,885
$0
$3,600
$10,243
Personnel Headcount
$10,080
2005-06 2006-07
$5,707
$9,709
$6,030
$600
$0
$3,450
Fall 2007Fall 2004
142.36 143.07 165.28 165.08
3 - Other Core Resources
Fall 2008
Fall 2005 Fall 2006 Fall 2007 Fall 2008
Fall 2005 Fall 2006
Other Trust Funds per FTE
Student Fees per FTE
2008-092007-08
$6,537
** FTE for this metric uses the standard IPEDS definition of FTE, equal to 30 credit hours for undergraduates and 24 for graduates.
2009-10
$4,793
$630
Appropriated Funding per Actual Student FTE
(US Definition)
Total per FTE Student
$426

FL Resident Lower 8,160 8,116 8,160 7,564 7,860 7,860
FL Resident Upper 11,682 11,190 11,682 11,490 11,682 11,682
FL Resident Grad I 2,875 2,901 2,962 3,100 3,095 3,095
FL Resident Grad II 311 287 311 340 311 311
Total FL Resident 23,028 22,494 23,115 22,494 22,948 22,948
Non-Res. Lower 514 464 483
Non-Res. Upper 707 679 705
Non-Res. Grad I 679 656 693
Non-Res. Grad II 244 258 255
Total Non-Res. 2,133 2,144 2,136 2,057 2,138 2,136
Total Lower 8,630 8,028 8,343
Total Upper 11,897 12,169 12,387
Total Grad I 3,580 3,756 3,788
Total Grad II 530 598 566
Total FTE 25,161 24,637 25,251 24,551 25,086 25,084
Total FTE - US Definition* 33,548 32,849 33,668 32,735 33,448 33,445
2009-10 Estimated
For entire institution: Annual FTE
4 - Enrollment and Funding
Funded2007-08
Funded2008-09
2007-08 Actual
Funded2009-10
2008-09 Actual

FL Resident Medical
Headcount40 40
Non-Res. Medical
Headcount
Total Medical Headcount
40 40
Total Non-Res. Med., Den.,
Vet. Medicine Headcount
* Use FL - SUS definitions of FTE (Undergraduate FTE = 40 and Graduate FTE = 32 credit hours per FTE) for all items except the row named Total FTE- US Definition. For this row, use Undergraduate FTE = 30 and Graduate FTE = 24 credit hours.
Annual FTE Funded2007-08
2007-08Actual
Funded2008-09
2008-09Actual
Funded2009-10
2009-10Estimated

Lower 6,590 6,034 6,374
Upper 8,184 8,127 8,502
Grad I 2,775 2,926 2,923
Grad II 497 565 526
Total 18,046 17,652 18,325
Lower 970 910 976
Upper 1,786 1,867 1,893
Grad I 210 204 217
Grad II 5 6 6
Total 2,971 2,987 3,092
Lower 59 49 51
Upper 303 285 304
Grad I 239 216 247
Grad II 24 23 29
Total 625 573 631
Lower 1,011 1,035 942
Upper 1,624 1,890 1,688
Grad I 356 410 401
Grad II 4 4 5
Total 2,995 3,339 3,036
2008-09Actual
2009-10Estimated
2007-08Actual
2008-09Actual
For each distinct location (main, branch, site, regional campus) with> 150 FTE.
SITE: UNIVERSITY PARK CAMPUS
2008-09Actual
FTE 2007-08Actual
FTE
2009-10Estimated
SITE: OTHER
2007-08Actual
2008-09Actual
4 - Enrollment and Funding (Continued)
FTE
SITE: PINES CENTER SITE
SITE: BISCAYNE BAY CAMPUS
FTE
2009-10Estimated
2007-08Actual
2009-10Estimated
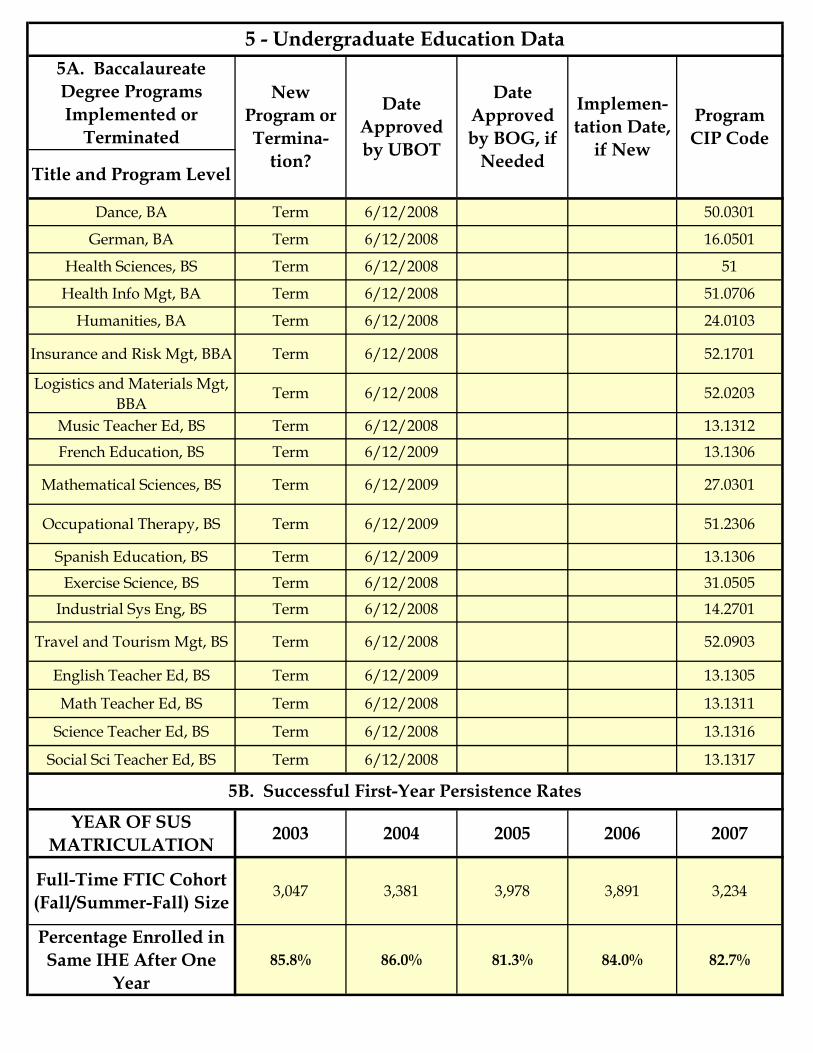
5A. Baccalaureate Degree Programs Implemented or
Terminated
Title and Program Level
Dance, BA Term 6/12/2008 50.0301
German, BA Term 6/12/2008 16.0501
Health Sciences, BS Term 6/12/2008 51
Health Info Mgt, BA Term 6/12/2008 51.0706
Humanities, BA Term 6/12/2008 24.0103
Insurance and Risk Mgt, BBA Term 6/12/2008 52.1701
Logistics and Materials Mgt, BBA
Term 6/12/2008 52.0203
Music Teacher Ed, BS Term 6/12/2008 13.1312
French Education, BS Term 6/12/2009 13.1306
Mathematical Sciences, BS Term 6/12/2009 27.0301
Occupational Therapy, BS Term 6/12/2009 51.2306
Spanish Education, BS Term 6/12/2009 13.1306
Exercise Science, BS Term 6/12/2008 31.0505
Industrial Sys Eng, BS Term 6/12/2008 14.2701
Travel and Tourism Mgt, BS Term 6/12/2008 52.0903
English Teacher Ed, BS Term 6/12/2009 13.1305
Math Teacher Ed, BS Term 6/12/2008 13.1311
Science Teacher Ed, BS Term 6/12/2008 13.1316
Social Sci Teacher Ed, BS Term 6/12/2008 13.1317
YEAR OF SUS MATRICULATION 2003 2004 2005 2006 2007
Full-Time FTIC Cohort (Fall/Summer-Fall) Size
3,047 3,381 3,978 3,891 3,234
Percentage Enrolled in Same IHE After One
Year85.8% 86.0% 81.3% 84.0% 82.7%
Date Approved by UBOT
Implemen-tation Date,
if New
5 - Undergraduate Education Data
5B. Successful First-Year Persistence Rates
Program CIP Code
Date Approved by BOG, if
Needed
New Program or Termina-
tion?
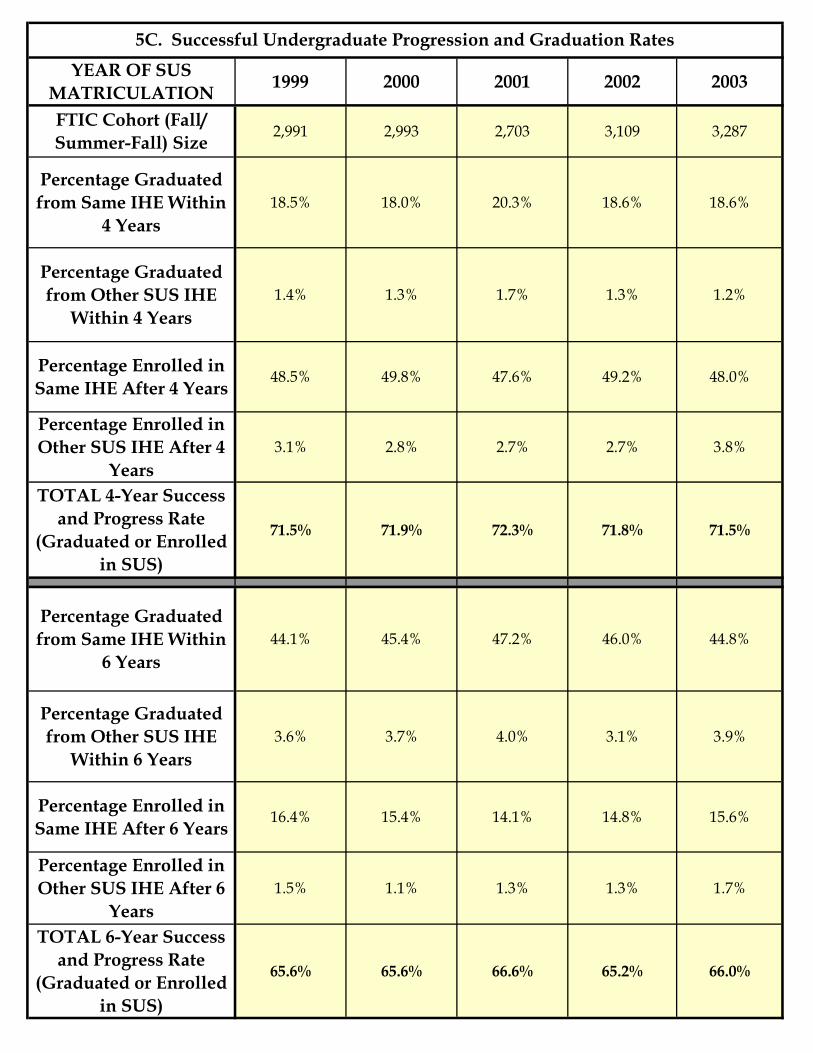
YEAR OF SUS MATRICULATION 1999 2000 2001 2002 2003
FTIC Cohort (Fall/ Summer-Fall) Size
2,991 2,993 2,703 3,109 3,287
Percentage Graduated from Same IHE Within
4 Years18.5% 18.0% 20.3% 18.6% 18.6%
Percentage Graduated from Other SUS IHE
Within 4 Years1.4% 1.3% 1.7% 1.3% 1.2%
Percentage Enrolled in Same IHE After 4 Years
48.5% 49.8% 47.6% 49.2% 48.0%
Percentage Enrolled in Other SUS IHE After 4
Years3.1% 2.8% 2.7% 2.7% 3.8%
TOTAL 4-Year Success and Progress Rate
(Graduated or Enrolled in SUS)
71.5% 71.9% 72.3% 71.8% 71.5%
Percentage Graduated from Same IHE Within
6 Years44.1% 45.4% 47.2% 46.0% 44.8%
Percentage Graduated from Other SUS IHE
Within 6 Years3.6% 3.7% 4.0% 3.1% 3.9%
Percentage Enrolled in Same IHE After 6 Years
16.4% 15.4% 14.1% 14.8% 15.6%
Percentage Enrolled in Other SUS IHE After 6
Years1.5% 1.1% 1.3% 1.3% 1.7%
TOTAL 6-Year Success and Progress Rate
(Graduated or Enrolled in SUS)
65.6% 65.6% 66.6% 65.2% 66.0%
5C. Successful Undergraduate Progression and Graduation Rates
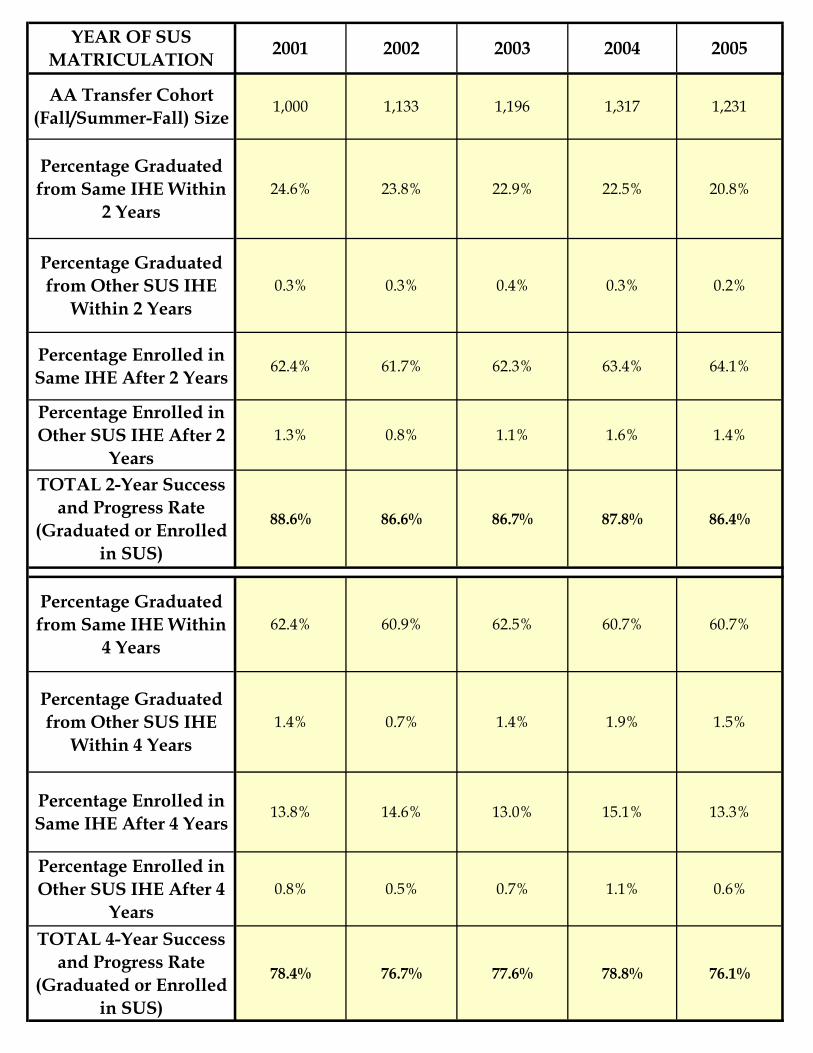
YEAR OF SUS MATRICULATION 2001 2002 2003 2004 2005
AA Transfer Cohort (Fall/Summer-Fall) Size
1,000 1,133 1,196 1,317 1,231
Percentage Graduated from Same IHE Within
2 Years24.6% 23.8% 22.9% 22.5% 20.8%
Percentage Graduated from Other SUS IHE
Within 2 Years0.3% 0.3% 0.4% 0.3% 0.2%
Percentage Enrolled in Same IHE After 2 Years
62.4% 61.7% 62.3% 63.4% 64.1%
Percentage Enrolled in Other SUS IHE After 2
Years1.3% 0.8% 1.1% 1.6% 1.4%
TOTAL 2-Year Success and Progress Rate
(Graduated or Enrolled in SUS)
88.6% 86.6% 86.7% 87.8% 86.4%
Percentage Graduated from Same IHE Within
4 Years62.4% 60.9% 62.5% 60.7% 60.7%
Percentage Graduated from Other SUS IHE
Within 4 Years1.4% 0.7% 1.4% 1.9% 1.5%
Percentage Enrolled in Same IHE After 4 Years
13.8% 14.6% 13.0% 15.1% 13.3%
Percentage Enrolled in Other SUS IHE After 4
Years0.8% 0.5% 0.7% 1.1% 0.6%
TOTAL 4-Year Success and Progress Rate
(Graduated or Enrolled in SUS)
78.4% 76.7% 77.6% 78.8% 76.1%

YEAR OF SUS MATRIC. 2000 2001 2002 2003 2004
Other Transfer Cohort (Fall/Summer-Fall) Size
2,255 2,162 2,237 2,010 1,621
Percentage Graduated from Same IHE Within
5 Years54.0% 51.4% 53.1% 50.3% 53.5%
Percentage Graduated from Other SUS IHE
Within 5 Years1.5% 1.3% 1.6% 1.6% 1.7%
Percentage Enrolled in Same IHE After 5 Years
9.0% 9.1% 9.5% 10.0% 9.1%
Percentage Enrolled in Other SUS IHE After 5
Years1.0% 0.7% 0.7% 0.9% 0.9%
TOTAL 5-Year Success and Progress Rate
(Graduated or Enrolled in SUS)
65.5% 62.5% 64.9% 62.8% 65.2%
5D. Baccalaureate Degrees Awarded 2004-2005 2005-2006 2006-2007 2007-2008 2008-2009
Baccalaureate Degrees 4,862 5,080 5,324 5,497 5,663
2004-2005 2005-2006 2006-2007 2007-2008 2008-2009Education 76 71 53 56 41
Health Professions 240 278 207 205 211
Science, Technology, Engineering, and Math
874 968 987 987 934
Security & Emergency Services
213 262 261 261 269
Globalization 598 626 798 753 808
Regional Workforce Needs
1,333 1,332 1,474 1,388 1,468
TOTAL: Areas of Strategic Emphasis
3,334 3,537 3,780 3,650 3,731
Areas of Strategic Emphasis5E. Baccalaureate
Degrees Awarded in Areas of Strategic
Emphasis

5F. Baccalaureate Degrees Awarded to
Underrepresented Groups
2004-2005 2005-2006 2006-2007 2007-2008 2008-2009
# of Baccalaureate Degrees Awarded to Black Non-Hispanic
Students
624 648 650 711 682
% of Total Baccalaureate Degrees (Excluding Those Awarded to Non-Resident
Aliens and Unreported) Awarded to Black Non-
Hispanic Students
14.4% 14.0% 13.1% 13.6% 12.8%
# of Baccalaureate Degrees Awarded to Hispanic Students
2,678 2,903 3,169 3,369 3,555
% of Total Baccalaureate Degrees (Excluding Those Awarded to Non-Resident
Aliens and Unreported) Awarded to Hispanic
Students
61.6% 62.6% 63.8% 64.6% 66.5%
Number of Baccalaureate Degrees Awarded to PELL
Recipients (Defined as Those Receiving PELL
Within 6 Years of Graduation)
1,920 2,105 2,264 2,493 2,555
% of Total Baccalaureate Degrees (Excluding Those Awarded to Non-Resident Aliens) Awarded to PELL
Recipients (Defined as Those Receiving PELL
Within 6 Years of Graduation)
43.8% 45.0% 45.4% 47.6% 47.5%

5G. Baccalaureate Completion Without Excess Credit Hours
2004-2005 2005-2006 2006-2007 2007-2008 2008-2009
% of Total Baccalaureate Degrees Awarded Within 110% of Hours Required
for Degree
45.5% 40.7% 42.2% 45.2% 47.6%
5H. Undergraduate Course Offerings Fall 2004 Fall 2005 Fall 2006 Fall 2007 Fall 2008
Number of Undergraduate Course
Sections2,532 2,567 2,667 2,688 2,518
% of Undergraduate Course Sections With < 30
Students52.7% 49.3% 49.6% 53.1% 50.3%
% of Undergraduate Course Sections With
>=30 and <50 Students27.6% 30.0% 30.0% 28.6% 30.5%
% of Undergraduate Course Sections With
>=50 and <100 Students16.0% 16.6% 16.2% 15.0% 15.4%
% of Undergraduate Course Sections With
>=100 Students3.6% 4.2% 4.2% 3.2% 3.8%
5I. Faculty Teaching Undergraduates 2004-2005 2005-2006 2006-2007 2007-2008 2008-2009
Percentage of Credit Hours Taught by Faculty 59.1% 57.7% 59.8% 61.2% 63.4%
Percentage of Credit Hours Taught by Adjunct
Faculty34.0% 34.5% 32.4% 30.1% 28.3%
Percentage of Credit Hours Taught by
Graduate Students5.1% 5.8% 5.8% 5.6% 5.7%
Percentage of Credit Hours Taught by Other
Instructors1.9% 2.1% 2.0% 3.1% 2.6%
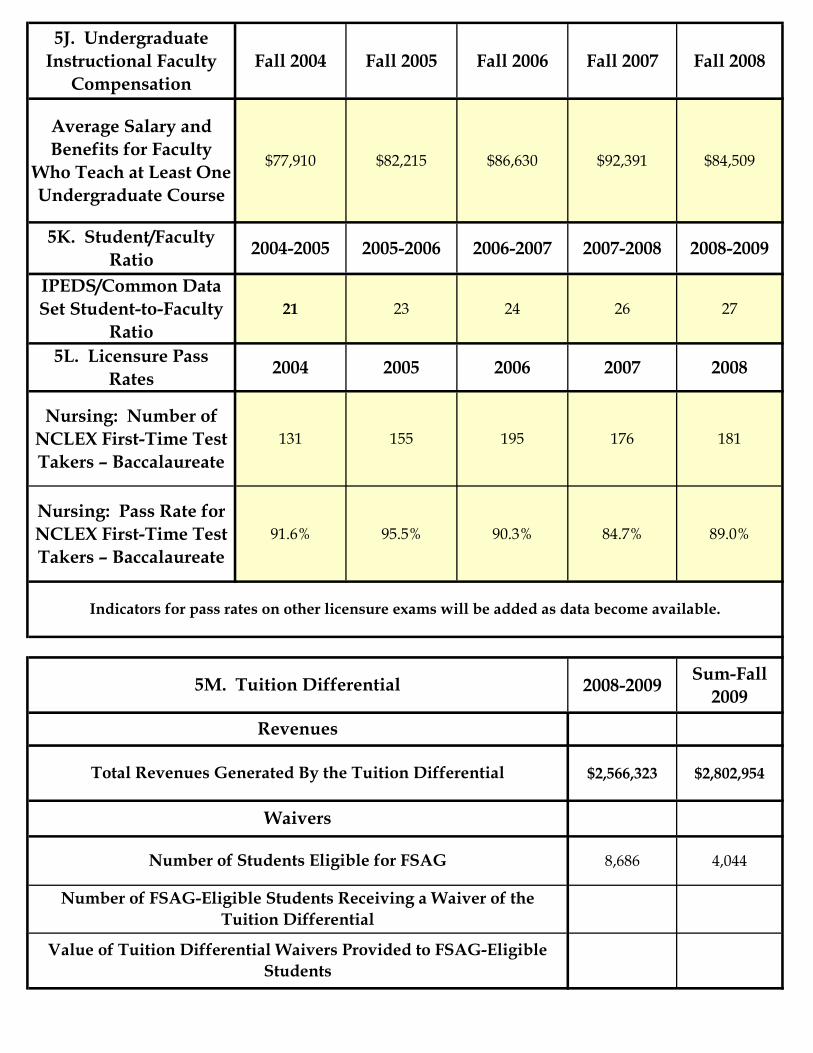
5J. Undergraduate Instructional Faculty
CompensationFall 2004 Fall 2005 Fall 2006 Fall 2007 Fall 2008
Average Salary and Benefits for Faculty
Who Teach at Least One Undergraduate Course
$77,910 $82,215 $86,630 $92,391 $84,509
5K. Student/Faculty Ratio 2004-2005 2005-2006 2006-2007 2007-2008 2008-2009
IPEDS/Common Data Set Student-to-Faculty
Ratio21 23 24 26 27
5L. Licensure Pass Rates 2004 2005 2006 2007 2008
Nursing: Number of NCLEX First-Time Test Takers – Baccalaureate
131 155 195 176 181
Nursing: Pass Rate for NCLEX First-Time Test Takers – Baccalaureate
91.6% 95.5% 90.3% 84.7% 89.0%
2008-2009 Sum-Fall 2009
$2,566,323 $2,802,954
8,686 4,044
Value of Tuition Differential Waivers Provided to FSAG-Eligible Students
Revenues
Total Revenues Generated By the Tuition Differential
Indicators for pass rates on other licensure exams will be added as data become available.
5M. Tuition Differential
Number of Students Eligible for FSAG
Number of FSAG-Eligible Students Receiving a Waiver of the Tuition Differential
Waivers

Detailed expenditures of the revenues generated by the tuition differential will be captured in the Operating Budget submission each August.
Report on the success of the tuition differential in achieving the articulated purpose. Include an update on any performance measures that were specified in the BOG-approved
tuition differential proposal. [NOTE: In 2009, universities will only be able to report progress for the fall term and reiterate how the university will monitor the long-term success
of the tuition differential.]
For 2008-2009 the University used the tuition differential revenues as follows: 1. Undergraduate faculty hires to improve graduation rates. 2. Enhanced disability services to increase resources for deaf and hearing impaired students. 3. Developed Office of Undergraduate Studies to strengthen undergraduate experience and academic components. 4. Undergraduate tutoring support - writing center - to strengthen students communication skills. 5. Summer courses - instructional funding - increase courses offered for the summer term. 6. Emergency - VOIP phones - enhance undergraduate security. 7. Upgrade of undergraduate computer lab.
For 2009-2010 the University is expected to use the tuition differential revenues as follows: 1. Need based financial aid. 2. Additional undergraduate faculty to improve graduation & retention rates. 3. Additional undergraduate advisors to improve the student to advisor rate. 4. Library - increase undergraduate scholarly journals and databases. 5. Dean of Undergraduate Studies. 6. Tutoring - Writing Support Center. 7. Undergraduate Faculty support to help improve graduation and retention rates. 8. Disability services - increase the number of resources to proctor exams.

6A. GraduateDegree Programs Implemented or Terminated
Title and Program Level
Exercise Science, MS Term 6/12/2008Industrial Sys Eng, MS Term 6/12/2008
Travel and Tourism Mgt, MS Term 6/12/2008English Teacher Ed, MS Term 6/12/2008Math Teacher Ed, MS Term 6/12/2008
Science Teacher Ed, MS Term 6/12/2008Social Sci Teacher Ed, MS Term 6/12/2008
Athletic Training, MS New 6/28/2007 Fall 2007 51.0913Envir and Urban Sys, MS Term 6/12/2008Industrial Sys Eng, PhD Term 6/12/2008
Technology Mgt, MS Term 6/12/2008English Education, MAT Term 6/12/2008French Education, MAT Term 6/12/2009
Mathematics Teacher Ed, MAT Term 6/12/2009Physical Therapy, MS Term 6/12/2009
Science Education, MAT Term 6/12/2009Social Studies Education, MAT Term 6/12/2009
Spanish Education, MAT Term 6/12/2009
Master’s and Specialist 1,796 1,632 1,933 2,172 2,255Research Doctoral 80 88 100 122 127Professional Doctoral 47 82 86 90 123
Law 47 82 86 90 123
2004-2005 2005-2006 2006-2007 2007-2008 2008-2009Education 122 79 140 76 113
Health Professions 206 199 223 284 285Science, Technology, Engineering,
and Math 417 402 479 501 597
Security & Emergency Services 27 36 18 41 28Globalization 101 87 112 142 124
Regional Workforce Needs 397 399 487 578 610TOTAL: Areas of Strategic
Emphasis 1,270 1,202 1,459 1,622 1,757
6D. Licensure Pass Rates 2004 2005 2006 2007 2008Indicators for pass rates on other licensure exams will be added as data become available.
[See ENDNOTES.]
Implemen-tation
Date, if New
Program CIP Code
2007-2008 2008-20096B. Graduate Degrees Awarded
New Program or Termina-
tion?
Date Approved by UBOT
Date Approved by BOG, if
Needed
2004-2005 2005-2006 2006-2007
6 - Graduate Education Data
6C. Graduate Degrees Awarded in Areas of Strategic Emphasis
Areas of Strategic Emphasis
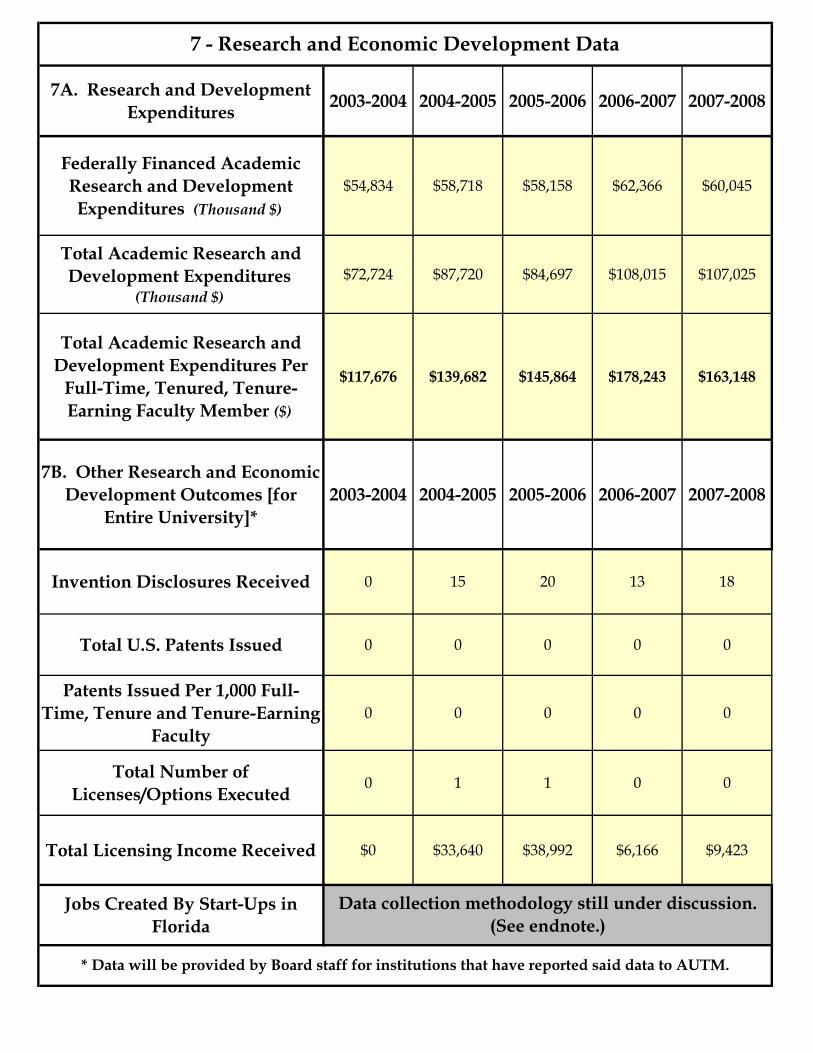
7A. Research and Development Expenditures 2003-2004 2004-2005 2005-2006 2006-2007 2007-2008
Federally Financed Academic Research and Development Expenditures (Thousand $)
$54,834 $58,718 $58,158 $62,366 $60,045
Total Academic Research and Development Expenditures
(Thousand $)$72,724 $87,720 $84,697 $108,015 $107,025
Total Academic Research and Development Expenditures Per
Full-Time, Tenured, Tenure-Earning Faculty Member ($)
$117,676 $139,682 $145,864 $178,243 $163,148
7B. Other Research and Economic Development Outcomes [for
Entire University]*2003-2004 2004-2005 2005-2006 2006-2007 2007-2008
Invention Disclosures Received 0 15 20 13 18
Total U.S. Patents Issued 0 0 0 0 0
Patents Issued Per 1,000 Full-Time, Tenure and Tenure-Earning
Faculty0 0 0 0 0
Total Number of Licenses/Options Executed
0 1 1 0 0
Total Licensing Income Received $0 $33,640 $38,992 $6,166 $9,423
Jobs Created By Start-Ups in Florida
7 - Research and Economic Development Data
* Data will be provided by Board staff for institutions that have reported said data to AUTM.
Data collection methodology still under discussion. (See endnote.)

From First Year Up To Most Recent
Year
Most Recent
Year
18 applied, 11 received
for $2,920,713
6 applied, 1 received for
$28,942
$3,248,746 $2,238,586
2 4
4 6
0 0
0 0
3 3
0 0
8 11
11 11
0 0
0 0
0 0
5 5
0 0
0 0
Economic Development Effectiveness
Collaborations with Other Postsecondary Institutions
Collaborations with K-12 Education Systems/Schools
Collaborations with Private Industry
Business Start-Ups in Florida
Jobs Created and Jobs Saved in Florida
Specialized Industry Training and Education
Dollars Acquired from Venture Capitalists and Other Investments
7C. Centers of Excellence (Please complete for each Center of Excellence)
Students Supported with Center Funds
Students Graduated
Job Placements of Graduates Upon Leaving the Center
Name of Center of Excellence: Center of Excellence for Hurricane Damage Mitigation and Product Development
Research Effectiveness
Collaboration Effectiveness
Competitive Grants Applied For and Received
Total Research Expenditures
Publications in Refereed Journals From Center Research
Professional Presentations Made on Center Research
Invention Disclosures Filed and Issued
Technologies Licensed and Revenues Received

Insert additional pages, as needed for additional Centers.
Center of Excellence Narrative Comments [Most Recent Year]
The FIU COE award was received in July 2008. Between July and December 2008 the International Hurricane Research underwent an administrative restructuring. Activities in Winter/Spring '09 concentrated on hiring or placement of Center personnel, including business director, and research/technology and outreach directors and developing a work plan for the three main areas of research. Delays with the Wall of Wind testing facility continue to limit research in the areas of hurricane damage mitigation and development of partnerships with industry. The Facility is planned for completion in Spring 2010.

Narrative Comments [Most Recent Year]
Insert additional pages, as needed for additional grants.
7D. Commercialization Assistance Grants
Intent of Funds: To help FIU leverage its small staff to improve its technology transfer process for identifying and determining the best biomedical technologies for potential as startups, and to foster and improve joint-collaboration environment for commercialization opportunities.
Activities for 2009: Assessed and identified additional technologies, projects and technology portfolios, developed marketing plans and requested further patent protection. Identified and assessed databases to assist with marketing, showcasing and managing technologies.
Identified, developed marketing materials and conducted initial marketing for the following: Novel Fabrication of Method of Nanoscale Fibers and Tubes portfolio of technologies(Fields: Molecular profiling, improvement of sensors and systems)DNA Sensors Using Single-Walled Carbon Nanotubes (Fields: Microbiology, infectious diseases)Based upon external interest and marketing results, narrowed previously identified technologies to the following with start up potential and potential for facilitation of commercialization between entrepreneurs and investors: Intravascular Delivery System for a Catheter Deliverable Heart Valve Prosthesis, Catheter Deliverable Artificial Trileaflet Aortic Valve Prosthesis, Collapsible Heart Valve with Polymer Leaflets: Submitted this portfolio of technologies for presentation at investor showcase events. Presentations accepted at the 2009 WBT (World’s Best Technologies) Showcase and at the Life Sciences Summit 2009. Worked with Florida Institute for Commercialization of Public Research to have Entrepreneur in Residence review potential of the technology.Hand-held Optical Probe Based Imaging System, and related Automated Real Time Co-Registration Software: Further enhanced patent portfolio by continuing with patent prosecution and submitting a non-provisional patent application for the Automated Real Time Co-Registration Software (software in the medical imaging space). Worked with Florida Institute for Commercialization of Public Research to have Entrepreneur in Residence review potential of the technology.
The funds from the SURECAG grant used to date for development of business plans and marketing/descriptive materials have greatly assisted in marketing this portfolio of technologies to potential entrepreneurs and investors, and in obtaining feedback.

2003-2004 2004-2005 2005-2006 2006-2007 2007-2008
Endowment Market Value (Thousand $)
$71,879 $74,396 $80,283 $91,876 $97,064
Annual Gifts Received($)
$13,981,116 $14,483,986 $13,891,812 $10,873,175 $18,796,862
Percentage of Graduates Who Are Alumni Donors
3.0% 3.4% 1.8% 4.4% 4.7%
8 - Voluntary Support of Higher Education*
* Data will be provided by Board staff for institutions that have reported said data through the NACUBO Endowment Study and the CAE Voluntary Support of Education (VSE)
Survey.
[INCLUDE ADDITIONAL BACKGROUND DATA ASSOCIATED WITH GRAPHS INCLUDED FOR GOAL #4.]
ENDNOTES:
• Board staff are continuing to work with the SUS Technology Transfer Directors to determine the best way to capture consistent information regarding Jobs Created By Start-Ups in Florida in a cost-effective manner.
[Additional definition information will be added to final document.]

[NOTE: In 2009, universities may only be able to identify goals and metrics or report on progress on institutional strategic planning goals already in place.]
9. Progress on Other Primary Institutional Goals and Metrics As Outlined in the University Work Plan
P rovide a report on progress to date on three – five other primary university goals and metrics that were identified in the institution’s last annual work plan/proposal.
Improve Student Retention and Student:Faculty Ratios
Nine additional academic advisors were hired.Ninety-four percent of packaged aid to eligible students was disbursed at the beginning of the semester.Eighteen faculty were retained through counteroffers.Twenty-one faculty were hired in core areas such as sciences, mathematics, and English.
Enhance Research and Doctoral Education
Overall applications increased 29% to 642 with total requested funding increasing by 24.5% to $257 million, and awards increased 22% to ninety million.A research cluster in Attention Deficit and Hyperactivity Disorders was recruited bringing with them over $15 million in funded research.FIU awarded 127 research doctoral degrees on track to award 150 by 2013.
Advance the College of Medicine
Clinical affiliation agreements signed with Jackson Public Health Trust, Leon Medical Centers, Mercy Hospital, Miami Children's Hospital, and Mount Sinai Medical Center.Faculty Practice Plan established.Twenty-eight million in private funds raised and ten million from Miami-Dade County.NeighborhoodHELP program launched.Ground broken for on-campus ambulatory care facility.

Annual Report Data Definitions
Budget
E&G Revenues
State Funds (recurring)
Definition: State recurring funds include general revenue and lottery appropriations made by the Florida Legislature.
Source: Final Amendment Package amounts for general revenue and lottery (less non-recurring)
State Funds (non-recurring) Definition: State non-recurring funds include general revenue and
lottery appropriations made by the Florida Legislature. Source: Allocation Summary Non-Recurring Appropriations Section.
Tuition (Resident / Non-Resident)
Definition: Actual tuition revenues collected from resident and non-resident students.
Source: Operating Budget, Report 625
Tuition Differential (UG) Definition: Actual tuition differential revenues collected from
undergraduate students. Source: Operating Budget, Report 625
Other Fees Definition: Other revenue collections include items such as application
fees, late registration fees, library fines, miscellaneous revenues. Source: Operating Budget, Report 625
Phosphate Research Trust Fund
Definition: State appropriation for the Institute of Phosphate Research at the University of South Florida.
Source: Final Amendment Package
Federal Stimulus Funds Definition: Non-recurring American Recovery and Reinvestment Act
funds appropriated by the Florida Legislature. Source: Allocation Summary
E&G Expenditures
Instruction & Research
Definition: Includes expenditures for state services related to the instructional delivery system for advanced and professional education. Includes functions such as all activities related to credit instruction that may be applied toward a postsecondary degree or certificate; non-project research and service performed to maintain professional effectives; individual or project research; academic computing support; academic source or curriculum development.
Source: Operating Budget, Report 505C.
Institutes & Centers
Definition: Includes state services related to research organizations designed for mission-oriented, fundamental, and applied research projects.
Source: Operating budget, Report 505C.
PO&M
Definition: Plant Operations & Maintenance expenditures related to the cleaning and maintenance of existing grounds and facilities, the providing of utility services, and the planning and design of future plant expansion and modification.
Source: Operating Budget, Report 505C.

Administration & Support Services
Definition: Expenditures related to the executive direction and leadership for university operations and those internal management services which assist and support the delivery of academic programs.
Source: Operating Budget, Report 505C.
Radio/TV Definition: Services related to the operation and maintenance of public
broadcasting which is intended for the general public. Source: Operating Budget, Report 505C.
Library/Audio Visual Definition: Expenditures include state services related to collecting,
cataloging, storing, and distributing library materials. Source: Operating Budget, Report 505C.
Museums & Galleries
Definition: Expenditures related to the collection, preservation, and exhibition of historical materials, art objects, scientific displays and other objects at the UF Florida State Museum & Harn Museum; FSU Ringling Museum; FAMU Black Archives Museum; USF Contemporary Art Museum; FIU Wolfsonian Museum; and UWF Historic Preservation Board.
Source: Operating Budget, Report 505C.
Student Services
Definition: Includes resources related to physical, psychological, and social well being of the student. Includes student service administration, social and cultural development, counseling and career guidance, financial aid, and student admissions and records.
Source: Operating Budget, Report 505C.
Intercollegiate Athletics Definition: Includes expenditures associated with Title IX activities and
compliance. Source: Operating Budget, manual submission.
Other Funding Sources
Contracts & Grants
Definition: Resources received from federal, state or private sources for the purposes of conducting research and public service activities. Revenues do not include transfers. Expenditures do not include non-operating expenditures.
Source: Operating Budget, Report 615.
Auxiliary Enterprises
Definition: Resources associated with auxiliary units that are self-supporting through fees, payments and charges. Examples include housing, food services, bookstores, parking services, and health centers. Revenues do not include transfers. Expenditures do not include non-operating expenditures.
Source: Operating Budget, Report 615.
Local Funds
Definition: Resources associated with student activity (supported by the student activity fee), student financial aid, concessions, intercollegiate athletics, and technology fee. Revenues do not include transfers. Expenditures do not include non-operating expenditures.
Source: Operating Budget, Report 615. (Self Insurance is a manual submission and has not been included).

Other Core Resources
Revenues per FTE Student
Definition: E&G appropriations, including tuition, are divided by total student FTE. Only state-fundable credit hours are used. To allow for national comparisons, FTE for this metric uses the standard IPEDS definition of FTE, equal to 30 credit hours for undergraduates and 24 for graduates.
Sources: Operating Budget, SUS Student Instruction File
Total Faculty Tenure/ Tenure-Track, Instruction/ Research/Public Service
Definition: Combination of all tenured faculty (primarily instruction/research/public service) and all tenure-track faculty (primarily instruction/research/public service).
Source: IPEDS Human Resources Survey, online title “Full- and part-time medical and non-medical staff by faculty status and primary function/occupational activity”
Total Faculty Not on Tenure Track, Instruction/ Research/Public Service
Definition: All non-tenure-track faculty (primarily instruction/research/public service). This includes adjunct faculty and faculty on multi-year contracts.
Source: IPEDS Human Resources Survey, online title “Full- and part-time medical and non-medical staff by faculty status and primary function/occupational activity”
Total Executive/ Administrative All
Definition: Total executive/administrative and managerial positions regardless of faculty status
Source: IPEDS Human Resources Survey, online title “Full- and part-time medical and non-medical staff by faculty status and primary function/occupational activity”
Total Other Professional All
Definition: Total other professional positions (support/service) regardless of faculty status
Source: IPEDS Human Resources Survey, online title “Full- and part-time medical and non-medical staff by faculty status and primary function/occupational activity”
Total Non-Professional All
Definition: Total non-professional positions Source: IPEDS Human Resources Survey, online title “Full- and
part-time medical and non-medical staff by faculty status and primary function/occupational activity”
Total Graduate Assistants All
Definition: Total graduate assistants Source: IPEDS Human Resources Survey, online title “Full- and
part-time medical and non-medical staff by faculty status and primary function/occupational activity”
Instructional Space Utilization Rate
Definition: Subsection 1013.03 (2), F.S., establishes the utilization standard for “postsecondary education classrooms, a minimum room utilization rate of 40 hours per week and a minimum station utilization rate of 60 percent.” In other words, 100% utilization means the classroom is 60% full for 40 hours a week. This metric applies that statutory definition to classroom space only.
Source: Space File
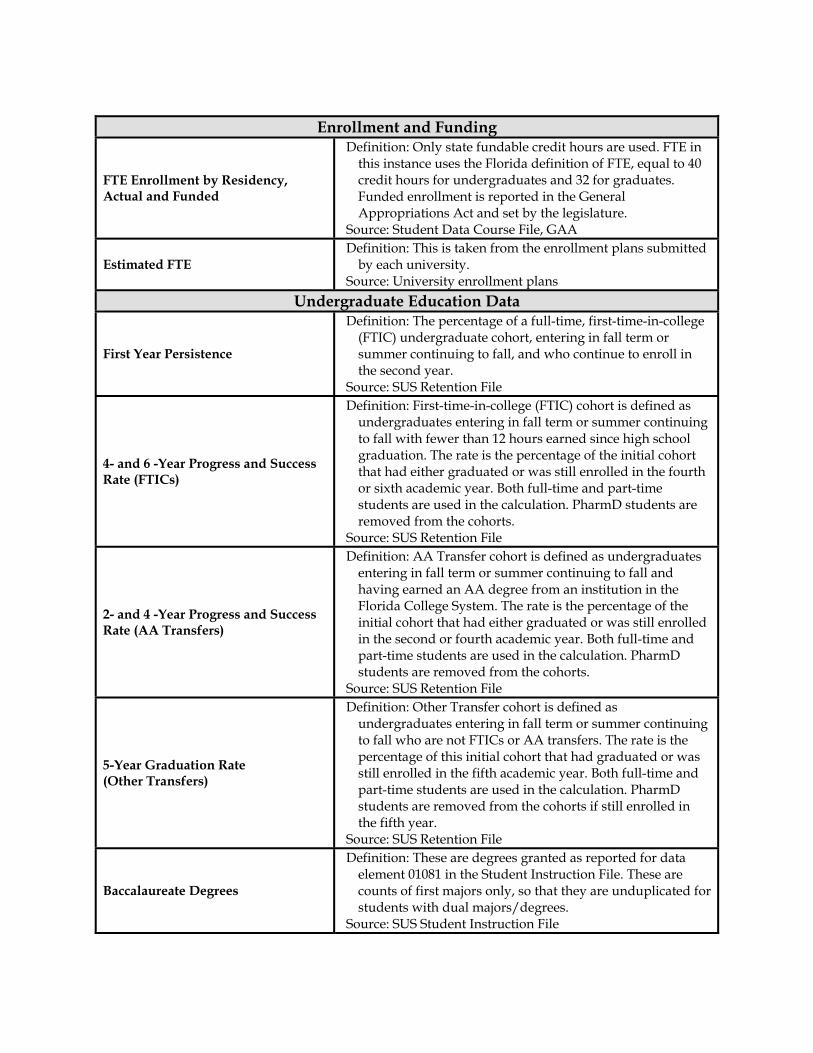
Enrollment and Funding
FTE Enrollment by Residency, Actual and Funded
Definition: Only state fundable credit hours are used. FTE in this instance uses the Florida definition of FTE, equal to 40 credit hours for undergraduates and 32 for graduates. Funded enrollment is reported in the General Appropriations Act and set by the legislature.
Source: Student Data Course File, GAA
Estimated FTE Definition: This is taken from the enrollment plans submitted
by each university. Source: University enrollment plans
Undergraduate Education Data
First Year Persistence
Definition: The percentage of a full-time, first-time-in-college (FTIC) undergraduate cohort, entering in fall term or summer continuing to fall, and who continue to enroll in the second year.
Source: SUS Retention File
4- and 6 -Year Progress and Success Rate (FTICs)
Definition: First-time-in-college (FTIC) cohort is defined as undergraduates entering in fall term or summer continuing to fall with fewer than 12 hours earned since high school graduation. The rate is the percentage of the initial cohort that had either graduated or was still enrolled in the fourth or sixth academic year. Both full-time and part-time students are used in the calculation. PharmD students are removed from the cohorts.
Source: SUS Retention File
2- and 4 -Year Progress and Success Rate (AA Transfers)
Definition: AA Transfer cohort is defined as undergraduates entering in fall term or summer continuing to fall and having earned an AA degree from an institution in the Florida College System. The rate is the percentage of the initial cohort that had either graduated or was still enrolled in the second or fourth academic year. Both full-time and part-time students are used in the calculation. PharmD students are removed from the cohorts.
Source: SUS Retention File
5-Year Graduation Rate (Other Transfers)
Definition: Other Transfer cohort is defined as undergraduates entering in fall term or summer continuing to fall who are not FTICs or AA transfers. The rate is the percentage of this initial cohort that had graduated or was still enrolled in the fifth academic year. Both full-time and part-time students are used in the calculation. PharmD students are removed from the cohorts if still enrolled in the fifth year.
Source: SUS Retention File
Baccalaureate Degrees
Definition: These are degrees granted as reported for data element 01081 in the Student Instruction File. These are counts of first majors only, so that they are unduplicated for students with dual majors/degrees.
Source: SUS Student Instruction File

Baccalaureate Degrees Awarded in Areas of Strategic Emphasis
Definition: Bachelor’s degrees as reported above by six-digit Classification of Instruction Program. The areas of strategic emphasis were selected by the Board of Governors staff with consultation with business and industry groups and input from universities. These counts may be duplicated if a student earns dual degrees in more than one strategic area.
Source: SUS Student Instruction File
# Baccalaureate Degrees (Non-Hispanic Blacks)
Definition: The number of baccalaureate degrees granted to non-Hispanic black students. These are counts of first majors only, so that they are unduplicated for students with dual majors/degrees.
Source: SUS Student Instruction File
% Baccalaureate Degrees (Non-Hispanic Blacks)
Definition: The number of baccalaureate degrees awarded to non-Hispanic black students divided by the total degrees awarded, excluding those awarded to non-resident aliens and unreported.
Source: SUS Student Instruction File
# Baccalaureate Degrees (Hispanics)
Definition: The number of baccalaureate degrees granted to Hispanic students. These are counts of first majors only, so that they are unduplicated for students with dual majors/degrees.
Source: SUS Student Instruction File
% Baccalaureate Degrees (Hispanics)
Definition: The number of baccalaureate degrees awarded to Hispanic students divided by the total degrees awarded, excluding those awarded to non-resident aliens and unreported.
Source: SUS Student Instruction File
# Baccalaureate Degrees (Pell Recipients)
Definition: The number of baccalaureate degrees granted to Pell recipients, financial aid award code “001”. A Pell recipient is defined as a student who received Pell within six years of graduation. These are counts of first majors only, so that they are unduplicated for students with dual majors/degrees.
Source: SUS Student Instruction File and Student Financial Aid File

% Baccalaureate Degrees (Pell Recipients)
Definition: The number of baccalaureate degrees awarded to Pell recipients as listed above is divided by the total degrees awarded excluding those awarded to non-resident aliens.
Source: SUS Student Instruction File and Student Financial Aid File
% of Total Baccalaureate Degrees Awarded Within 110% of Hours Required for Degree
Definition: For data reported through 2008-09, this metric will be aligned with the calculation used in past legislative accountability reports and performance funding calculations. Excluding students with dual majors, it computes total academic credit as a percentage of catalog hours required for the student’s major (excluding remedial coursework). For the purposes of calculating excess hours, remedial credit hours includes up to 10 foreign language credit hours that are excluded for transfer students in Florida.
Source: SUS Hours to Degree File
Number of Undergraduate Course Sections
Definition: The Common Data Set (CDS) definition will be used. According to CDS, a “class section is an organized course offered for credit, identified by discipline and number, meeting at a stated time or times in a classroom or similar setting, and not a subsection such as a laboratory or discussion session. Undergraduate class sections are defined as any sections in which at least one degree-seeking undergraduate student is enrolled for credit. Exclude distance learning classes and noncredit classes and individual instruction such as dissertation or thesis research, music instruction, or one-to-one readings. Exclude students in independent study, co-operative programs, internships, foreign language taped tutor sessions, practica, and all students in one-on-one classes. Each class section should be counted only once and should not be duplicated because of course catalog cross-listings.” Certain portions of the CDS were summed to create groupings of less than 30 students, between 31 and 50 students, between 51 and 100 students, and more than 100 students.
Source: Common Data Set
% of Undergraduate Class Time Taught by Faculty, Adjunct Faculty, Graduate Students, and Others
Definition: The total number of undergraduate credit hours taught will be divided by the undergraduate credit hours taught by each instructor type to create a distribution of the percentage taught by each instructor type. Four instructor types are defined as: faculty (pay plans 01, 02, and 22), OPS faculty (pay plan 06), graduate student instructors (pay plan 05), and others (all other pay plans). If a course has more than one instructor, then the total student credit hours for that course will be divided equally among the multiple instructors.
Source: Instruction and Research Data File
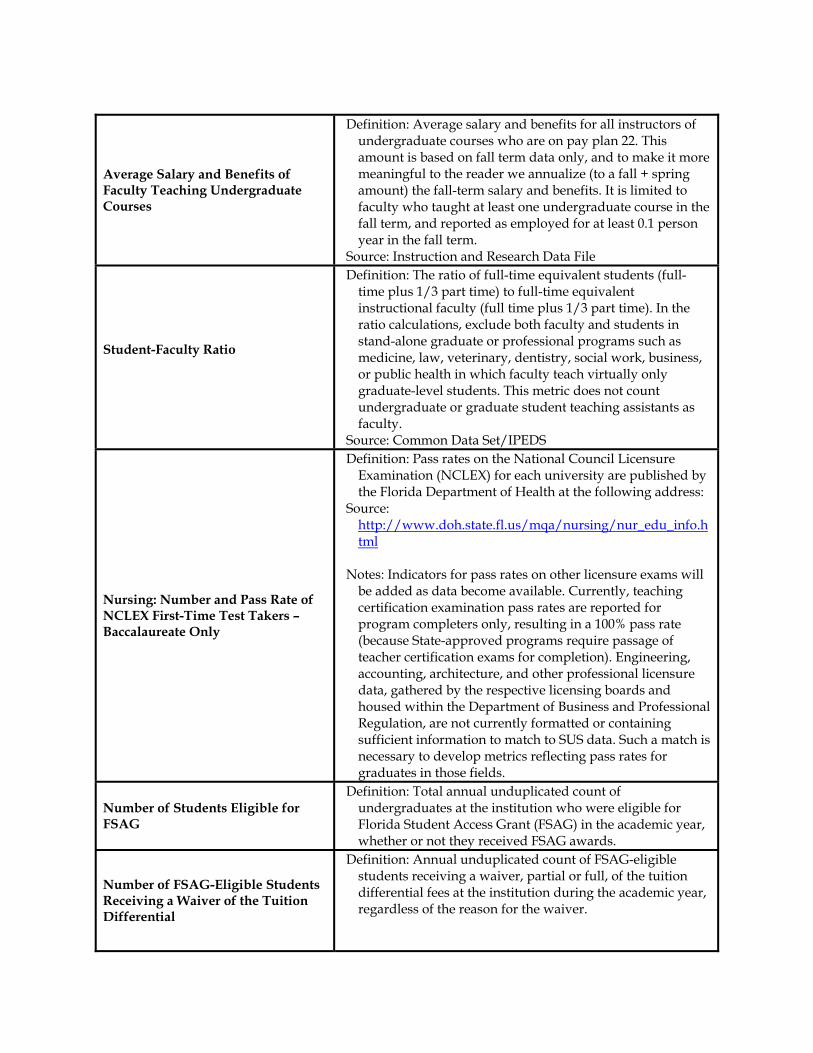
Average Salary and Benefits of Faculty Teaching Undergraduate Courses
Definition: Average salary and benefits for all instructors of undergraduate courses who are on pay plan 22. This amount is based on fall term data only, and to make it more meaningful to the reader we annualize (to a fall + spring amount) the fall-term salary and benefits. It is limited to faculty who taught at least one undergraduate course in the fall term, and reported as employed for at least 0.1 person year in the fall term.
Source: Instruction and Research Data File
Student-Faculty Ratio
Definition: The ratio of full-time equivalent students (full-time plus 1/3 part time) to full-time equivalent instructional faculty (full time plus 1/3 part time). In the ratio calculations, exclude both faculty and students in stand-alone graduate or professional programs such as medicine, law, veterinary, dentistry, social work, business, or public health in which faculty teach virtually only graduate-level students. This metric does not count undergraduate or graduate student teaching assistants as faculty.
Source: Common Data Set/IPEDS
Nursing: Number and Pass Rate of NCLEX First-Time Test Takers – Baccalaureate Only
Definition: Pass rates on the National Council Licensure Examination (NCLEX) for each university are published by the Florida Department of Health at the following address:
Source: http://www.doh.state.fl.us/mqa/nursing/nur_edu_info.html
Notes: Indicators for pass rates on other licensure exams will
be added as data become available. Currently, teaching certification examination pass rates are reported for program completers only, resulting in a 100% pass rate (because State-approved programs require passage of teacher certification exams for completion). Engineering, accounting, architecture, and other professional licensure data, gathered by the respective licensing boards and housed within the Department of Business and Professional Regulation, are not currently formatted or containing sufficient information to match to SUS data. Such a match is necessary to develop metrics reflecting pass rates for graduates in those fields.
Number of Students Eligible for FSAG
Definition: Total annual unduplicated count of undergraduates at the institution who were eligible for Florida Student Access Grant (FSAG) in the academic year, whether or not they received FSAG awards.
Number of FSAG-Eligible Students Receiving a Waiver of the Tuition Differential
Definition: Annual unduplicated count of FSAG-eligible students receiving a waiver, partial or full, of the tuition differential fees at the institution during the academic year, regardless of the reason for the waiver. xxxxxxxxxxxxxxxxxxxxxxxxxxxxxxxxxxxxxxxxxxxxxxxxxxxx

Value of Tuition Differential Waivers Provided to FSAG-Eligible Students
Definition: Value of all tuition differential fee waivers received by FSAG-eligible undergraduates at the institution during the academic year, regardless of the reason for the waiver.
Graduate Education Data
Graduate Degrees Awarded
Definition: These are degrees granted as reported for data element 01081. Due to changes in IPEDS, the doctoral and first professional degree categories no longer exist. Now they are classified as doctoral research and doctoral professional with the doctoral professional including additional categories that had not previous been included in the first professional category. The universities reviewed their programs and made the classifications of their programs. The professional doctoral category will include all degrees in this category. Medicine, Law, and Pharmacy degrees will be reported as a sub-category of professional doctoral degrees. These are counts of first majors only, so that they are unduplicated for students with dual majors/degrees.
Source: SUS Student Data Course File, element #01081 (“Degree-Level Granted”)
Graduate and Professional Degrees Awarded in Areas of Strategic Emphasis
Definition: Graduate degrees as reported above by six-digit Classification of Instruction Program. The areas of strategic emphasis were selected by the Board of Governors staff with consultation with business and industry groups and input from universities. These counts may be duplicated if a student earns dual degrees in more than one strategic area.
Research and Economic Development
Federally Financed Academic Research and Development Expenditures (Actual Dollars)
Definition: Each year the National Science Foundation conducts a survey of colleges and universities regarding research and development expenditures. Item 2A, Line 1400, science and engineering, is summed with Line 1500, non-science and engineering expenditures of column (2) Federal. Dollars are in thousands.
Source: http://webcaspar.nsf.gov/

Total Academic Research and Development Expenditures (Actual Dollars)
Definition: Each year the National Science Foundation conducts a survey of colleges and universities regarding research and development expenditures. Item 2A, Line 1400, science and engineering, is summed with Line 1500, non-science and engineering expenditures of column (1) Total. Dollars are in thousands.
Source: http://webcaspar.nsf.gov/
Total Academic Research and Development Expenditures Per Full-Time, Tenured, Tenure-Earning Faculty Member
Definition: Total R&D expenditures are divided by fall, full-time tenured/tenure-track faculty as reported to IPEDS. (For FGCU, the ratio will be based on both tenured/tenure-track and non-tenure-track faculty.) The fall faculty year used will align with the beginning of the fiscal year, so that (e.g.) 2007 FY R&D expenditures are divided by fall 2006 faculty.
Sources: NSF Webcaspar database (R&D expenditures) and IPEDS (full-time faculty)
Invention Disclosures Received
Definition: Disclosures, no matter how comprehensive, that are made in the fiscal year.
Source: The Association of University Technology Managers (AUTM) Licensing Survey (or using AUTM definitions for institutions that do not participate in that survey)
Total U.S. Patents Issued Definition: U.S. patents issued or reissued in the fiscal year. Source: AUTM Licensing Survey (or using AUTM definitions for
institutions that do not participate in that survey) Patents Issued Per 1,000 Full-Time, Tenure and Tenure Earning Faculty
Sources: AUTM Licensing Survey or comparably defined data from institutions (patents) and IPEDS (full-time faculty)
Total Number of Licenses/Options Executed
Definition: Licenses/options executed in the fiscal year for all technologies. Each agreement is counted separately.
Source: AUTM Licensing Survey (or using AUTM definitions for institutions that do not participate in that survey)
Total Licensing Income Received
Definition: License issue fees, payments under options, annual minimums, running royalties, termination payments, amount of equity received when cashed-in, and software and biological material end-user license fees of $1,000 or more, but not research funding, patent expense reimbursement, valuation of equity not cashed-in, software and biological material end-user license fees of less than $1,000, or trademark licensing royalties from university insignia.
Source: AUTM Licensing Survey (or using AUTM definitions for institutions that do not participate in that survey)
Jobs Created by Start-Ups in Florida
TBD

Centers of Excellence
These metrics are consistent with the 2007-08 submissions for the annual Centers of Excellence report and should be reported in 2008-09 in a manner consistent with the prior year.
Voluntary Support for Higher Education
Endowment Market Value
Definition: Endowment value at the end of the fiscal year, as reported in the annual NACUBO Endowment Study (changed to the NACUBO-Common Fund Study of Endowments in 2009).
Source: NACUBO Endowment Study (or using NACUBO definitions for institutions that do not participate in that survey)
Annual Gifts Received
Definition: As reported in the Council for Aid to Education’s Voluntary Support of Education (VSE) survey in the section entitled “Gift Income Summary,” this is the sum of the present value of all gifts (including outright and deferred gifts) received for any purpose and from all sources during the fiscal year. (There’s a deferred gift calculator at www.cae.org/vse.) It does not include pledges and bequest intentions. The present value of non-cash gifts is defined as the tax deduction to the donor as allowed by the IRS.
Source: Voluntary Support of Education survey (or using VSE definitions for institutions that do not participate in that survey)
Percentage of Alumni Who Are Donors
Definition: As reported in the Council for Aid to Education’s Voluntary Support of Education (VSE) survey in the section entitled “Additional Details,” this is the number of alumni donors divided by the total number of alumni, as of the end of the fiscal year. “Alumni,” as defined in this survey, include those holding a degree from the institution as well as those who attended the institution but did not earn a degree.
Source: Voluntary Support of Education survey (or using VSE definitions for institutions that do not participate in that survey)