2009 10 NatGas Info
29
Oil & Gas Producers October 7 , 20 09 Calgary , Alberta Mark Leggett, CFA (403) 515-1508 [email protected] Associate: Jason Chang (403) 515-1527 [email protected] This report was prepared by an Analyst employed by a Canadian ailiate, BMO Nesbitt Burns Inc., and who is not registered as a research analyst under FINRA rules. For disclosure statements, including the Analyst’s Certifcat ion, please reer to pages 26 to 27 . PetroBakken Energy Ltd. (PBN – TSX) Stock Rating: Outperorm Industry Rating: Market Perorm Initiating at Outperorm; Leading the Canadian Bakken T echnology Evolution Price (5-Oct) $31.27* 52-Week High na Target Price $36.00 52-Week Low na (FY – Dec) 2008A 2009E 2010E CFPS na $2.89 $3.92 P/CFPS 10.8x 8.0x EPS na -$0.19 $0.85 P/EPS na 36.8x CF/boe na $32.25 $45.78 EV/EBITDA na 12.9x 9.1x ROCE na -2% 4% D/CF na 1.4x 1 .1x Dividend $0.96 Yield 3.1% Book Value $15.81 Price/Book 2.0x Shares O/S (mm) 171.9 Mkt. Cap ($mm) $5,374* Float O/S (mm) na Float Cap ($mm) na Notes: EPS (diluted), CFPS (diluted); *Implied share pr ice based on TOG closing price Highlights • PetroBakken’ slandholdingsofonemillionnetacres areunderpinned byitssignicantacreagepositionintheBakkenplayandcomplemented bythehigh-impactMontneyandHornRivernaturalgasshaleplays inNEBC.Petro BakkenwillbeledbyJohnD .Wright asChairman andCEO,andR.GreggSmithasPresidentandCOO.PetroBakken manag ement hasplayeda key rol e in pionee ringthe evo lutionof multi-sta gefracsintheB akkenpla yinsoutheastSaska tchewan.On arelativebasistoothersignicantoilplaysinWesternCanada,we estimatetheeconomicsoftheBakkenplayareunmatched. • Weproject 2009Eand2010ECFPSof $2.89and$3.92,respective ly . Ournancialestimatesarebasedon a ver age pr oduct ionof 42,15 8 boe/din2009Eand40,356boe/d(95%lightoil)in2010E.PetroBakken planstodiv est9,500boe/d andexit2009 at37,000boe/d. • Basedon TriSt ar’ sclosingprice,Petrobakk enshare sare tradingat animpliedvaluationof8.0xP/CFPSand9.1xEV/EBITDA*.Our targetpriceissupportedbyoursum-of-partsconsolidatedvalueof $35.72pershareusingaatlong-termCanadianparcrudepriceof $80/bblan dAECOnaturalgas priceassumptionof$6.00/Mcf .Our unbookeddrillingin ventoryvaluation isbased onthe detailedper well NPV(BT-10%)analysisofthecompany’sBakkenandConventional playsinSESaska tchewan,aswe llastheNEBCMontneyandHorn Riv erplays . Ourriske d anal ysissumsto tota l unbooked resourc e potentialof375MMboe. • Weareinitiatingcoverage withanOutperformratingandtargetprice of$36.PetroBakkensharesbegantradingonOctober6,2009,under thetickerPBNontheTSX.
Transcript of 2009 10 NatGas Info

8/3/2019 2009 10 NatGas Info
http://slidepdf.com/reader/full/2009-10-natgas-info 1/29
Oil & Gas
Producers
October 7, 2009Calgary, Alberta
Mark Leggett, CFA
(403) 515-1508
Associate: Jason Chang
(403) 515-1527
This report was prepared by an Analyst employed by a Canadian ailiate, BMO Nesbitt Burns Inc., and who is not registered as a researchanalyst under FINRA rules. For disclosure statements, including the Analyst’s Certifcation, please reer to pages 26 to 27.
PetroBakken EnergyLtd.(PBN – TSX)
Stock Rating: Outperorm
Industry Rating: Market Perorm
Initiating at Outperorm; Leading the
Canadian Bakken Technology Evolution
Price (5-Oct) $31.27* 52-Week High na
Target Price $36.00 52-Week Low na
(FY – Dec) 2008A 2009E 2010E
CFPS na $2.89 $3.92
P/CFPS 10.8x 8.0x
EPS na -$0.19 $0.85
P/EPS na 36.8x
CF/boe na $32.25 $45.78
EV/EBITDA na 12.9x 9.1xROCE na -2% 4%
D/CF na 1.4x 1.1x
Dividend $0.96 Yield 3.1%
Book Value $15.81 Price/Book 2.0x
Shares O/S (mm) 171.9 Mkt. Cap ($mm) $5,374*
Float O/S (mm) na Float Cap ($mm) na
Notes: EPS (diluted), CFPS (diluted); *Implied share pr icebased on TOG closing price
Highlights
• PetroBakken’slandholdingsofonemillionnetacresareunderpinned
byitssignicantacreagepositionintheBakkenplayandcomplemented
bythehigh-impactMontneyandHornRivernaturalgasshaleplays
inNEBC.PetroBakkenwillbeledbyJohnD.WrightasChairman
andCEO,andR.GreggSmithasPresidentandCOO.PetroBakken
management hasplayeda key role in pioneeringthe evolutionof
multi-stagefracsintheBakkenplayinsoutheastSaskatchewan.On
arelativebasistoothersignicantoilplaysinWesternCanada,weestimatetheeconomicsoftheBakkenplayareunmatched.
• Weproject2009Eand2010ECFPSof$2.89and$3.92,respectively.
Ournancialestimatesarebasedon average productionof 42,158
boe/din2009Eand40,356boe/d(95%lightoil)in2010E.PetroBakken
planstodivest9,500boe/dandexit2009at37,000boe/d.
• Basedon TriStar’sclosingprice,Petrobakkensharesare tradingat
animpliedvaluationof8.0xP/CFPSand9.1xEV/EBITDA*.Our
targetpriceissupportedbyoursum-of-partsconsolidatedvalueof
$35.72pershareusingaatlong-termCanadianparcrudepriceof
$80/bblandAECOnaturalgaspriceassumptionof$6.00/Mcf.Our
unbookeddrillinginventoryvaluationisbasedonthedetailedperwell
NPV(BT-10%)analysisofthecompany’sBakkenandConventional
playsinSESaskatchewan,aswellastheNEBCMontneyandHorn
Riverplays. Ourrisked analysissumsto total unbooked resource
potentialof375MMboe.
• WeareinitiatingcoveragewithanOutperformratingandtargetprice
of$36.PetroBakkensharesbegantradingonOctober6,2009,under
thetickerPBNontheTSX.

8/3/2019 2009 10 NatGas Info
http://slidepdf.com/reader/full/2009-10-natgas-info 2/29

8/3/2019 2009 10 NatGas Info
http://slidepdf.com/reader/full/2009-10-natgas-info 3/29
Table o Contents
ExecutiveSummary:SumofParts–NAVRoadMap................................................................................................... 2
TheBakkenPrize–SuperiorEconomics.................................................................................................................... 2
Operations:MultipleResourceGrowthPlatforms......................................................................................................... 3
LeadingtheCanadianBakkenTechnologyEvolution.................................................................................................. 4
HigherFracIntensityPerformance............................................................................................................................. 5
NorthDakotaOperationalTrends-TestingtheLimits.............................................................................................. 6
BakkenBilateralWellNPVAnalysis.......................................................................................................................... 8
EconomicsComparison.............................................................................................................................................. 9
Re-EntryOpportunities–CompellingLow-HangingFruit...................................................................................... 10
BakkenUnbookedDevelopmentProgramValuationSummary............................................................................... 12
IndustryBakkenSandbox–PeerComparables........................................................................................................... 13
BakkenComparables................................................................................................................................................ 14
BakkenInfrastructure.............................................................................................................................................. 14
SESaskatchewanConventionalInventory................................................................................................................... 15
NEBCShaleGas:MontneyandHornRiver............................................................................................................. 16
MontneyNPVAnalysis............................................................................................................................................ 17
HornRiver............................................................................................................................................................... 18
HornRiverNPVAnalysis........................................................................................................................................ 20
H2/09and2010Outlook.............................................................................................................................................. 21
PetroBakkenProle.................................................................................................................................................... 21
Management................................................................................................................................................................ 22
FinancialOutlook........................................................................................................................................................ 22
Valuation..................................................................................................................................................................... 24
InvestmentRisks.......................................................................................................................................................... 25
8/3/2019 2009 10 NatGas Info
http://slidepdf.com/reader/full/2009-10-natgas-info 4/29
Page 2 PetroBakken Energy Ltd.
Executive Summary: Sum o Parts – NAV Road Map
Oursum-of-partsvaluationofPetroBakken’sunbookeddrillinginventoryimpliesavalu-
ationof$24.97pershareusingaatlong-termCanadianparcrudepriceof$80/bbland
AECOnaturalgaspriceassumptionof$6.00/Mcf.Ourunbookeddrillinginventoryvalu-
ationisbasedonthedetailedperwellNPV(BT-10%)analysisofthecompany’sBakken
andConventionalplaysinSESaskatchewan,aswellastheNEBCMontneyandHorn
Riverplays(seeOperations:MultipleResourceGrowthPlatforms).Ourriskedanalysis
sumstototalunbookedresourcepotentialof375MMboe.
Table 1: Unbooked Drilling Inventory NPV Valuation (Cdn. Par $80/bbl)
Drilling Chance of Per F.D. F&D Cost RecycleCore Area Inventory Success Share Per Well Potential ($/boe) Ratio
SE Sask. Bakken Dev. (30-Stage Bilaterals) 893 90% $16.77 237.5 MMboe 191 MMboe $9.79 4.8x
SE Sask. Bakken Re-Entry 400 90% $1.75 75.0 Mboe 27 MMboe $11.33 3.9x
SE Sask Bakken 1,293 $18.52 218 MMboe
SE Sask. Conventional 238 90% $2.35 100.0 Mboe 21 MMboe $10.00 4.3x
NEBC Montney 67 80% $1.39 4.8 Bcfe 257 Bcfe $6.31 3.3x
NEBC Horn River 112 50% $2.71 10.0 Bcfe 560 Bcfe $6.03 3.3x
Total Unbooked Drilling Inventory 1,710 $24.97 375 MMboe
Risked Reserves
Note: Horn River exploration inventory double risked - based on 33% prospective lands and 50% chance o exploration success
Source: BMO Capital Markets
Wehaveaddedtheunbookeddrillinginventoryvaluationtotheproformareservebase
valueof$10.76pershare.Assuch,weestimateaconsolidatedvalueof$35.72pershare
aftertakingintoaccountnetdebtandtaxpools.Wehaveincludedasensitivityonour
sum-of-partsanalysisthatimpliesavaluerangeof$27.02–44.41persharebasedonat
CanadianparcrudeoilandAECOnaturalgaspriceassumptionsof$70–90/bbland
$5–7/Mcf,respectively.
Table 2: Sum o Parts (Cdn. Par $80/bbl) Table 3: Sum o Parts Sensitivity
2008 Reserve Blowdown $12.57Add: Tax Pools $2.21Less: Net Debt $4.02
2008 NAV $10.76Total Unbooked Drilling Inventory $24.97
Sum of Parts $35.72
$70.00 $80.00 $90.00
$27.02 $35.72 44.41$
Cdn. Par ($/bbl)
Source: BMO Capital Markets Source: BMO Capital Markets
The Bakken Prize – Superior Economics
OnarelativebasistoothermajoroilplaysinWesternCanada,weestimatetheeconomics
oftheBakkenplayareunmatched.Specically,wehavecomparedtheeconomicsofa
typical11-stageandestimated30-stagebilateralBakkenwellagainstwellsintheAlberta
Cardium,SESaskatchewanShaunavonandSWSaskatchewanVikingoilplays.Asshown

8/3/2019 2009 10 NatGas Info
http://slidepdf.com/reader/full/2009-10-natgas-info 5/29
PetroBakken Energy Ltd. Page 3
below,weestimateBakkenwellshaveahigherNPVandIRRthanothermajoroilplays.
Additionally,Bakkenwellsoutperformtheseplaysonvariouseconomicmeasures,includ-
ingF&Dcost,payoutandrecycleratio.
Table 4: Single Well Economic Comparison o Various Oil Plays (Cdn. Par $80/bbl)SE Sask. SW Sask. Alberta Alberta
30-stage Bakken
Bilateral Long Hz Well
11-Stage Bakken Long Hz
Well
Shaunavon Hz
WellViking Hz Well
Cardium Hz Well Inc.
Incentives
Cardium Hz Well No
Incentives
Drill Cost Per Well $2.3 $1.7 $1.9 $1.7 $3.2 $3.2NPV (10%) Per Well ($ mm) $5.6 $2.8 $1.9 $1.1 $2.6 $2.0
IRR Per Well (%) 91% 64% 40% 29% 30% 23%
F&D Cost ($/boe) $9.79 $13.60 $15.20 $27.20 $18.29 $18.29Recycle Ratio 5.1x 3.9x 2.9x 2.1x 2.9x 2.7xPayout (years) 0.5 0.8 1.3 2.3 2.4 3.3
Companies In Play PBN PBN, CPG, NAE.UN, GLM PWT.UN, CPG PWT.UN, BTE.UN, CPG NAE.UN, PWT.UN NAE.UN, PWT.UN
SE Sask
Note: Based on operating netback to acilitate comparable analysis; Economic analysis or PBN within this report is based on cash fow netback.
Source: BMO Capital Markets, Company Reports
Operations: Multiple Resource Growth Platorms
PetroBakken’slandholdingsofonemillionnetacresareunderpinnedbyitssignicant
acreage positioninthe Bakkenplayandcomplementedby thehigh-impactMontney
andHornRivernaturalgasshaleplaysinNEBC.ThecompanyplanstosellAlberta
assetscomprisedof9,500boe/dand40.1MMboeto“wipetheslateclean”andfocuson
high-returnopportunitieswithinneighbouringprovinces(wehaveassumedsalemetrics
of$40,000/boe/dand$9.50/boeinQ4/09forthepurposesofourworkingmodel).
Chart 1: NPV Per Well and IRR (Cdn. Par Crude $80/bbl) Chart 2: F&D Cost, Payout (years) and Recycle Ratio
$0.0
$1.0
$2.0
$3.0
$4.0
$5.0
$6.0
30-stage Bakken
Bilateral Long Hz
Well
11-Stage Bakken
Long Hz Well
Shaunavon Hz Well Viking Hz Well Cardium Hz Well
Inc. Incentives
Cardium Hz Well
No Incentives
N P V P e r W e l l ( $ m m )
0%
10%
20%
30%
40%
50%
60%
70%
80%
90%
100%
I R R ( % )
NPV Per Well($ mm)
IRR (%)
$0.00
$5.00
$10.00
$15.00
$20.00
$25.00
$30.00
30-stage Bakken
Bilateral Long Hz
Well
11-Stage Bakken
Long Hz Well
Shaunavon Hz Well Viking Hz Well Cardium Hz Well
Inc. Incentives
Cardium Hz Well
No Incentives
F & D C
o s t ( $ / b o e )
0.0
1.0
2.0
3.0
4.0
5.0
6.0
P a y o u t ( y e a r s ) / R e c y c l e R a t i o
RecycleRatio
Payout(years)
F&D Cost($/boe)
Source: BMO Capital Markets Source: BMO Capital Markets

8/3/2019 2009 10 NatGas Info
http://slidepdf.com/reader/full/2009-10-natgas-info 6/29
Page 4 PetroBakken Energy Ltd.
Leading the Canadian Bakken Technology Evolution
PetroBakkenmanagementhasplayedakeyroleinpioneeringtheevolutionofmulti-
stagefracsintheBakkenplayinsoutheastSaskatchewan,highlightedbythecompany’s
closerelationshipwithPackersPlus(#1customerstatus) 1.Theevolutionofhigherfrac
intensitytechnology(morefracswithinasinglewellbore)potentiallyindicateshigher
expectedultimaterecoveries(EURs)basedonearlydrillingresults.
Asshownbelow,drillingmethodshaveevolvedfromtheoriginal8-to11-stagefracswithin
alongwell(1,400metres)toshorterwells(600metres)usingthesamenumberoffracs
(8x2=16fracs),followedbybilateralshortwells(8x4=32fracs).Shortwellscontinueto
performgenerallyinlinewithlongwells,whichimplieshigherreserverecoverypotential
persectionofland.Morerecently,PetroBakkenannouncedthatitsrst long horizontal
well using 20-stage racs initiallytestedatmorethan400boe/d.Basedonthisinitial
success,thecompanyexpectstotestlong bilateral wells,representingthenextpotential
evolutionintheBakkenplay.Managementhasspokentoinitiallyexecuting15-stagefracsineachleg(15x2=30fracs).
Figure 1: CanadianBusiness Unit
Source: Company Reports
1 Dan Themig (President o Packers Plus Energy Services) is a director on PetroBakken’s board odirectors.

8/3/2019 2009 10 NatGas Info
http://slidepdf.com/reader/full/2009-10-natgas-info 7/29
PetroBakken Energy Ltd. Page 5
Bottomline,weexpectimprovedcapitalefcienciesondecliningFD&Ametrics,result-
inginhigherrecycleratiosonhigherbilateralEURs.Theeconomicbenetsofbilateral
drillingarefurtherhighlightedbycompellingeconomicsonthere-entryprogram(see
“Re-EntryOpportunities–CompellingLow-HangingFruit”).
Higher Frac Intensity Performance
Theapplicationofhigherfracintensitywithinalongerwellisstillearlydaysgiventhat
PetroBakkenhasonlyfourwellswithinitialdatapointstodate.Assuch,theproductiv-
ityofeachfracandEURisstilltobedeterminedbutdatatodateisveryencouraging.
Managementbelievesthefracperformancein20-stagelongwellsor30-stagebilateral
longwellsisnotnecessarilyalinearrelationshipduetothepotentialdepletionofenergy
withinthereservoirthatdiminishestheabilitytopushoiloutofthesystemovertime.
Thisspeakstothepotentialforasecondaryrecoverywateroodprograminthelongterm
tomaintainreservoirpressureandproduceremainingbarrels. However,PetroBakken
hasreported~12,000bblincumulativeproductionon20-stagelongwellsintherst35
days,whichiswellaheadofour11-stagelongwelltypecurveof~5,000bbloverthesame
timeperiod,potentiallyindicatinghigherperwellEURandassociatedrecoveryfactor
persectionofland.
Figure 2: Evolution o Technology in the BakkenPlay
•Original Development: Long Hz Wells (11 stages) •Evolution: Short Hz Wells (16 stages)
•Evolution: Short Bilateral Hz Wells (32 stages) •Evolution: Long Bilateral Hz Wells (30+stages)
•Original Development: Long Hz Wells (11 stages) •Evolution: Short Hz Wells (16 stages)
•Evolution: Short Bilateral Hz Wells (32 stages) •Evolution: Long Bilateral Hz Wells (30+stages)
Source: PetroBakken

8/3/2019 2009 10 NatGas Info
http://slidepdf.com/reader/full/2009-10-natgas-info 8/29
Page 6 PetroBakken Energy Ltd.
North Dakota Operational Trends - Testing the Limits
Furtheradvancementsinhigherfracintensitytechnologycanbeseensouthoftheborder
intherelativelydeeperNorthDakotaBakkenplay.Industrypeersintheplayhavealso
reportedearlydaysstronginitialsuccesswith20-stageintervalfracsandarenowtesting
28-stagefracsversus7-to12-stagefracsinprioryears.
Chart 3: Short Bilateral 91/02-10-009-10W2 Chart 4: 20-Stage Frac Wells
Source: Company Reports Source: Company Reports
Figure 3: North DakotaFrac Technology
Source: Brigham Exploration

8/3/2019 2009 10 NatGas Info
http://slidepdf.com/reader/full/2009-10-natgas-info 9/29
PetroBakken Energy Ltd. Page 7
TheoperationaltrendsinNorthDakotaprovideacomparable(albeitnotadirectcom-
parable)thatspeakstoimprovedEURsonhigherfracintensity.PetroBakkenplansto
replicatethisthemeofimprovedrecoveryfactors,resultinginlowerF&Dandrisingrecycle
ratios,asshownbelow.Clearly,industryplayerswillcontinuetotestreservoirlimitsto
optimizetheleveloffracintensitythatworksfortheBakkenplay,withPetroBakken
leadingthetechnicalevolutioninSESaskatchewan.Theimprovingcapitalefciencies
fromtheevolutionindrillingtechnologyarehighlightedbythedoublingofrecoveryfac-
torsfrom12%(11-stagelongwells)topotentially23%withthe30-stagelongbilaterals,
resultinginareductionofF&Dcoststo~$10/boefrom~$16/boe.
Chart 5: Recoverable Reserves per Section and F&D Trend
0
100,000
200,000
300,000
400,000
500,000
600,000
700,000
800,000
900,000
1,000,000
1,100,000
1,200,000
11-Stage Long 8-Stage Short 15-Stage Short Bilateral 20-Stage Long 30-Stage Long Bilateral
( b b l s )
$0.00
$2.00
$4.00
$6.00
$8.00
$10.00
$12.00
$14.00
$16.00
$18.00
( $ / b o e )
Rec. Reserves Per Section F&D
CAPITAL EFFICIENCIESRESERVE RECOVERY
11.9% RF
17.6% RF
22.6% RF 22.6% RF
17.6% RF
Note: Short well data based on company estimates
Source: BMO Capital Markets, Company Reports
Additionally,ContinentalResources(CLR-NYSE)hasreportedasuccessfulwellfrom
theSanishformationinNorthDakota(Mathistad2-35H–testedat995boe/d),which
initiallyindicatedaseparateproductivereservoirbelowtheBakkenformation(nocom-
municationbetweentheBakkenandThreeForks/Sanishreservoirs)2.Industryiscur-
rentlyexploringSanishpotentialinSESaskatchewanintheTablelandregion,whichmay
representexplorationopportunitiesinthelongterm.PetroBakkenalsoholdsmorethan
80,000netacresinMontana.
2 Continental Resources - The Mathistad 2-35H was drilled horizontally in the Middle Bakken (MB) zoneapproximately 50 eet above and essentially parallel to the horizontal o the Mathistad 1-35H.

8/3/2019 2009 10 NatGas Info
http://slidepdf.com/reader/full/2009-10-natgas-info 10/29
Page 8 PetroBakken Energy Ltd.
Bakken Bilateral Well NPV Analysis
Withtheevolutionofdrillingtechnologyandearlysuccesstodate,managementplans
toexecute30-stagelongbilateralwells(15fracsineachleg).Aspreviouslymentioned,
thefracperformancein bilateralwellsis unknownat this time andfracperformance
maynotbelinearduetodepletionofreservoirenergy.Assuch,wehaverunaNPVperwellsensitivityanalysisforthebilateralwellsusingvariousrecoverablereservescenarios.
Ourbilateralrecoverablereservescenariosarebasedonfracperformancethathasbeen
calibratedusingthefollowingassumptions:
• thepotentialfordecreasedfracperformanceoverthelifeof thewell(~6,700bbl/frac)
forrecoverablereservesperwellof200,000bbl(100,000bblperleg);
• PBN’simpliedfracperformanceon30-stagelongbilateralwells(~8,000bbl/frac)for
recoverablereservesperwellof237,500bbl(118,750bblperleg);and
• PBN’simpliedfracperformanceon20-stagelongwells(~9,250bbl/frac)forrecoverable
reservesperwellof277,500bbl(138,750bblperleg).
Referencingthetypecurvefor11-stagefraclongwellsspudsince2007frompubliclyavail-
abledata,wehaveprojectedaverage-typecurvesbasedontherecoverablereservescenarios
for30-stagelongbilaterals(15fracsineachleg)previouslymentioned(200,000–277,500
bbl).Webelievetheserecoverablereservescenariosprovidethegoalpostsforwhether
fracperformanceexceedsordoesnotmeetexpectations.OurNPVanalysisalsoassumes
drillingcostsof$2.3millionperwellandanall-incashownetbackbasedonvarious
assumptions, including operatingcosts of $5.75/boe and Saskatchewan’s incentivized
royaltyrateof2.5%ontherst37,500bblofproductionand25%thereafter.
Figure 4: Montana/NorthDakota Bakken ShaleCross-Section
Source: Continental Resources

8/3/2019 2009 10 NatGas Info
http://slidepdf.com/reader/full/2009-10-natgas-info 11/29
PetroBakken Energy Ltd. Page 9
WeestimateanNPVvaluerangeof$3.1–7.5millionperwellatvariousCanadianpar
crudeoilpricesandrecoverablereservescenarios.Oursum-of-partsvaluationanalysis
isbasedonarecoverablereservescenarioof237,500bblatCanadianparcrudeof$80/
bbl.Weestimatethebreakevencrudeoilpriceforthis30-stagelongbilateralwellis~$36/
bbl(IRR10%).PetroBakkenholdsanunbookeddrillinginventoryof893netBakken
locations.Assuch,weestimateanunbookeddevelopmentinventoryvaluationrangeof
$10.12–24.89(Table6),basedonaprojecteddrillingprogramoutto2017andarisked
chanceof success(COS)of 90%atvarious recoverablereserveandcommodityprice
scenarios.
Chart 6: PBN Bakken Well Profle Versus Long Bilateral Projected Production Profles
0
50
100
150
200
250
300
350
400
450
1 2 3 4 5 6 7 8 9 10 11 12
Month
b / d
PBN Bakken Well 200,000 bbls 237,500 bbls 277,500 bbls
Source: BMO Capital Markets, GeoScout
Table 5: 30-Stage (15 Per Leg) Bilateral NPV Per Well Sensitivity Matrix
Table 6: 30-Stage (15-Per Leg) Bilateral UnbookedInventory Valuation
Cdn. Par Crude Oil ($/bbl)$70.00 $80.00 $90.00
200,000 $3.1 $4.0 $5.0
237,500 $4.0 $5.1 $6.2
277,500 $4.9 $6.2 $7.5 R e c .
R e s .
( b o e )
$70.00 $80.00 $90.00
200,000 $10.12 $13.27 $16.42
237,500 $13.09 $16.77 $20.46
277,500 $16.34 $20.61 $24.89
Cdn. Par Crude Oil ($/bbl)
R e c .
R e s .
( b o e )
Source: BMO Capital Markets Source: BMO Capital Markets
Economics Comparison
BelowisasummaryoftheeconomicsforalongBakkenwellwithan11-stagefracand
s20-stagefrac,aswellasa30-stagelongbilateralwell(15fracsineachleg).Perwell
productivityleverageishighlightedgivena2:1relationshipbetweenincrementalreserve
recoveryversusincrementaldrillcosts,resultinginarisingIRRtrend.Specically,com-
paring11-stagewellsto30-stagewellsreectsa90%increaseinperwellreserverecovery
potentialversusa35%increaseindrillcostthatdrivesIRRupby25%to83%.

8/3/2019 2009 10 NatGas Info
http://slidepdf.com/reader/full/2009-10-natgas-info 12/29
Page 10 PetroBakken Energy Ltd.
Bottomline,theevolutionindrillingmethodsinSESaskatchewancontinuestoshow
a rising trendin theeconomics(NPV andrecycleratio), reecting improving capital
efciencies.PetroBakkencontinuestoleadthetechnicalevolutionintestingreservoir
productivitywhilemaintainingcapitalefcienciesintheplay.
Table 7: PBN BakkenEconomic Comparison(Cdn. Par $80/bbl)
11-stage Long Well 20-Stage Long Well 30-stage Bilateral Long Well
Drill Cost ($ mm) $1.7 $2.0 $2.3Reserves Per Well (Mboe) 125.0 185.0 237.5
Reserves Per Section (Mboe) 500.0 740.0 950.0Recovery Factor 11.9% 17.6% 22.6%
F&D Cost ($/boe) $13.60 $10.81 $9.79Recycle Ratio 3.6x 4.4x 4.8x
Payout (years) 0.9 0.6 0.5NPV (10%) Per Well ($ mm) $2.5 $3.9 $5.1
NPV (10%) Per Section ($ mm) $9.8 $15.6 $20.3
IRR Per Well (%) 58% 76% 83%
Note: Economics based on cash fow netback
Source: BMO Capital Markets, Company Reports
Chart 7: NPV Per Well and Recycle Ratio Trend
$0.0
$1.0
$2.0
$3.0
$4.0
$5.0
$6.0
$7.0
$8.0
11-Stage Long 8-Stage Short 15-Stage Short Bilateral 20-Stage Long 30-Stage Long Bilateral0.0x
1.0x
2.0x
3.0x
4.0x
5.0x
6.0x
7.0x
8.0x
NPV Per Well($ mm) Recycle Ratio
Note: Short well economics based on company estimates; NPV based on cash fow netbacks
Source: BMO Capital Markets, Company Reports
Re-Entry Opportunities – Compelling Low-Hanging Fruit
Pendingthesuccessofbilateraldrilling,PetroBakkenholdsapotentialinventoryof
400existingsingle-leghorizontalBakkenwellsthatcanbere-enteredtodrillaparallel
horizontalintheheelofthesewells.Thecompanyhasalreadytestedthisconceptwith
encouragingresultstodate,havingrecovered13,700bblinvemonths(73%ofEUR
fora125,000-bbl-typecurveoverthesametimeperiod)onare-entrydrilledwithonly
8fracs.

8/3/2019 2009 10 NatGas Info
http://slidepdf.com/reader/full/2009-10-natgas-info 13/29
PetroBakken Energy Ltd. Page 11
WehaverunaNPVanalysisontheBakkenre-entryopportunitiesthatimpliesanNPV
perwellrangeof$1.0–3.3million(Table8),basedonvariousrecoverablereservescenarios
andcommodityassumptions.Weestimatethecompany’sre-entryinventoryof400loca-
tionsisworth$1.31–4.40pershare(Table9),basedonaprojecteddrillingprogramoutto
2018andariskedchanceofsuccessof 90%atvariousrecoverablereserveandcommodity
pricescenarios.Oursum-of-partsvaluationanalysisisbasedonrecoverablereservesper
entryof75,000bblatCanadianparcrudeof$80/bbl.
Chart 8: Re-Entry -191/04-04-009-10W2
Source: PetroBakken
Table 8: Re-Entry Hz NPV per Well Sensitivity Matrix Table 9: Re-Entry Unbooked Inventory Valuation
Cdn. Par Crude Oil ($/bbl)$70.00 $80.00 $90.00
75,000 $1.0 $1.3 $1.6
100,000 $1.6 $2.0 $2.5
125,000 $2.2 $2.8 $3.3 R e c .
R e s .
( b o e )
$70.00 $80.00 $90.00
75,000 $1.31 $1.75 $2.19
100,000 $2.12 $2.71 $3.29
125,000 $2.93 $3.66 $4.40
Cdn. Par Crude Oil ($/bbl)
R e c .
R e s .
( b o e )
Source: BMO Capital Markets Source: BMO Capital Markets
Bottomline,asuccessfullow-riskre-entryprogramrepresentscompellinglow-hanging
fruitgivenimpliedF&Dandrecycleratiosof$11.33/boeand3.9x,respectively,basedon
recoverablereservesof75,000bbl.Wenotethatthesemetricsimprovesignicantlyto
$8.50/boeand5.2x,respectively,onhigherrecoverablereservesof100,000bbl.

8/3/2019 2009 10 NatGas Info
http://slidepdf.com/reader/full/2009-10-natgas-info 14/29
Page 12 PetroBakken Energy Ltd.
Bakken Unbooked Development Program Valuation Summary
PetroBakkenholdsanunbookedBakkendrillinginventoryof893netlocationsanda
re-entryinventoryof400locations.Inordertoestimatethevalueofthecompany’sun-bookedBakkeninventory,wehaveforecastdrillingprogramsoutto~2018.Aspreviously
mentioned,wehaveused237,500bbl(118,750bblperleg)onthe30-stagelongbilateral
wellsand75,000bblonthere-entryopportunities.Wehavealsoassumeda90%chance
of successoneach program. Assuch,we estimatethe company’sunbookedBakken
inventoryisworth$18.52pershareat$80/bblCanadianparcrude.
Table 10: Re-Entry Economic Summary (Cdn.Par $80/bbl)
Re-entryDrill Cost ($ mm) $0.9
Reserves Per Well (Mboe) 75.0
Reserves Per Section (Mboe) 300.0Recovery Factor +7.1%F&D Cost ($/boe) $11.33
Recycle Ratio 3.9x
Payout (years) 1.2NPV (10%) Per Well ($ mm) $1.3
NPV (10%) Per Section ($ mm) $5.3
IRR Per Well (%) 54%
Source: BMO Capital Markets
Table 11: Bakken Unbooked Drilling Inventory NPV Valuation (Cdn. Par $80/bbl)
Drilling Chance of Per F.D. F&D Cost RecycleCore Area Inventory Success Share Per Well Potential ($/boe) Ratio
SE Sask. Bakken Dev. (30-Stage Bilaterals) 893 90% $16.77 237.5 MMboe 191 MMboe $9.79 4.8x
SE Sask. Bakken Re-Entry 400 90% $1.75 75.0 Mboe 27 MMboe $11.33 3.9xSE Sask Bakken 1,293 $18.52 218 MMboe
Risked Reserves
Source: BMO Capital Markets
Aspreviouslyhighlighted,thereisadditionalincrementalreserveupsidewithinthe
bilateralandre-entryprogramsthatcouldwarranthighervaluations,pendingfurther
drillingsuccess.WehaveincludedanunbookedBakkeninventorydevelopmentvaluation
sensitivityusingvariousrecoverablereservescenarios,whichimpliesavaluationrange
of$15.02–24.28pershare.
Table 12: UnbookedBakken Inventory ValuationSensitivity Matrix (Cdn. Par $80/bbl)
200,000 237,500 277,500
75,000 $15.02 $18.52 $22.36
100,000 $15.98 $19.48 $23.32
125,000 $16.94 $20.44 $24.28
Bilateral Development Program
R e - E n t r y
P r o g r a m
R e c .
R e s .
( b o e )
Source: BMO Capital Markets

8/3/2019 2009 10 NatGas Info
http://slidepdf.com/reader/full/2009-10-natgas-info 15/29
PetroBakken Energy Ltd. Page 13
Industry Bakken Sandbox – Peer Comparables
Theemergenceofhorizontaldrillingandsubsequentevolutionsindrillingandcompletion
techniquespointstowardhigherrecoveryratesattheBakkenlightoilresourceplay.As
such,prospectiveBakkenacreagehasbeenrapidlyconsolidated,resultinginahandful
ofplayersinthearea.CrescentPointEnergyCorp.(CPG-TSX)isthelargestBakken
landholder,followedbyPetroBakkenwithmorethan210,000netundevelopedacresand
1,300drillinglocations(893unbooked)atfourwellspersection.
Figure 5: SE Saskatchewan Land Holdings
T1
T2
T3
T4
T5
T6
T7
T8
T9
T10
T11
T12
T13
T1
T2
T3
T4
T5
T6
T7
T8
T9
T10
T11
T12
T13
R30W1R31R32R33R34R1W2R2R3R4R5R6R7R8R9R10R11R12R13R14R15R16R17R18R19
R30W1R31R32R33R34R1W2R2R3R4R5R6R7R8R9R10R11R12R13R14R15R16R17R18R19
VIEWFIELD
PBN CPG CPG/PBN (TLM LANDS)Shelter Bay GLM PPY.A NAL
T1
T2
T3
T4
T5
T6
T7
T8
T9
T10
T11
T12
T13
T1
T2
T3
T4
T5
T6
T7
T8
T9
T10
T11
T12
T13
R30W1R31R32R33R34R1W2R2R3R4R5R6R7R8R9R10R11R12R13R14R15R16R17R18R19
R30W1R31R32R33R34R1W2R2R3R4R5R6R7R8R9R10R11R12R13R14R15R16R17R18R19
VIEWFIELD
PBN CPG CPG/PBN (TLM LANDS)Shelter Bay GLM PPY.A NAL
Source: GeoScout, Company Reports, BMO Capital Markets
First-monthIPratesforatypicalBakkenwellrangefrom150b/dto200b/dwithrecover-
ablereservesof125,000boeperwell(PBNtargeting150,000boebasedonresultstodate).PetrobankandTriStar’s(PetroBakken)Bakkenwellshaveconsistentlyshownhigherrst-
monthproductionratesversusCrescentPoint’sBakkenwellsoverthesametimeperiods,
basedonpubliclyavailabledata.Additionally,onacombinedbasisPetroBakkenhas
beengenerallymoreactivewiththedrillbit.Chart9highlightsthesetrends,particularly
overthepastfourquarters.

8/3/2019 2009 10 NatGas Info
http://slidepdf.com/reader/full/2009-10-natgas-info 16/29
Page 14 PetroBakken Energy Ltd.
Bakken Comparables
Ultimately,thedirectcomparableforPetroBakkenwillbeCrescentPointgiventheyare
thetwolargestlandholdersintheplay.Atcurrentimpliedtradingprices,PetroBakken
tradesslightlybelowandaboveCrescentPoint valuationsona 2010E P/CF andEV/
BOE/Dbasis,respectively.WebelievePetroBakken’soperationalleverageastheleader
ofthetechnologypushinSESaskatchewanwilljustifyhigherfuturerelativevaluations.AlthoughPetroBakkenandCrescentPointaredirectcomparables,theimportanttakeaway
isthattheybothholdcompellinglightoilassetbases.
Chart 9: Average BakkenFirst-Month ProductionRates and Activity by Spud Date
0
25
50
75
100
125
150
175
200
225
250
Q1/07 Q2/07 Q3/07 Q4/07 Q1/08 Q2/08 Q3/08 Q4/08 Q1/09 Q2/09
0
10
20
30
40
50
60
70
80
90
100
C PG # of W ells PBN # o f W ells
C PG M ont h One Prod. Adj PBN M ont h One Prod.
F i r s t M o n t h A v g . ( b
/ d )
N um b e r of W e l l s
Note: PBN production rates and activity are the results o PBG and TOG
Source: BMO Capital Markets, GeoScout
Table 13: BakkenValuation Comparable
Div. Unused Yield Line %
2009E 2010E 2009E 2010E 2009e 2009E 2009eCrescent Point CPG OP 36.55$ 5,475$ 9.0 8.8 176,071 146,182 7.6% 90% 26%Glamis GLM OP 1.73$ 490$ 20.0 8.5 319,180 122,249 0.0% 95% 42%Painted Pony PPY.A NR 4.35$ 123$ 12.1 5.4 na na 0.0% 55% naPetroBakken PBN OP 31.27$ 5,374$ 10.8 8.0 143,873 151,304 3.1% 85% 34%Bakken Peer Group Median 11.5 8.2 88% 34%
% OilPrice
5-OctRating
Mkt Cap
($ mm's)
P/CFPS EV/BOE/D
Note – PBN valuations using implied share price based on TOG closing price
Source: BMO Capital Markets, Company Reports
Bakken Infrastructure
ThesolidoilproductiongrowthproleoftheBakkenplayinSESaskatchewanhasled
tothestagedbuild-outofpipelinetakeawaycapacityintheregion.Enbridgealready
expandedpipelinecapacityby100,000b/din2008to255,000b/dandhasfurtherexpan-
sionplansforanadditional100,000b/dto355,000b/dby2011.Industryplayershave

8/3/2019 2009 10 NatGas Info
http://slidepdf.com/reader/full/2009-10-natgas-info 17/29
PetroBakken Energy Ltd. Page 15
reportedatemporaryuptickinoperatingcostswhenrequiredtotruckoilgivenpipeline
capacityconstraintsinprioryears.Thepositiveimpactfromtheslowdownindrilling
activitylevelsovertheH2/08toH1/09timeperiodishigherpipelinecapacityavailabil-
ity.However,weexpectindustrytorampupproductionandreachcapacitylimitsinthe
nearterm.Ofnote,thesimilarinfrastructurebuild-outthemehastranspiredinNorth
DakotaonrobustBakkenproductiongrowth.InChart11thebarsontherightrepresent
SaskatchewanpipelinecapacityandthebarsontheleftrepresentNorthDakota.
Chart 10: Average Throughput Chart 11: Williston Basin Pipeline Systems – EPSI(Saskatchewan) & EPND (North Dakota)
Source: Enbridge Source: Enbridge
SE Saskatchewan Conventional Inventory
PetroBakkenholdsacomplementaryinventoryofconventionaloilplayopportunities
inSESaskatchewan.Theseopportunitiesprovidequickpayoutsgivenlowdrillingcostswithfuturegrowthpotential throughinlldrilling. Currentproductionfromthe SE
Saskatchewanconventionalplaysis roughly 10,800 boe/d. We havecarried overour
NPVanalysisofTriStar’sconventionalopportunities,whichisbasedontheoperating
assumptionsshownbelow.
Table 14: SE Saskatchewan NPV Per Well Assumptions
Op Cost ($/boe) $6.00Royalty 25%Transportation ($/boe) $1.90
Drill Cost ($ mm) $1.0Discount Rate 10%Rec Reserves (mboe) 100.0Reserve Life (yrs) 8
Per Well Assumptions
Source: BMO Capital Markets

8/3/2019 2009 10 NatGas Info
http://slidepdf.com/reader/full/2009-10-natgas-info 18/29
Page 16 PetroBakken Energy Ltd.
PetroBakkenholds510,000netacresofundevelopedlandprospectiveforconventional
opportunities.Thecompanyestimatesanunbookeddrillinginventoryof238netlocations
asaresultoftheTriStaracquisition.Basedonourprojecteddevelopmentprogramout
to2015,weestimatetheunbookedconventionalinventoryisworth$2.35pershareata
Canadianparcrudeoilpriceof$80/bblandariskedchanceofsuccessof90%.
Table 15: SE Saskatchewan Conventional Unbooked Drilling Inventory NPV Valuation (Cdn. Par $80/bbl)
Drilling Chance of Per F.D. F&D Cost RecycleCore Area Inventory Success Share Per Well Potential ($/boe) Ratio
SE Sask. Conventional 238 90% $2.35 100.0 Mboe 21 MMboe $10.00 4.3x
Risked Reserves
Source: BMO Capital Markets
NEBC Shale Gas: Montney and Horn River
PetroBakken’sresourceportfolioincludesinterestsintheMontneyandHornRivershale
gasplaysinNEBC.Thecompany’sMontneylandsarelocatedintheMoniasarea,where
PetroBakkenholds17netsectionsoflandrepresentingapotentialdrillinginventoryof
67unbookedlocationsatfourwellspersectiontargetingtheUpperMontney.Canadian
NaturalResources(CNQ-TSX)andCrewEnergy(CR-TSX)havedrilledoffsettingwells
toPetroBakkenlandsintheSeptimusarea.
Figure 6: MoniasMontney Acreage
Source: GeoScout

8/3/2019 2009 10 NatGas Info
http://slidepdf.com/reader/full/2009-10-natgas-info 19/29
PetroBakken Energy Ltd. Page 17
Insupportoffuturedevelopment,PetroBakkenownsa5MMcf/dfacilitythatisexpand-
ableto10MMcf/d.Todate,thecompanyhasdrilledahorizontalwellwitha7-stage
frac.PetroBakkenisevaluatingthepotentialforhighdensityfracdevelopmentinthe
Montneyplay.ThecompanyhasdrilleditssecondMontneywellasahorizontalbilat-
eralwellwith33portsreadytobefraced,whichimpliescompellingoptionalityonour
NPVvaluation.Bottomline,theMontneyandHornRivergasplaysarecomplementary
high-impactresourceplaysthatcanbefundedbythecashowgeneratedbytheBakken
uponarecoveryinnaturalgasprices.
Montney NPV Analysis
GiventheearlydaysofPetroBakken’sMontneydrillingprogram,wehaverunaNPV
analysisofthecompany’sMontneywellsusinganindustrypeerproductionprole.
Basedonthisprole,wehaveprojectedanaverage-typecurvebasedonaveragereserve
bookingsof4.0Bcfperwellovera20-yearreservelife.OurNPVanalysisalsoassumes
drillingcostsof$5.0millionperwell,aliquidsratioof30bbl:1MMcfandanall-incash
ownetbackbasedonvariousassumptions.
Table 16: NEBC Montney NPV Per Well Assumptions Op Cost ($/boe) $6.50
Royalty 23%Transportation ($/boe) $1.50
Drill Cost ($ mm) $5.0Discount Rate 10%Rec. Reserves (Bcfe) 4.8Reserve Life (yrs) 20
Per Well Assumptions
Source: BMO Capital Markets, Company Reports
OurNPVanalysisimpliesavaluerangeof$3.3–8.4millionperwellatAECOnatural
gaspriceassumptionsof$5.00–7.00/Mcf.Ourestimatedbreakevennaturalgaspricefor
aMoniasMontneywellislessthan$4.00/Mcf(IRR10%),whichfurtherimproveson
theinclusionofroyaltyincentives.
Table 17: NEBC Montney NPV Per Well Summary $5.00 $6.00 $7.00
NPV (BT-10%) Per Well ($ mm) $3.3 $5.8 $8.4
IRR Per Well (%) 27% 42% 59%Payout (years) 2.5 1.6 1.1
AECO Natural Gas ($/Mcf)
Source: BMO Capital Markets
Basedonourprojecteddevelopmentprogramoutto2014,weestimatetheunbooked
Montneyinventoryisworth$1.39pershareatanAECOnaturalgaspriceof$6.00/Mcf
andriskedchanceofsuccessof80%.

8/3/2019 2009 10 NatGas Info
http://slidepdf.com/reader/full/2009-10-natgas-info 20/29
Page 18 PetroBakken Energy Ltd.
Horn River
PetroBakkenalsomaintainsaninterestintheHornRivershalegasplayinNEBCwhere
itholds84netsectionsof crownrightsintheEvie,SnakeRiverandJuliaarea.TheHorn
River’ssignicantresourcepotentialisduetothehighsilicaandorganiccontentfrom
theEvie,OtterParkandMuskwabasinalshales.
Table 18: Montney Unbooked DrillingInventory NPV Valuation(AECO $6/Mc)
Drilling Chance of Per F.D. F&D Cost RecycleCore Area Inventory Success Share Per Well Potential ($/boe) Ratio
NEBC Montney 67 80% $1.39 4.8 Bcfe 257 Bcfe $6.31 3.3x
Risked Reserves
Source: BMO Capital Markets
Figure 7: Middle andBasal Upper DevonianUnits o the Horn River Basin
Source: Ministry o Energy, Mines and Petroleum Resources
AsshowninFigure8,thesignicantresourcepotentialhasresultedinrecordlandsale
activitywiththebiggestinterestsheldbytheSeniorE&P’sincludingApacheCorp.
(APA-NYSE),DevonEnergyCorp.(DVN-NYSE),EnCanaCorp(ECA-TSX)andEOG
Resources(EOG-NYSE).
8/3/2019 2009 10 NatGas Info
http://slidepdf.com/reader/full/2009-10-natgas-info 21/29
PetroBakken Energy Ltd. Page 19
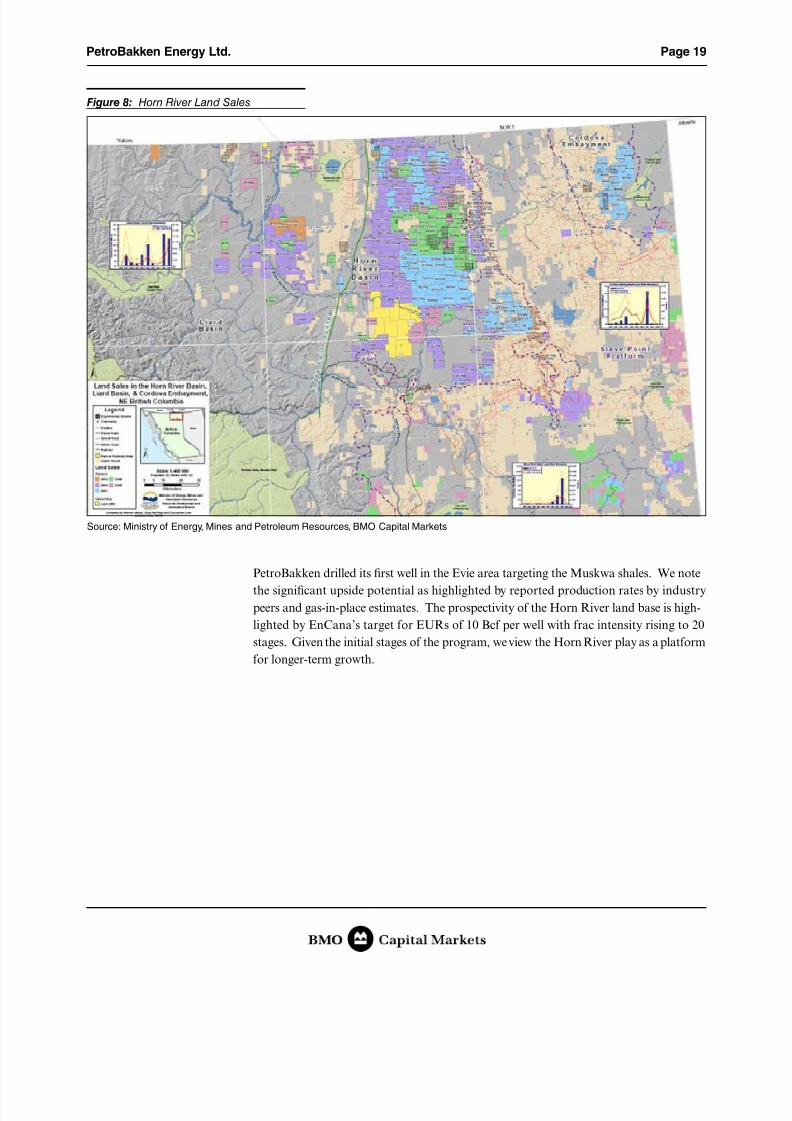
Figure 8: Horn River Land Sales
Source: Ministry o Energy, Mines and Petroleum Resources, BMO Capital Markets
PetroBakkendrilleditsrstwellintheEvieareatargetingtheMuskwashales.Wenote
thesignicantupsidepotentialashighlightedbyreportedproductionratesbyindustry
peersandgas-in-placeestimates.TheprospectivityoftheHornRiverlandbaseishigh-
lightedbyEnCana’stargetforEURsof10Bcfperwellwithfracintensityrisingto20
stages.Giventheinitialstagesoftheprogram,weviewtheHornRiverplayasaplatform
forlonger-termgrowth.

8/3/2019 2009 10 NatGas Info
http://slidepdf.com/reader/full/2009-10-natgas-info 22/29
Page 20 PetroBakken Energy Ltd.
Horn River NPV Analysis
Ouranalysisofthecompany’sHornRiverwellsarebasedonarecoverablereservesce-
narioof10Bcfovera20-yearreservelife.OurNPVanalysisalsoassumesdrillingcosts
of$10millionperwellandanall-incashownetbackbasedonvariousassumptions.
PetroBakkenholds84netsectionsofundevelopedHornRiveracreage.Giventheexplor-
atorynatureoftheland,wehaveheavilyriskedtheinventorybyassumingonlyone-third
isprospectivefortheHornRiver,whichimpliesadrillinginventoryof112locationsatfourwellspersection.Basedonourprojecteddevelopmentprogramoutto2016,we
estimatetheHornRiverisworth$2.71pershareataatAECOpriceof$6/Mcf anda
riskedchanceofsuccessof50%.
Figure 9: Horn River LandPosition
Source: PetroBakken
Table 19: Horn River Unbooked DrillingInventory NPV Valuation(AECO $6/Mc)
Drilling Chance of Per F.D. F&D Cost RecycleCore Area Inventory Success Share Per Well Potential ($/boe) Ratio
NEBC Horn River 112 50% $2.71 10.0 Bcfe 560 Bcfe $6.03 3.3x
Risked Reserves
Note: Horn River exploration inventory double risked - based on 33% prospective lands and 50%chance o exploration success
Source: BMO Capital Markets
8/3/2019 2009 10 NatGas Info
http://slidepdf.com/reader/full/2009-10-natgas-info 23/29
PetroBakken Energy Ltd. Page 21
H2/09 and 2010 Outlook
PetroBakkencompletedadrillingprogramof89wells(67.3net)consistingof71Bakken
developmentwells(51.4net)inQ3/09.Thecompany’sBakkendrillingprogramincluded
13longbilateralwells,fourofwhichhavebeentiedinwithincreasingproductionrates
andtheremainingwellsexpectedtobecompletedshortly.
PetroBakkencurrentlyhas12rigsoperatingintheBakkenwithsevenrigsexclusively
drilling30-stage(15fracsperleg)bilateralwellsandanotherrigdrillingre-entrywells.
Currentproductionis43,630boe/d.Aspreviouslymentioned,thecompanyexpectsto
sellAlbertaassetscomprisedof9,500boe/dand40.1MMboe.PetroBakkenexpectsto
executeacapitalprogramof$140millioninQ4/09tofund40Bakkenwellsprimarily
consistingofbilateralwells,aswellasninere-entrywells.Assuch,2009exitproduc-
tionisexpectedtobemorethan37,000boe/d(95%lightoil)aftertheplannedAlberta
dispostions.
For2010,PetroBakkenindicatedaninitialcapitalbudgetof$550million,basedona
WTIUS$75/bbloilprice.Thecompanyexpectstoexecuteadrillingprogramof110–130
bilateralBakkenwellswith10–12rigs.PetroBakkenintendstoadoptadividendpolicy
of$0.96perannum(~3%yield),payablemonthly,withtherstdividendtobepaidin
NovembertoshareholdersofrecordonOctober30,2009.
PetroBakken Profle
PetroBakkenwascreatedfromthecombinationofPetrobank’s(PBG-TSX)Canadian
BusinessUnitassetsandTriStarOil&Gas.Specically,PetroBakkenwascapitalized
withPetrobank’sCanadianBusinessUnitassetsalongwith$400millionincashinex-
changefor109.8millioncommonshares(64%ofoutstandingshares).PetroBakkenthen
completedtheacquisitionofTriStarOil&Gasfor$14.75cashor0.5350ofaPetroBak-kenshare.Assuch,theimpliedacquisitionmetrics(netofland)of theTriStardealare
roughly$118,700/boe/d(basedonQ1/09production)and$23.00/boe(2P–basedon2008
reservesandTalismanpropertyacquisition).Onacombinedbasis,PetroBakkenhasthe
followingattributes:
• 2009Eexitproduction of morethan 37,000 boe/d (net of theplanned Alberta
dispositions~9,500boe/d–BMOassumedQ4/09);
• greater thanone million net acresof land and morethan1,300 Bakkenlocations
complementedbyNEBCMontneyandHornRivernaturalgasexposure;
• a$1.05billioncreditfacility;and
• $1.9billionoftaxpools.

8/3/2019 2009 10 NatGas Info
http://slidepdf.com/reader/full/2009-10-natgas-info 24/29
Page 22 PetroBakken Energy Ltd.
Management
PetroBakkenwillbeledbyJohnD.WrightasChairmanandCEO,andR.GreggSmith
asPresidentandCOO.Mr.WrighthasbeenthePresidentandCEOofPetrobanksince
2000andisalsothePresidentandCEOofPetromineralesLtd.Mr.Smithhasbeen
theSeniorVicePresidentandCOO(Canada)ofPetrobanksinceNovember2008.The
seniormanagementteamisroundedoutbyCoreyRuttan(ExecutiveVicePresidentand
CFO),PeterHawkes(VicePresident,Exploration)andRichardPress(VicePresident,
LandandContracts).
TheboardofdirectorsofPetroBakkenconsistsofJohnWright(Chairman),CoreyRut-
tan,KennethMcKinnon,DanThemig,CraigLothian,BrettHerman,MartinHislop
andIanBrown.
Financial Outlook
Weproject2009Eand2010ECFPSof$2.89and$3.92,respectively.Ournancialestimates
arebasedonaverageproductionof42,158boe/din2009Eand40,356boe/d(95%light
oil)in2010E.Petrobakkenplanstodivest9,500boe/dandexit2009at37,000boe/d.Our
workingmodelassumesassetsaleproceedsof$380millionbasedonmetricsof$40,000/
boe/dand$9.50/boeinQ4/09,resultinginyear-endnetdebtof$679millionversusan
approvedcreditlineof$1.05billion.
Table 20: PetroBakken’sFinancial & OperatingSummary
2009E 2010E
EPS (Diluted Continuing) (0.19) 0.85
CFPS (Diluted ) 2.89 3.92
ROCE (%) - Continuing -2% 4%
Net L.T. Liabilities 20% 21%Net Debt/Cash Flow 1.4x 1.1x
Production:
Crude (b/d) 35,978 38,465
Natural Gas (mmcf/d) 37.1 11.3
Production (boe/d) 42,158 40,356
Percentage Gas 15% 5%
Commodity Assumptions:
WTI (US$/bbl) 59.00 70.00
AECO Gas (C$/Mcf) 3.33 4.12
Source: BMO Capital Markets
PetroBakkencurrentlyhas9%of2009Eoilproductionhedgedatanaverageoorand
xedpriceofroughly$75/bbl.For2010E,thecompanycurrentlyhas4%ofoilproduc-
tionhedgedatanaverageoorandxedpriceof$65/bbl.

8/3/2019 2009 10 NatGas Info
http://slidepdf.com/reader/full/2009-10-natgas-info 25/29
PetroBakken Energy Ltd. Page 23
Ourworkingmodelassumesplannedassetsalesof9,500boe/darecompletedinQ4/09,
resultingin year-endnetdebtof $691 millionversusan approvedcreditlineof $1.05
billion.
Table 21: PetroBakken’sIncome Statement
2009E 2010E
Gross Revenue 793.6 976.6
Realized Risk Management Gain/Loss 15.7 1.1
Unrealized Risk Management Gain/Loss (22.1) -
Interest Income 0.1 -
Royalty Expense (111.1) (117.2)
Net Revenue 676.3 860.5
Operating Expense 130.3 117.8
Transportation 15.4 14.7
G&A 32.3 29.5
Interest Expense 24.1 23.5
Stock Based Compensation 27.1 27.1
DD&A 492.4 441.9
Income Before Taxes (45.4) 205.9
Deferred Income Taxes (12.9) 58.5
Current Income taxes (0.1) 0.6
Income Taxes (13.0) 59.1
Net Income (32.3) 146.8
Source: BMO Capital Markets
Table 22: PetroBakken’sCash Flow Statement
2009E 2010E
Net Income (32.3) 146.8
Unrealized Gains/Losses on Derivatives 22.1 -
Stock Based Compensation 27.1 27.1
DD&A 492.4 441.9
Deferred Taxes (12.9) 58.5
Cash Flow from Operations 496.4 674.3
Net Change in Long Term Debt (293.9) 40.7
Dividends (82.5) (165.0)
Issue of Common Shares - -
Cash From Financing Activities (376.4) (124.3)
Expenditures on PP&E (500.0) (550.0)
Dispositions 380.0 -
Cash Outlays (Net Investment) (120.0) (550.0)
Increase/(Decrease) in Cash - -
Cash - Open 4.6 4.6
Cash - Close 4.6 4.6
Source: BMO Capital Markets

8/3/2019 2009 10 NatGas Info
http://slidepdf.com/reader/full/2009-10-natgas-info 26/29
Page 24 PetroBakken Energy Ltd.
Valuation
BasedonTriStar’sclosingprice,Petrobakkensharesaretradingat8.0xP/CFPSand9.1x
EV/EBITDA*.Ourtargetpriceissupportedbyoursum-of-partsconsolidatedvalueof
$35.72pershareusingaatlong-termCanadian.Parcrudepriceof$80/bblandAECO
naturalgaspriceassumptionof$6.00/Mcf.Ourunbookeddrillinginventoryvaluation
isbasedonthedetailedperwellNPV(BT-10%)analysisofthecompany’sBakkenand
ConventionalplaysinSESaskatchewan,aswellastheNEBCMontneyandHornRiver
plays.Ourriskedanalysissumstototalunbookedresourcepotentialof375MMboe.
Table 23: PetroBakken’sBalance Sheet
2009E 2010E
Cash 4.6 4.6
Financial Instruments 20.1 20.1
Accounts Receivable 113.3 113.3
Current Assets 138.0 138.0
Financial Instruments 1.7 1.7
Goodwill 839.9 839.9 Net Property, Plant & Equipment 3,122.3 3,230.4
Total Assets 4,102.0 4,210.1
Accounts Payable 233.2 233.2
Financial Instruments 9.9 9.9
Current Liabilities 243.1 243.1
Bank Debt 586.3 627.0
Deferred Taxes 494.7 553.2
Commodity Derivative Liability 3.6 3.6
Other 4.5 4.5
Site Restoration 53.7 53.7
Subtotal Liabilities 1,385.8 1,485.0
Equity Capital 2,568.1 2,568.1
Contributed Surplus 13.6 40.7
Other 0.5 0.5
Retained Earnings/(Deficit) 133.9 115.7
Subtotal Equity 2,716.1 2,725.0
Total Liabilities and Equity 4,102.0 4,210.1
Source: BMO Capital Markets
* Implied share price based on TOG closing price.

8/3/2019 2009 10 NatGas Info
http://slidepdf.com/reader/full/2009-10-natgas-info 27/29
PetroBakken Energy Ltd. Page 25
Table 24: Intermediate/Junior Oil & Gas Valuation Comparables
Price
Rating 5-Oct 2009E 2010E 2009E 2009E 2010E 2009E 2010E 2008 2009E
Anderson AXL Mkt 0.93 1.25 34% 140 5.3 3.4 0.5 8.8 5.1 28,846 25,134 $6.99 84%
Angle Energy NGL Mkt 5.02 5.50 10% 231 5.8 4.4 0.9 6.5 4.8 31,326 30,411 $9.44 57%Breaker WAV OP 5.33 7.00 31% 278 6.7 4.0 0.7 9.3 5.4 52,097 46,855 $11.36 55%Celtic CLT OP 18.93 23.50 24% 837 7.5 7.1 0.8 11.8 6.8 72,952 57,811 $12.36 73%Compton CMT R R R R R R R R R R R R R RCrew CR OP 8.83 10.00 13% 689 10.1 8.3 0.8 15.0 11.5 66,805 63,326 $10.77 65%Glamis GLM.A OP 1.73 2.75 59% 490 20.0 8.5 0.7 43.7 9.0 319,180 122,249 $10.43 5%Highpine HPX Mkt 7.19 7.00 -3% 482 4.7 4.5 0.9 6.0 5.1 33,267 36,749 $9.34 39%Iteration ITX Mkt 1.20 1.50 25% 253 7.2 3.8 0.4 10.6 6.1 29,435 32,850 $8.77 71%MGM Energy MGX Mkt(S) 0.13 na na 34 na na na na na na na na naNuVista NVA Mkt 12.89 11.00 -15% 1,136 6.0 5.9 0.9 8.8 7.5 57,776 53,903 $13.07 71%Orleans OEX OP 2.40 3.25 35% 149 10.3 6.1 0.6 15.5 7.1 46,886 40,118 $7.79 80%Paramount POU Mkt 14.90 10.25 -31% 1,009 8.0 6.7 1.2 39.6 18.1 65,067 67,442 $7.02 73%PetroBakken PBN OP 31.27 36.00 18% 5,374 10.8 8.0 0.9 12.9 9.1 143,873 151,304 na 15%
Progress PRQ R R R R R R R R R R R R R RStorm SEO OP 14.80 17.25 17% 689 19.5 12.4 0.8 22.3 13.7 98,543 91,523 $17.10 86%Vero VRO OP 4.00 5.00 25% 164 6.0 3.5 0.5 12.5 6.0 38,157 32,803 $11.99 81%
Peer Group Median 7.3 6.0 0.8 12.1 6.9 54,937 50,379 $10.43 71%2009 YTD Avg Transaction Metrics 51,829 $14.18
Most Recent Transaction Metrics - Daylight Resources Trust and Highpine Oil & Gas 37,606 $16.87
EV/BOE/D EV/2P (boe) % Gas
INTERMEDIATE/JUNIOR GROUP
Target ReturnMkt Cap
($ mm's)
P/CFPS P/NAV EV/EBITDA
Note – PBN valuations using implied share price based on TOG closing price
Source: BMO Capital Markets
Investment Risks
PetroBakken’snancialandoperatingresultscanbemateriallyimpactedbyunforeseen
geopoliticalevents,suchaswarorsevereeconomiccontractions,andprolongedextreme
weatherpatterns,whichcanhaveasignicantimpactonenergyprices.
PetroBakkenisalsoexposedtocapital,operatingmaintenanceandremediationexpen-
dituresasaresultof environmentallawsandregulations.Totheextentthatregulatory
requirementsandrelatedexpendituresarenotultimatelymetorprohibitexplorationand
developmentactivities,operatingresultswouldbeadverselyaffected.
Operationally,oilandgaspropertiesmayexperiencesteeper-than-forecastproduction
declines, encounter higher-than-expected water contentor be subjectto unforeseen
downtime,resultinginunscheduledmaintenance,whichcanhaveamaterialimpacton
thecompany’snancialandoperatingresults.

8/3/2019 2009 10 NatGas Info
http://slidepdf.com/reader/full/2009-10-natgas-info 28/29
Page 26 PetroBakken Energy Ltd.
Company Risk Disclosure
Inadditiontotherisksinvolvedininvestingincommonstocksgenerally,wealsohighlightthefollowingrisksthatpertaintothis
company.TriStar’snancialandoperatingresultscanbemateriallyimpactedbyunforeseengeopoliticalevents,suchaswarorsevere
economiccontractions,andprolongedextremeweatherpatterns,whichcanhaveasignicantimpactonenergyprices.TriStarisalso
exposedtocapital,operatingmaintenanceandremediationexpendituresasaresultofenvironmentallawsandregulations.Tothe
extentthatregulatoryrequirementsandrelatedexpendituresarenotultimatelymetorprohibitexplorationanddevelopmentactivities,
operatingresultswouldbeadverselyaffected.
Operationally,oilandgaspropertiesmayexperiencesteeperthanforecastproductiondeclines,encounterhigherthanexpectedwater
contentorbesubjecttounforeseendowntimeresultinginunscheduledmaintenance,whichcanhaveamaterialimpactonthecompany’s
nancialandoperatingresults.Wenotethatanyaccelerationorunforeseendelaysinwelltie-inscanmateriallyimpactproduction
giventherelativelysmallscaleofTriStar’soperationsfor2005.
Analyst’s Certication
I,MarkLeggett,CFA,herebycertifythattheviewsexpressedinthisreportaccuratelyreectmypersonalviewsaboutthesubject
securitiesorissuers.Ialsocertifythatnopartofmycompensationwas,is,orwillbe,directlyorindirectly,relatedtothespecicrecom-
mendationsorviewsexpressedinthisreport.
General Disclosure
TheinformationandopinionsinthisreportwerepreparedbybothBMONesbittBurnsInc.andBMONesbittBurnsLtée./Ltd.,col-
lectively(“BMONB”)andBMOCapitalMarketsLimited(U.K.),(“BMOCMLtd”).BMONBandBMOCMLtd.arenotsubjecttoU.S.ruleswithregardtothepreparationofresearchreportsandtheindependenceofanalysts.“BMOCapitalMarkets”isatrade
nameusedbytheBMOInvestmentBankingGroup,whichincludesthewholesalearmofBankofMontrealanditssubsidiariesBMO
NBinCanada,BMOCapitalMarketsLtd.intheU.K.andBMOCapitalMarketsCorp.intheU.S.BMOCapitalMarketsLtd.and
BMOCapitalMarketsCorp.areafliatesof BMONB.BankofMontrealoritssubsidiaries(“BMOFinancialGroup”)haslending
arrangementswith,orprovideotherremuneratedservicesto,manyissuerscoveredbyBMONBresearch.Asignicantlendingrelation-
shipmayexistbetweenBMOFinancialGroupandcertainoftheissuersmentionedherein.Theopinions,estimatesandprojections
containedinthisreportarethoseof BMONBandBMOCMLtd.asofthedateofthisreportandaresubjecttochangewithout
notice.BMONBandBMOCMLtd.endeavourtoensurethatthecontentshavebeencompiledorderivedfromsourcesthatwebelieve
arereliableandcontaininformationandopinionsthatareaccurateandcomplete.However,BMONBandBMOCMLtd.makeno
representationorwarranty,expressorimplied,inrespectthereof,takesnoresponsibilityforanyerrorsandomissionscontainedherein
andacceptsnoliabilitywhatsoeverforanylossarisingfromanyuseof,orrelianceon,thisreportoritscontents.Informationmaybe
availabletoBMONB,BMOCMLtdoritsafliatesthatisnotreectedinthisreport.Theinformationinthisreportisnotintended
tobeusedastheprimarybasisofinvestmentdecisions,andbecauseofindividualclientobjectives,shouldnotbeconstruedasadvice
designedtomeettheparticularinvestmentneedsofanyinvestor.Thismaterialisforinformationpurposesonlyandisnotanofferto
sellorthesolicitationofanoffertobuyanysecurity.Theresearchanalystand/orassociateswhopreparedthisreportarecompensated
basedupon(amongotherfactors)theoverallprotabilityofBMONB,BMOCMLtd.anditsafliates,whichincludestheoverall
protabilityofinvestmentbankingservices.BMONB,BMOCMLtd.,oritsafliatesexpecttoreceiveorwillseekcompensationfor
investmentbankingserviceswithinthenext3monthsfromallissuerscoveredbyBMONB.BMONB,BMOCMLtd.oritsafliates
willbuyfromorselltocustomersthesecuritiesofissuersmentionedinthisreportonaprincipalbasis.BMONB,BMOCMLtd.or
itsafliates,ofcers,directorsoremployeesmayhavealongorshortpositioninthesecuritiesdiscussedherein,relatedsecuritiesor
inoptions,futuresorotherderivativeinstrumentsbasedthereon.ThereadershouldassumethatBMONB,BMOCapitalMarkets
Ltd.,BMOCapitalMarketsCorp.,BankofMontrealortheirafliatesmayhaveaconictofinterestandshouldnotrelysolelyon
thisreportinevaluatingwhetherornottobuyorsellsecuritiesofissuersdiscussedherein.
Company Specic Disclosures
Disclosure3:BMONBhasprovidedinvestmentbankingserviceswithrespecttothisissuerwithinthepast12months.
Disclosure7:BMOCapitalMarketsCorp.oranafliatehasreceivedcompensationforinvestmentbankingservicesfromthisissuer
withinthepast12months.
Disclosure10A:Thisissuerisaclient(orwasaclient)ofBMONB,BMOCapitalMarketsCorp.oranafliatewithinthepast12
months:InvestmentBankingServices
Disclosure16:Aredacteddraftofthisreportwaspreviouslyshowntotheissuer(forfactcheckingpurposes)andchangesweremade
tothereportbeforepublication.

8/3/2019 2009 10 NatGas Info
http://slidepdf.com/reader/full/2009-10-natgas-info 29/29
PetroBakken Energy Ltd. Page 27
Distribution o Ratings (September 10, 2009)
Rating BMO BMO BMO Starmine
Category Rating Universe I.B. Clients* Universe**
Buy Outperform 36% 48% 48%Hold MarketPerform 55% 48% 44%
Sell Underperform 9% 4% 8%
* Reflects rating distribution of all companies where BMO Capital Markets has received compensation for Investment Bankingservices.
**ReectsratingdistributionofallNorthAmericanequityresearchanalysts.
Ratings Key
Weusethefollowingratingssystemdenitions:
OP=Outperform-Forecasttooutperformthemarket;
Mkt=MarketPerform-Forecasttoperformroughlyinlinewiththemarket;
Und=Underperform-Forecasttounderperformthemarket;
(S)=speculativeinvestment;
NR=Noratingatthistime;
R=Restricted–Disseminationofresearchiscurrentlyrestricted.
MarketperformanceismeasuredbyabenchmarkindexsuchastheS&P/TSXCompositeIndex,S&P500,NasdaqComposite,as
appropriateforeachcompany.PriortoSeptember1,2003,afourthratingtier—TopPick—wasusedtodesignatethosestockswe
feltwouldbethebestperformersrelativetothemarket.OursixTop15listswhichguideinvestorstoourbestideasaccordingtosix
differentobjectives(large,small,growth,value,incomeandquantitative)havereplacedtheTopPickrating.
Dissemination o Research
Ourresearchpublicationsareavailableviaourwebsitehttp://bmocapitalmarkets.com.Institutionalclientsmayalsoreceiveourresearch
viaFIRSTCALLResearchDirectandReuters.AllofourresearchismadewidelyavailableatthesametimetoallBMONB,BMO
CapitalMarketsLtd.,BMOCapitalMarketsCorp.andBMONesbittBurnsSecuritiesLtd.clientgroupsentitledtoourresearch.
Pleasecontactyourinvestmentadvisororinstitutionalsalespersonformoreinformation.
Confict Statement
AgeneraldescriptionofhowBMOFinancialGroupidentiesandmanagesconictsofinterestiscontainedinourpublicfacingpolicy
formanagingconictsof interestinconnectionwithinvestmentresearchwhichisavailableathttp://research-ca.bmocapitalmarkets.
com/Conict_Statement_Public.asp
Additional Matters
TOU.S.RESIDENTS:BMOCapitalMarketsCorp.and/orBMONesbittBurnsSecuritiesLtd.,afliatesofBMONB,furnishthis
reporttoU.S.residentsandacceptresponsibilityforthecontentsherein,excepttotheextentthatitreferstosecuritiesofBankof
Montreal.AnyU.S.personwishingtoeffecttransactionsinanysecuritydiscussedhereinshoulddosothroughBMOCapitalMarkets
Corp.and/orBMONesbittBurnsSecuritiesLtd.
TOU.K.RESIDENTS:IntheUKthisdocumentispublishedbyBMOCapitalMarketsLimitedwhichisauthorisedandregulated
bytheFinancialServicesAuthority.Thecontentshereofareintendedsolelyfortheuseof,andmayonlybeissuedorpassedonto,
(I)personswhohaveprofessionalexperienceinmattersrelatingtoinvestmentsfallingwithinArticle19(5)oftheFinancialServices
andMarketsAct2000(FinancialPromotion)Order2005(the“Order”)or(II)highnetworthentitiesfallingwithinArticle49(2)(a)to(d)oftheOrder(allsuchpersonstogetherreferredtoas“relevantpersons”).Thecontentshereofarenotintendedfortheuseof
andmaynotbeissuedorpassedonto,retailclients.
BMONesbittBurnsInc.andBMONesbittBurnsLtée/Ltd.areMembersofCIPF.BMOCapitalMarketsCorp.andBMONesbitt
BurnsSecuritiesLtd.areMembersofSIPC.
“BMOCapitalMarkets”isatrade-markofBankofMontreal,usedunderlicence.
“BMO(M-Barroundelsymbol)”isaregisteredtrade-markofBankof Montreal,usedunderlicence.
R38126