20 November 2017 - AMA MARINE PUBLIC COMPANY … · Crude Gas Clean Products Chemical Tanker...
34
20 November 2017
Transcript of 20 November 2017 - AMA MARINE PUBLIC COMPANY … · Crude Gas Clean Products Chemical Tanker...
20 November 2017
AMA MARINE PUBLIC COMPANY LIMITED
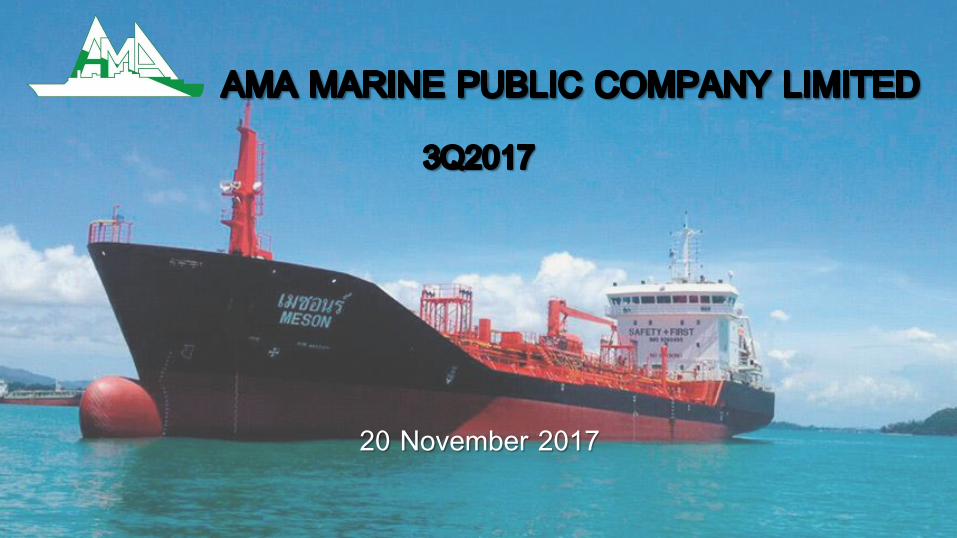
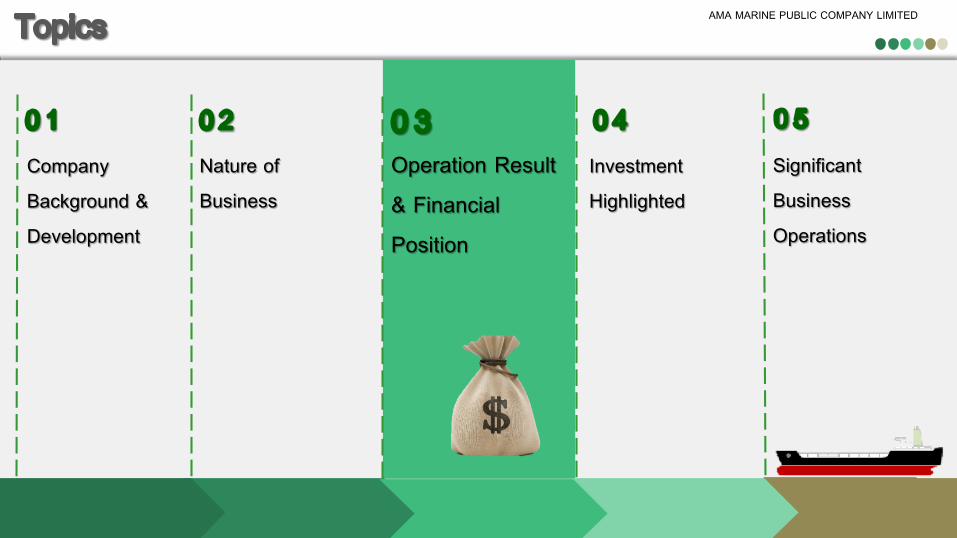
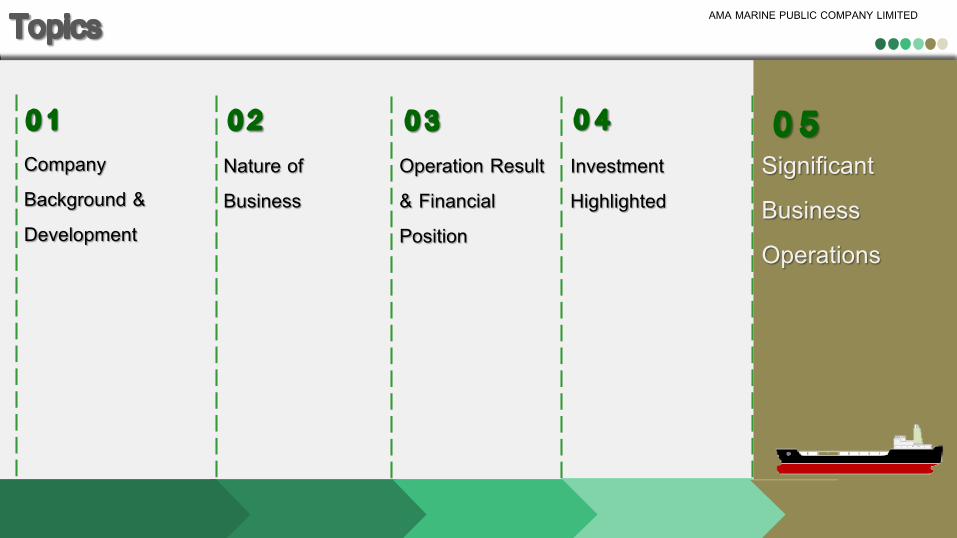
Investment Highlighted
Significant Business Operations
Company Background & Development
Operation Result & Financial Position
Nature of Business
AMA MARINE PUBLIC COMPANY LIMITED
3
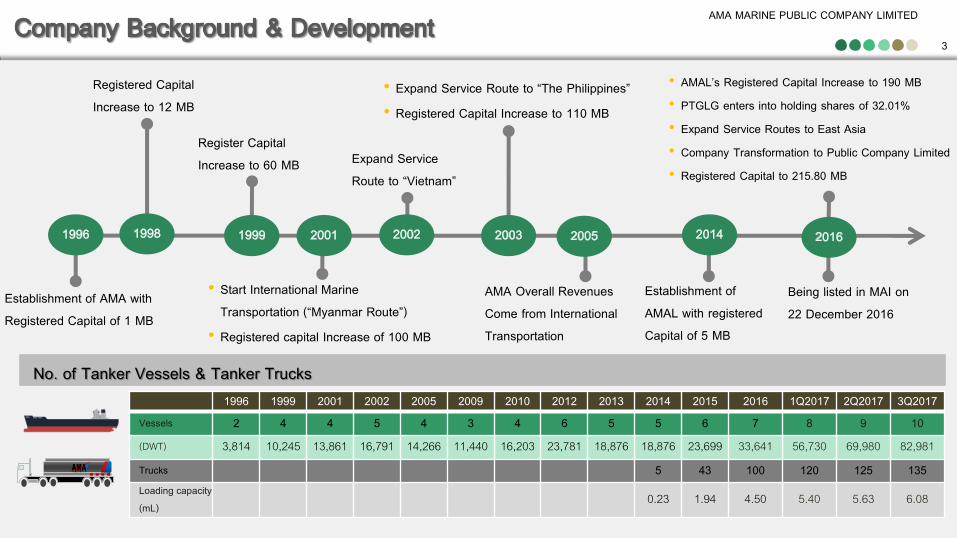
Establishment of AMA with Registered Capital of 1 MB
• Start International Marine Transportation (“Myanmar Route”)
• Registered capital Increase of 100 MB
Establishment of AMAL with registered Capital of 5 MB
• Expand Service Route to “The Philippines”• Registered Capital Increase to 110 MB
Expand Service Route to “Vietnam”
1996 1999 2001 2002 2005 2009 2010 2012 2013 2014 2015 2016 1Q2017 2Q2017 3Q2017Vessels 2 4 4 5 4 3 4 6 5 5 6 7 8 9 10(DWT) 3,814 10,245 13,861 16,791 14,266 11,440 16,203 23,781 18,876 18,876 23,699 33,641 56,730 69,980 82,981Trucks 5 43 100 120 125 135Loading capacity(mL)
0.23 1.94 4.50 5.40 5.63 6.08
Registered Capital Increase to 12 MB
Register Capital Increase to 60 MB
AMA Overall Revenues Come from International Transportation
• AMAL’s Registered Capital Increase to 190 MB• PTGLG enters into holding shares of 32.01%• Expand Service Routes to East Asia• Company Transformation to Public Company Limited• Registered Capital to 215.80 MB
Being listed in MAI on 22 December 2016
No. of Tanker Vessels & Tanker Trucks
AMA MARINE PUBLIC COMPANY LIMITED
Operation Result & Financial Position
Investment Highlighted
Significant Business Operations
Company Background & Development
Nature of Business
AMA MARINE PUBLIC COMPANY LIMITED
5
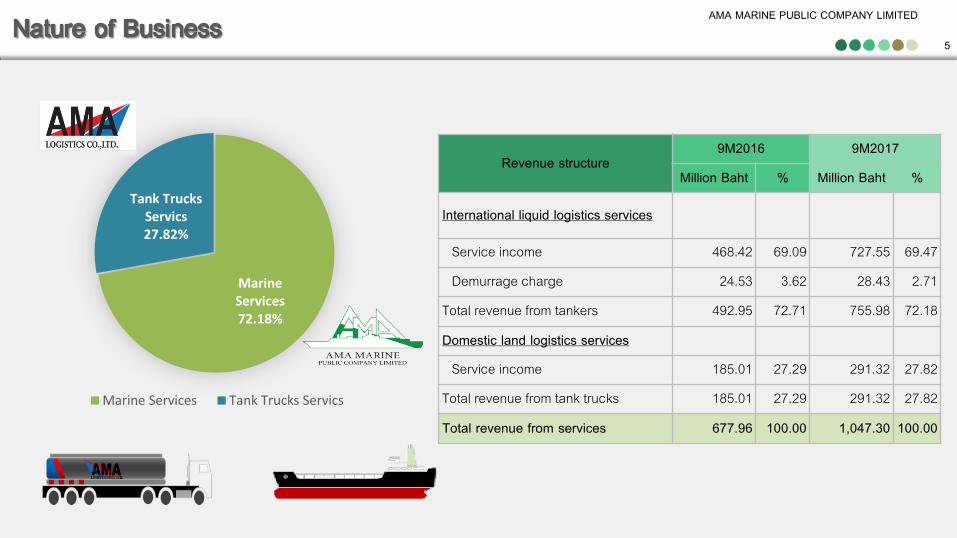
Revenue structure9M2016 9M2017
Million Baht % Million Baht %
International liquid logistics services
Service income 468.42 69.09 727.55 69.47
Demurrage charge 24.53 3.62 28.43 2.71
Total revenue from tankers 492.95 72.71 755.98 72.18
Domestic land logistics services
Service income 185.01 27.29 291.32 27.82
Total revenue from tank trucks 185.01 27.29 291.32 27.82
Total revenue from services 677.96 100.00 1,047.30 100.00
Marine Services72.18%
Tank Trucks Servics27.82%
Marine Services Tank Trucks Servics
AMA MARINE PUBLIC COMPANY LIMITED
6
AMA MARINE PUBLIC COMPANY LIMITED
7
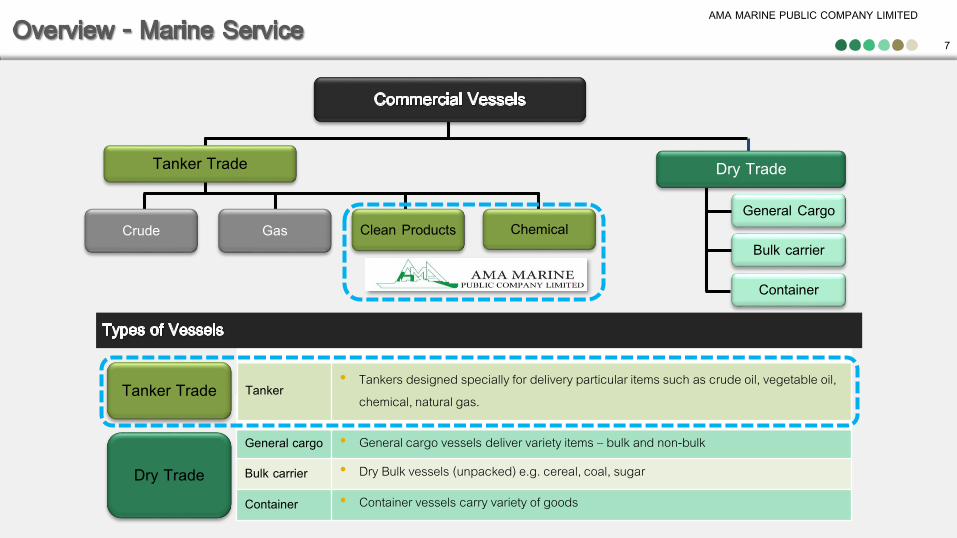
General cargo • General cargo vessels deliver variety items – bulk and non-bulk
Bulk carrier • Dry Bulk vessels (unpacked) e.g. cereal, coal, sugar
Container • Container vessels carry variety of goods
Crude Gas Clean Products Chemical
Tanker• Tankers designed specially for delivery particular items such as crude oil, vegetable oil,
chemical, natural gas.
General Cargo
Bulk carrier
Container
Tanker Trade Dry Trade
Tanker Trade
Dry Trade
AMA MARINE PUBLIC COMPANY LIMITED
8
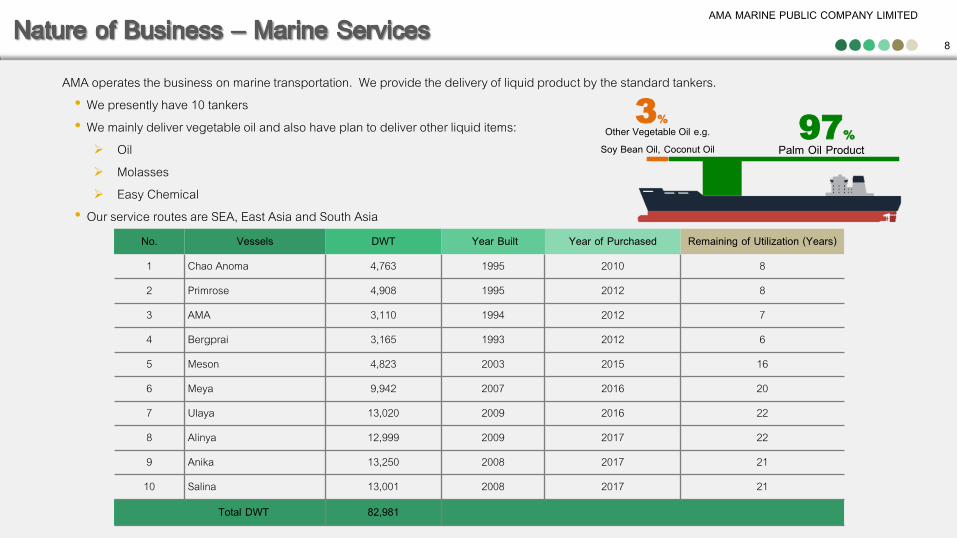
AMA operates the business on marine transportation. We provide the delivery of liquid product by the standard tankers.• We presently have 10 tankers• We mainly deliver vegetable oil and also have plan to deliver other liquid items:
Oil Molasses Easy Chemical
• Our service routes are SEA, East Asia and South AsiaNo. Vessels DWT Year Built Year of Purchased Remaining of Utilization (Years)
1 Chao Anoma 4,763 1995 2010 8
2 Primrose 4,908 1995 2012 8
3 AMA 3,110 1994 2012 7
4 Bergprai 3,165 1993 2012 6
5 Meson 4,823 2003 2015 16
6 Meya 9,942 2007 2016 20
7 Ulaya 13,020 2009 2016 22
8 Alinya 12,999 2009 2017 22
9 Anika 13,250 2008 2017 21
10 Salina 13,001 2008 2017 21
Total DWT 82,981
Palm Oil Product97%Other Vegetable Oil e.g.
Soy Bean Oil, Coconut Oil
3%
AMA MARINE PUBLIC COMPANY LIMITED
9
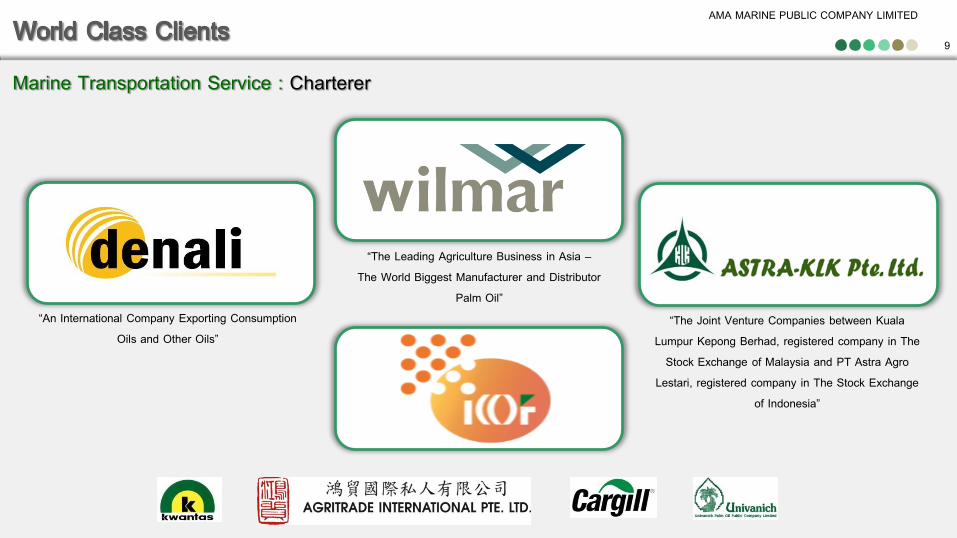
Marine Transportation Service : Charterer
“The Leading Agriculture Business in Asia –The World Biggest Manufacturer and Distributor
Palm Oil”“An International Company Exporting Consumption
Oils and Other Oils”“The Joint Venture Companies between Kuala
Lumpur Kepong Berhad, registered company in The Stock Exchange of Malaysia and PT Astra Agro
Lestari, registered company in The Stock Exchange of Indonesia”
AMA MARINE PUBLIC COMPANY LIMITED
10
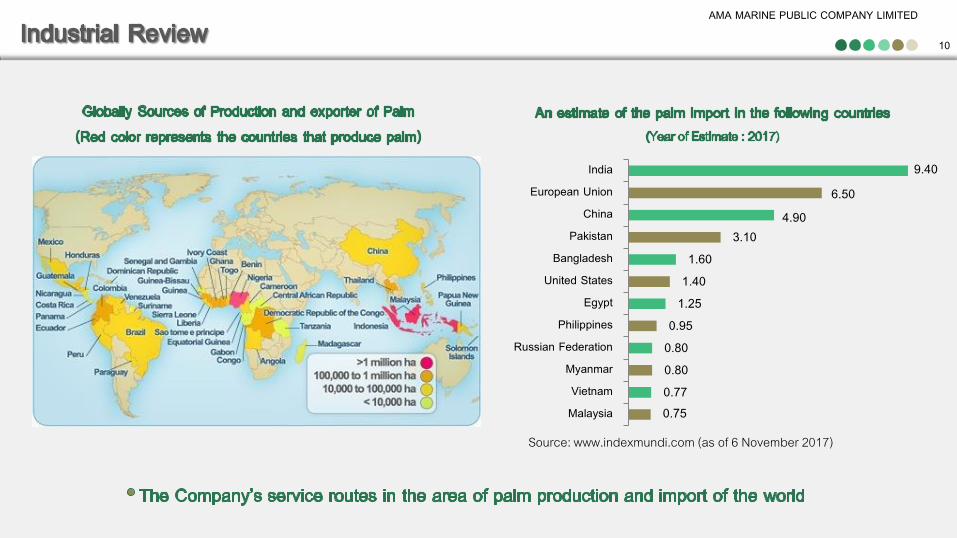
0.75 0.77 0.80 0.80 0.95
1.25 1.40 1.60
3.10 4.90
6.50 9.40
MalaysiaVietnam
MyanmarRussian Federation
PhilippinesEgypt
United StatesBangladesh
PakistanChina
European UnionIndia
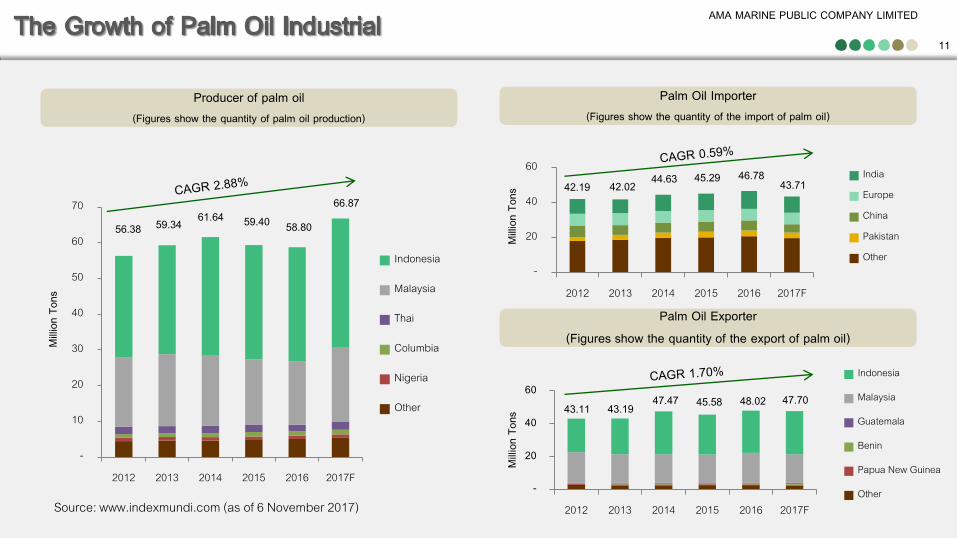
Source: www.indexmundi.com (as of 6 November 2017)
AMA MARINE PUBLIC COMPANY LIMITED
56.38 59.34 61.64 59.40 58.80
66.87
-
10
20
30
40
50
60
70
2012 2013 2014 2015 2016 2017F
Indonesia
Malaysia
Thai
Columbia
Nigeria
Other
11
Producer of palm oil(Figures show the quantity of palm oil production)
Palm Oil Exporter(Figures show the quantity of the export of palm oil)
Palm Oil Importer(Figures show the quantity of the import of palm oil)
Milli
on T
ons
Milli
on T
ons
Milli
on T
ons
43.11 43.19 47.47 45.58 48.02 47.70
-
20
40
60
2012 2013 2014 2015 2016 2017F
Indonesia
Malaysia
Guatemala
Benin
Papua New Guinea
Other
42.19 42.02 44.63 45.29 46.78 43.71
-
20
40
60
2012 2013 2014 2015 2016 2017F
IndiaEuropeChinaPakistanOther
Source: www.indexmundi.com (as of 6 November 2017)
AMA MARINE PUBLIC COMPANY LIMITED
12
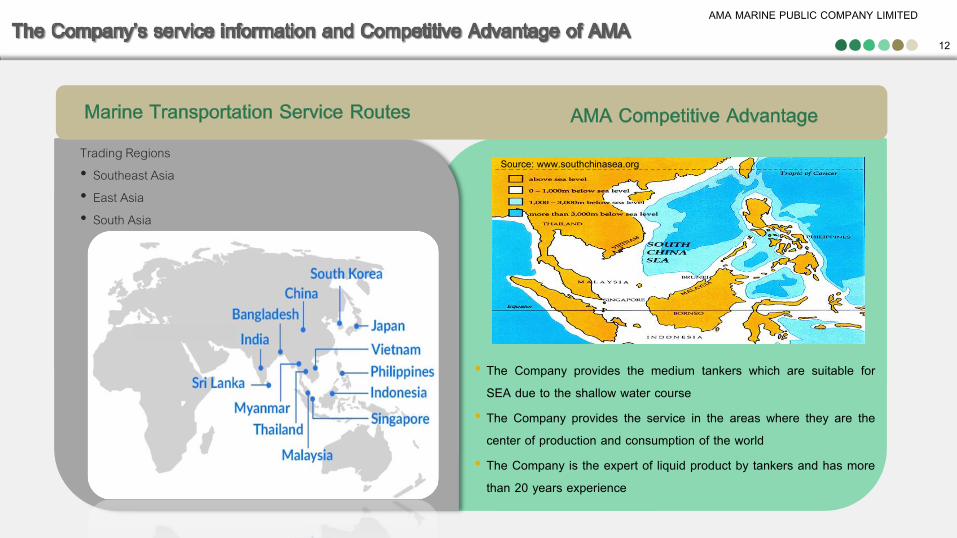
• The Company provides the medium tankers which are suitable for SEA due to the shallow water course
• The Company provides the service in the areas where they are the center of production and consumption of the world
• The Company is the expert of liquid product by tankers and has more than 20 years experience
Source: www.southchinasea.org Trading Regions• Southeast Asia• East Asia• South Asia
AMA MARINE PUBLIC COMPANY LIMITED
13
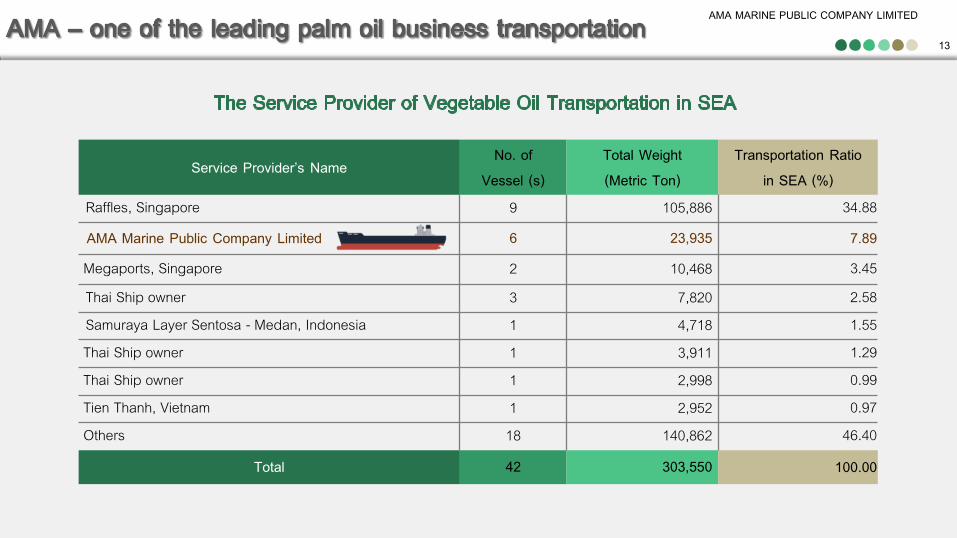
Service Provider’s NameNo. of
Vessel (s)Total Weight(Metric Ton)
Transportation Ratio in SEA (%)
Raffles, Singapore 9 105,886 34.88
AMA Marine Public Company Limited 6 23,935 7.89
Megaports, Singapore 2 10,468 3.45Thai Ship owner 3 7,820 2.58Samuraya Layer Sentosa - Medan, Indonesia 1 4,718 1.55Thai Ship owner 1 3,911 1.29Thai Ship owner 1 2,998 0.99Tien Thanh, Vietnam 1 2,952 0.97Others 18 140,862 46.40
Total 42 303,550 100.00
AMA MARINE PUBLIC COMPANY LIMITED
14
AMA MARINE PUBLIC COMPANY LIMITED
15
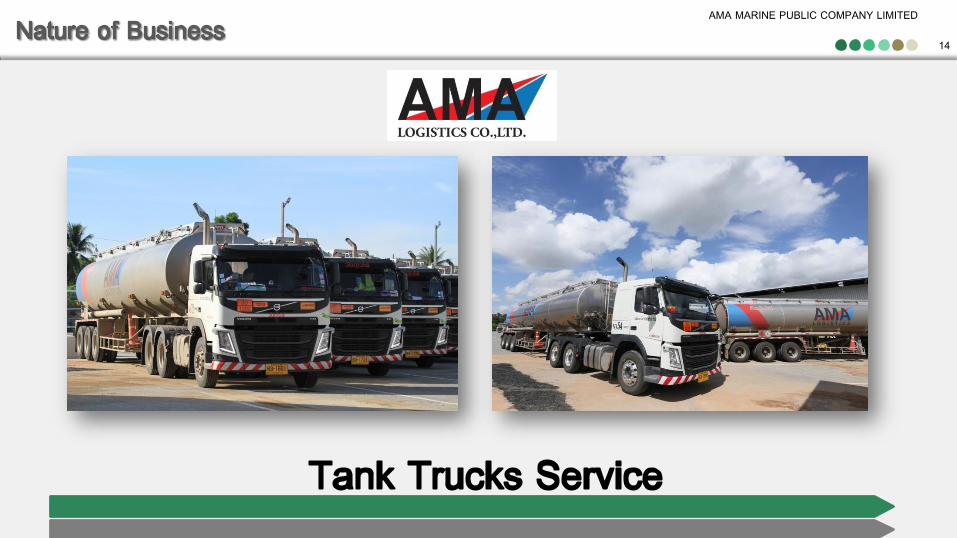
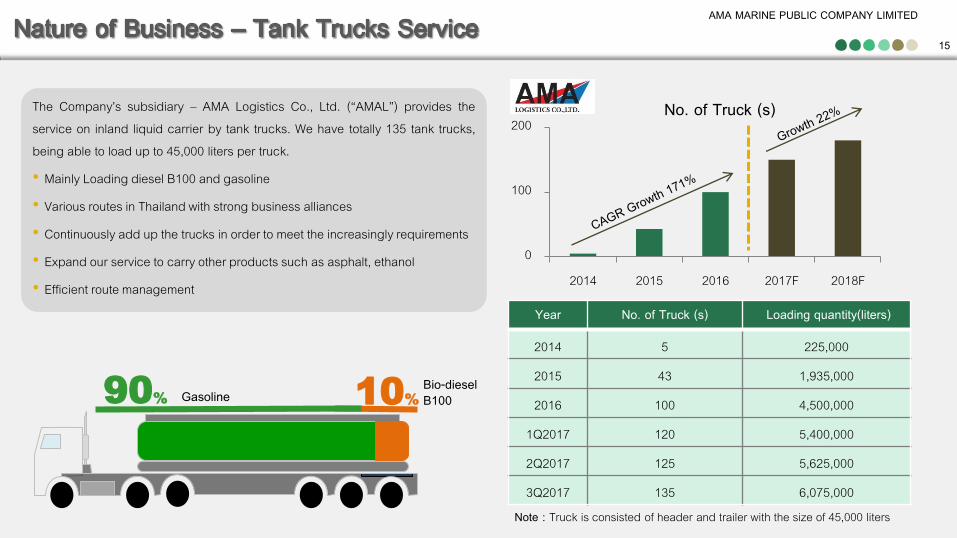
The Company’s subsidiary – AMA Logistics Co., Ltd. (“AMAL”) provides the service on inland liquid carrier by tank trucks. We have totally 135 tank trucks, being able to load up to 45,000 liters per truck.
• Mainly Loading diesel B100 and gasoline
• Various routes in Thailand with strong business alliances
• Continuously add up the trucks in order to meet the increasingly requirements
• Expand our service to carry other products such as asphalt, ethanol
• Efficient route management
0
100
200
2014 2015 2016 2017F 2018F
No. of Truck (s)
10%Bio-dieselB10090% Gasoline
Year No. of Truck (s) Loading quantity(liters)
2014 5 225,000
2015 43 1,935,000
2016 100 4,500,000
1Q2017 120 5,400,000
2Q2017 125 5,625,000
3Q2017 135 6,075,000Note : Truck is consisted of header and trailer with the size of 45,000 liters
AMA MARINE PUBLIC COMPANY LIMITED
16
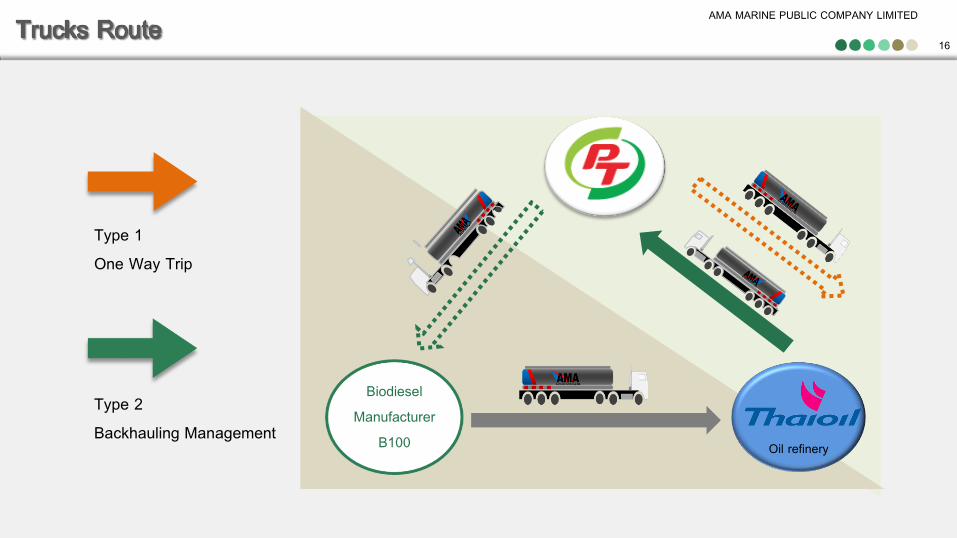
Type 2Backhauling Management
Type 1 One Way Trip
BiodieselManufacturer
B100 Oil refinery
AMA MARINE PUBLIC COMPANY LIMITED
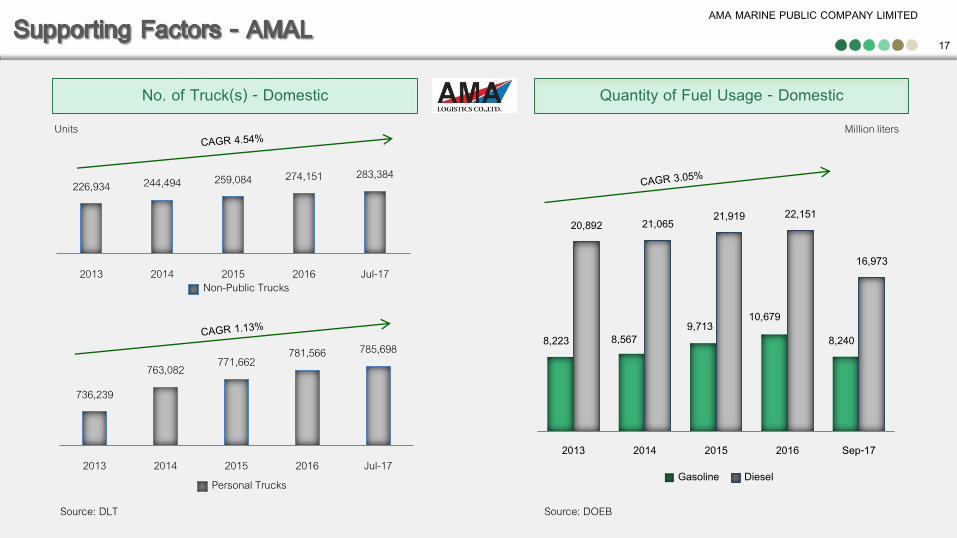
8,223 8,5679,713
10,679
8,240
20,892 21,065 21,919 22,151
16,973
2013 2014 2015 2016 Sep-17
Gasoline Diesel
17
Quantity of Fuel Usage - DomesticNo. of Truck(s) - Domestic
226,934 244,494 259,084 274,151 283,384
2013 2014 2015 2016 Jul-17Non-Public Trucks
736,239
763,082 771,662 781,566 785,698
2013 2014 2015 2016 Jul-17Personal Trucks
Million liters
Source: DOEBSource: DLT
Units
AMA MARINE PUBLIC COMPANY LIMITED
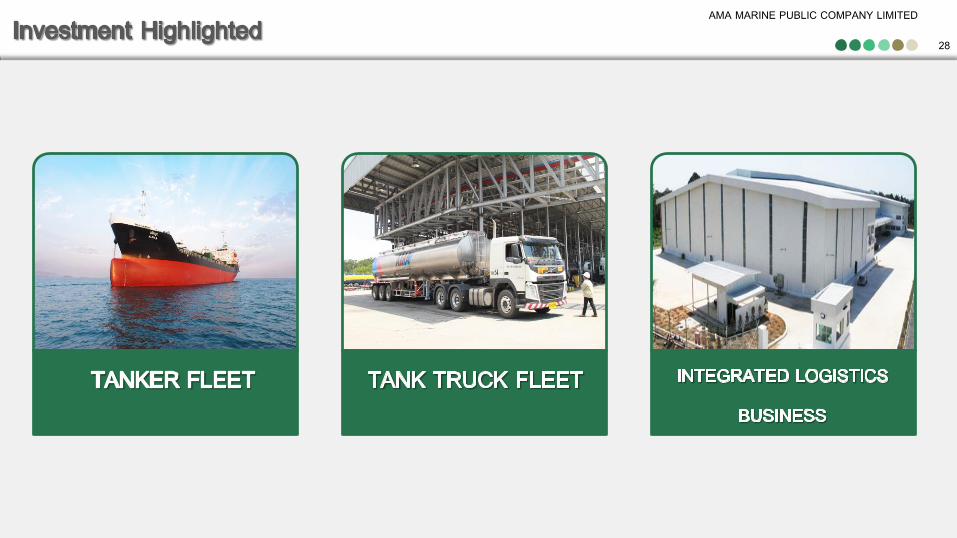
Investment Highlighted
Significant Business Operations
Company Background & Development
Operation Result & Financial Position
Nature of Business
AMA MARINE PUBLIC COMPANY LIMITED
19
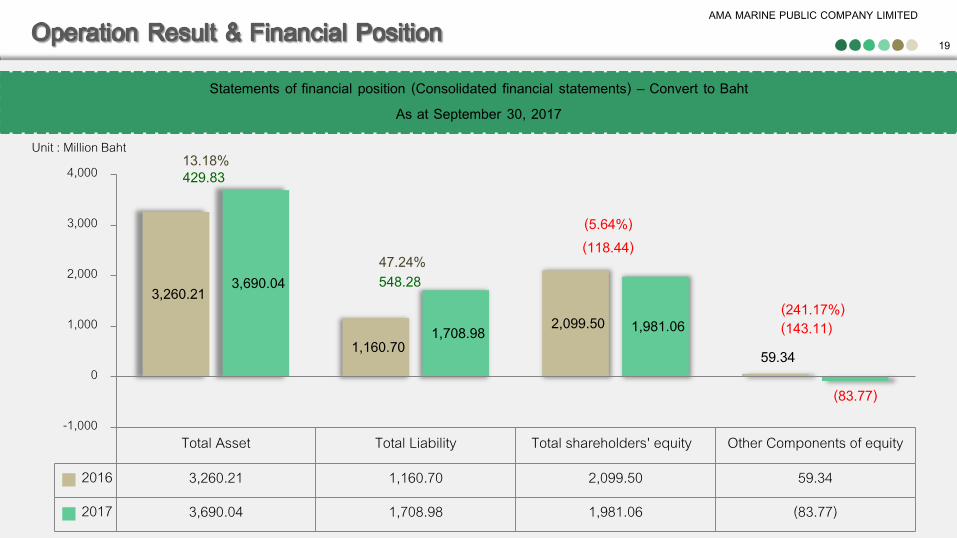
Statements of financial position (Consolidated financial statements) – Convert to BahtAs at September 30, 2017
Total Asset Total Liability Total shareholders' equity Other Components of equity
2016 3,260.21 1,160.70 2,099.50 59.34
2017 3,690.04 1,708.98 1,981.06 (83.77)
3,260.21
1,160.70 2,099.50
59.34
3,690.04
1,708.98 1,981.06
(83.77)-1,000
0
1,000
2,000
3,000
4,000 429.83
548.28
(118.44)
(143.11)
13.18%
47.24%
(5.64%)
(241.17%)
Unit : Million Baht
AMA MARINE PUBLIC COMPANY LIMITED
20
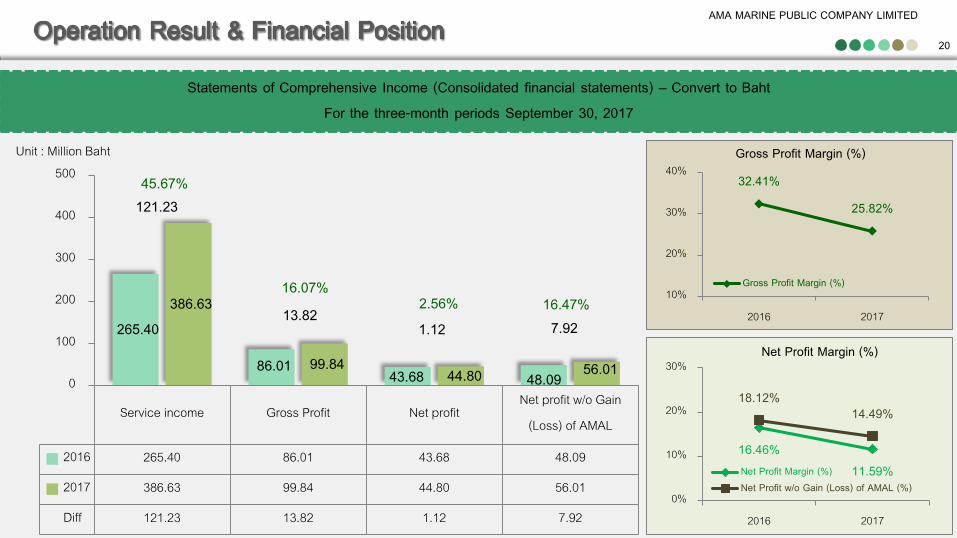
Statements of Comprehensive Income (Consolidated financial statements) – Convert to BahtFor the three-month periods September 30, 2017
Service income Gross Profit Net profitNet profit w/o Gain
(Loss) of AMAL
2016 265.40 86.01 43.68 48.09
2017 386.63 99.84 44.80 56.01
Diff 121.23 13.82 1.12 7.92
265.40
86.01 43.68 48.09
386.63
99.84 44.80 56.01
121.23
13.82 1.12 7.92
0
100
200
300
400
500 32.41%
25.82%
10%
20%
30%
40%
2016 2017
Gross Profit Margin (%)
Gross Profit Margin (%)
45.67%
16.07%2.56% 16.47%
16.46%11.59%
18.12%14.49%
0%
10%
20%
30%
2016 2017
Net Profit Margin (%)
Net Profit Margin (%)Net Profit w/o Gain (Loss) of AMAL (%)
Unit : Million Baht
AMA MARINE PUBLIC COMPANY LIMITED
21
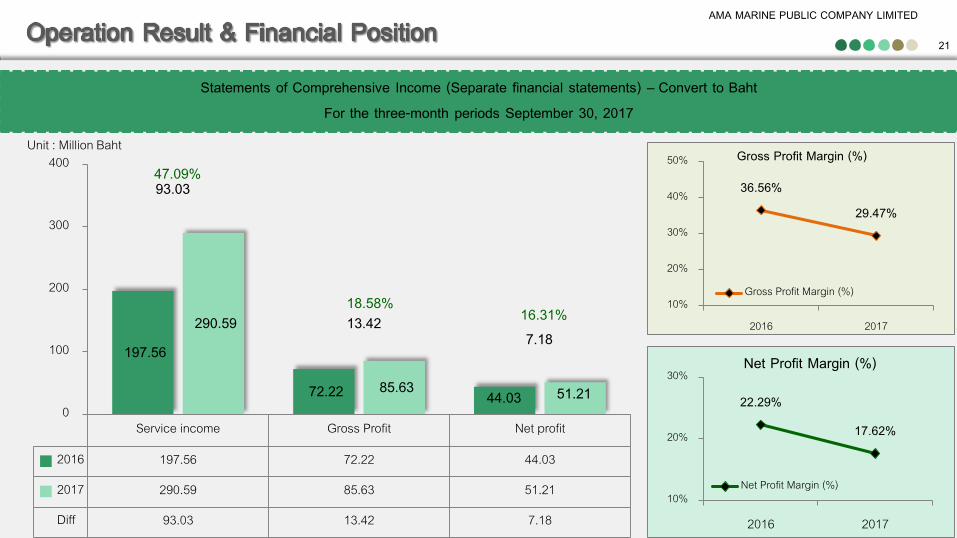
Statements of Comprehensive Income (Separate financial statements) – Convert to BahtFor the three-month periods September 30, 2017
Service income Gross Profit Net profit
2016 197.56 72.22 44.03
2017 290.59 85.63 51.21
Diff 93.03 13.42 7.18
197.56
72.22 44.03
290.59
85.63 51.21
93.03
13.42 7.18
0
100
200
300
400Unit : Million Baht
36.56%29.47%
10%
20%
30%
40%
50%
2016 2017
Gross Profit Margin (%)
Gross Profit Margin (%)
47.09%
18.58%16.31%
22.29%
17.62%
10%
20%
30%
2016 2017
Net Profit Margin (%)
Net Profit Margin (%)
AMA MARINE PUBLIC COMPANY LIMITED
22
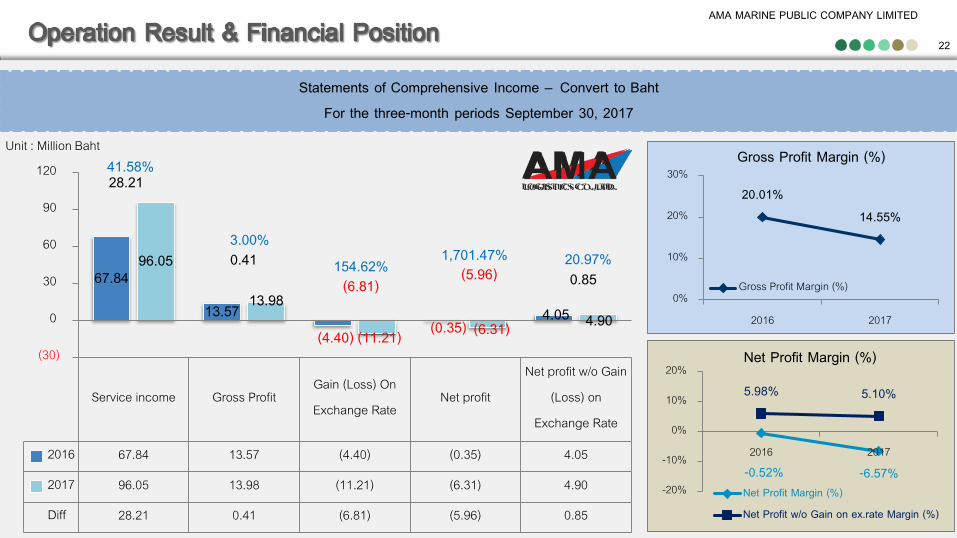
Statements of Comprehensive Income – Convert to BahtFor the three-month periods September 30, 2017
Service income Gross ProfitGain (Loss) OnExchange Rate
Net profitNet profit w/o Gain
(Loss) onExchange Rate
2016 67.84 13.57 (4.40) (0.35) 4.05
2017 96.05 13.98 (11.21) (6.31) 4.90
Diff 28.21 0.41 (6.81) (5.96) 0.85
67.84
13.57 (4.40) (0.35)
4.05
96.05
13.98
(11.21) (6.31) 4.90
28.21
0.41 (6.81)
(5.96) 0.85
(30)
0
30
60
90
120 41.58%
3.00%154.62% 1,701.47% 20.97%
20.01%14.55%
0%
10%
20%
30%
2016 2017
Gross Profit Margin (%)
Gross Profit Margin (%)
-0.52% -6.57%
5.98% 5.10%
-20%
-10%
0%
10%
20%
2016 2017
Net Profit Margin (%)
Net Profit Margin (%)Net Profit w/o Gain on ex.rate Margin (%)
Unit : Million Baht
AMA MARINE PUBLIC COMPANY LIMITED
23
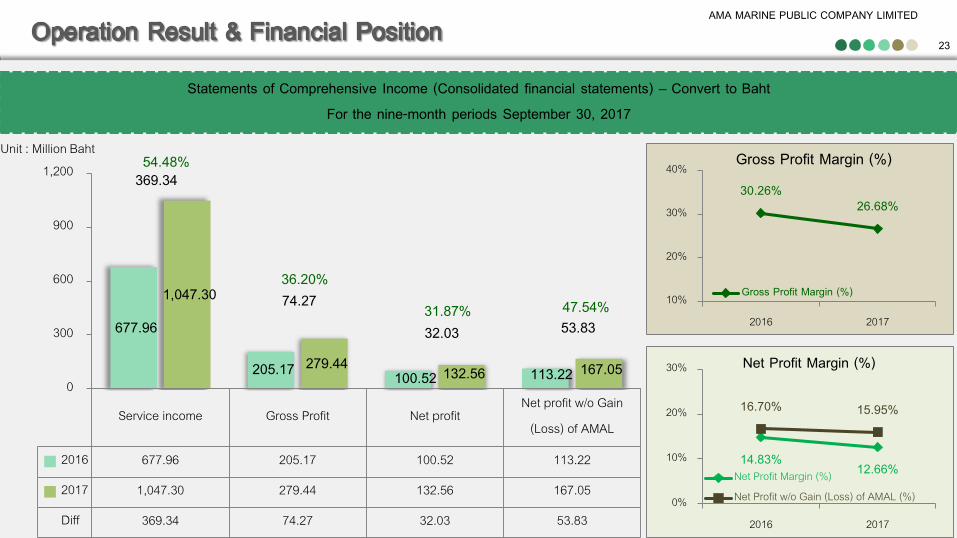
Statements of Comprehensive Income (Consolidated financial statements) – Convert to BahtFor the nine-month periods September 30, 2017
Service income Gross Profit Net profitNet profit w/o Gain
(Loss) of AMAL
2016 677.96 205.17 100.52 113.22
2017 1,047.30 279.44 132.56 167.05
Diff 369.34 74.27 32.03 53.83
677.96
205.17 100.52 113.22
1,047.30
279.44 132.56 167.05
369.34
74.27
32.03 53.83
0
300
600
900
1,20030.26%
26.68%
10%
20%
30%
40%
2016 2017
Gross Profit Margin (%)
Gross Profit Margin (%)
54.48%
36.20%
31.87% 47.54%
14.83% 12.66%
16.70% 15.95%
0%
10%
20%
30%
2016 2017
Net Profit Margin (%)
Net Profit Margin (%)Net Profit w/o Gain (Loss) of AMAL (%)
Unit : Million Baht
AMA MARINE PUBLIC COMPANY LIMITED
24
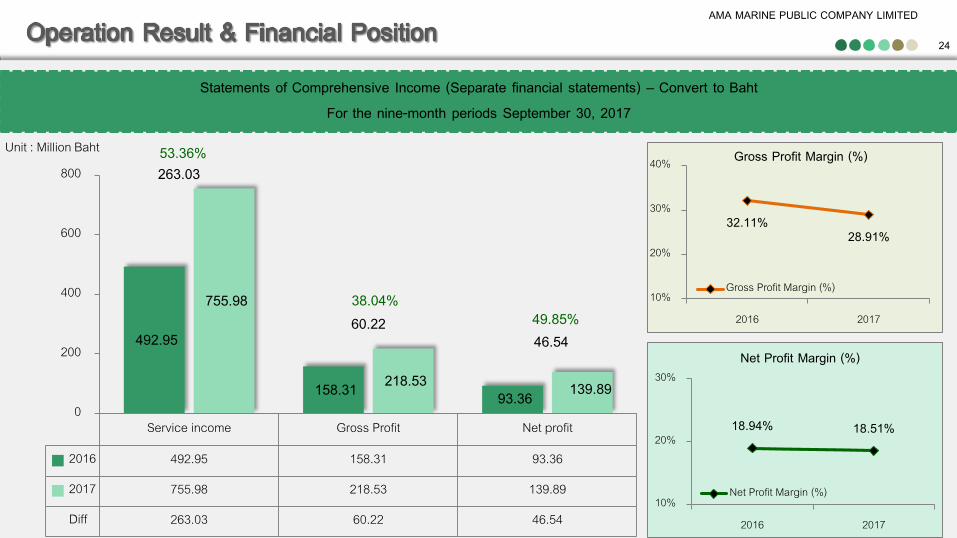
Statements of Comprehensive Income (Separate financial statements) – Convert to BahtFor the nine-month periods September 30, 2017
Service income Gross Profit Net profit
2016 492.95 158.31 93.36
2017 755.98 218.53 139.89
Diff 263.03 60.22 46.54
492.95
158.31 93.36
755.98
218.53 139.89
263.03
60.22 46.54
0
200
400
600
800Unit : Million Baht
32.11%28.91%
10%
20%
30%
40%
2016 2017
Gross Profit Margin (%)
Gross Profit Margin (%)
53.36%
38.04%49.85%
18.94% 18.51%
10%
20%
30%
2016 2017
Net Profit Margin (%)
Net Profit Margin (%)
AMA MARINE PUBLIC COMPANY LIMITED
25
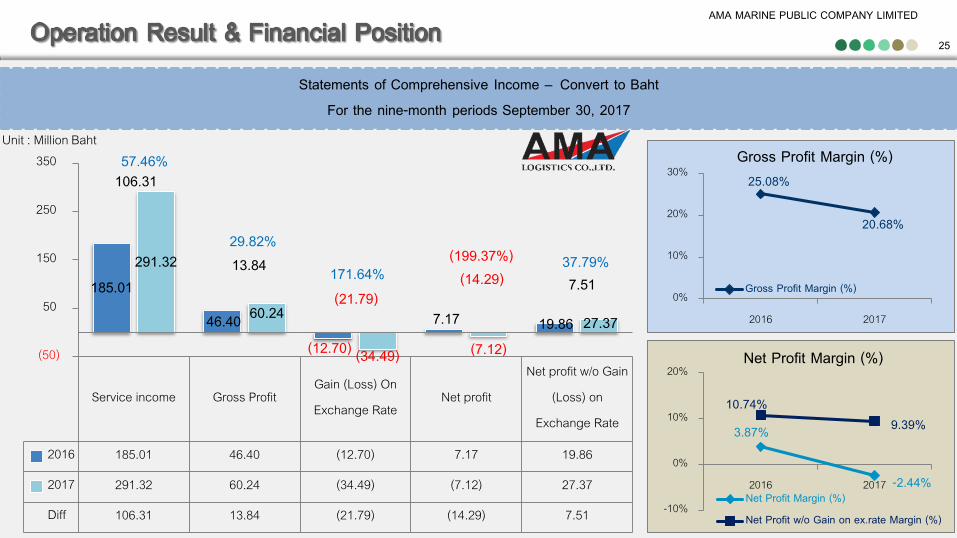
Statements of Comprehensive Income – Convert to BahtFor the nine-month periods September 30, 2017
Service income Gross ProfitGain (Loss) OnExchange Rate
Net profitNet profit w/o Gain
(Loss) onExchange Rate
2016 185.01 46.40 (12.70) 7.17 19.86
2017 291.32 60.24 (34.49) (7.12) 27.37
Diff 106.31 13.84 (21.79) (14.29) 7.51
185.01
46.40 (12.70)
7.17 19.86
291.32
60.24
(34.49) (7.12)27.37
106.31
13.84
(21.79)(14.29) 7.51
(50)
50
150
250
350 57.46%
29.82%
171.64%(199.37%) 37.79%
25.08%
20.68%
0%
10%
20%
30%
2016 2017
Gross Profit Margin (%)
Gross Profit Margin (%)
3.87%
-2.44%
10.74%9.39%
-10%
0%
10%
20%
2016 2017
Net Profit Margin (%)
Net Profit Margin (%)Net Profit w/o Gain on ex.rate Margin (%)
Unit : Million Baht
AMA MARINE PUBLIC COMPANY LIMITED
26
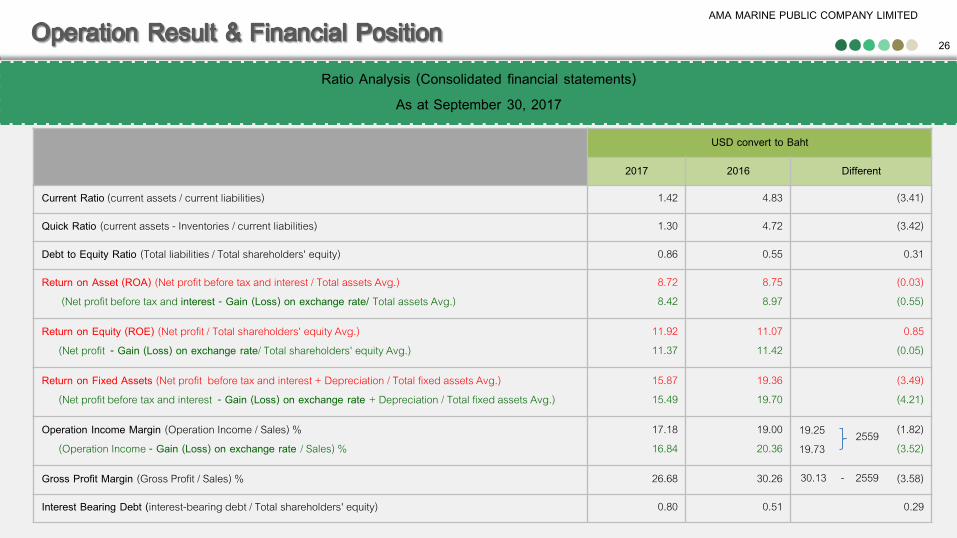
Ratio Analysis (Consolidated financial statements)As at September 30, 2017
USD convert to Baht
2017 2016 Different
Current Ratio (current assets / current liabilities) 1.42 4.83 (3.41)
Quick Ratio (current assets - Inventories / current liabilities) 1.30 4.72 (3.42)
Debt to Equity Ratio (Total liabilities / Total shareholders' equity) 0.86 0.55 0.31
Return on Asset (ROA) (Net profit before tax and interest / Total assets Avg.)(Net profit before tax and interest - Gain (Loss) on exchange rate/ Total assets Avg.)
8.728.42
8.758.97
(0.03)(0.55)
Return on Equity (ROE) (Net profit / Total shareholders' equity Avg.)(Net profit - Gain (Loss) on exchange rate/ Total shareholders' equity Avg.)
11.9211.37
11.0711.42
0.85(0.05)
Return on Fixed Assets (Net profit before tax and interest + Depreciation / Total fixed assets Avg.)(Net profit before tax and interest - Gain (Loss) on exchange rate + Depreciation / Total fixed assets Avg.)
15.8715.49
19.3619.70
(3.49)(4.21)
Operation Income Margin (Operation Income / Sales) %(Operation Income - Gain (Loss) on exchange rate / Sales) %
17.1816.84
19.0020.36
(1.82)(3.52)
Gross Profit Margin (Gross Profit / Sales) % 26.68 30.26 (3.58)
Interest Bearing Debt (interest-bearing debt / Total shareholders' equity) 0.80 0.51 0.29
19.2519.73
2559
30.13 - 2559
AMA MARINE PUBLIC COMPANY LIMITED
Operation Result & Financial Position
Significant Business Operations
Company Background & Development
Investment Highlighted
Nature of Business
AMA MARINE PUBLIC COMPANY LIMITED
28
AMA MARINE PUBLIC COMPANY LIMITED
29
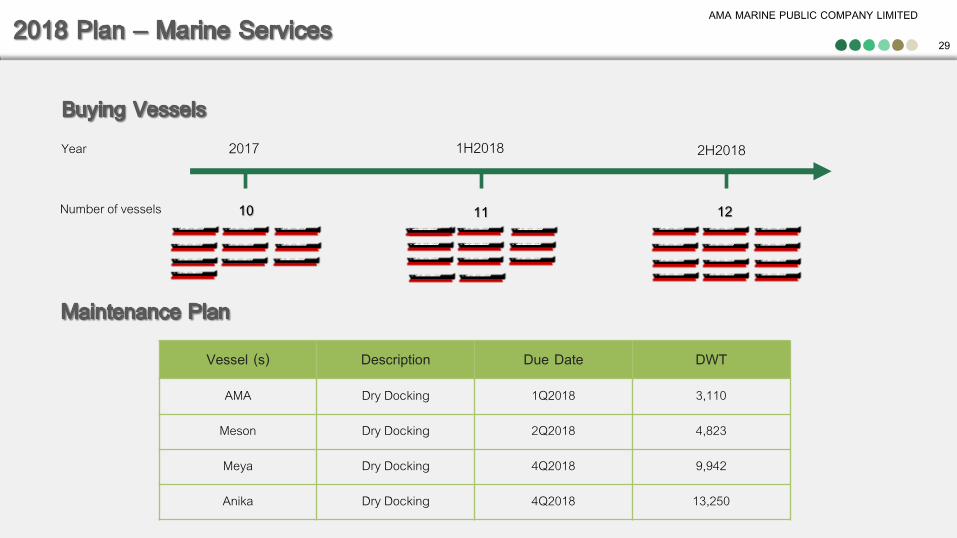
Vessel (s) Description Due Date DWT
AMA Dry Docking 1Q2018 3,110
Meson Dry Docking 2Q2018 4,823
Meya Dry Docking 4Q2018 9,942
Anika Dry Docking 4Q2018 13,250
2017 2H20181H2018
10 11 12Number of vessels
Year
AMA MARINE PUBLIC COMPANY LIMITED
30
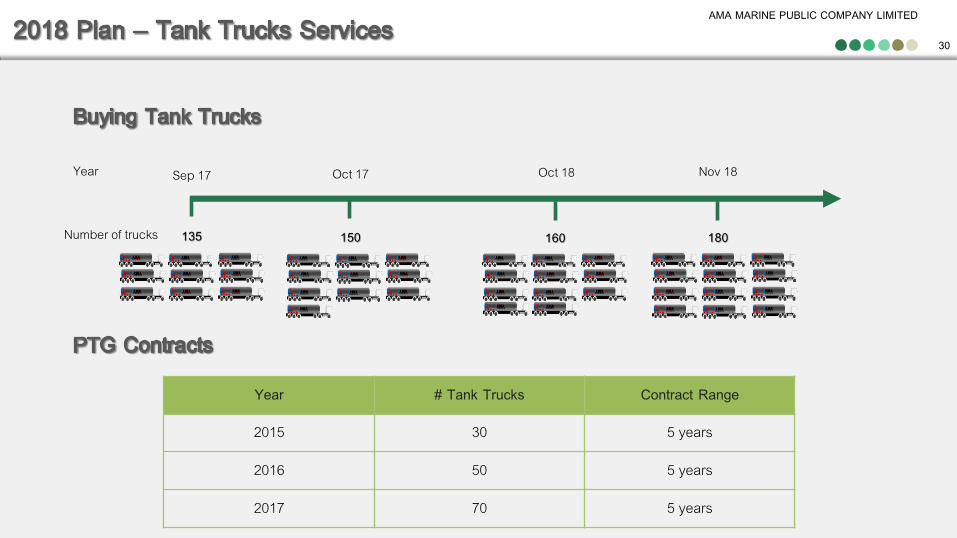
Year # Tank Trucks Contract Range
2015 30 5 years
2016 50 5 years
2017 70 5 years
Sep 17
135Number of trucks
Year Oct 17 Nov 18Oct 18
150 160 180
AMA MARINE PUBLIC COMPANY LIMITED
Operation Result & Financial Position
Company Background & Development
Investment Highlighted
Nature of Business
Significant Business Operations
AMA MARINE PUBLIC COMPANY LIMITED
32
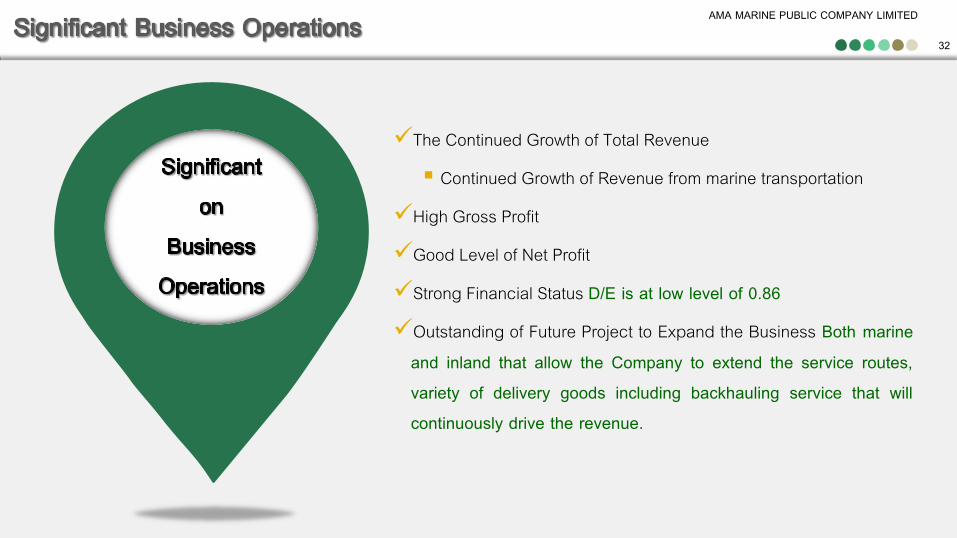
The Continued Growth of Total Revenue
Continued Growth of Revenue from marine transportation
High Gross Profit
Good Level of Net Profit
Strong Financial Status D/E is at low level of 0.86
Outstanding of Future Project to Expand the Business Both marine and inland that allow the Company to extend the service routes, variety of delivery goods including backhauling service that will continuously drive the revenue.
AMA MARINE PUBLIC COMPANY LIMITED
33
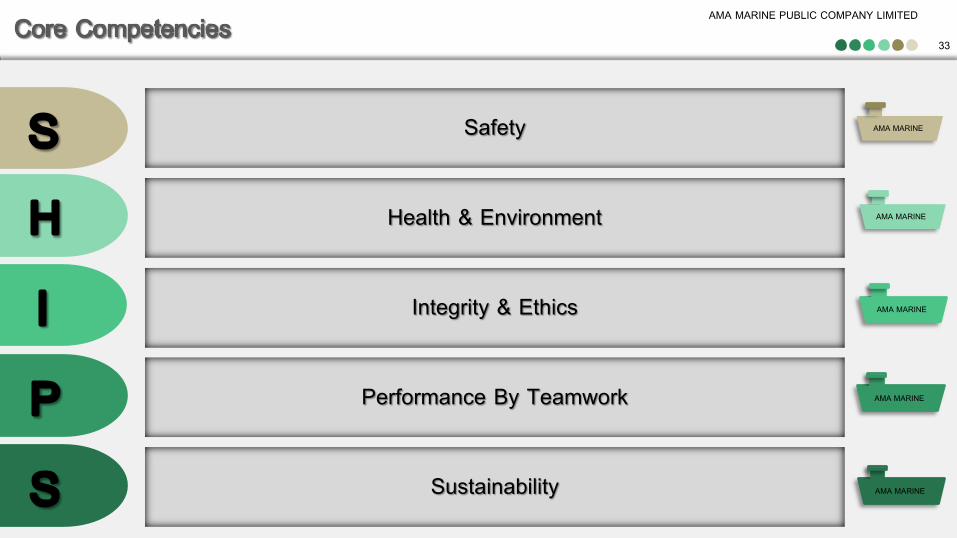
Sustainability
Performance By Teamwork
Integrity & Ethics
Health & Environment
Safety AMA MARINE
AMA MARINE
AMA MARINE
AMA MARINE
AMA MARINE
AMA MARINE PUBLIC COMPANY LIMITED
34
AMA Marine Public Company Limited33/4 the 9th Towers, Room #TNA02, 33rd Floor, Tower A, Rama 9 Road, Huaykwang, Bangkok 10300 ThailandTel: (662) 001-2801 Fax: (662) 001-2800website: www.amamarine.co.th
For further information and enquiries, please contact our IRTel: (662) 001-2801 # 174email: [email protected], [email protected]