2 CHAPTER COST BEHAVIOR AND COST ESTIMATION photo: © Tischenko Irina/Shutterstock.
36
2 CHAPTER COST BEHAVIOR AND COST ESTIMATION p hoto : © Tisc henk o I rina /Shu tter stoc k
-
Upload
sybil-mosley -
Category
Documents
-
view
223 -
download
0
Transcript of 2 CHAPTER COST BEHAVIOR AND COST ESTIMATION photo: © Tischenko Irina/Shutterstock.

2CHAPTER
COST BEHAVIOR ANDCOST ESTIMATION
photo: © Tischenko Irina/S
hutterstock

2
UNIVERSAL SPORTS’ INCOME STATEMENT
Sales $ 1,039,500
COGS 769,230
Gross Profit $ 270,270
Selling and administrative expense 230,370
Operating income $ 39,900
Tax expense (30%) 11,970
Net Income $ 27,930
What would Universal Sports’ net income be if it met the original sales volume projection?

COST BEHAVIOR PATTERNS
Unit 2.1
21.Unit 2.2 Unit 2.3
© Tom
wang112 / iS
tockphoto

2
4 TYPES OF COST BEHAVIOR
► Variable► Fixed► Step-Variable► Mixed

2
IT’S TIME FOR A STUDY BREAK!
You’ve been studying for several hours and are getting ready to take a study break, so you break open a nice cold can of soda. Just then the doorbell rings and in come three friends.

2
HERE’S THE DRINK BILL
Friends Cost per can Total cost
1 $0.75 $0.75
2 $0.75 $1.50
3 $0.75 $2.25
4 $0.75 $3.00
2
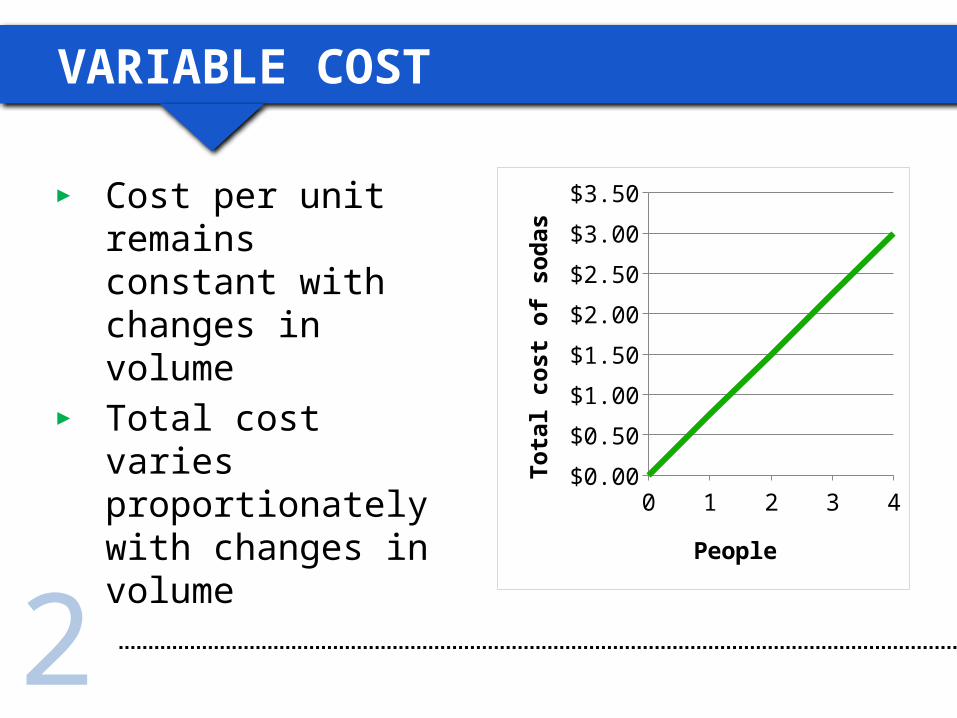
VARIABLE COST
0 1 2 3 4$0.00
$0.50
$1.00
$1.50
$2.00
$2.50
$3.00
$3.50
PeopleTo
tal c
ost o
f sod
as
► Cost per unit remains constant with changes in volume
► Total cost varies proportionately with changes in volume

2
LET’S ORDER PIZZA!
The soda didn’t do the trick, so you order a $12 large pizza from your favorite pizza place.
2
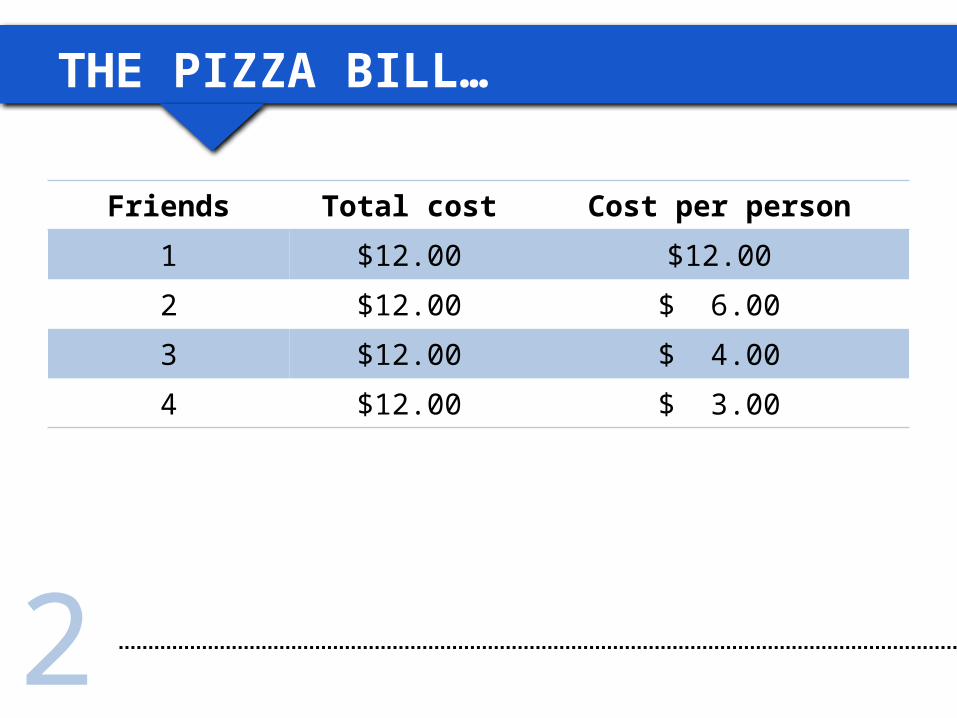
THE PIZZA BILL…
Friends Total cost Cost per person
1 $12.00 $12.00
2 $12.00 $ 6.00
3 $12.00 $ 4.00
4 $12.00 $ 3.00

2
FIXED COST
► Total cost remains constant with changes in volume
► Unit cost changes inversely with changes in volume
► Fixed relationship only holds over the relevant range
0 1 2 3 4$0.00
$2.00
$4.00
$6.00
$8.00
$10.00
$12.00
$14.00
PeopleTo
tal c
ost o
f piz
zas

2
REMEMBER TO KEEP IT CONSTANT
Friends Cost per can Total cost
1 $0.75 $ 0.75
2 $0.75 $ 1.50
3 $0.75 $ 2.25
4 $0.75 $ 3.00
Friends Cost per person Total cost
1 $12.00 $12.00
2 $ 6.00 $12.00
3 $ 4.00 $12.00
4 $ 3.00 $12.00
Variable Cost
Fixed Cost

2
COMMITTED VS. DISCRETIONARY
► Depends on the time frame over which the costs are incurred and fixed.
10-year factory lease
COMMITTED6-month advertising
DISCRETIONARY
CAUTIONWhat effect will reducing the cost to $0 have on the long-term health of the company?

2
STEP-VARIABLE COST
0501
10011501
2001$0
$70,000
$140,000
$210,000
$280,000
$350,000
$420,000
Enrolled Students
Tota
l Cos
t
► Cost remains fixed in total over small range of volume or activity
► These small ranges are smaller than the relevant range of fixed cost

2
MIXED COST
► Cost contains both fixed and variable components
► Total cost AND unit cost varies with changes in volume
0 25 50 75 100$0
$200
$400
$600
$800
$1,000
$1,200
$1,400
GuestsTo
tal c
ost o
f ban
quet Meals = $10 per person
Room rental = $200
Meals are a variable cost
Room rental is a fixed cost

2
Friends Total cost (room and meal) Cost per guest
25 $ 450 $18.00
50 $ 700 $14.00
75 $ 950 $12.67
100 $1,200 $12.00
MIXED COST EXAMPLE
► Variable cost = $10 per person► Fixed cost = $200.00
COST ESTIMATION
Unit 2.1
22.Unit 2.2 Unit 2.3
© Tom
wang112 / iS
tockphoto

2
REVISITING COST BEHAVIOR
How do we break a mixed cost into its fixed and variable components?
$
Activity Level
Slope = variable cost p
er unit
Y-intercept = total fixed cost

2
MIXED COST REALITY

2
WHICH LINE BEST ESTIMATES TOTAL COST?

2
THE SCATTERGRAPH METHOD

2
MIXED COST FORMULA
Where:► y is total cost► m is the variable cost per unit► x is the level of activity (number of units)► b is total fixed cost
y = mx + b

2
THE SCATTERGRAPH METHOD
$4,000 – $2,6002,500 – 1,500
= 1.4
b = $500
y = $1.40x + $500

2
THE HIGH-LOW METHOD
► This is an algebraic method to break out the fixed and variable components of a mixed cost
► Based on two extreme points during a period – the highest activity level and the lowest activity level

2
THE MECHANICS OF HIGH-LOW
► STEP 1: Find the high and low points in terms of activity level
► STEP 2: Compute the variable cost per unit► STEP 3: Calculate the fixed cost using either the
high point or the low point.► STEP 4: Complete the cost equation y = mx + b.

2
$4,800 = $1.50(2,800) + FC
FC = $600.00
DO THE HIGH-LOW# of
DeliveriesTotal Delivery
Cost
Jan 2,000 $3,650
Feb 985 $1,875
Mar 1,500 $2,600
April 2,500 $4,000
May 800 $1,400
June 600 $1,500
July 2,800 $4,800
Aug 1,200 $2,125
Sept 1,350 $2,200
Oct 725 $1,600
Nov 1,850 $3,050
Dec 2,200 $3,400
$4,800 - $1,500
2,800 - 600= $1.50 / Delivery
LOW
HIGH
Total cost = ($1.50 × Number of deliveries) + $600.00

2
WHAT IS THE ESTIMATED TOTAL COST AT 1,500 DELIVERIES?
Why is this different from the $2,600 total costs actually incurred in March?
($1.50 x 1,500) + $600 = $2,850

2
THE HIGH LOW IS JUST AN ESTIMATE
March

2
REGRESSION ANALYSIS
► Statistical technique to calculate variable and fixed components of mixed costs
► Gives the “best” line that fits a set of cost points► Easy to do with Excel

2
REGRESSION WITH EXCEL – VARIABLE COST

2
REGRESSION WITH EXCEL – FIXED COSTS
CONTRIBUTION MARGINANALYSIS
Unit 2.1
23.Unit 2.2 Unit 2.3
© Tom
wang112 / iS
tockphoto

2
WHAT IS “CONTRIBUTION MARGIN”?
► Sales Revenue – Total Variable Expenses► Contribution margin is the revenue remaining to
cover fixed expenses and provide profit after variable expenses have been covered
► Contribution Margin Ratio =Contribution Margin
Sales Revenue

2
CONTRIBUTION INCOME STATEMENT
Sales Revenue
- Variable Expenses
= Total Contribution Margin
- Total Fixed Expenses
= Operating Income

2
LET’S BUILD A CM INCOME STATEMENT

2
HERE IT IS…

2
A BETTER FORMAT