1Q2016 presentation and business plan 2016-2018
45
Conference call 10 May 2016 6.00 pm CET 1Q 2016 Results presentation and 2016-2018 Business Plan update
-
Upload
igd-siiq-spa -
Category
Real Estate
-
view
158 -
download
0
Transcript of 1Q2016 presentation and business plan 2016-2018
Conference call
10 May 2016
6.00 pm CET
1Q 2016 Results presentation and 2016-2018 Business Plan update
DIS
CL
AIM
ER
This presentation does not constitute an offer or an invitation to subscribe for or purchase any securities.
The securities referred to herein have not been registered and will not be registered in the United States under the U.S. Securities Act of 1933, as
amended (the “Securities Act”), or in Australia, Canada or Japan or any other jurisdiction where such an offer or solicitation would require the approval of
local authorities or otherwise be unlawful. The securities may not be offered or sold in the United States or to U.S. persons unless such securities are
registered under the Securities Act, or an exemption from the registration requirements of the Securities Act is available. Copies of this presentation are
not being made and may not be distributed or sent into the United States, Canada, Australia or Japan.
This presentation contains forwards-looking information and statements about IGD SIIQ SPA and its Group.
Forward-looking statements are statements that are not historical facts.
These statements include financial projections and estimates and their underlying assumptions, statements regarding plans, objectives and expectations
with respect to future operations, products and services, and statements regarding plans, performance.
Although the management of IGD SIIQ SPA believes that the expectations reflected in such forward-looking statements are reasonable,
investors and holders of IGD SIIQ are cautioned that forward-looking information and statements are subject to various risk and uncertainties,
many of which are difficult to predict and generally beyond the control of IGD SIIQ; that could cause actual results and developments to differ materially
from those expressed in, or implied or projected by, the forward-looking statements.
These risks and uncertainties include, but are not limited to, those contained in this presentation.
Except as required by applicable law, IGD SIIQ does not undertake any obligation to update any forward-looking information or statements
Results presentation as at 31/03/2016
4
10 May 2016 Results presentation as at 31/03/2016
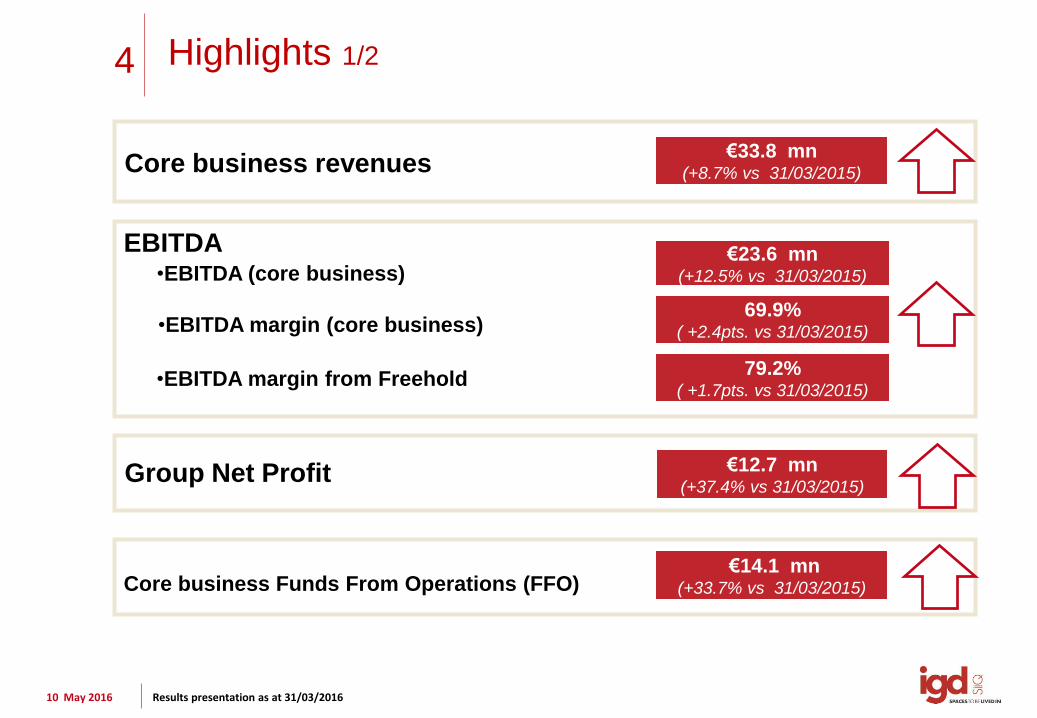
EBITDA
•EBITDA margin (core business)
Core business Funds From Operations (FFO)
Highlights 1/2
€14.1 mn (+33.7% vs 31/03/2015)
•EBITDA (core business) €23.6 mn
(+12.5% vs 31/03/2015)
•EBITDA margin from Freehold
Group Net Profit €12.7 mn (+37.4% vs 31/03/2015)
Core business revenues €33.8 mn
(+8.7% vs 31/03/2015)
69.9% ( +2.4pts. vs 31/03/2015)
79.2% ( +1.7pts. vs 31/03/2015)
5
10 May 2016 Results presentation as at 31/03/2016
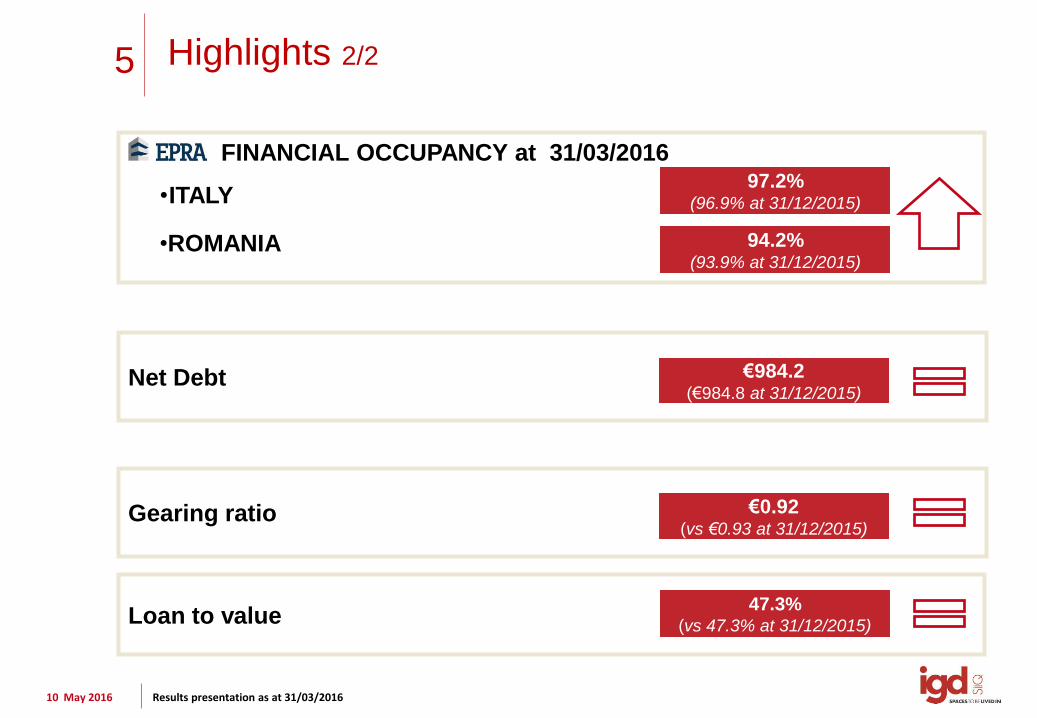
Net Debt
Gearing ratio
FINANCIAL OCCUPANCY at 31/03/2016
Highlights 2/2
€0.92 (vs €0.93 at 31/12/2015)
•ITALY
•ROMANIA
97.2% (96.9% at 31/12/2015)
94.2% (93.9% at 31/12/2015)
Loan to value 47.3%
(vs 47.3% at 31/12/2015)
€984.2 (€984.8 at 31/12/2015)

ECONOMIC
AND FINANCIAL
RESULTS

7
10 May 2016 Results presentation as at 31/03/2016
29,802
32,487
1,264
1,269
258
76
106
CONS 2015 CONS 2016
Core business revenues from rental act.
Revenues from services
Revenues from trading
Non-core business revenues from rental act.
Revenues
TOTAL REVENUES (€/000)
Total Revenues
+7.8%
31,400 33,862
BREAKDOWN OF RENTAL REVENUES BY TYPE
OF ASSET
Core
business
+8.7%
61.6%
30.7%
6.6%
1.1%
MALLS HYPER ROMANIA OTHER
8
10 May 2016 Results presentation as at 31/03/2016
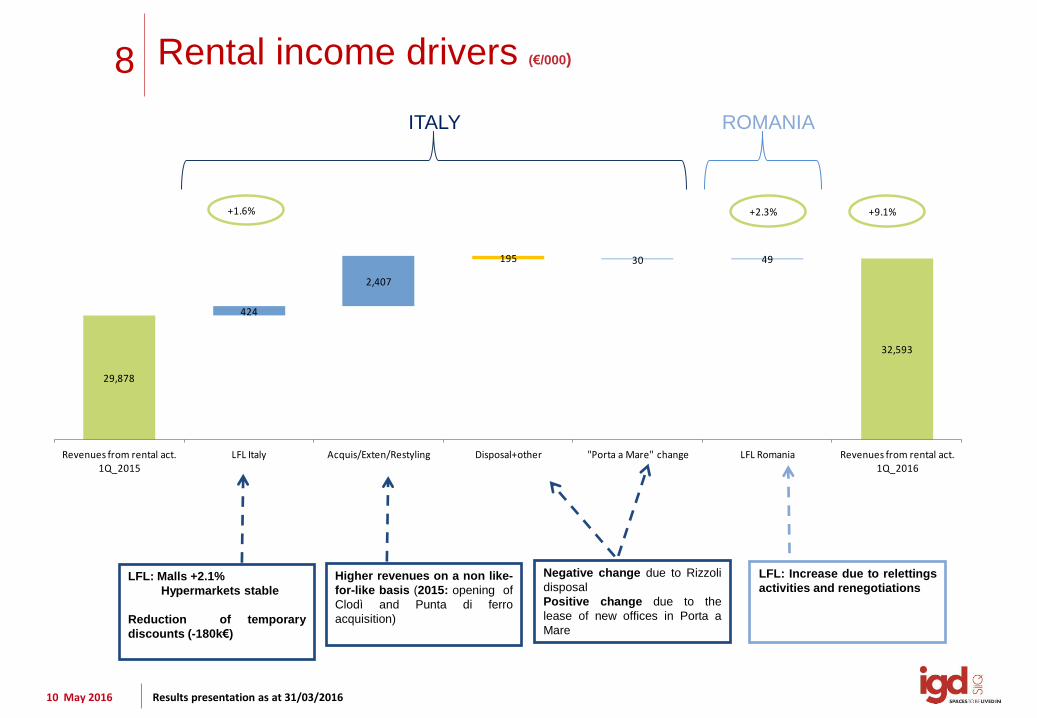
Rental income drivers (€/000)
LFL: Increase due to relettings
activities and renegotiations
LFL: Malls +2.1%
Hypermarkets stable
Reduction of temporary
discounts (-180k€)
Higher revenues on a non like-
for-like basis (2015: opening of
Clodì and Punta di ferro
acquisition)
ITALY ROMANIA
Negative change due to Rizzoli
disposal
Positive change due to the
lease of new offices in Porta a
Mare
29,878
424
2,407
195 30 49
32,593
Revenues from rental act. 1Q_2015
LFL Italy Acquis/Exten/Restyling Disposal+other "Porta a Mare" change LFL Romania Revenues from rental act. 1Q_2016
+1.6% +9.1%+2.3%

9
10 May 2016 Results presentation as at 31/03/2016
10,321
9,363
1Q2015 1Q2016
Operating cost and financial management
CORE BUSINESS G&A EXPENSES AND DIRECT COSTS (€ 000)
Lower weight of operating costs on
Revenues
Core Business Ebidta margin
(69.9%) is growing: +150bps
Ebitda margin from Freehold:
79.2 %
FINANCIAL MANAGEMENT (€ 000)
Financial Management decreased Mainly because of: • Bond Swap effect (April 2015)
•Larger use of short-term instruments awaiting long-term refinancing
- 9.3%
- 2.2%
+ 1.7% 7,568 7,700
2,517 2,463
1Q2015 1Q2016
G&A expenses
direct costs

10
10 May 2016 Results presentation as at 31/03/2016
Group Net Profit: €12.7 MN (+37.4%)
NET PROFIT EVOLUTION (€ 000)
9,215
2,613 24 - 154 988 - 12 - 14
12,659
Group Net Profit
31/03/2015
Change in core
business Ebitda
Change in Ebitda
"Porta a Mare" project
Change in
depreciations, provisions,
devaluation and fair value
Change in financial
and extraordinary management
Change in taxes Change in
(profit)/loss related to Third Parties
Group Net Profit
31/03/2016

11
10 May 2016 Results presentation as at 31/03/2016
Of which:
• + €2.6 mn due to Ebitda increase
( mainly because of perimeter
extension);
• + €0.9 mn thanks to
improvements in financial
management
Funds From Operations
10,53714,091
31/03/2015 31/03/2016
+33.7%
Funds from Operations (core business) 31/03/2015 31/03/2016 D D%
Pre-tax profit 10,003 13,396 3,393 33.92%
Depreciations and other provisions 339 328 -12 -3.26%
Change in FV and devaluation 413 577 164 39.76%
Extraordinary management 50 20 -29 -59.95%
Gross margin from trading activities 0 0 0 n.a.
Financial management adjustment 0 0 0 n.a.
Current taxes of the period -267 -230 38 -14.04%
FFO 10,537 14,091 3,554 33.73%
OPERATING
PERFOMANCE
13
10 May 2016 Results presentation as at 31/03/2016
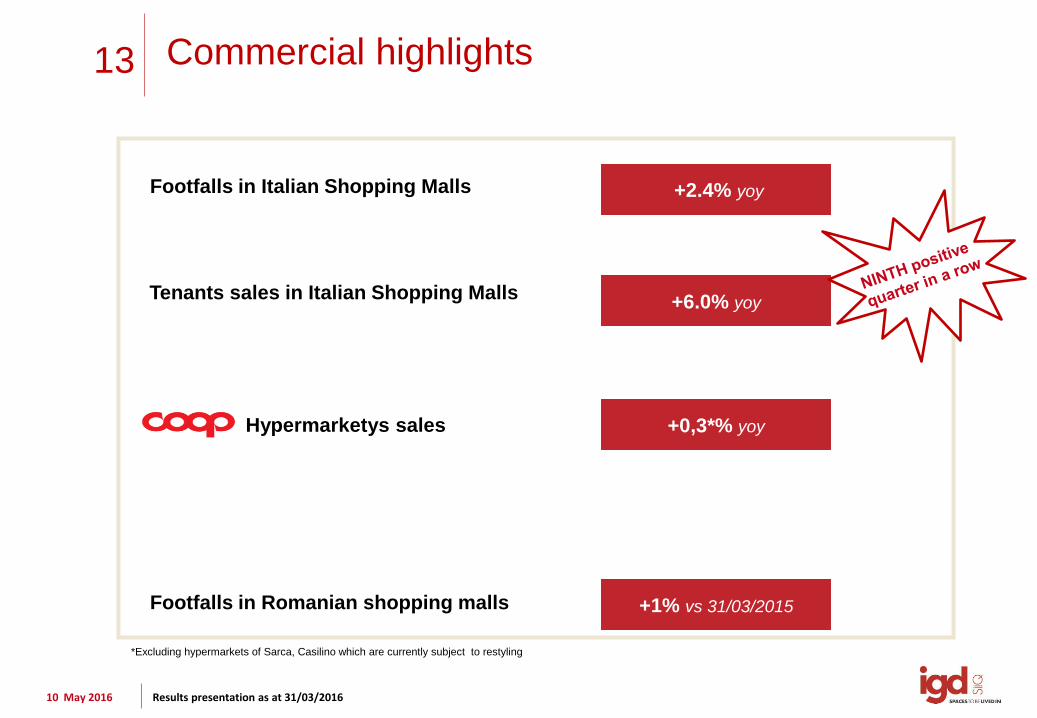
Commercial highlights
+2.4% yoy
+6.0% yoy
Footfalls in Italian Shopping Malls
Tenants sales in Italian Shopping Malls
Footfalls in Romanian shopping malls +1% vs 31/03/2015
+0,3*% yoy Hypermarketys sales
*Excluding hypermarkets of Sarca, Casilino which are currently subject to restyling
FINANCIAL
STRUCTURE

15
10 May 2016 Results presentation as at 31/03/2016
31/12/2015
Financial highlights 1/2
LOAN TO VALUE
31/03/2016
47.3% 47.3%
2.15X 2.52X INTEREST COVER RATIO
3.67% 3.26% AVERAGE COST OF DEBT
GEARING RATIO
0.93 0.92
€984.8 mn €984.2 mn NET DEBT
16
10 May 2016 Results presentation as at 31/03/2016
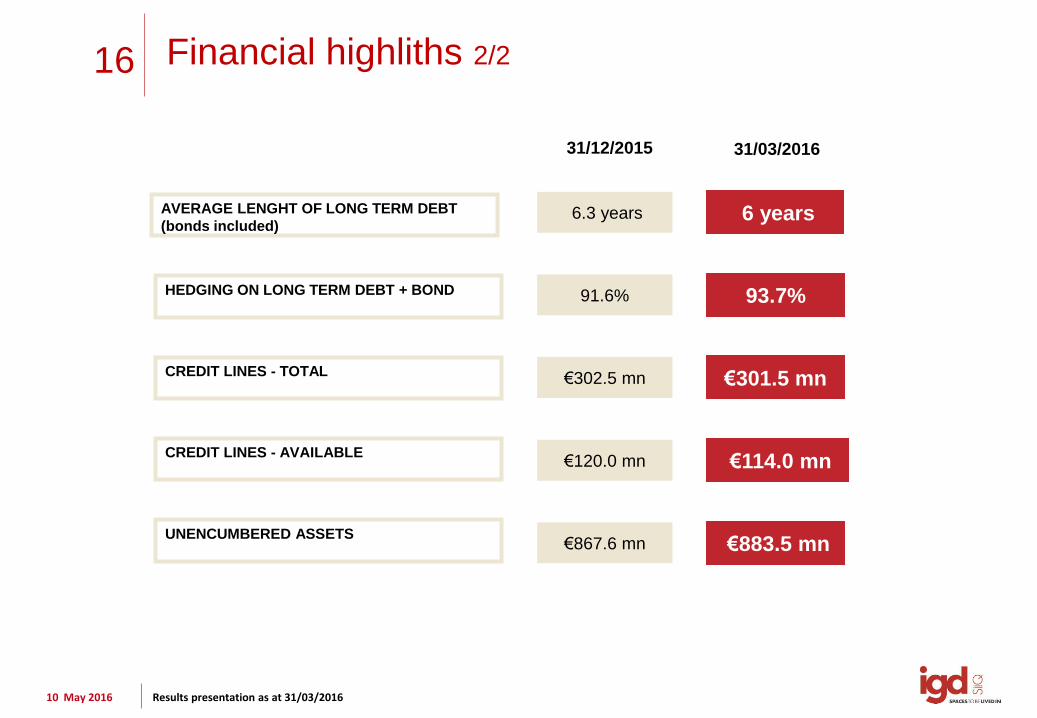
Financial highliths 2/2
HEDGING ON LONG TERM DEBT + BOND 93.7%
€302.5 mn €301.5 mn CREDIT LINES - TOTAL
€120.0 mn €114.0 mn CREDIT LINES - AVAILABLE
€867.6 mn €883.5 mn UNENCUMBERED ASSETS
91.6%
31/12/2015 31/03/2016
AVERAGE LENGHT OF LONG TERM DEBT
(bonds included) 6.3 years 6 years
2016-2018 Business Plan update presentation
18
10 May 2016 2016-2018 Business Plan update presentation
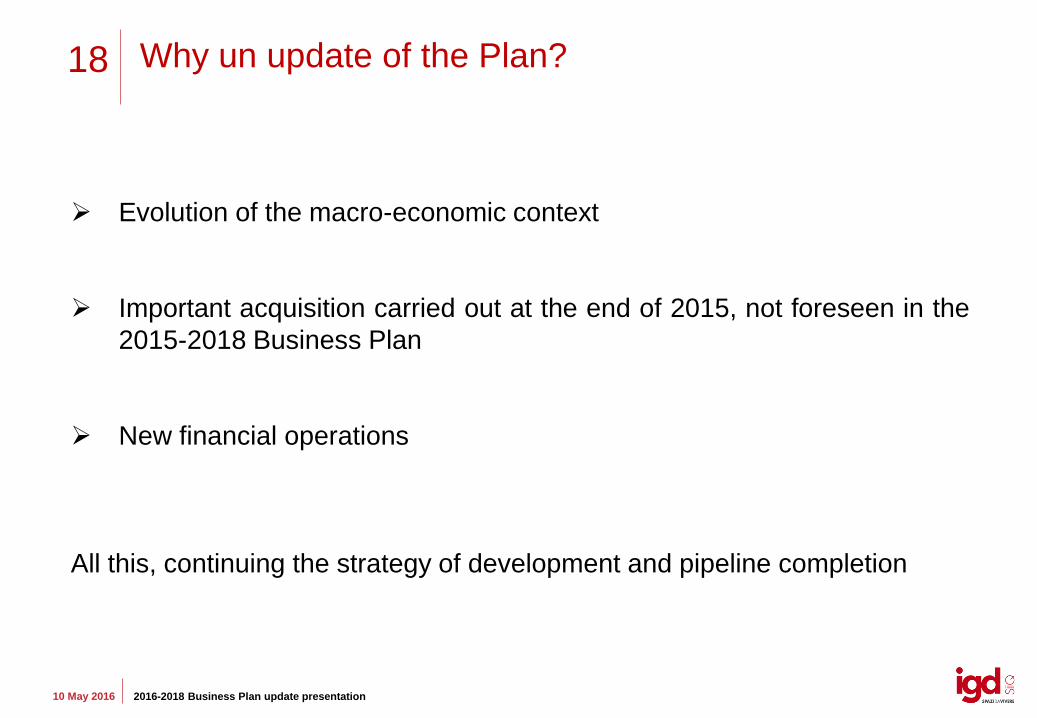
Why un update of the Plan?
Evolution of the macro-economic context
Important acquisition carried out at the end of 2015, not foreseen in the
2015-2018 Business Plan
New financial operations
All this, continuing the strategy of development and pipeline completion

19
10 May 2016 2016-2018 Business Plan update presentation
70.0
75.0
80.0
85.0
90.0
95.0
100.0
105.0
110.0
115.0
120.0
2010 2011 2012 2013 2014 2015 2016
Consumers confidence index Business confidence index
1.5%
-1.1%
-5.5%
1.7%
0.6%
-2.8%
-1.7%
-0.3%
0.8%1.2% 1.3% 1.3%
-6.0%
-5.0%
-4.0%
-3.0%
-2.0%
-1.0%
0.0%
1.0%
2.0%
3.0%
2007 2008 2009 2010 2011 2012 2013 2014 2015 2016e 2017e 2018e
After a long period of crises that lasted almost 7 years, a wide range panel of institutions and research companies agrees on positive forecasts for 2016 and following years (average GDP growth of 1.2% - 1.3%)
GDP trend (change %) Consumers and business confidence index
Source: Eurostat data compiled by IGD Source: Istat data compiled by IGD
The key component supporting GDP growth is represented by domestic consumption (yearly growth forecast above 1% during BP timespan)
Introduction – Italian context
Unemployment is declining (March 2016)
20
10 May 2016 2016-2018 Business Plan update presentation
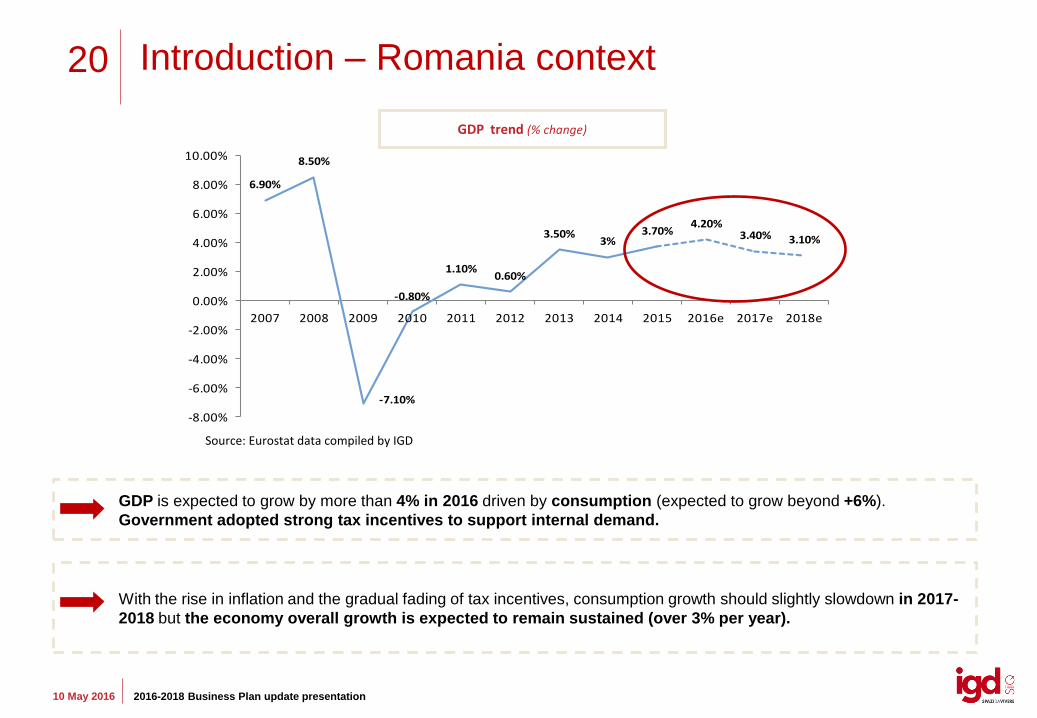
6.90%
8.50%
-7.10%
-0.80%
1.10%0.60%
3.50%3%
3.70%4.20%
3.40% 3.10%
-8.00%
-6.00%
-4.00%
-2.00%
0.00%
2.00%
4.00%
6.00%
8.00%
10.00%
2007 2008 2009 2010 2011 2012 2013 2014 2015 2016e 2017e 2018e
GDP trend (% change)
Source: Eurostat data compiled by IGD
GDP is expected to grow by more than 4% in 2016 driven by consumption (expected to grow beyond +6%).
Government adopted strong tax incentives to support internal demand.
With the rise in inflation and the gradual fading of tax incentives, consumption growth should slightly slowdown in 2017-
2018 but the economy overall growth is expected to remain sustained (over 3% per year).
Introduction – Romania context
21
10 May 2016 2016-2018 Business Plan update presentation
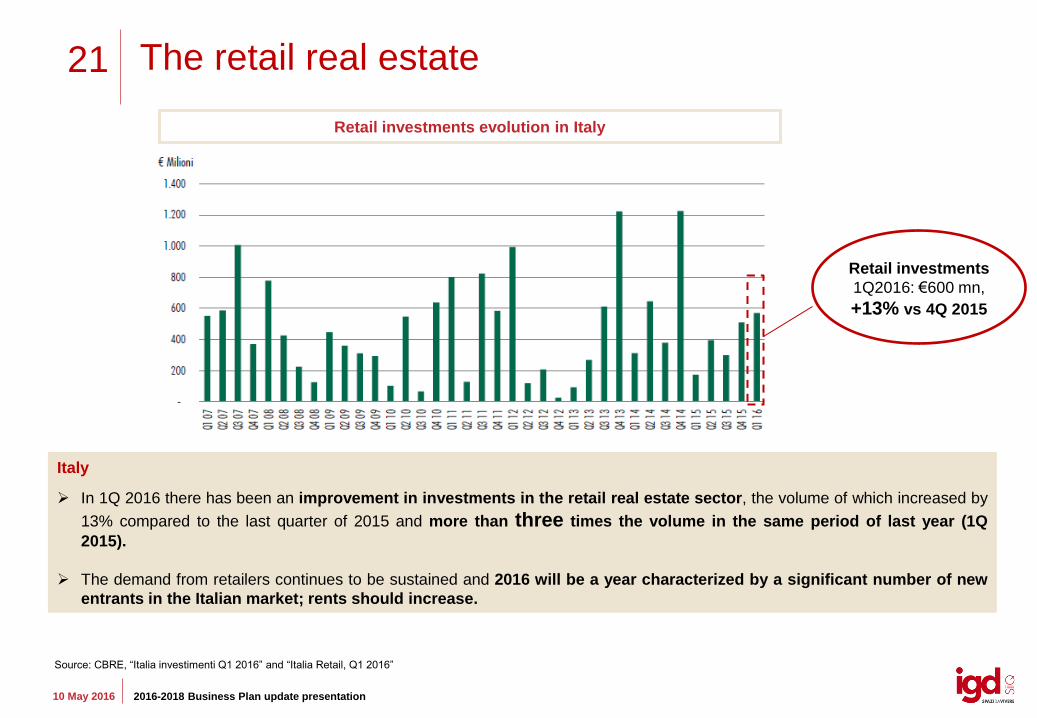
Italy
In 1Q 2016 there has been an improvement in investments in the retail real estate sector, the volume of which increased by
13% compared to the last quarter of 2015 and more than three times the volume in the same period of last year (1Q
2015).
The demand from retailers continues to be sustained and 2016 will be a year characterized by a significant number of new
entrants in the Italian market; rents should increase.
Retail investments evolution in Italy
Retail investments
1Q2016: €600 mn,
+13% vs 4Q 2015
Source: CBRE, “Italia investimenti Q1 2016” and “Italia Retail, Q1 2016”
The retail real estate
22
10 May 2016 2016-2018 Business Plan update presentation
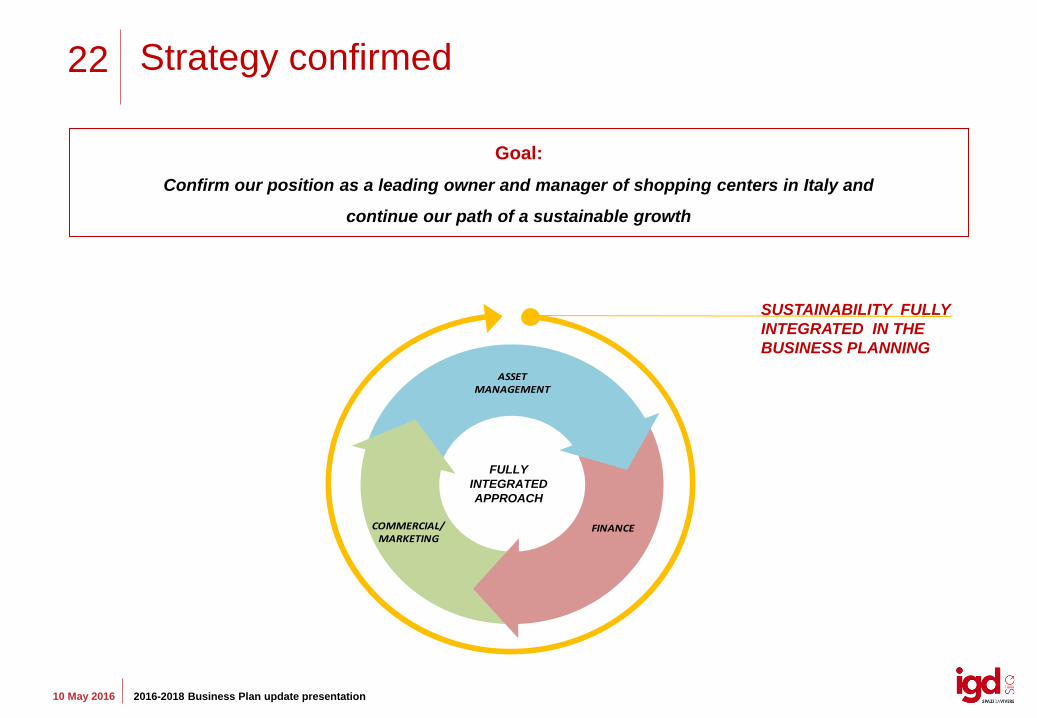
Goal:
Confirm our position as a leading owner and manager of shopping centers in Italy and
continue our path of a sustainable growth
Strategy confirmed
SUSTAINABILITY FULLY
INTEGRATED IN THE
BUSINESS PLANNING
FULLY
INTEGRATED
APPROACH
ASSET MANAGEMENT
FINANCECOMMERCIAL/MARKETING
23
10 May 2016 2016-2018 Business Plan update presentation
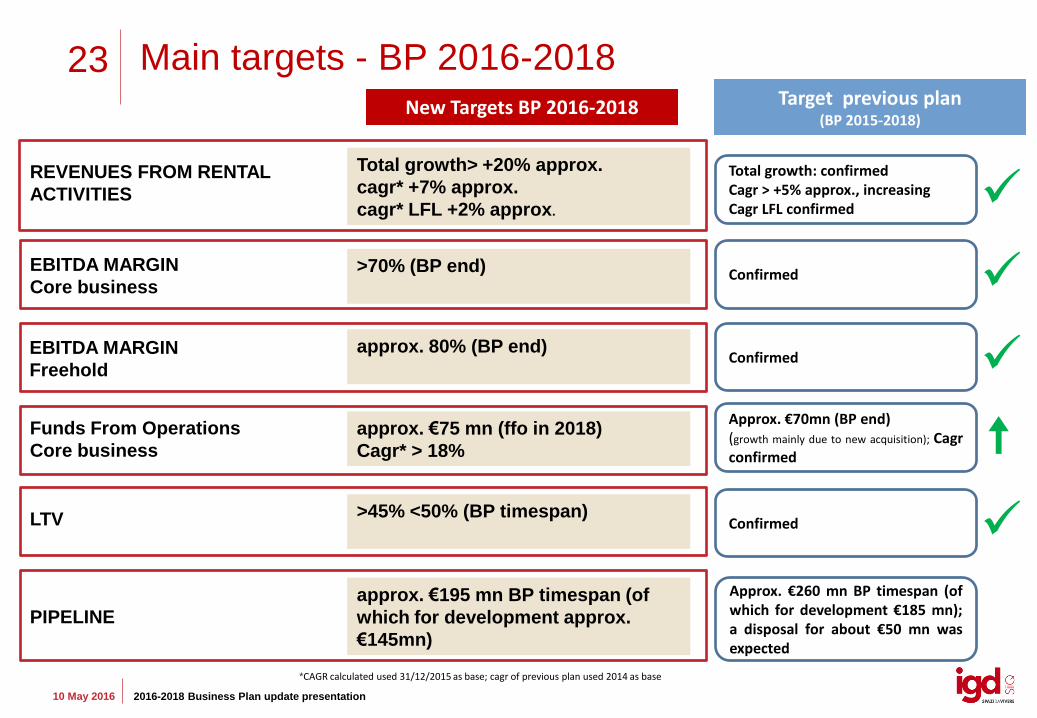
*CAGR calculated used 31/12/2015 as base; cagr of previous plan used 2014 as base
REVENUES FROM RENTAL
ACTIVITIES
Total growth> +20% approx.
cagr* +7% approx.
cagr* LFL +2% approx.
>70% (BP end)
EBITDA MARGIN
Core business
PIPELINE
approx. €195 mn BP timespan (of
which for development approx.
€145mn)
LTV
>45% <50% (BP timespan)
Funds From Operations
Core business
approx. €75 mn (ffo in 2018)
Cagr* > 18%
approx. 80% (BP end)
EBITDA MARGIN
Freehold
Target previous plan (BP 2015-2018)
Total growth: confirmed Cagr > +5% approx., increasing Cagr LFL confirmed
Confirmed
Confirmed
Approx. €70mn (BP end) (growth mainly due to new acquisition); Cagr confirmed
Confirmed
Approx. €260 mn BP timespan (of which for development €185 mn); a disposal for about €50 mn was expected
Main targets - BP 2016-2018
New Targets BP 2016-2018

24
10 May 2016 2016-2018 Business Plan update presentation
ITALY
• Occupancy increase (about 1 percentage point with evidence already from 2016) and constant decrease of
temporary reductions
• Contribution for the whole year of the assets acquired/opened in 2015 (Puntadiferro and Clodì)
• Development of revenues from new openings (Grosseto, ESP extension and Officine Storiche in
particular)
• Expected upside over BP timespan, based on the expiration agenda at the end of 2015
Assumptions on Italian and Romanian revenues
ROMANIA
• Macroeconomic outlook confirms a recovery trend with a positive impact expected on consumption and
assets commercial performances
• Completion of the modernization pipeline with a focus on commercial investments and energy efficiency
• Occupancy maximisation (target: bring occupancy in line with Italy)
• Expected upside over BP timespan, based on the expiration agenda at the end of 2015
25
10 May 2016 2016-2018 Business Plan update presentation
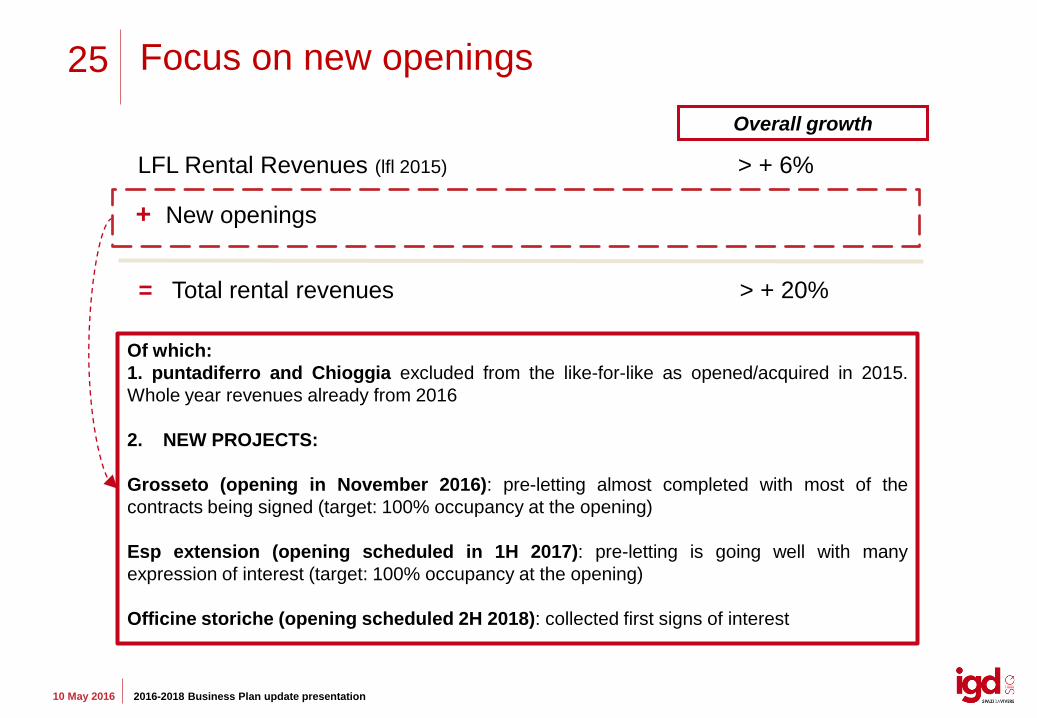
Focus on new openings
Of which:
1. puntadiferro and Chioggia excluded from the like-for-like as opened/acquired in 2015.
Whole year revenues already from 2016
2. NEW PROJECTS:
Grosseto (opening in November 2016): pre-letting almost completed with most of the
contracts being signed (target: 100% occupancy at the opening)
Esp extension (opening scheduled in 1H 2017): pre-letting is going well with many
expression of interest (target: 100% occupancy at the opening)
Officine storiche (opening scheduled 2H 2018): collected first signs of interest
LFL Rental Revenues (lfl 2015) > + 6%
Overall growth
+ New openings
= Total rental revenues > + 20%
26
10 May 2016 2016-2018 Business Plan update presentation
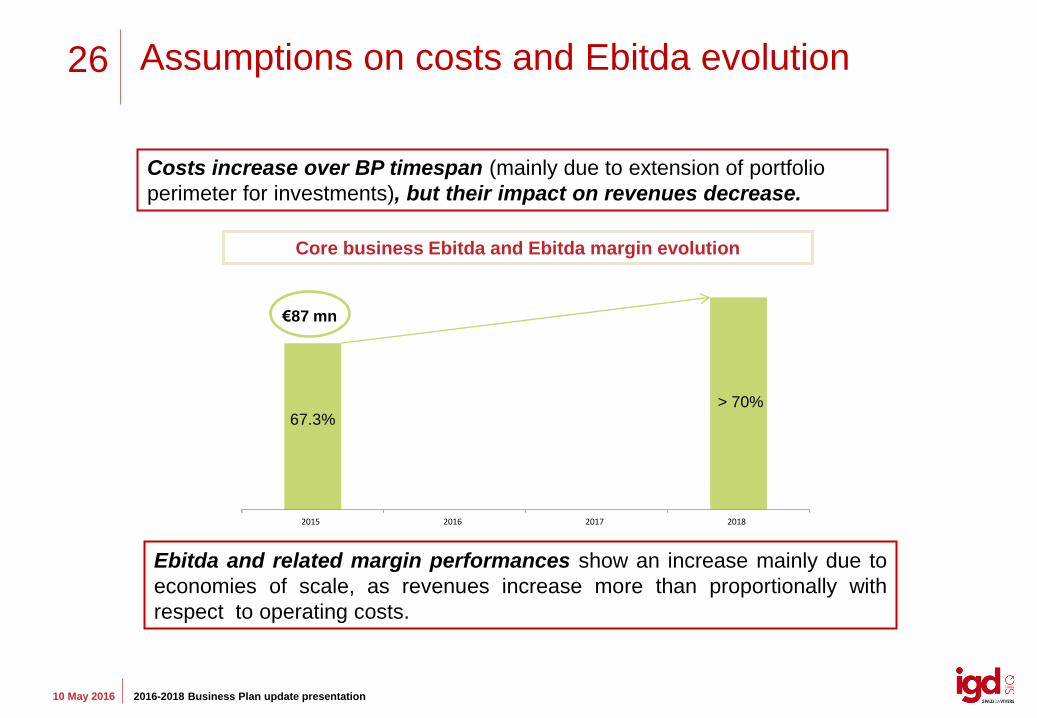
Assumptions on costs and Ebitda evolution
Costs increase over BP timespan (mainly due to extension of portfolio
perimeter for investments), but their impact on revenues decrease.
Ebitda and related margin performances show an increase mainly due to
economies of scale, as revenues increase more than proportionally with
respect to operating costs.
Core business Ebitda and Ebitda margin evolution
67.3% > 70%
2015 2016 2017 2018
€87 mn
27
10 May 2016 2016-2018 Business Plan update presentation
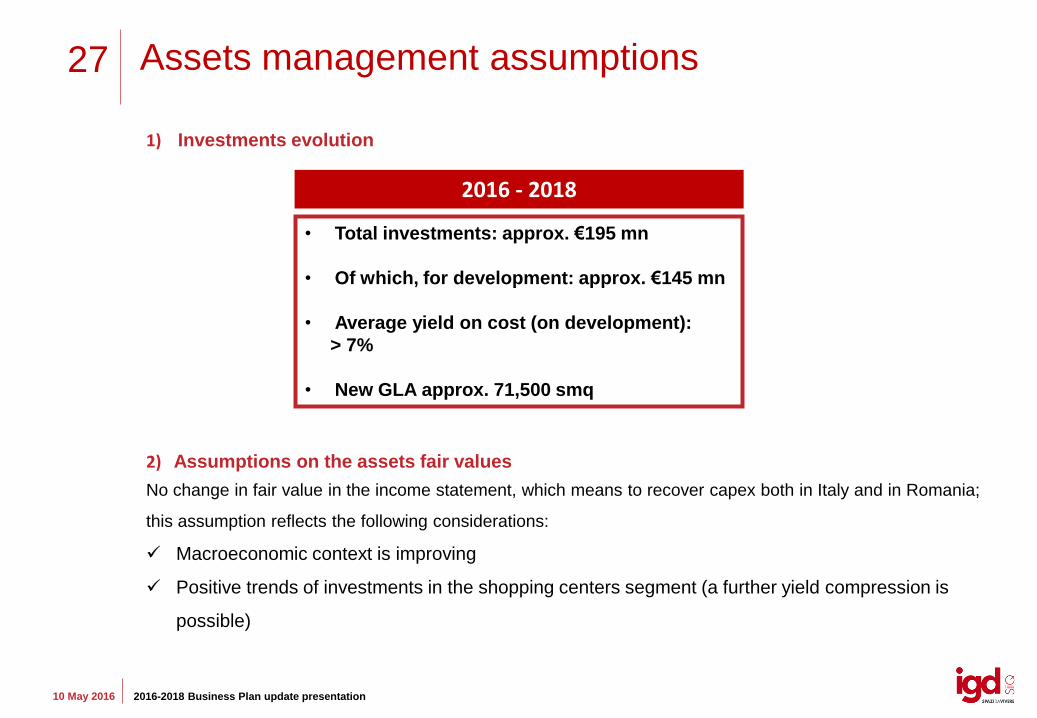
2) Assumptions on the assets fair values
No change in fair value in the income statement, which means to recover capex both in Italy and in Romania;
this assumption reflects the following considerations:
Macroeconomic context is improving
Positive trends of investments in the shopping centers segment (a further yield compression is
possible)
Assets management assumptions
• Total investments: approx. €195 mn
• Of which, for development: approx. €145 mn
• Average yield on cost (on development):
> 7%
• New GLA approx. 71,500 smq
2016 - 2018
1) Investments evolution
28
10 May 2016 2016-2018 Business Plan update presentation
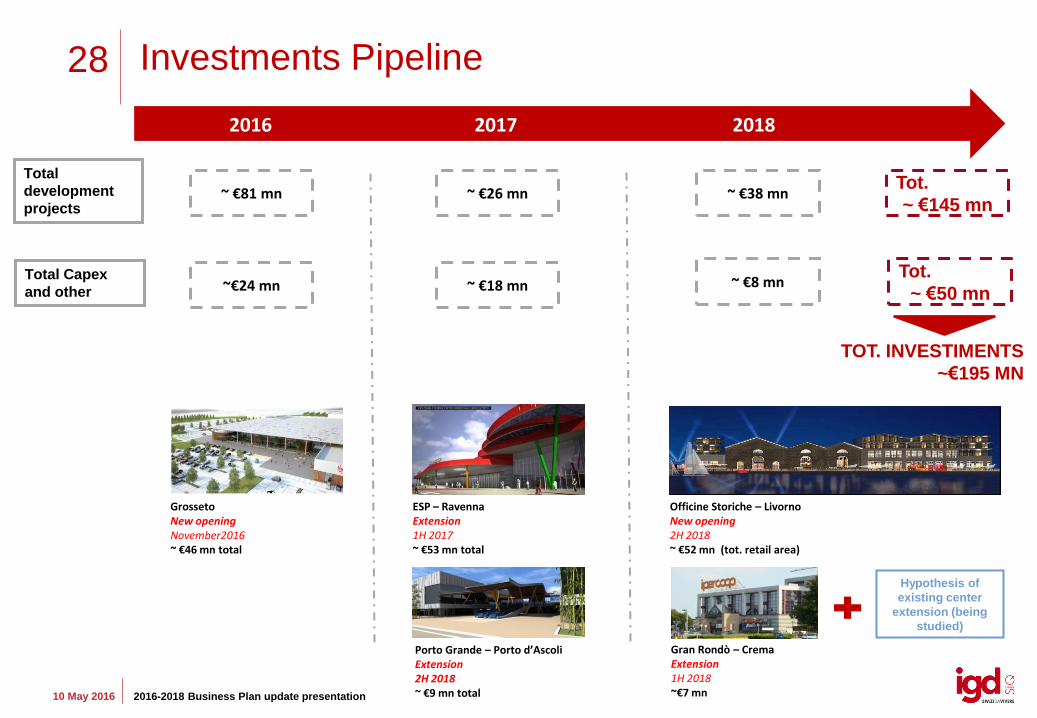
Investments Pipeline
2016 2017 2018
Grosseto New opening November2016 ~ €46 mn total
Gran Rondò – Crema Extension 1H 2018 ~€7 mn
ESP – Ravenna Extension 1H 2017 ~ €53 mn total
Officine Storiche – Livorno New opening 2H 2018 ~ €52 mn (tot. retail area)
Porto Grande – Porto d’Ascoli Extension 2H 2018 ~ €9 mn total
Total
development
projects
Total Capex
and other
~ €81 mn ~ €26 mn ~ €38 mn
~€24 mn ~ €18 mn ~ €8 mn
Tot.
~ €145 mn
Tot.
~ €50 mn
TOT. INVESTIMENTS
~€195 MN
Hypothesis of
existing center
extension (being
studied)
29
10 May 2016 2016-2018 Business Plan update presentation
• Maintain a strict financial discipline and a balanced capital structure
LTV > 45% - < 50% (BP timespan) with the expectation to reach the low end of the range in 2018
GEARING (D/E) < 1 (BP timespan)
• Improve the financial management result and reduce the average cost of debt
ICR > 3 (BP end)
Average cost of debt < 3% (BP end)
• Obtain a rating over the BP timespan, with a primary agency.
• Issue of unsecured senior bond 5-7 years in 2016 with an expected cost lower than the current Group’s
cost of debt.
• Option execise for CMBS early repayment (€135mn, cost approx. 5.2%)
Financial area
Targets confirmed with respect to the previous plan
Main assumptions
30
10 May 2016 Results presentation as at 31/03/2016
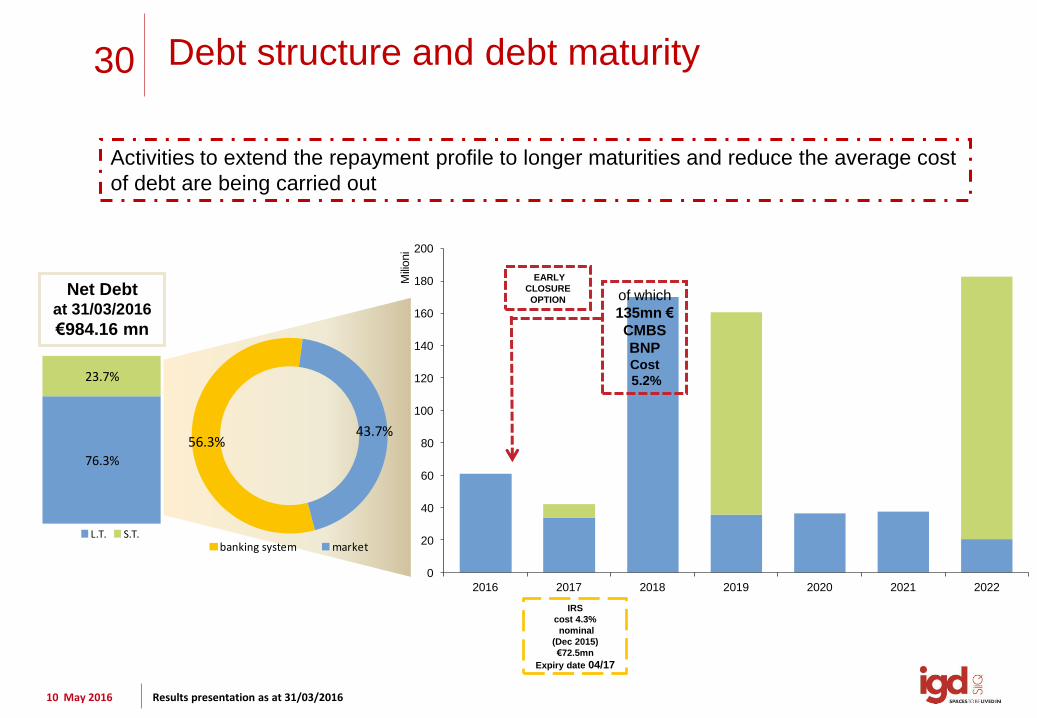
Debt structure and debt maturity
Net Debt at 31/03/2016
€984.16 mn
0
20
40
60
80
100
120
140
160
180
200
2016 2017 2018 2019 2020 2021 2022
Mili
oni
of which
135mn €
CMBS
BNP Cost
5.2%
EARLY
CLOSURE
OPTION
IRS
cost 4.3%
nominal
(Dec 2015)
€72.5mn
Expiry date 04/17
76.3%
23.7%
L.T. S.T.
Activities to extend the repayment profile to longer maturities and reduce the average cost
of debt are being carried out
56.3%43.7%
banking system market
31
10 May 2016 2016-2018 Business Plan update presentation
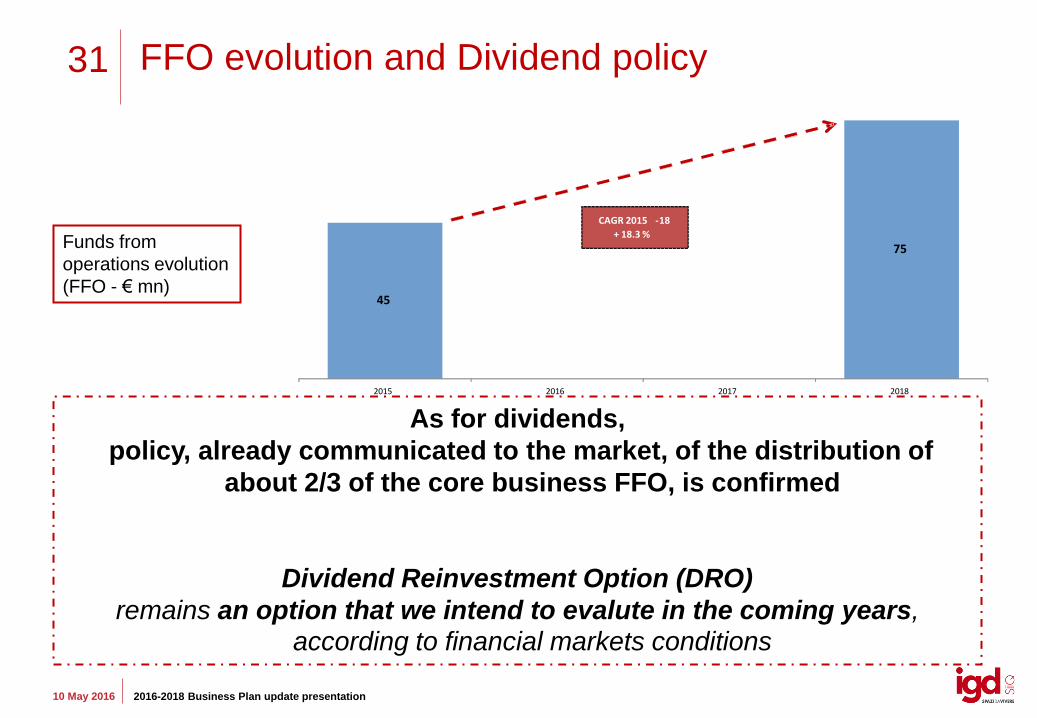
FFO evolution and Dividend policy
Funds from
operations evolution
(FFO - € mn)
As for dividends,
policy, already communicated to the market, of the distribution of
about 2/3 of the core business FFO, is confirmed
Dividend Reinvestment Option (DRO)
remains an option that we intend to evalute in the coming years, according to financial markets conditions
45
75
2015 2016 2017 2018
CAGR 2015 - 18
+ 18.3 %
32
10 May 2016 2016-2018 Business Plan update presentation
The updated Business Plan, that has a low execution risk,
confirms IGD’s ability to increase FFOs and
strenghten visibility of the dividends that will be distributed.
Following Punta di Ferro acquisition, not foreseen in the previous Plan, FFO target has
been further improved.
Final remarks
Therefore:
Confirmation of strategy of organic development pipeline completion
and
Possibility to evaluate any further external growth options that would
be accreative for our shareholders

BP 2016-2020
Appendix
34
10 May 2016 2016-2018 Business Plan update presentation
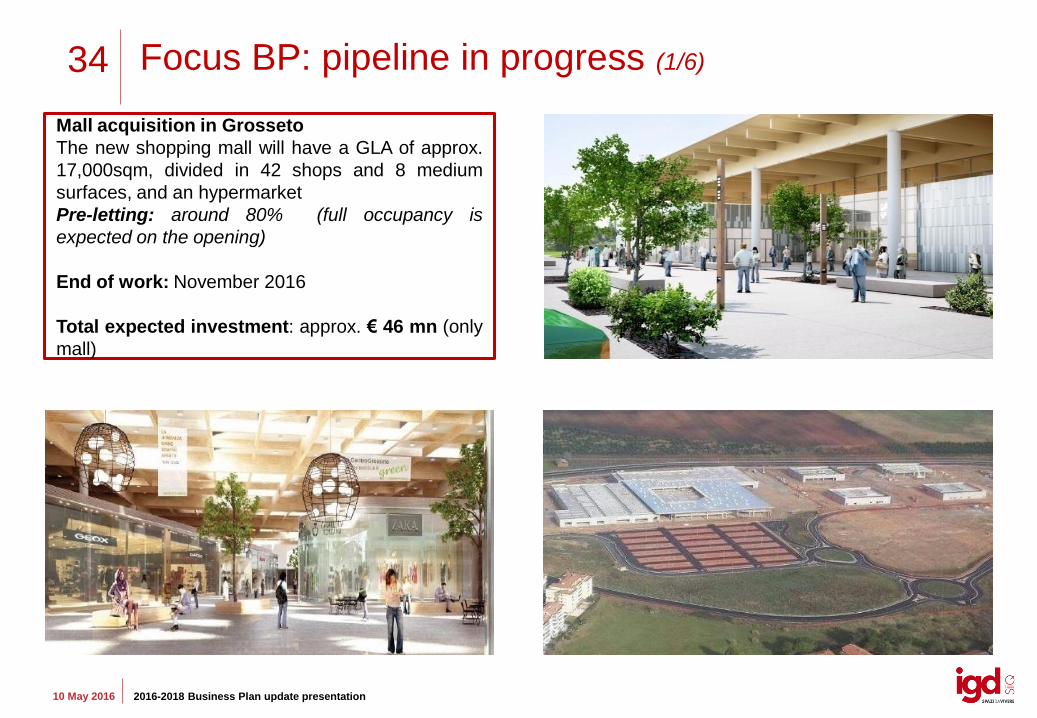
Mall acquisition in Grosseto
The new shopping mall will have a GLA of approx.
17,000sqm, divided in 42 shops and 8 medium
surfaces, and an hypermarket.
Pre-letting: around 80% (full occupancy is
expected on the opening)
End of work: November 2016
Total expected investment: approx. € 46 mn (only
mall)
Focus BP: pipeline in progress (1/6)
35
10 May 2016 2016-2018 Business Plan update presentation
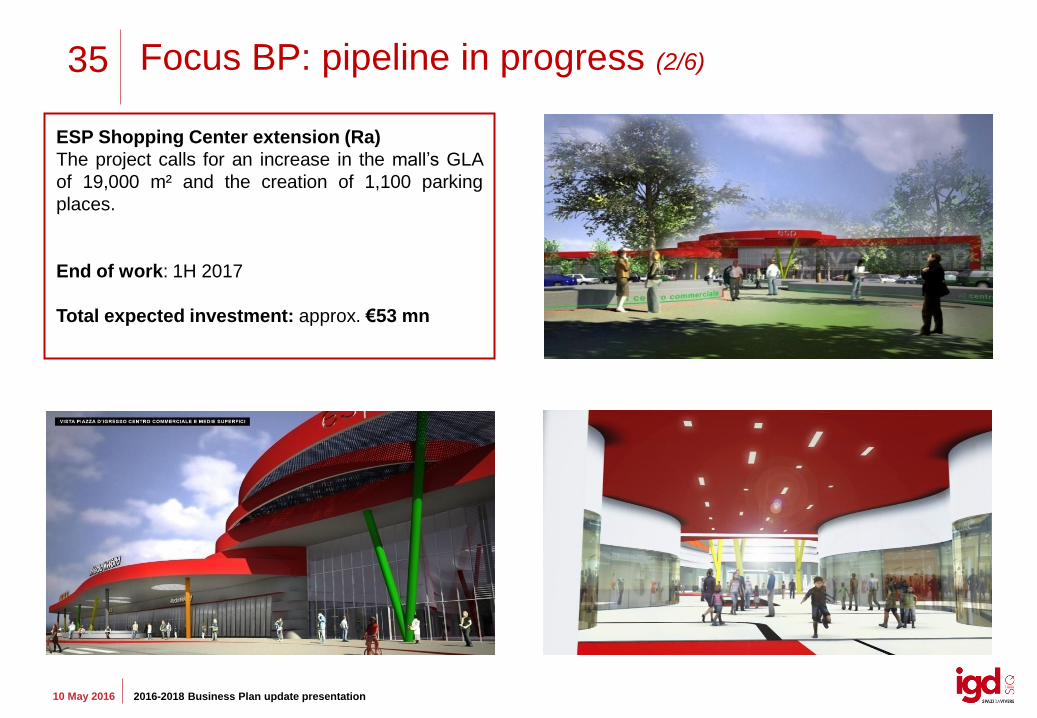
ESP Shopping Center extension (Ra)
The project calls for an increase in the mall’s GLA
of 19,000 m² and the creation of 1,100 parking
places.
End of work: 1H 2017
Total expected investment: approx. €53 mn
Focus BP: pipeline in progress (2/6)

36
10 May 2016 2016-2018 Business Plan update presentation
Opening of the Mall Officine Storiche - Livorno
Requalification of the industrial warehouses of the
former Cantieri Navali Orlando inside of which vast
reception facilities and accommodations will be
created housing personal services (fitness centers,
leisure time activities, restaurants, etc), in addition
to the completion of the shops and services already
present in Piazza Mazzini.
End of work: 1H 2018
Total expected investment: approx. €52 mn
Focus BP: pipeline in progress (3/6)

37
10 May 2016 2016-2018 Business Plan update presentation
Gran rondo’ - Extension and restyling
The project calls for an extension with the creation
of a new medium surface area, with a total GLA of
around 2,850 sqm and the complete restyling of the
shopping mall.
End of work: 1H 2018
Total expected investment: approx €7 mn
Porto Grande extension
The urban planning is underway with the
municipality.
The extension calls for 2 new medium surface
areas covering 5,000 m², in addition to green areas
of 1,700 m² of and a new parking lot of 10,531 m².
End of work: 2H 2018
Total expected investment approx. €9 mn
Focus BP: pipeline in progress (4/6)
38
10 May 2016 2016-2018 Business Plan update presentation
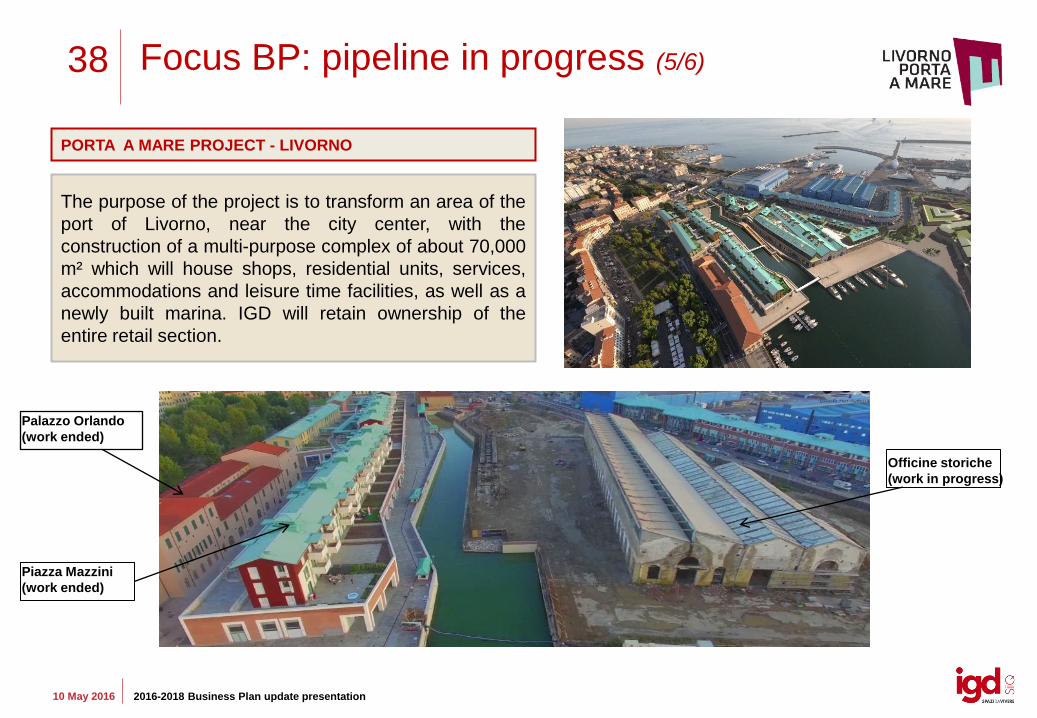
The purpose of the project is to transform an area of the
port of Livorno, near the city center, with the
construction of a multi-purpose complex of about 70,000
m² which will house shops, residential units, services,
accommodations and leisure time facilities, as well as a
newly built marina. IGD will retain ownership of the
entire retail section.
PORTA A MARE PROJECT - LIVORNO
Focus BP: pipeline in progress (5/6)
Officine storiche
(work in progress)
Palazzo Orlando
(work ended)
Piazza Mazzini
(work ended)

FY 2009 RESULTS
Bologna November 11, 2011
1Q 2016
Appendix
40
10 May 2016 Results presentation as at 31/03/2016
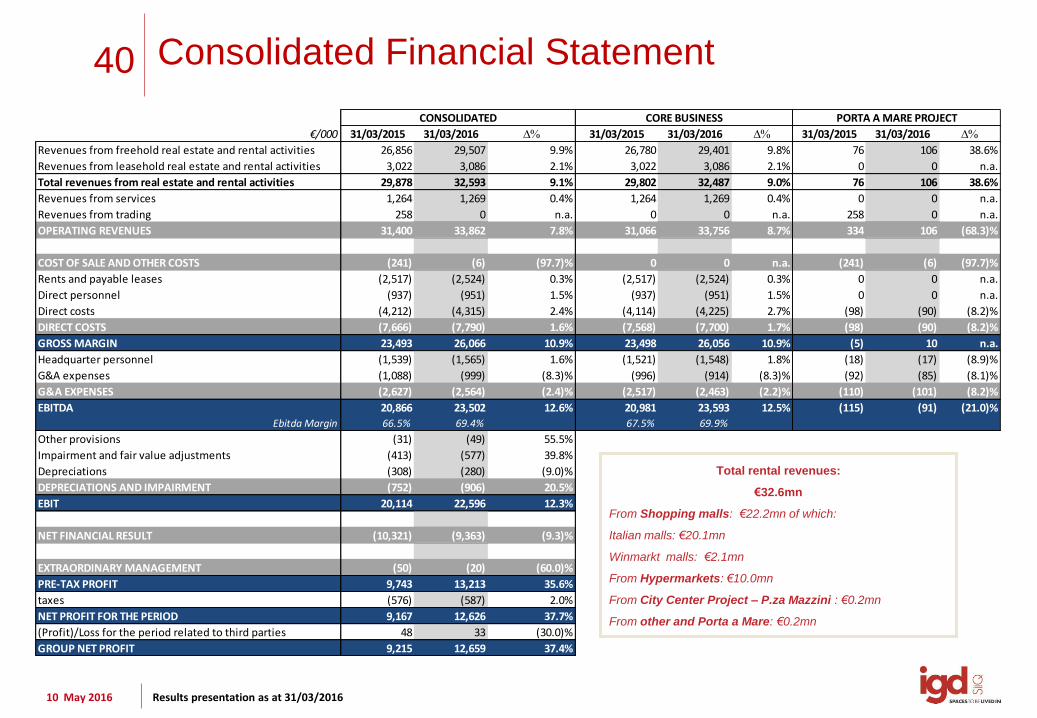
€/000 31/03/2015 31/03/2016 D% 31/03/2015 31/03/2016 D% 31/03/2015 31/03/2016 D%
Revenues from freehold real estate and rental activities 26,856 29,507 9.9% 26,780 29,401 9.8% 76 106 38.6%
Revenues from leasehold real estate and rental activities 3,022 3,086 2.1% 3,022 3,086 2.1% 0 0 n.a.
Total revenues from real estate and rental activities 29,878 32,593 9.1% 29,802 32,487 9.0% 76 106 38.6%
Revenues from services 1,264 1,269 0.4% 1,264 1,269 0.4% 0 0 n.a.
Revenues from trading 258 0 n.a. 0 0 n.a. 258 0 n.a.
OPERATING REVENUES 31,400 33,862 7.8% 31,066 33,756 8.7% 334 106 (68.3)%
COST OF SALE AND OTHER COSTS (241) (6) (97.7)% 0 0 n.a. (241) (6) (97.7)%
Rents and payable leases (2,517) (2,524) 0.3% (2,517) (2,524) 0.3% 0 0 n.a.
Direct personnel (937) (951) 1.5% (937) (951) 1.5% 0 0 n.a.
Direct costs (4,212) (4,315) 2.4% (4,114) (4,225) 2.7% (98) (90) (8.2)%
DIRECT COSTS (7,666) (7,790) 1.6% (7,568) (7,700) 1.7% (98) (90) (8.2)%
GROSS MARGIN 23,493 26,066 10.9% 23,498 26,056 10.9% (5) 10 n.a.
Headquarter personnel (1,539) (1,565) 1.6% (1,521) (1,548) 1.8% (18) (17) (8.9)%
G&A expenses (1,088) (999) (8.3)% (996) (914) (8.3)% (92) (85) (8.1)%
G&A EXPENSES (2,627) (2,564) (2.4)% (2,517) (2,463) (2.2)% (110) (101) (8.2)%
EBITDA 20,866 23,502 12.6% 20,981 23,593 12.5% (115) (91) (21.0)%
Ebitda Margin 66.5% 69.4% 67.5% 69.9%
Other provisions (31) (49) 55.5%
Impairment and fair value adjustments (413) (577) 39.8%
Depreciations (308) (280) (9.0)%
DEPRECIATIONS AND IMPAIRMENT (752) (906) 20.5%
EBIT 20,114 22,596 12.3%
NET FINANCIAL RESULT (10,321) (9,363) (9.3)%
EXTRAORDINARY MANAGEMENT (50) (20) (60.0)%
PRE-TAX PROFIT 9,743 13,213 35.6%
taxes (576) (587) 2.0%
NET PROFIT FOR THE PERIOD 9,167 12,626 37.7%
(Profit)/Loss for the period related to third parties 48 33 (30.0)%
GROUP NET PROFIT 9,215 12,659 37.4%
CORE BUSINESS PORTA A MARE PROJECTCONSOLIDATED
Consolidated Financial Statement
Total rental revenues:
€32.6mn
From Shopping malls: €22.2mn of which:
Italian malls: €20.1mn
Winmarkt malls: €2.1mn
From Hypermarkets: €10.0mn
From City Center Project – P.za Mazzini : €0.2mn
From other and Porta a Mare: €0.2mn
41
10 May 2016 Results presentation as at 31/03/2016
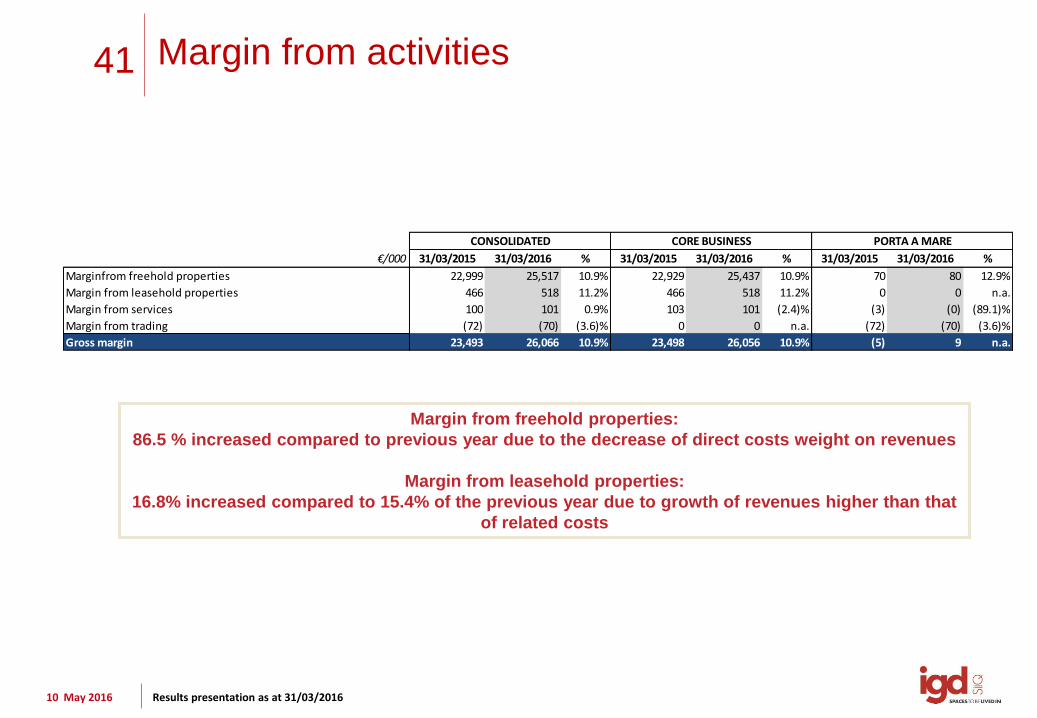
Margin from activities
Margin from freehold properties:
86.5 % increased compared to previous year due to the decrease of direct costs weight on revenues
Margin from leasehold properties:
16.8% increased compared to 15.4% of the previous year due to growth of revenues higher than that
of related costs
€/000 31/03/2015 31/03/2016 % 31/03/2015 31/03/2016 % 31/03/2015 31/03/2016 %
Marginfrom freehold properties 22,999 25,517 10.9% 22,929 25,437 10.9% 70 80 12.9%
Margin from leasehold properties 466 518 11.2% 466 518 11.2% 0 0 n.a.
Margin from services 100 101 0.9% 103 101 (2.4)% (3) (0) (89.1)%
Margin from trading (72) (70) (3.6)% 0 0 n.a. (72) (70) (3.6)%
Gross margin 23,493 26,066 10.9% 23,498 26,056 10.9% (5) 9 n.a.
CONSOLIDATED CORE BUSINESS PORTA A MARE
42
10 May 2016 Results presentation as at 31/03/2016
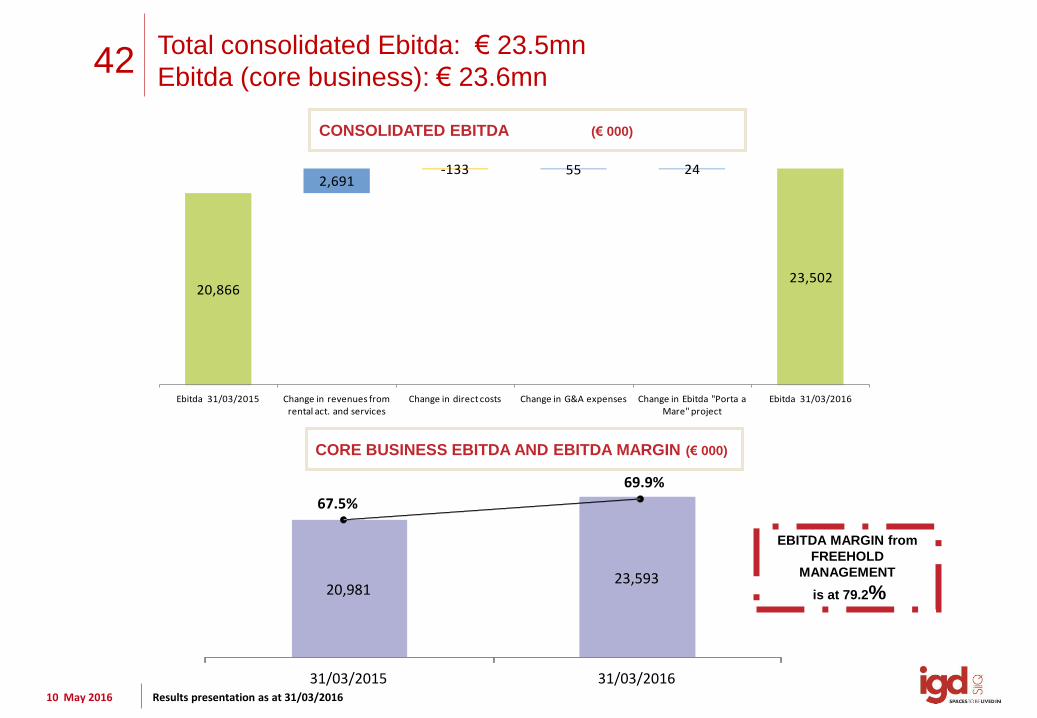
20,981 23,593
31/03/2015 31/03/2016
67.5%
69.9%
Total consolidated Ebitda: € 23.5mn
Ebitda (core business): € 23.6mn
CONSOLIDATED EBITDA (€ 000)
CORE BUSINESS EBITDA AND EBITDA MARGIN (€ 000)
EBITDA MARGIN from
FREEHOLD
MANAGEMENT
is at 79.2%
20,866
2,691-133 55 24
23,502
Ebitda 31/03/2015 Change in revenues from rental act. and services
Change in direct costs Change in G&A expenses Change in Ebitda "Porta a Mare" project
Ebitda 31/03/2016

43
10 May 2016 Results presentation as at 31/03/2016
9.1%12.7% 13.9%
22.2%
14.8%
27.2%
12.0% 8.0%4.0%
76.0%
0%
10%
20%
30%
40%
50%
60%
70%
80%
>1Q2016 2017 2018 2019 2020 >2020
Malls Hyper/Supermarkets
29.7%31.7%
18.9%
8.5%5.6% 5.8%
16.6%
22.8%
16.6%
9.6%
14.7%
20.0%
0%
5%
10%
15%
20%
25%
30%
35%
>1Q2016 2017 2018 2019 2020 >2020
No. of contracts rent value
Contracts in Italy and Romania EXPIRY DATE OF HYPERMARKETS AND MALLS
CONTRACTS ITALY (% no. of contracts)
ITALY (total malls contracts 1142)
In the first three months of 2016, 52 contracts were
signed of which 23 were turnover and 29 renewals
Renewals with upside equal to +1.9%
ROMANIA (Total no. of contracts 556)
In the first three months of 2016, 77 contracts were
renewed (upside +1.4%) and 77 new contracts
were signed. (Renewals and new contracts of the first quarter of 2016
represent 6% and 8% of Winmarkt total revenues)
EXPIRY DATE OF HYPERMARKETS AND MALLS
CONTRACTS ITALY ( % of value)
N 159
N 254
N 169
N 19
N 31 N 32
N 47
N 176
EXPIRY DATE OF MALL CONTRACTS ROMANIA (no. and % of
contracts and % of value)
N 311
N 1
N 105
N 165
10.8% 10.8%13.6%
17.6%12.0%
35.2%
15.4%11.0%
6.2%
67.4%
0%
10%
20%
30%
40%
50%
60%
70%
>1Q2016 2017 2018 2019 2020 >2020
Malls Hyper/Supermarkets
N 2 N 3
N 104 N 145

44
10 May 2016 Results presentation as at 31/03/2016
Net Debt
NET DEBT EVOLUTION
984,815
-12.659 -858 10,100 -2.561 3,378 1,947
984,162
Net Debt 31/12/2015 Profit for the period attributable to the Parent company
Depreciations/Devaluations/Change in FV
Change in NWC (net of PM writedowns)
Change in other non assets and derivative instruments
Change in fixed/non-fixed assets Change in shareholders' equity Net Debt 31/03/2016
ww
w.g
rup
po
igd
.it
Claudia Contarini, IR
T. +39. 051 509213
Federica Pivetti
T. +39. 051 509242