1Q 2018 Earnings Call l 13 Apr 2018 -...
30
1 Digi.Com Berhad (425190-X) 1Q 2018 Earnings Call l 13 Apr 2018
Transcript of 1Q 2018 Earnings Call l 13 Apr 2018 -...

1
Digi.Com Berhad (425190-X)
1Q 2018 Earnings Call l 13 Apr 2018

2
Key Highlights
Operational & Performance
Review
2018 Outlook
Q&A
3
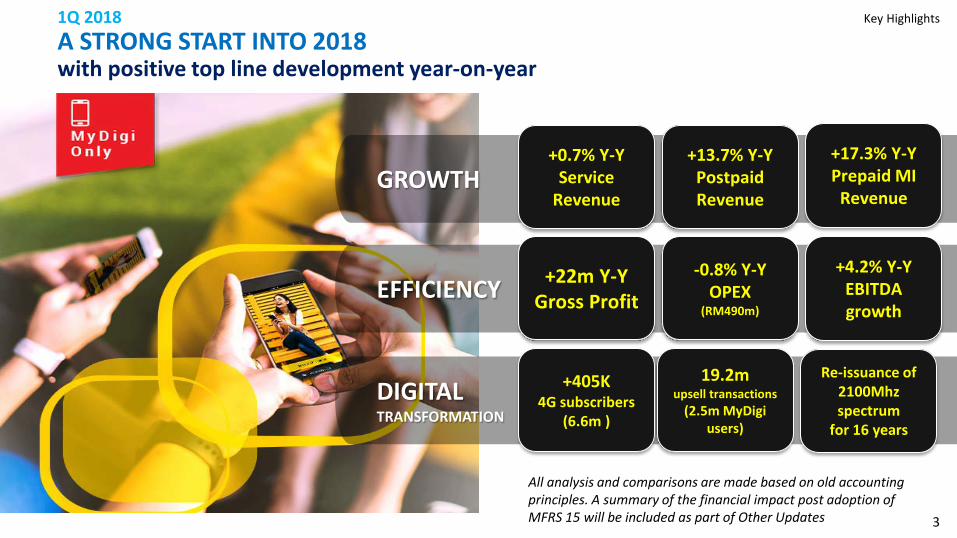
1Q 2018 A STRONG START INTO 2018 with positive top line development year-on-year
Key Highlights
GROWTH
EFFICIENCY
DIGITAL TRANSFORMATION
+4.2% Y-Y EBITDA growth
+0.7% Y-Y Service
Revenue
+22m Y-Y Gross Profit
+17.3% Y-Y Prepaid MI
Revenue
+13.7% Y-Y Postpaid Revenue
-0.8% Y-Y OPEX
(RM490m)
Re-issuance of 2100Mhz spectrum
for 16 years
+405K 4G subscribers
(6.6m )
19.2m upsell transactions
(2.5m MyDigi users)
All analysis and comparisons are made based on old accounting principles. A summary of the financial impact post adoption of MFRS 15 will be included as part of Other Updates
4
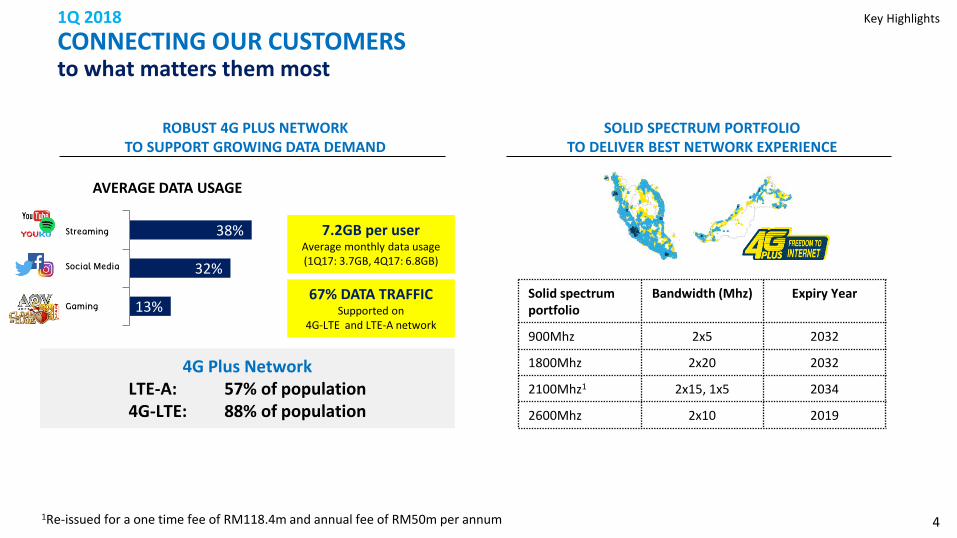
1Q 2018 CONNECTING OUR CUSTOMERS to what matters them most
Key Highlights
1Re-issued for a one time fee of RM118.4m and annual fee of RM50m per annum
13%
32%
38%
AVERAGE DATA USAGE
7.2GB per user Average monthly data usage (1Q17: 3.7GB, 4Q17: 6.8GB)
67% DATA TRAFFIC Supported on
4G-LTE and LTE-A network
ROBUST 4G PLUS NETWORK TO SUPPORT GROWING DATA DEMAND
SOLID SPECTRUM PORTFOLIO TO DELIVER BEST NETWORK EXPERIENCE
Solid spectrum portfolio
Bandwidth (Mhz) Expiry Year
900Mhz 2x5 2032
1800Mhz 2x20 2032
2100Mhz1 2x15, 1x5 2034
2600Mhz 2x10 2019
4G Plus Network LTE-A: 57% of population 4G-LTE: 88% of population
Gaming
Social Media
Streaming

5
1Q 2018 STRONGER MONETISATION FROM INTERNET GROWTH alongside significant increase in 4G subscribers and digital interactions
Key Highlights
621 637 690
747 761
300
350
400
450
500
550
600
650
700
750
800
1Q17 2Q17 3Q17 4Q17 1Q18
1.9% Q-Q AND 22.5% Y-Y INTERNET REVENUE GROWTH
HIGHLY ENGAGED USERS
19.2m upsell transactions
2.5m active MyDigi users
73.2% of 11.8 million subscribers
ACTIVE INTERNET USERS
77.1% or 6.6m 4G subscribers among
smartphone users
GROWING 4G SUBSCRIBERS

6
1Q 2018 SHARPER INTERNET PROPOSITIONS to fuel internet adoption and sustainable revenue growth
Operational Review
Prepaid • Exciting prepaid internet passes with enriched data quotas
to monetise network during non-peak hours • Affordable bite-sized Cili Padi internet passes • Enabled stronger recurring monthly internet plans
subscriptions through biGBonus and SuperTererrr internet plans
Postpaid • Leveraged on Thank You campaign to drive new postpaid
acquisitions, plan upgrades and contract renewals via Digi Postpaid Family plans and device bundles
• Stepped up on monetisation from existing base via RM 10/month all-day internet GBoost upgrade
• Continued prepaid to postpaid conversions with entry level plans
7
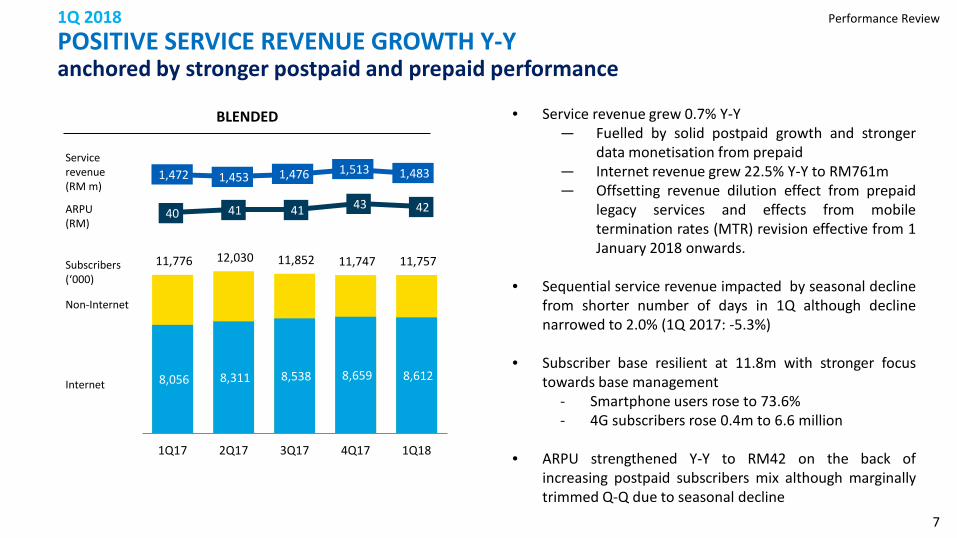
• Service revenue grew 0.7% Y-Y — Fuelled by solid postpaid growth and stronger
data monetisation from prepaid — Internet revenue grew 22.5% Y-Y to RM761m — Offsetting revenue dilution effect from prepaid
legacy services and effects from mobile termination rates (MTR) revision effective from 1 January 2018 onwards.
• Sequential service revenue impacted by seasonal decline
from shorter number of days in 1Q although decline narrowed to 2.0% (1Q 2017: -5.3%)
• Subscriber base resilient at 11.8m with stronger focus towards base management
- Smartphone users rose to 73.6% - 4G subscribers rose 0.4m to 6.6 million
• ARPU strengthened Y-Y to RM42 on the back of
increasing postpaid subscribers mix although marginally trimmed Q-Q due to seasonal decline
11,776 12,030 11,852 11,747 11,757
8,056 8,311 8,538 8,659 8,612
1Q17 2Q17 3Q17 4Q17 1Q18
1,472 1,453 1,476 1,513 1,483
Subscribers (‘000)
Service revenue
(RM m)
40 41 41 43 42 ARPU (RM)
Internet
Non-Internet
1Q 2018 POSITIVE SERVICE REVENUE GROWTH Y-Y anchored by stronger postpaid and prepaid performance
Performance Review
BLENDED

8
• Solid proposition from Digi Postpaid Family plans alongside with innovative GBoost flexibility and Thank You campaign continued to fuel postpaid acquisition momentum
• Healthy net adds of 91K to 2.6m postpaid subscribers, up 17.5% Y-Y and 3.7% Q-Q
• Postpaid revenue rose 13.7% Y-Y and 1.9% Q-Q to RM591m
— Postpaid internet revenue increased 28.7% Y-Y and 5.4% Q-Q to RM368 million
• Postpaid ARPU stood resilient at RM77 over a larger postpaid
subscriber base on the back of strong subscriptions for multi-sims plans and continued prepaid to postpaid conversions
2,189 2,292 2,395 2,480 2,571
1,923 2,038 2,149 2,248 2,256
1Q17 2Q17 3Q17 4Q17 1Q18
520 536 557 580 591
79 78 77 78 77
Subscribers (‘000)
Service revenue
(RM m)
ARPU (RM)
1Q 2018 13.7% Y-Y POSTPAID REVENUE GROWTH underpinned by strong acquisitions and plan upgrades
Performance Review
POSTPAID
Internet
Non-Internet
9
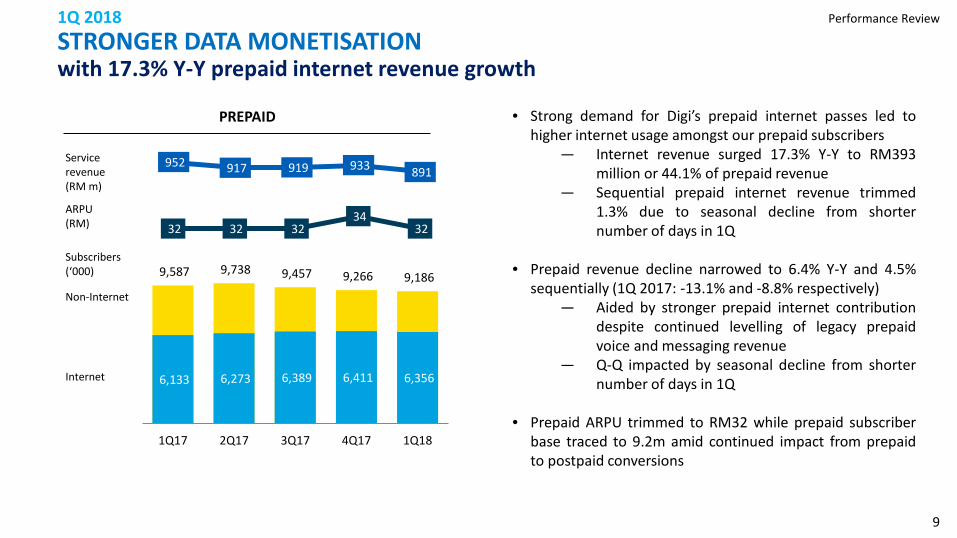
• Strong demand for Digi’s prepaid internet passes led to higher internet usage amongst our prepaid subscribers
— Internet revenue surged 17.3% Y-Y to RM393 million or 44.1% of prepaid revenue
— Sequential prepaid internet revenue trimmed 1.3% due to seasonal decline from shorter number of days in 1Q
• Prepaid revenue decline narrowed to 6.4% Y-Y and 4.5%
sequentially (1Q 2017: -13.1% and -8.8% respectively) — Aided by stronger prepaid internet contribution
despite continued levelling of legacy prepaid voice and messaging revenue
— Q-Q impacted by seasonal decline from shorter number of days in 1Q
• Prepaid ARPU trimmed to RM32 while prepaid subscriber base traced to 9.2m amid continued impact from prepaid to postpaid conversions
9,587 9,738 9,457 9,266 9,186
6,133 6,273 6,389 6,411 6,356
1Q17 2Q17 3Q17 4Q17 1Q18
952 917 919 933 891
32 32 32 34
32
Subscribers (‘000)
Service revenue
(RM m)
ARPU (RM)
Internet
Non-Internet
1Q 2018 STRONGER DATA MONETISATION with 17.3% Y-Y prepaid internet revenue growth
Performance Review
PREPAID
10
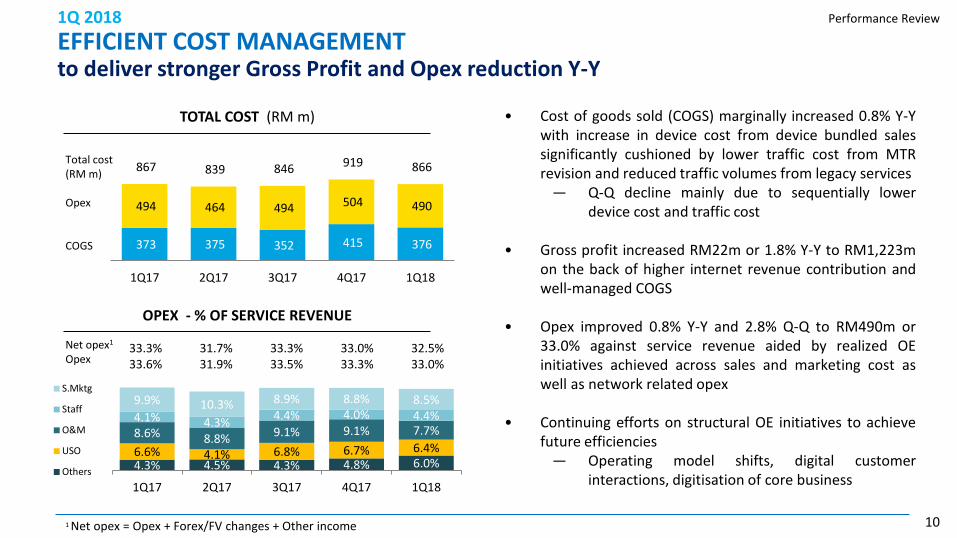
33.3% 31.7% 33.3% 33.0% 32.5% 33.6% 31.9% 33.5% 33.3% 33.0%
373 375 352 415 376
494 464 494 504 490
867 839 846 919 866
1Q17 2Q17 3Q17 4Q17 1Q18
• Cost of goods sold (COGS) marginally increased 0.8% Y-Y with increase in device cost from device bundled sales significantly cushioned by lower traffic cost from MTR revision and reduced traffic volumes from legacy services
— Q-Q decline mainly due to sequentially lower device cost and traffic cost
• Gross profit increased RM22m or 1.8% Y-Y to RM1,223m
on the back of higher internet revenue contribution and well-managed COGS
• Opex improved 0.8% Y-Y and 2.8% Q-Q to RM490m or 33.0% against service revenue aided by realized OE initiatives achieved across sales and marketing cost as well as network related opex
• Continuing efforts on structural OE initiatives to achieve future efficiencies
— Operating model shifts, digital customer interactions, digitisation of core business
1 Net opex = Opex + Forex/FV changes + Other income
Net opex1
Opex
Performance Review
Total cost (RM m) Opex COGS
TOTAL COST (RM m)
OPEX - % OF SERVICE REVENUE
1Q 2018 EFFICIENT COST MANAGEMENT to deliver stronger Gross Profit and Opex reduction Y-Y
6.0% 4.8% 4.3% 4.5% 4.3% 6.4% 6.7% 6.8% 4.1% 6.6%
7.7% 9.1% 9.1% 8.8% 8.6% 4.4% 4.0% 4.4% 4.3% 4.1% 8.5% 8.8% 8.9% 10.3% 9.9%
1Q184Q173Q172Q171Q17
S.Mktg
Staff
O&M
USO
Others

11
711 717 727 731 741
45% 46% 46% 44% 46%
0%20%40%60%80%100%
-
200
400
600
800
1Q17 2Q17 3Q17 4Q17 1Q18
• EBITDA strengthened 4.2% Y-Y and 1.4% Q-Q to RM741m or 46% margin, 1.2pp higher than a year ago
— Supported by resilient service revenue and efficient cost management
• However, PBT and PAT slipped 5.7% and 5.6% Y-Y to
RM481m and RM352m after accounting for higher depreciation cost from progressive capex investments in addition to amortisation from spectrum assets
— Depreciation rose 31.3% Y-Y and 10.0% Q-Q to RM231m million
• PAT margin stood healthy at 22%
373 359 385 360 352
24% 23% 25% 22% 22%
-10%10%30%50%70%90%
- 100 200 300 400 500
1Q17 2Q17 3Q17 4Q17 1Q18
Performance Review 1Q 2018 SOLID EBITDA GROWTH AND HEALTHY MARGIN but PAT trimmed by higher depreciation
EBITDA AND MARGIN (RM m and %)
PAT AND MARGIN (RM m and %)

12
197 229
152 170 181
13% 16% 10% 11% 12%
0%
10%
20%
30%
- 50
100 150 200 250 300
1Q17 2Q17 3Q17 4Q17 1Q18
• Ops cashflow strengthened 8.9% Y-Y to RM560m alongside higher margin of 35% as a result of stronger EBITDA and relatively lower year-on-year capex spend
• Solid network deployment in 2017 set a robust foundation for efficient capex investment of RM181m or 12.2% of service revenue, as planned
— Continued deployment of LTE 900Mhz sites — 4G-LTE and LTE-A network coverage reached 88%
and 57% of population — Over 8,200KM of fiber network nationwide
• Delivered capabilities to support growing data demand and
Y-Y data traffic growth
• Continued to tap on Telenor Group sourcing synergies, operating model shifts and efficient use of spectrum to provide cost levers to deliver competitive infrastructure capabilities sustainably
514 488 575 561 560
33% 31% 37% 34% 35%
0%
10%
20%
30%
40%
50%
(100)
100
300
500
700
1Q17 2Q17 3Q17 4Q17 1Q18
Performance Review 1Q 2018 OPS CASH FLOW STRENGTHENED 8.9% Y-Y backed by stronger EBITDA and efficient capex
OPS CASH FLOW AND MARGIN (RM m and %)
CAPEX (EX-SPECTRUM) AND MARGIN (RM m and % of service revenue)

13
1Q17 2Q17 3Q17 4Q17 1Q18 Total Assets 5,729 5,996 5,869 5,834 6,027
Total Equity 519 513 540 519 669
Interest-bearing debts 2,558 1,810 1,802 1,305 1,302
Islamic debts 0 899 899 1,399 1,398
Cash & cash equivalents 479 628 661 575 461
Payout Ratio
Performance Review
• Earnings per share (EPS) trimmed slightly to 4.5 sen as a flow through from leveled PAT
— EPS uplift of 0.5 sen to 5.0 sen post MFRS 15 adoption
• The Board of Directors declared 1st interim dividend of 4.9
sen per share equivalent to RM381 million, payable to shareholders on 29 June 2018
• Total assets strengthened 5.2% Y-Y and 3.3% Q-Q, mainly
contributed by one-time payment of RM118m for 2100Mhz spectrum as well as recognition of contract assets from the adoption of MFRS 15, alongside progressive capex investments
• Net debt to EBITDA ratio remained healthy at 0.8 times while conventional debt over total asset trimmed to 21%
• Balance sheet continued to demonstrate solid financial capability and flexibility to fund immediate as well as future investments and operational commitments
1Q 2018 HEALTHY SHAREHOLDERS RETURN while sustaining strong balance sheet
EPS AND DPS (sen)
BALANCE SHEET (RM m)
4.7 4.6 4.9 4.6 4.9
4.8 4.6 5.0 4.6 4.5
5.0 98% 100% 99% 99% 98%
50%
60%
70%
80%
90%
100%
110%
1Q17 2Q17 3Q17 4Q17 1Q18
DPS EPS (Pre MFRS-15) EPS (Post MFRS-15)

14
Other Updates 1Q 2018 HEALTHY DEBT PROFILE with conventional debt trimmed 21% of total assets
DEBT RATIOS
Conventional 48%
Islamic 52%
DEBT1 PROFILE (RM m)
1 Exclude finance lease
44% 30% 30%
22% 21%
0.7 0.7 0.7 0.7 0.8
0%
5%
10%
15%
20%
25%
30%
35%
40%
45%
50%
(0.9)
(0.7)
(0.5)
(0.3)
(0.1)
0.1
0.3
0.5
0.7
1Q17 2Q17 3Q17 4Q17 1Q18
1Q17 Drawdown of existing loan facility for 900Mhz and 1800Mhz spectrum fees 2Q17 Establishment of RM5 billion Islamic bond facilities (Sukuk) to enhance funding flexibility to support the business and growth opportunities (Issued: RM900 million; Available Funds: RM4.1 billion)
Net debt/ EBITDA (x) Conventional debt1/ Total Assets

15
Other Updates 1Q 2018 IMPACT OF MFRS 15 from 1 Jan 2018 onwards • Effective 1 Jan 2018
• One-off retrospective adjustment to balances on 1 Jan
2018
• These contract assets and contract costs will be amortised over the remaining contract period
• Post MFRS 15 impact to 1Q 2018 income statement as follows:
— RM22m reduction in service revenue — RM58m increase in device revenue — RM2m increase in dealers and staff commissions — EPS uplift of 0.4sen to 5.0 sen
128
41
75
93
Retained earnings
Deferred tax
Contract costs
Contract assets (net of liabilities)
RM million Q1 2018
(Pre MFRS 15)
Q1 2018 (Post
MFRS 15) Delta %
Service revenue 1,483 1,461 (22) -1.5% Total revenue 1,599 1,635 36 2.3% Opex 490 492 2 0.4% EBITDA 741 775 34 4.6% Margin 46.3% 47.4% 1.1 1.1 Profit before tax 481 515 34 7.1% Profit after tax 352 386 34 9.7% Capex 181 181 - 0.0% Ops cash flow 560 594 34 6.1% Margin 35.0% 36.3% 1.3 1.3 EPS (sen) 4.5 5.0 0.5 9.7% DPS (sen) 4.9
16
2018 Outlook & Priorities 1Q 2018
DELIVERING SUSTAINABLE GROWTH OPPORTUNITIES with efficient operations and digital transformation
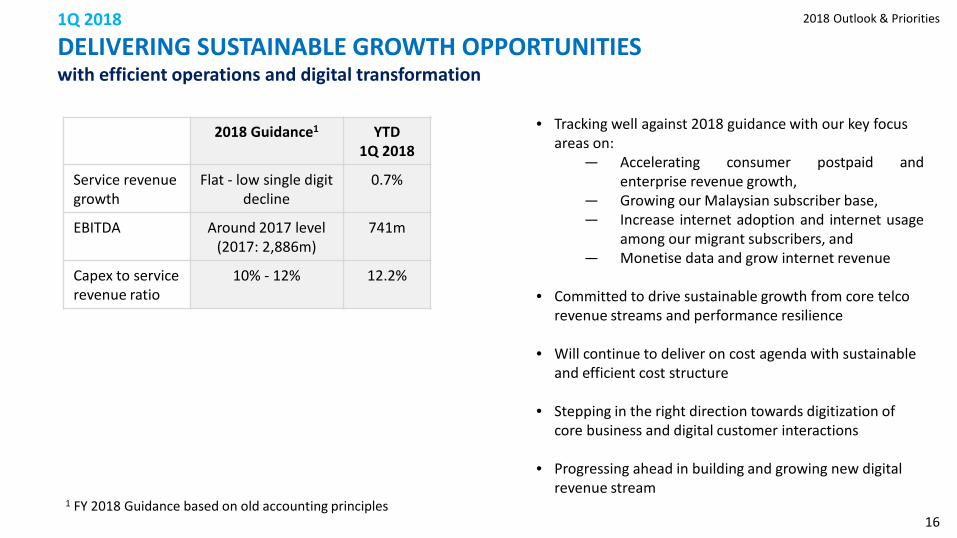
2018 Guidance1 YTD 1Q 2018
Service revenue growth
Flat - low single digit decline
0.7%
EBITDA Around 2017 level (2017: 2,886m)
741m
Capex to service revenue ratio
10% - 12% 12.2%
• Tracking well against 2018 guidance with our key focus areas on:
— Accelerating consumer postpaid and enterprise revenue growth,
— Growing our Malaysian subscriber base, — Increase internet adoption and internet usage
among our migrant subscribers, and — Monetise data and grow internet revenue
• Committed to drive sustainable growth from core telco revenue streams and performance resilience
• Will continue to deliver on cost agenda with sustainable and efficient cost structure
• Stepping in the right direction towards digitization of core business and digital customer interactions
• Progressing ahead in building and growing new digital revenue stream 1 FY 2018 Guidance based on old accounting principles

17
Q&A
18
Disclaimer
This presentation and the following discussion may contain forward looking statements by Digi.Com Berhad (Digi) related to financial trends for future periods. Some of the statements contained in this presentation or arising from this discussion which are not of historical facts are statements of future expectations with respect to financial conditions, results of operations and businesses, and related plans and objectives. Such forward looking statements are based on Digi’s current views and assumptions including, but not limited to, prevailing economic and market conditions and currently available information. These statements involve known and unknown risks and uncertainties that could cause actual results, performance or achievements to differ materially from those in the forward looking statements. Such statements are not and, should not be construed, as a representation as to future performance or achievements of Digi. In particular, such statements should not be regarded as a forecast or projection of future performance of Digi. It should be noted that the actual performance or achievements of Digi may vary significantly from such statements.

20
Appendix

21
NO. OF DEVICES SOLD
1Q 2018
22.5% Y-Y INTERNET REVENUE GROWTH backed by stronger active internet users and monetisation
108
150
120
157
137
1Q17 2Q17 3Q17 4Q17 1Q18
68.4% 69.1% 72.0% 73.7% 73.2%
68.0% 68.6% 71.1% 72.7% 73.6%
Appendix
621 637 690 747 761
94 91 88
86 80 36 36
36 39 41
751 764 814
872 882
1Q17 2Q17 3Q17 4Q17 1Q18
Data Rev (RM m) VAS Messaging Internet
% of internet subscribers % smartphone subscribers
DATA REVENUE AND PENETRATION

22
1Q 2018
REPORTED KEY PERFORMANCE INDICATORS (PRE-MFRS 15)
(RM m) 1Q18 4Q17 3Q17 2Q17 1Q17 Q-Q Y-Y
Subscribers (‘000) 11,757 11,747 11,852 12,030 11,776 0.1% -0.2% Internet subscribers (‘000) 8,612 8,659 8,538 8,311 8,056 -0.5% 6.9%
MOU 171 177 175 176 173 -3.4% -1.2% Revenue 1,599 1,645 1,570 1,552 1,574 -2.8% 1.6% Mobile serv. revenue 1,483 1,513 1,476 1,453 1,472 -2.0% 0.7% EBITDA (before other items) 741 731 727 717 711 1.4% 4.2%
EBITDA margin 46% 44% 46% 46% 45% 1.9pp 1.2pp Other items (6) Depreciation (231) (210) (206) (194) (176) 10.0% 31.3% EBIT 510 515 521 523 535 -1.0% -4.7% Net finance (costs)/income (29) (35) (10) (40) (25) -17.1% 16.0%
Profit Before Tax 481 480 511 483 510 0.2% -5.7% Taxation 129 120 126 124 137 7.5% -5.8% Profit After Tax 352 360 385 359 373 -2.2% -5.6% EPS (sen) 4.5 4.6 5.0 4.6 4.8 -2.2% -6.3% Prepaid ARPU (RM) 32 34 32 32 32 -5.9% 0.0% Postpaid ARPU (RM) 77 78 77 78 79 -1.3% -2.5% Blended ARPU (RM) 42 43 41 41 40 -2.3% 5.0%
Appendix

23
1Q 2018
REPORTED KEY PERFORMANCE INDICATORS (POST-MFRS 15)
(RM m) 1Q18 Subscribers (‘000) 11,757 Internet subscribers (‘000) 8,612
MOU 171 Revenue 1,635 Mobile serv. revenue 1,461 EBITDA (boi) 775 EBITDA margin 47% Other items Depreciation (231) EBIT 544 Net finance (costs)/income (29)
Profit Before Tax 515 Taxation 129 Profit After Tax 386 EPS (sen) 5.0 Prepaid ARPU (RM) 32 Postpaid ARPU (RM) 74 Blended ARPU (RM) 41
Appendix

24
1Q 2018
REVENUE COMPOSITION (PRE-MFRS 15)
(RM m) 1Q18 4Q17 3Q17 2Q17 1Q17 4Q16 3Q16 2Q16 1Q16 Q-Q Y-Y
REVENUE 1,599 1,645 1,570 1,552 1,574 1,670 1,619 1,655 1,653 -2.8% 1.6%
Mobile serv. revenue 1,483 1,513 1,476 1,453 1,472 1,555 1,554 1,557 1,560 -2.0% 0.7%
Voice revenue 600 641 662 689 721 801 819 849 866 -6.2% -16.6%
Data revenue 882 872 814 764 751 754 735 708 694 1.1% 17.4%
Other serv. revenue 1 0 0 0 0 0 0 0 0 100% 100% Device and other revenue 116 132 94 99 102 115 65 98 93 -12.1% 13.7%
Prepaid Revenue 891 933 919 917 952 1,044 1,065 1,065 1,096 -4.5% -6.4%
Voice revenue 431 464 485 511 541 613 631 655 680 -7.1% -20.3%
Data revenue 460 470 434 406 411 431 434 410 416 -2.1% 11.9%
Postpaid Revenue 591 580 557 536 520 511 489 492 464 1.9% 13.7%
Voice revenue 169 177 177 178 180 188 188 194 186 -4.5% -6.1%
Data revenue 422 403 380 358 340 323 301 298 278 4.7% 24.1%
Appendix
25
1Q 2018
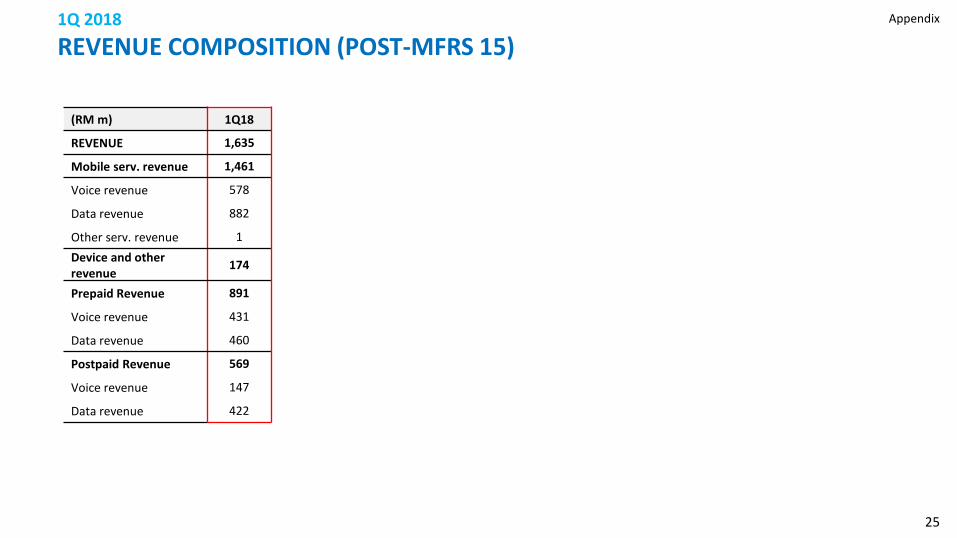
REVENUE COMPOSITION (POST-MFRS 15)
(RM m) 1Q18
REVENUE 1,635
Mobile serv. revenue 1,461
Voice revenue 578
Data revenue 882
Other serv. revenue 1 Device and other revenue 174
Prepaid Revenue 891
Voice revenue 431
Data revenue 460
Postpaid Revenue 569
Voice revenue 147
Data revenue 422
Appendix

26
1Q 2018
COGS AND OPEX (PRE-MFRS 15)
(RM m) 1Q18 4Q17 3Q17 2Q17 1Q17 4Q16 3Q16 2Q16 1Q16 Q-Q Y-Y
COGS 376 415 352 375 373 412 345 403 481 -9.4% 0.8%
Cost of materials 146 155 100 120 116 113 72 91 103 -5.8% 25.9%
Traffic charges 230 260 252 255 257 299 273 312 378 -11.5% -10.5%
OPEX 490 504 494 464 494 518 503 509 482 -2.8% -0.8%
Sales & marketing 126 133 131 149 145 156 137 134 144 -5.3% -13.1%
Staff costs 66 58 65 63 61 56 64 72 64 13.8% 8.2%
Operations & maintenance 114 138 134 128 127 125 122 124 96 -17.4% -10.2%
Other expenses 184 175 164 124 161 182 180 179 178 5.1% 14.3%
USP fund and license fees 95 102 101 59 97 111 120 116 116 -6.9% -2.1%
Credit loss allowances 16 16 10 9 10 12 12 13 14 0.0% 60.0%
Others 73 57 53 56 54 59 48 50 48 28.1% 35.2%
TOTAL 866 919 846 839 867 931 848 912 963 -5.8% -0.1%
Appendix
27
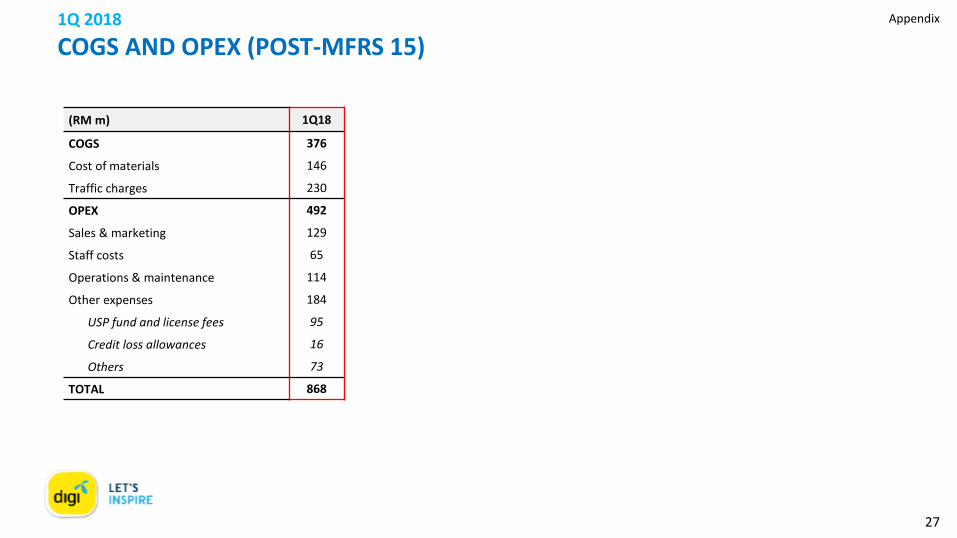
1Q 2018
COGS AND OPEX (POST-MFRS 15)
(RM m) 1Q18
COGS 376
Cost of materials 146
Traffic charges 230
OPEX 492
Sales & marketing 129
Staff costs 65
Operations & maintenance 114
Other expenses 184
USP fund and license fees 95
Credit loss allowances 16
Others 73
TOTAL 868
Appendix
28
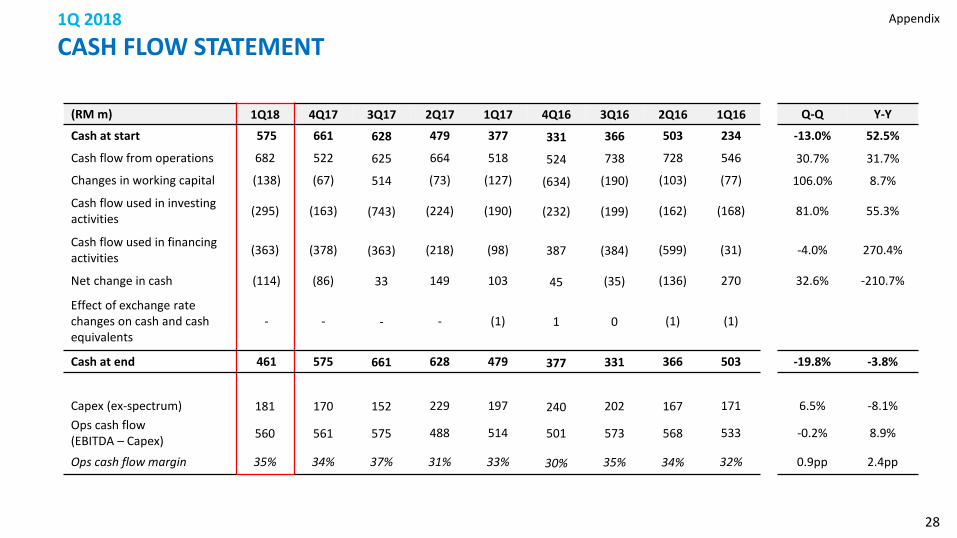
(RM m) 1Q18 4Q17 3Q17 2Q17 1Q17 4Q16 3Q16 2Q16 1Q16 Q-Q Y-Y
Cash at start 575 661 628 479 377 331 366 503 234 -13.0% 52.5%
Cash flow from operations 682 522 625 664 518 524 738 728 546 30.7% 31.7%
Changes in working capital (138) (67) 514 (73) (127) (634) (190) (103) (77) 106.0% 8.7%
Cash flow used in investing activities (295) (163) (743) (224) (190) (232) (199) (162) (168) 81.0% 55.3%
Cash flow used in financing activities (363) (378) (363) (218) (98) 387 (384) (599) (31) -4.0% 270.4%
Net change in cash (114) (86) 33 149 103 45 (35) (136) 270 32.6% -210.7%
Effect of exchange rate changes on cash and cash equivalents
- - - - (1) 1 0 (1) (1)
Cash at end 461 575 661 628 479 377 331 366 503 -19.8% -3.8%
Capex (ex-spectrum) 181 170 152 229 197 240 202 167 171 6.5% -8.1% Ops cash flow (EBITDA – Capex) 560 561 575 488 514 501 573 568 533 -0.2% 8.9%
Ops cash flow margin 35% 34% 37% 31% 33% 30% 35% 34% 32% 0.9pp 2.4pp
1Q 2018
CASH FLOW STATEMENT Appendix

29
1Q 2018
EBITDA RECONCILIATION (PRE-MFRS 15)
(RM m) 1Q17 2Q17 3Q17 4Q17 1Q18 YTD 2017
YTD 2018
EBITDA (boi) (Local definition) 711 717 727 731 741 711 741
Exclude:
Forex (gain)/loss 2 0 2 0 (3) 2 (3)
EBITDA (boi) (Telenor definition) 713 717 729 731 738 713 738
Appendix
30
11,776 12,030 11,852 11,747 11,757
8,056 8,311 8,538 8,659 8,612
1Q17 2Q17 3Q17 4Q17 1Q18
Total Internet
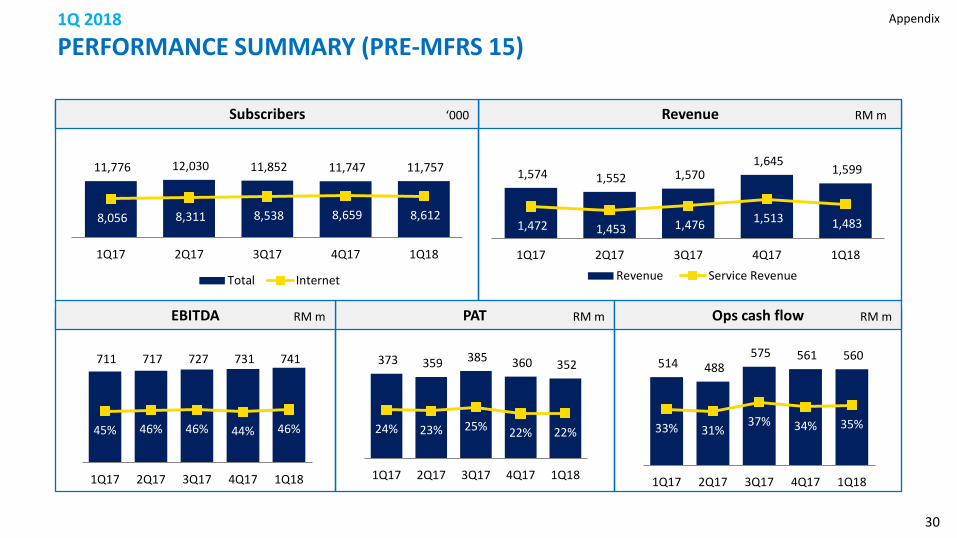
1Q 2018
PERFORMANCE SUMMARY (PRE-MFRS 15)
32% 32% 34% 30% 33% 45% 43% 46% 43%
1,574 1,552 1,570 1,645
1,599
1,472 1,453 1,476 1,513 1,483
1Q17 2Q17 3Q17 4Q17 1Q18Revenue Service Revenue
Revenue RM m Subscribers ‘000
PAT EBITDA Ops cash flow
711 717 727 731 741
45% 46% 46% 44% 46%
0%10%20%30%40%50%60%70%80%90%
-
100
200
300
400
500
600
700
800
1Q17 2Q17 3Q17 4Q17 1Q18
373 359 385 360 352
24% 23% 25% 22% 22%
0%
10%
20%
30%
40%
50%
- 50
100 150 200 250 300 350 400 450
1Q17 2Q17 3Q17 4Q17 1Q18
514 488 575 561 560
33% 31% 37% 34% 35%
0%
10%
20%
30%
40%
50%
60%
70%
-
100
200
300
400
500
600
700
1Q17 2Q17 3Q17 4Q17 1Q18
RM m RM m RM m
Appendix