1Q 2004 RESULTS PRESENTATION - listed...
21
20 th April 2004 1Q 2004 RESULTS PRESENTATION
Transcript of 1Q 2004 RESULTS PRESENTATION - listed...

20th April 2004
1Q 2004RESULTS PRESENTATION
2
Disclaimers
This presentation is focused on comparing actual results versus forecasts stated in the IMM Circular
to unitholders dated 11 June 2003 and subsequently updated in the Offer Information Statement dated
9 December 2003. This shall be read in conjunction with paragraph 9 of CMT 1Q2004 Financial
Statement Masnet announcement.
This presentation may contain forward-looking statements that involve risks and uncertainties. Actual future
performance, outcomes and results may differ materially from those expressed in forward-looking statements
as a result of a number of risks, uncertainties and assumptions. Representative examples of these factors
include (without limitation) general industry and economic conditions, interest rate trends, cost of capital and
capital availability, competition from similar developments, shifts in expected levels of property rental income,
changes in operating expenses, including employee wages, benefits and training, property expenses and
governmental and public policy changes. You are cautioned not to place undue reliance on these forward-
looking statements, which are based on the Manager's current view of future events.

Financial Highlights

4
Financial results (1 January – 31 March 2004)
Distributable income+ 5.9 %Distribution per unit 2.27¢
S$20.63 m
Forecast1
2.15¢S$19.67 m + 4.9 %
vs. Change
Annualised distribution yield(based on unit price of S$1.45 on 16 April 2004)
6.28% 5.80% + 5.9 %
Actual
Annualised distribution per unit 9.10¢ 8.59¢ + 5.9 %
CMT exceeds 1Q 2004 forecast distribution by 5.9%
Rental rates for leases renewed/new leases:(1 January – 31 March 2004)
• Achieved vs preceding rents
• Achieved vs forecast rents2
9.7%
7.7%
++
1 The forecast is based on management’s quarterly forecast. This together with the next 9 months’ forecast, is the forecast shown in the IMM Circular dated 11 June 2003 and subsequently updated in the Offer Information Statement dated 9 December 2003.
2 Forecast rents are for the purpose of the forecast shown in the IMM Circular dated 11 June 2003 and subsequently updated in the Offer Information Statement dated 9 December 2003.
5
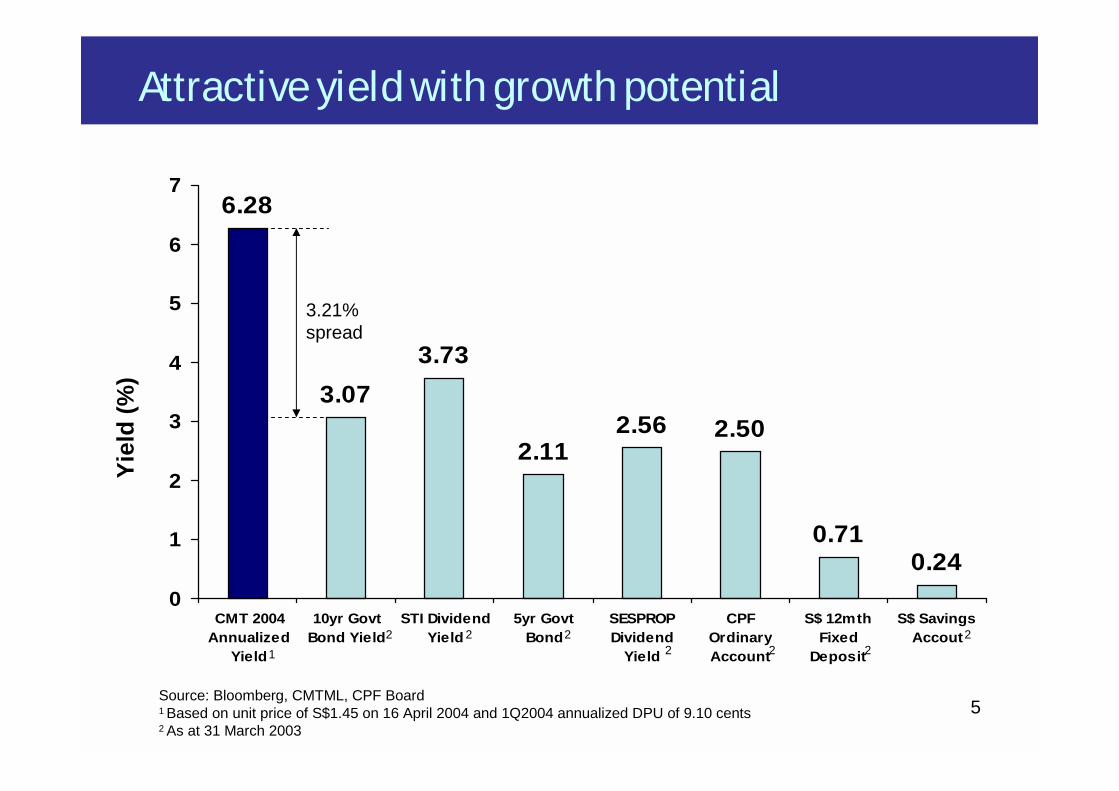
Attractive yield with growth potential
Source: Bloomberg, CMTML, CPF Board1 Based on unit price of S$1.45 on 16 April 2004 and 1Q2004 annualized DPU of 9.10 cents2 As at 31 March 2003
Yiel
d (%
)
6.28
3.073.73
2.112.56 2.50
0.710.24
0
1
2
3
4
5
6
7
CMT 2004Annualized
Yield
10yr GovtBond Yield
STI DividendYield
5yr GovtBond
SESPROPDividend
Yield
CPFOrdinaryAccount
S$ 12mthFixed
Deposit
S$ SavingsAccout
3.21% spread
2 2 22 2 2 2
1

Financial Results

7
Distribution statement
1 Jan – 31 March 2004ActualS$’000
Forecast1
S$’000Variance
(%)
Gross RevenueLess property expenses
Total net property income
Interest Income2
Administrative expensesNet interest expenses
Net income before tax
Non-tax deductible (chargeable) items
Net distributable income to unitholders
Distribution per unit (in cents) for period
Annualised distribution per unit (in cents)
35,663(12,296)
23,367
1,248 (2,256)(3,369)
18,990
684
19,674
2.15 ¢
8.59 ¢
37,550 (14,178)
23,372
1,391(2,744)(2,743)
19,276
1,354
20,630
2.27 ¢
9.10 ¢
5.315.3
-
11.521.6
(18.6)
1.51
98.0
4.9
5.9
5.9
1 The forecast is based on management’s quarterly forecast. This together with the next 9 months’ forecast, is the forecast shownin the IMM Circular dated 11 June 2003 and subsequently updated in the Offer Information Statement dated 9 December 2003.
2 Income from investment in CapitaRetail Singapore Investment

8
Gross revenue
11.4
5.3
7.5
11.4
35.6
12.3
5.2
8.0
12.0
37.5
0 5 10 15 20 25 30 35 40 45 50
IMM Building
Funan The IT Mall
Junction 8
Tampines Mall
CMT Portfolio
S$mCircular Forecast Actual
5%
1
2
1 January – 31 March 2004
1 The forecast is based on management’s quarterly forecast. This together with the next 9 months’ forecast, is the forecast shownin the IMM Circular dated 11 June 2003 and subsequently updated in the Offer Information Statement dated 9 December 2003.
2 Drop due to vacancy voids as a result of ongoing asset enhancement works at Funan

9
Property operating expenses
4.8
2.0
2.3
3.1
12.2
5.7
2.1
2.7
3.6
14.1
0 2 4 6 8 10 12 14 16 18 20
IMM Building
Funan The IT Mall
Junction 8
Tampines Mall
CMT Portfolio
S$mCircular Forecast Actual
16%
1
1 January – 31 March 2004
Note : Increased expenses due to expenses incurred for tenancy works and cyclical maintenance that was incurred earlier than forecast1 The forecast is based on management’s quarterly forecast. This together with the next 9 months’ forecast, is the forecast shown in the
IMM Circular dated 11 June 2003 and subsequently updated in the Offer Information Statement dated 9 December 2003.

10
Net property income1 January – 31 March 2004
6.6
3.3
5.2
8.3
23.4
6.6
3.1
5.3
8.4
23.4
0 5 10 15 20 25 30
IMM Building
Funan The IT Mall
Junction 8
Tampines Mall
CM Portfolio
S$mCircular Forecast Actual1
2
1 The forecast is based on management’s quarterly forecast. This together with the next 9 months’ forecast, is the forecast shownin the IMM Circular dated 11 June 2003 and subsequently updated in the Offer Information Statement dated 9 December 2003.
2 Drop due to vacancy voids as a result of ongoing asset enhancement works

11
Balance sheet
Investment Properties
Non Current Liabilities
Less Total Liabilities
Net Assets
344,356
32,672Current Assets
Total Assets
As At 31 March 2004
1,358,216
Current Liabilities 91,862
Unitholders’ Funds 954,670
1,390,888
436,218
954,670
S$’000
Units In Issue (‘000 units) 906,781
Net Asset Value per unit (as at 31 Mar 04)
Adjusted Net Asset Value per unit(excluding distributable income)
Unit price as at 31 March 04
Premium to Adjusted NAV
Net Asset Value per unit (as at 31 Mar 04)
Adjusted Net Asset Value per unit(excluding distributable income)
Unit price as at 31 March 04
Premium to Adjusted NAV
S$1.05
S$1.03
S$1.48
43.7%

Portfolio Update
13
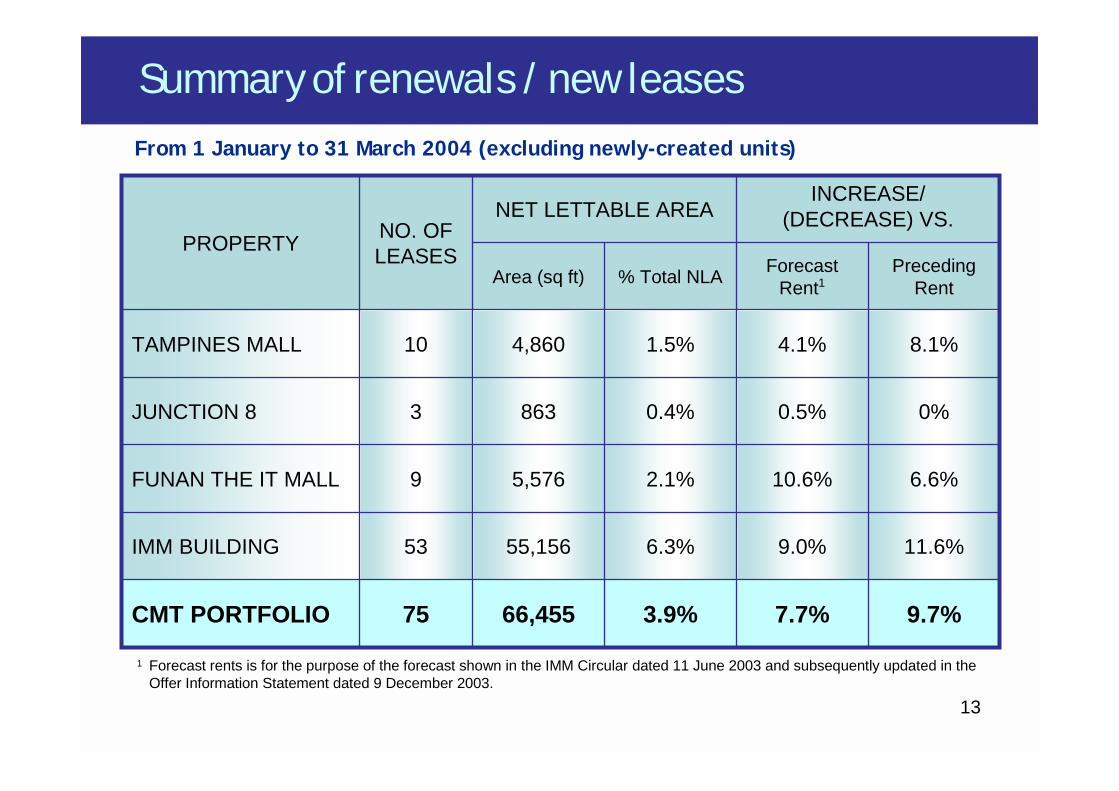
Summary of renewals / new leases
1 Forecast rents is for the purpose of the forecast shown in the IMM Circular dated 11 June 2003 and subsequently updated in the Offer Information Statement dated 9 December 2003.
9.7%7.7%3.9%66,45575CMT PORTFOLIO
11.6%9.0%6.3%55,15653IMM BUILDING
6.6%10.6%2.1%5,5769FUNAN THE IT MALL
0%0.5%0.4%8633JUNCTION 8
8.1%4.1%1.5%4,86010TAMPINES MALL
Preceding Rent
Forecast Rent1% Total NLAArea (sq ft)
INCREASE/ (DECREASE) VS.NET LETTABLE AREA
NO. OF LEASESPROPERTY
From 1 January to 31 March 2004 (excluding newly-created units)

14
Gross turnover rent & step-up leases% of total
portfolio tenants
Tenants withstep-up leases
0%
10%
20%
30%
40%
50%
Tenants payingGTO rent
No. of tenants
0
200
300
123
353
174
500
Tenants payingGTO rent
100
437
336
As at 31 Mar 04As at 31 Dec 02(without IMM)As at 31 Dec 03
Tenants withstep-up leases
400
24.6
%
38.7
%45.7
%
36.0
%45.4
%
34.9
%416*
*Due to IMM’s impending Asset Enhancement Works, some leases were extended for a period of one year and therefore have no step-up built in

15
Portfolio lease expiry profileAs at March 2004
34.5%327,536315
36.8%463,110336
3.0%141,80927
25.1%283,828229
2005
Rest of 2004
No. of Leases Sq. ft. % of total S$’000 p.a. % of total
Net Lettable Area Gross Rental Income
2006
2007
23.2%2,543
29.3%3,219
9.3%1,024
30.2%3,313

16
2004 lease expiry profile by property
! 90.3% of forecast gross rental income for 2004 has been secured by committed leases
3.9%4291.6%27,01830Junction 8
8.2%8985.3%90,88952Tampines Mall
No. of Leases Sq. ft. % of total S$’000 p.a. % of total
Net Lettable Area Gross Rental Income
1.4%1371.5%25,50426Funan The IT Mall
23.2%2,54319.1%327,536315Total
IMM Building 207 184,125 10.7% 1,079 9.7%
As at March 2004

17
Asset Enhancement Update
Tampines Mall • Asset enhancement
works on level 4 open space and travellatorsare on schedule for targeted completion date of end 2004
Funan the IT Mall• Asset enhancement
works for façade upgrading on schedule for completion 2Q2004
Artist Impression - Facade
Tampines Mall – Level 4 Open Space

18
Asset Enhancement UpdateJunction 8• Phase 2 of asset enhancement works will be completed progressively with
full completion on schedule for target date of end 2004. • Committed leases include Café Cartel, Thai Express, Coffee Bean & Tea
Leaf, BreadTalk, Baleno and others• Close to 80% or 24,000 sqft of NLA committed for part of Phase 2 which is
scheduled for completion end September 04• Average rental for rates of new leases : approx S$21.00 psf/mth
• Approval has been granted to retain the entire 5-levels of office space to be used for non-commercial purposes
• Size : approx 70,000sqft Gross Floor Area (GFA)

19
Decant secondary-corridor retail space on levels 2 & 3
New retail space on level 1(Food Kiosks)
S$33.00 psf/mthLevel 1Avg. Rental
Asset Enhancement Update
1,600 sq ftNet Lettable Area
$1.4 mCapital Expenditure
S$3.6 mIncrease in Capital Value (net of investment cost)
S$5.0 mCapital Value (assumed at 8% capitalization rate)
28%Return On Investment
S$0.4 m paNet Property Income
S$0.5 m paGross Revenue (net of rental loss from decanted spaces)
* The above is based on Manager’s forecasts
S$7.50 psf/mthLevel 2Avg. Rental
IMM Building• Construction of travellator from L1 to L5 – to commence 2Q04• Construction of additional carpark ramp to L5 – to commence 4Q2004• Commencement of asset enhancement works for new food kiosks on level 1
to be completed by 2Q2004

20
Changes in Tax Treatment for REIT Investments
Based on the Government’s 2004 Budget announced on 27 Feb 2004, the tax exemptions extended will benefit CMT investors.
• All distributions made by CMT to individuals who hold CMT units as investment assets, will be exempt from tax*.
• These changes will take effect from Year of Assessment 2005.
Tax exemptionEffective tax rateIndividual Investments*
20%22%Corporate Investments
NowBefore
*Except units held through a partnership

21
CapitaMall Trust Management Limited39 Robinson Road,
#18-01 Robinson PointSingapore 068911
Tel: (65)-6536 1188 Fax: (65)-6536 3884
http://www.capitamall.com
Contact Information