
1999 MBNQA Application Abstract - nist.gov · 1999 MBNQA Application Abstract 1 ... term, mutually...
20
1999 MBNQA Application Abstract 1 BUSINESS OVERVIEW Basic description of the company STMicroelectronics (ST) designs, develops, manufactures, and markets semiconductor integrated circuits (IC) to customers within the US and throughout the world. Our semiconductor ICs and discrete devices are used in a wide variety of microelectronic applications including systems and products for telecommunications, computer, consumer, automotive, and industrial automation and control. Our parent company is headquartered in St. Genis, France, near Geneva, Switzerland. We are one of five sub-units who have design, manufacturing, and sales functions throughout Europe, the US, Southeast Asia, Japan, and China. ST Corporate balances and utilizes the capabilities and facilities of all subsidiary manufacturing facilities to capitalize on efficiencies and distribution channels. As such, our U.S. operations are responsible for the design process, wafer fabrication, and initial testing. Our product is then sent to overseas’ locations for assembly and final test. Our corporate distribution network routes products sold by US marketing operations to our warehouse in Phoenix for final shipment. Our U.S. headquarters site is in Carrollton, TX (near Dallas) where we have one wafer fab. Two other large facilities with fabs are in Phoenix, AZ, and Rancho Bernardo, CA. The remaining ST employees in the US are located in San Jose, CA; Livonia, MI; Lexington, MA; and other Design Centers and Marketing/Sales offices. Our 1998 US sales were $937M, roughly 22% of overall cor- porate billings. Additional transnational sales from the US bring total sales to $1.64B, or 38.6% of corporate billings. Overall, ST Corporate ranks ninth in worldwide sales among the top semiconductor companies. Within the US, ST employs 3,230 of the parent’s 29,000 worldwide employees. Our employees are the strongest assets that we have and are the key to our ongoing success. Our total US population has 35% professionals; 35% skilled; 15% semi-skilled; 2% supervisors; and 13% managers, executives, and other. Twenty-seven percent of our employees have been with us for ten years or longer providing a strong base of knowledgeable, experienced resources. Thirteen percent of our employees have advanced college degrees; another 34% have Bachelor or Associates degrees; three percent have trade degrees; and 36% have high school diplomas. Specialized state-of-the-art manufacturing process equipment types used are in the categories of precisely controlled high- temperature furnaces, liquid and plasma chemical etching, sub- micron photolithography alignment tools, and high-energy ion implantation equipment. Achieving defect-free semiconductor products requires an ultra-clean environment, which places great demand on the facilities of ST sites. The semiconductor ICs we produce and sell internationally cover a broad range of market segments and customer needs. Among our customers are strong strategic partnerships including joint product design and development, manu- facturing technology planning, development, and sharing. Competitive differentiation occurs in areas like innovation in leading technologies, breadth of product offerings, time-to- market, special services, local dedicated inventories for enhanced just-in-time delivery, and partnership in direction setting, data sharing, and problem resolution. Computer and consumer electronics customers affix special emphasis on fast prototyping, flexibility, and fast time to volume production to meet their fast-changing products and market demands. Automotive customers expect technol- ogy/design direction sharing, willingness in adherence to comprehensive automotive business systems and disciplines, and long-term agreements to support designed-in products. We have a large total supplier base of over 1,000 entities, which includes a significant number of “non-key”, commodity suppliers and temporary service providers. Our key suppliers (36) account for more than 80% of our purchasing dollars. As a key strategy, we work very hard to establish strong, long- term, mutually beneficial relations and partnerships with suppliers and are guided by the philosophy that suppliers are “seamless” extensions of ST. At least 20 companies could be considered direct competition in worldwide, broad-based product lines. Several hundred companies with niche market focus are competitors in various market segments and locations. In some cases, ST customers utilize our wafer manufacturing capabilities and then, in the final product, are competitors in the marketplace. In other cases, wafer foundry manufacturers are direct competitors in supplying our customers with the wafer manufacturing. Indirect competitors occur where competing applications vie for portions of the same market activities. Competition in the industry is driven by several key factors, and ST is highly competitive in all of them. They are: § Early with leading technology advances, § Innovation in product design, § Continuous productivity growth allowing continuous cost reduction to support market expectations, and § Continuous growth in sales and company size to achieve economies-to-scale in this capital-intensive industry. A key technological advancement factor is the continuing reduction in circuit geometry dimensions. We produce very competitive 0.35- and 0.25-micron circuits and are on schedule to introduce circuits at 0.18 microns. We have met our challenging growth goals to be among the top ten worldwide semiconductor companies through strategies of careful diversification, selective market participation, and strong, long-term partnerships with customers and suppliers. We are also known in the industry for our commitment and leadership in environmental concerns.
-
Upload
nguyentuyen -
Category
Documents
-
view
219 -
download
0
Transcript of 1999 MBNQA Application Abstract - nist.gov · 1999 MBNQA Application Abstract 1 ... term, mutually...

1999 MBNQA Application Abstract
1
BBUUSSIINNEESSSS OOVVEERRVVIIEEWW Basic description of the company STMicroelectronics (ST) designs, develops, manufactures, and markets semiconductor integrated circuits (IC) to customers within the US and throughout the world. Our semiconductor ICs and discrete devices are used in a wide variety of microelectronic applications including systems and products for telecommunications, computer, consumer, automotive, and industrial automation and control.
Our parent company is headquartered in St. Genis, France, near Geneva, Switzerland. We are one of five sub-units who have design, manufacturing, and sales functions throughout Europe, the US, Southeast Asia, Japan, and China. ST Corporate balances and utilizes the capabilities and facilities of all subsidiary manufacturing facilities to capitalize on efficiencies and distribution channels. As such, our U.S. operations are responsible for the design process, wafer fabrication, and initial testing. Our product is then sent to overseas’ locations for assembly and final test. Our corporate distribution network routes products sold by US marketing operations to our warehouse in Phoenix for final shipment.
Our U.S. headquarters site is in Carrollton, TX (near Dallas) where we have one wafer fab. Two other large facilities with fabs are in Phoenix, AZ, and Rancho Bernardo, CA. The remaining ST employees in the US are located in San Jose, CA; Livonia, MI; Lexington, MA; and other Design Centers and Marketing/Sales offices.
Our 1998 US sales were $937M, roughly 22% of overall cor-porate billings. Additional transnational sales from the US bring total sales to $1.64B, or 38.6% of corporate billings. Overall, ST Corporate ranks ninth in worldwide sales among the top semiconductor companies. Within the US, ST employs 3,230 of the parent’s 29,000 worldwide employees.
Our employees are the strongest assets that we have and are the key to our ongoing success. Our total US population has 35% professionals; 35% skilled; 15% semi-skilled; 2% supervisors; and 13% managers, executives, and other. Twenty-seven percent of our employees have been with us for ten years or longer providing a strong base of knowledgeable, experienced resources. Thirteen percent of our employees have advanced college degrees; another 34% have Bachelor or Associates degrees; three percent have trade degrees; and 36% have high school diplomas.
Specialized state-of-the-art manufacturing process equipment types used are in the categories of precisely controlled high-temperature furnaces, liquid and plasma chemical etching, sub-micron photolithography alignment tools, and high-energy ion implantation equipment. Achieving defect-free semiconductor products requires an ultra-clean environment, which places great demand on the facilities of ST sites.
The semiconductor ICs we produce and sell internationally cover a broad range of market segments and customer needs.
Among our customers are strong strategic partnerships including joint product design and development, manu-facturing technology planning, development, and sharing.
Competitive differentiation occurs in areas like innovation in leading technologies, breadth of product offerings, time-to-market, special services, local dedicated inventories for enhanced just-in-time delivery, and partnership in direction setting, data sharing, and problem resolution.
Computer and consumer electronics customers affix special emphasis on fast prototyping, flexibility, and fast time to volume production to meet their fast-changing products and market demands. Automotive customers expect technol-ogy/design direction sharing, willingness in adherence to comprehensive automotive business systems and disciplines, and long-term agreements to support designed-in products.
We have a large total supplier base of over 1,000 entities, which includes a significant number of “non-key”, commodity suppliers and temporary service providers. Our key suppliers (36) account for more than 80% of our purchasing dollars. As a key strategy, we work very hard to establish strong, long-term, mutually beneficial relations and partnerships with suppliers and are guided by the philosophy that suppliers are “seamless” extensions of ST.
At least 20 companies could be considered direct competition in worldwide, broad-based product lines. Several hundred companies with niche market focus are competitors in various market segments and locations. In some cases, ST customers utilize our wafer manufacturing capabilities and then, in the final product, are competitors in the marketplace. In other cases, wafer foundry manufacturers are direct competitors in supplying our customers with the wafer manufacturing. Indirect competitors occur where competing applications vie for portions of the same market activities.
Competition in the industry is driven by several key factors, and ST is highly competitive in all of them. They are: § Early with leading technology advances, § Innovation in product design, § Continuous productivity growth allowing continuous cost
reduction to support market expectations, and § Continuous growth in sales and company size to achieve
economies-to-scale in this capital-intensive industry.
A key technological advancement factor is the continuing reduction in circuit geometry dimensions. We produce very competitive 0.35- and 0.25-micron circuits and are on schedule to introduce circuits at 0.18 microns.
We have met our challenging growth goals to be among the top ten worldwide semiconductor companies through strategies of careful diversification, selective market participation, and strong, long-term partnerships with customers and suppliers. We are also known in the industry for our commitment and leadership in environmental concerns.

1999 MBNQA Application Abstract
2
CCaatteeggoorryy 11 -- LLEEAADDEERRSSHHIIPP
1.1 Organizational Leadership 1.1a Senior Leadership Direction Region Americas’ leaders are organized in a product/ function/geographic matrix structure, which has the traditional functions of Marketing and Sales, Finance, Human Resources, and Information Technology directly reporting to the Region Americas’ president. Leadership of the Manufacturing and Group functions report directly to corporate headquarters but are also linked within the Region through dotted line to the president. Our President and CEO, Richard Pieranunzi, and the Chairman, Laurent Bosson, are both corporate vice presidents and staff members of our parent company, ensuring that their leadership focus remains global in nature while providing regional empowerment and initiative.
In 1991 and 1992, our TQM Initiative was cascaded down from Corporate, which was a turning point in management methods and communication of company directions. TQM has been a powerful tool in achieving cohesion between our organization’s leadership, the corporation, and all employees. Between 1992 and 1996, virtually all managers and employees attended Latch Cascade Training; a two-day course dedicated to TQM education. Since then, TQM training has been incorporated into our new employee orientation. This training provides a strong mechanism to communicate values and expectations throughout the workforce. Senior managers continue to lead sections of this program.
Our values include the Guiding Principles, Vision, Mission, and Five Key Principles of TQM.
ST’s vision is to be: § A solid member of top 10 worldwide IC suppliers § Financial performance superior to top 10 average § Best-in-class in service and environmental protection
Our company’s mission is: “To offer strategic independence to our partners worldwide, as a profitable and viable, broad range semiconductor supplier.”
Our Guiding Principles are: § Customer satisfaction § Business integrity § People
§ Persistence for excellence § Profitability § Innovation
Our Five Key Principles of TQM are: § Management commitment and leadership § Employee empowerment § Fact-based decision making § Continuous improvement § Customer focus (internal and external)
These values are combined with our three company objectives and strategic guidelines to create our “Shared Values”. The “Guiding Principles” are the foundation on which the company is built. Uniform application of these never-changing tenets
assures the balance between customers, employees, and all stakeholders. The “Five Key Principles of TQM” support our Guiding Principles. These two elements support our mission and vision, which are deployed through supporting department mission and/or vision statements. We have three company objectives to enable us to fulfill our mission and vision, i.e., financial, growth, and social. Our Strategic Guidelines support these company objectives.
In addition to the above values, we believe that it is mandatory for our TQM-driven company to take a leadership position on ecological commitment. Our “ecological vision” is to become a corporation that closely approaches environmental neutrality. To support and reinforce this commitment, we have defined an Environmental Decalogue (10 environmental commandments) to guide our actions.
Our Steering Committee reviewed and adopted the corporate-level values as our organization’s cultural direction to ensure our alignment with all branches of the ST entity. Through Policy Deployment (Figure 2.1B), goals and objectives are cascaded through the organization by taking the top-level goals of the Groups, Staff, and Operations and combining them upward into the Region Americas’ Policy Deployment Top Page (Figure 2.2A). Individual leaders are held accountable for these goals through MBOs.
Senior leaders work as a team to provide consistent direction to all organizations to achieve company goals. Leaders throughout the company use Policy Deployment and our strong company values to guide decisions and communicate expectations, thus ensuring alignment to overall direction. Once the strategic plan is established, leadership conducts site and department-level communication meetings to discuss the plan and describe employees’ next steps.
We balance customer and stakeholder focus through all these same mechanisms; deployment of company values, Policy Deployment, related training programs, regular internal correspondence, meetings, and recognition events for customer service, employee commitment, and supplier excellence. Commitment to our government regulatory stakeholders is reinforced to employees everyday through our environmental and ISO 14001 efforts. We reinforce commitment to our corporate management by alignment to overarching values and directions. However, while these efforts play an important role in communication and deploy-ment, one of the most important vehicles for communication is our review process, which reinforces focus on the goals and the quest for improvement far better than any one directional communication method.
Senior leaders reinforce commitment to employees by devoting significant time for face-to-face contact, training, challenging, and rewarding employees. We provide several rewards and types of recognition; such as advancement through the Career Enhancement System, the ST Recognition Program, and annual merit increases.

1999 MBNQA Application Abstract
3
Setting direction for the organization (Policy Deployment) is a top-down, bottom-up exercise. Through strategic planning, senior leaders communicate corporate direction throughout the division, operations, and regions to the site and department levels. The TQM Steering Committee translates the corporate goals into those applicable for each department.
Leadership develops individual plans with Product Divisions, Manufacturing, and Marketing and Sales. To further drive empowerment and management development, “operation teams” develop and drive annual key operational objectives. The formation and use of appropriate goals are powerful tools in creating a US regional identity.
1.1b Organizational Performance Review Our major reviews, senior level involvement, attendees, and the key measures are clearly defined. All these reviews and reports, linked by Policy Deployment, assess the status and drive progress toward objectives, identifying areas of concern and confirming availability of sufficient resources. Our review and report process assures that progress is commensurate with targets or initiates necessary actions. Lack of progress is viewed as a process management problem rather than a workforce problem.
Leaders play active roles in reviews to monitor performance and provide assistance in resolving issues as they arise. They also use the reviews as opportunities to reinforce company directions by ensuring linkage of measures and activities to the Regional Top Page, identifying opportunities for improvement and helping to correct and track them. Findings are incorporated into team or department goals to ensure full deployment and ongoing tracking. Actions include targets that the improvement team is expected to achieve, which are derived from the Corporate Worldwide Standard (WWS) or Group (site or department) objectives. Customers and suppliers are included in team assignments to address the issues as part of the end-to-end solution.
Evaluation of the leadership system is accomplished through several mechanisms, including individual reviews and the company performance reviews. Individual review occurs through 360-degree reviews of individual leaders, results of employee surveys, one-on-one sessions, TQM Steering Committee reflection, and external assessments. The results of company performance seen through operations reviews also reflect the effectiveness of the leadership system.
Annual “CEO TQM Audits” also provide a way for the CEO and Regional operations to review and evaluate their TQM achievements within the framework of Policy Deployment.
1.2 Public Responsibility and Citizenship Our goal is to be a posit ive asset within the communities we serve. We work with city officials to help us understand how we can contribute. All sites are well maintained and complement their surrounding neighborhoods. Energy, water
use, emissions reduction, as well as reduced consumption of chemicals, are all specific programs at every site.
1.2a Responsibilities to the Public
ST is among the foremost leaders in care and protection of the environment. Our Environmental Decalogue captures the essence of our deep commitment. Published in 1994, it clearly articulates our “Ten Environmental Commandments” for environmental responsibility. The pamphlet is distributed to employees, suppliers, customers, and other stakeholders.
The Decalogue begins:
“We believe firmly that it is mandatory for a TQM-driven corporation to be at the forefront of ecological commitment, not only for ethical and social reasons, but also for financial return and the ability to attract the most responsible and performing people. Our ecological vision is to become a corporation that closely approaches environmental neutrality. To that end we will meet all local ecological/ environmental requirements of those communities in which we operate.”
Each of our ten environmental commandments is described and has specific associated goals that we track during performance reviews.
An independent authority has certified all three manufacturing sites within the US to both EMAS and ISO 14001. Our Rancho Bernardo facility was the first site of any company in the US to achieve ISO 14001 certification. We are members of several associations that continuously monitor and predict societal concerns and impacts.
With respect to our products, the relentless technological push requires that the next generation products are always more energy efficient, cost less per function, and are more reliable. These potential future public concerns are addressed through their inclusion in the goals of our Decalogue and subsequent incorporation into our Policy Deployment goals.
One of the six formal guiding principles of ST is “Business Integrity; employees are held to maintain the highest ethical standards in all dealings.” We have a set of standard operating procedures (SOP) that specifically address the ethical and legal policies of the company.
1.2b Support of Key Communities
We developed a specific SOP to address our commitment to the community. This policy sets down guidelines for top-level contributions, site community relations, and employee-matching gifts.
Site projects vary from site to site but generally fall into three categories:
§ Participation in city council planning and development, § Support of educational activities, and § Financial support of local community environmental
programs (such as the Trinity River cleanup in Dallas).

1999 MBNQA Application Abstract
4
CCaatteeggoorryy 22 –– SSTTRRAATTEEGGIICC PPLLAANNNNIINNGG
2.1 Strategy Development 2.1a Strategy Development Process The objective of strategic planning is to systematically antici-pate the evolution/changes of the market demand and match it with the needed resources. A large portion of this activity is therefore devoted to understanding market evolution, business anticipation, and forecasting. Our approach to strategic planning is very “capillary” involving a large portion of our population in a bottom-up and top-down exe rcise that ensures employee ownership and corporate alignment.
Every three to five years the corporation undergoes a process (Vision 200x) to set long-term strategic guidelines. Senior managers set key objectives for where the corporation will be at the end of the next five to seven years. Subsequently, key managers attend a two-day workshop to find the best implementation strategies to obtain the stated objectives.
The annual strategic planning process (Figure 2.1A) incorporates all areas relevant to our ongoing success: business forecasting and evolution, manufacturing, resources, costs, human resources, quality requirements, environmental issues, and financial growth. The objectives and strategies of the overall corporation and every functional area are tied together through our Policy Deployment (Figure 2.1B).
The Top Pages for each functional area are the vehicles for common review to assure alignment, linkage, and support of company goals and objectives. Within each functional area, the Top Page becomes the guidance for deployment of actions, as each objective is assigned ownership and is tracked through a network of area steering committees.
The strategic planning cycle within Region Americas is described in the following steps (reference Figure 2.1A).
Step 1: Each Business Segment collects real time information concerning the evolution of their area’s business. The Segment Manager accounts for the specific differentiators, such as pricing strategy, specific quality and other requirements for a five to seven-year horizon, technology offering, dedicated service requirements, etc., necessary to be
successful in the segment. Industry market requirements are in continuous and fast evolution requiring miniaturization of the newest systems and a continuous price reduction. We offer a predictable strategy of “system integration” that allows our customers to migrate from generation to generation, offering more functions on a single piece of silicon.
Business evolution analysis uses a model/forecast tool called a TAM (Total Available Market) analysis to analyze the total semiconductor consumption by product family for each major customer. This allows us to estimate overall market share for any targeted customer or segment as well as determine the influence of new product introductions and sales programs on future revenues. Also, a dedicated Strategic Marketing Team is chartered to scout developing markets and emerging compa-nies not routinely covered.
The segment strategy is aligned with known capabilities (ex-isting or planned) offered by the corporation and frequently contains proposals for future product and technology needs.
Step 2: We routinely compare our position to our competitors in several areas including market share, financial performance, product offerings, etc. Segment management, manufacturing management, and organization support managers continually analyze supporting information from specialized published literature and customer information. We also collect internal and external data to compare productivity and cost performance to similar ST plants around the world. This contributes to our overall regional strategy and tactics.
Step 3: We gather information related to our internal capa-bilities and available resources allowing effective allocation and prioritization of these assets in real time. Based upon the anticipated market/product demand plans, manufacturing operations defines a capacity loading and production delivery plan to meet the projected marketing demands and human resource plans for future employee needs. Key requirements for new operational capabilities are outlined in the Capital Plan that accompanies the Business Plan. As part of our annual strategic planning effort, our corporation earmarks 12 – 15% of revenue specifically for R&D efforts, many of which are conducted in partnership with customers.
Analysis of external environment
Comparative position
Internalresources
SegmentStrategies
Corporate alignment Deployment
Performance analysis
Risks/Opportunities
Continuous feedback
RREESSUULLTTSS
11
22
33
44 55 66 77 88
99RegionalStrategy
Figure 2.1A – Annual Strategic Planning Process

1999 MBNQA Application Abstract
5
REGION AMERICAS
Our Path to ExcellencePOLICY DEPOLYMENT - LEVEL 1
1999 GOALS SUMMARY
FINANCIAL- Exp/Sales (Region %) 10%- Standard Margin (%) 66%- Direct Manufacturing Variance (%) -30%- Finished Goods - Turns 15- Finished Goods Obsolescence (Mil$ write-off) 3.0- Receivables (days of sales) 36
GROWTH- Billings ($M) Domestic / WW 1108 / 1870- Market Share (%) Domestic > 2.5- # Patents Filed/Issued 120 / 120- Employee Turnover 10%- Freshout Hires 20%- Cost of New Recruits <$14,740- Cycle Time to Hire in days (Ex/NE) 105/82
CUSTOMER Satisfaction, SERVICE & QUALITY- Customer Perception Survey >8 / 10- Customer Score Card >3.5 / 4- Internal Image (Corp. Div. / Survey) TBD- RMA's (Technical - % of NSB) <0.2%
PEOPLE / COMMUNITY- Training - Avg. hours per employee 55- Social Climate Survey: Categories Exceeding US Country Norm 5 of 10- Community Action Initiatives 40- EEOC - # Founded Charges 0- NAME Recognition TBD- Communication - Employee awareness TBD- Govt & Business relations - VP & PRES memberships TBD
ENVIRONMENT, HEALTH & safety- OSHA/Safety (#Citations) 0- Industrial accidents/year/100 employees < 0.5- Paper Consumption - (LBS per employee % per year reduction) >10- Power Consumption - KWh per 6"k equivalent (% per year reduction) > 5
AMERICAS OBJECTIVES
OBJECTIVE 1
OWNERAMERICAS OBJECTIVES
OBJECTIVE 2
OWNERAMERICAS OBJECTIVES
OBJECTIVE 3
OWNERAMERICAS OBJECTIVES
OBJECTIVE 4
OWNERAMERICAS OBJECTIVES
OBJECTIVE 5
OWNERAMERICAS OBJECTIVES
OBJECTIVE 6
OWNER
CORPORATE
OBJECTIVES
ST TQM POLICY DEPLOYMENT METHODREGION AMERICAS
T Q M - M A N U F A C T U R I N G Our Path to Excellence
CFM POLICY DEPOLYMENT - LEVEL 11999 GOALS SUMMARY
PROFITABILITY- Manufacturing variance: Reduction of gap to WWS > 50%- Yearly growth rate productivity (WPP) > 15%- Inventory turn increase (Direct & Indirect material and Spare parts) > 50%
QUALITY- Process parameters Cpk: Reduction of gap to target
Cpk >1.33 Target 100% > 80%Cpk >1.67 Target 95% > 50%
- Do variance: Reduction of gap to WWS (0.01 D/cm2/lev) >50%- WLR: % of failures on std Tests performed < 1%
MANUFACTURING- OOE of equipment bottlenecks > 80%- Fab Yield loss/mask level (ppm) < 1500
CUSTOMER SATISFACTION & SERVICE- Reduction of Customers Complaints for FE issues > 50%- Cycle time of Wafer Fab & EWS (Times theoretical):
AVG < 1.895% < 2.8
- Scheduling and timely execution of key projects: execution > 90%
PEOPLE- Training: Adherence to training matrix > 70%- Timely execution of the empowerment roadmap > 90%- Social Climate Survey: Exceeding the average Country Norm > 10%
ENVIRONMENTAL, HEALTH & SAFETY- Adherence to Environmental Decalogue > 90%- Industrial accidents/year/100 employees > 0.5
TQM STEERING COMMITTEE
TQM - AMERICAS G&A Our Path to Excellence
POLICY DEPOLYMENT - LEVEL 11999 GOALS SUMMARY
PROFITABILITY- Manufacturing variance: Reduction of gap to WWS > 50%- Yearly growth rate productivity (WPP) > 15%- Inventory turn increase (Direct & Indirect material and Spare parts) > 50%
QUALITY- Process parameters Cpk: Reduction of gap to targetCpk >1.33 Target 100% > 80%Cpk >1.67 Target 95% > 50%
- Do variance: Reduction of gap to WWS (0.01 D/cm2/lev) >50%- WLR: % of failures on std Tests performed < 1%
MANUFACTURING- OOE of equipment bottlenecks > 80%- Fab Yield loss/mask level (ppm) < 1500
CUSTOMER SATISFACTION & SERVICE- Reduction of Customers Complaints for FE issues > 50%- Cycle time of Wafer Fab & EWS (Times theoretical): AVG < 1.8
95% < 2.8- Scheduling and timely execution of key projects: execution > 90%
PEOPLE- Training: Adherence to training matrix > 70%- Timely execution of the empowerment roadmap > 90%- Social Climate Survey: Exceeding the average Country Norm > 10%
ENVIRONMENTAL, HEALTH & SAFETY- Adherence to Environmental Decalogue > 90%- Industrial accidents/year/100 employees > 0.5
TQM - GROUP Our Path to Excellence
POLICY DEPOLYMENT - LEVEL 11999 GOALS SUMMARY
PROFITABILITY- Manufacturing variance: Reduction of gap to WWS > 50%- Yearly growth rate productivity (WPP) > 15%- Inventory turn increase (Direct & Indirect material and Spare parts) > 50%
QUALITY- Process parameters Cpk: Reduction of gap to targetCpk >1.33 Target 100% > 80%
Cpk >1.67 Target 95% > 50%- Do variance: Reduction of gap to WWS (0.01 D/cm2/lev) >50%- WLR: % of failures on std Tests performed < 1%
MANUFACTURING- OOE of equipment bottlenecks > 80%- Fab Yield loss/mask level (ppm) < 1500
CUSTOMER SATISFACTION & SERVICE- Reduction of Customers Complaints for FE issues > 50%- Cycle time of Wafer Fab & EWS (Times theoretical):
AVG < 1.895% < 2.8- Scheduling and timely execution of key projects: execution > 90%
PEOPLE- Training: Adherence to training matrix > 70%- Timely execution of the empowerment roadmap > 90%- Social Climate Survey: Exceeding the average Country Norm > 10%
ENVIRONMENTAL, HEALTH & SAFETY- Adherence to Environmental Decalogue > 90%- Industrial accidents/year/100 employees > 0.5
T Q M - C A R R O L L T O N
Our Path to ExcellenceCFM POLICY DEPOLYMENT - LEVEL 1
1999 GOALS SUMMARY
PROFITABILITY- Manufacturing variance: Reduction of gap to WWS > 50%- Yearly growth rate productivity (WPP) > 15%- Inventory turn increase (Direct & Indirect material and Spare parts) > 50%
QUALITY- Process parameters Cpk: Reduction of gap to targetCpk >1.33 Target 100% > 80%Cpk >1.67 Target 95% > 50%
- Do variance: Reduction of gap to WWS (0.01 D/cm2/lev) >50%- WLR: % of failures on std Tests performed < 1%
MANUFACTURING- OOE of equipment bottlenecks > 80%- Fab Yield loss/mask level (ppm) < 1500
CUSTOMER SATISFACTION & SERVICE- Reduction of Customers Complaints for FE issues > 50%- Cycle time of Wafer Fab & EWS (Times theoretical):
AVG < 1.895% < 2.8- Scheduling and timely execution of key projects: execution > 90%
PEOPLE- Training: Adherence to training matrix > 70%- Timely execution of the empowerment roadmap > 90%- Social Climate Survey: Exceeding the average Country Norm > 10%
ENVIRONMENTAL, HEALTH & SAFETY- Adherence to Environmental Decalogue > 90%- Industrial accidents/year/100 employees > 0.5
T Q M - PHOENIX
Our Path to ExcellenceCFM POLICY DEPOLYMENT - LEVEL 1
1999 GOALS SUMMARY
PROFITABILITY- Manufacturing variance: Reduction of gap to WWS > 50%- Yearly growth rate productivity (WPP) > 15%- Inventory turn increase (Direct & Indirect material and Spare parts) > 50%
QUALITY- Process parameters Cpk: Reduction of gap to targetCpk >1.33 Target 100% > 80%Cpk >1.67 Target 95% > 50%- Do variance: Reduction of gap to WWS (0.01 D/cm2/lev) >50%
- WLR: % of failures on std Tests performed < 1%
MANUFACTURING- OOE of equipment bottlenecks > 80%- Fab Yield loss/mask level (ppm) < 1500
CUSTOMER SATISFACTION & SERVICE- Reduction of Customers Complaints for FE issues > 50%- Cycle time of Wafer Fab & EWS (Times theoretical):
AVG < 1.895% < 2.8- Scheduling and timely execution of key projects: execution > 90%
PEOPLE- Training: Adherence to training matrix > 70%- Timely execution of the empowerment roadmap > 90%- Social Climate Survey: Exceeding the average Country Norm > 10%
ENVIRONMENTAL, HEALTH & SAFETY- Adherence to Environmental Decalogue > 90%- Industrial accidents/year/100 employees > 0.5
T Q M - RANCHO BERNARDO
Our Path to ExcellenceCFM POLICY DEPOLYMENT - LEVEL 1
1999 GOALS SUMMARY PROFITABILITY- Manufacturing variance: Reduction of gap to WWS > 50%- Yearly growth rate productivity (WPP) > 15%- Inventory turn increase (Direct & Indirect material and Spare parts) > 50%
QUALITY- Process parameters Cpk: Reduction of gap to targetCpk >1.33 Target 100% > 80%Cpk >1.67 Target 95% > 50%- Do variance: Reduction of gap to WWS (0.01 D/cm2/lev) >50%
- WLR: % of failures on std Tests performed < 1%
MANUFACTURING- OOE of equipment bottlenecks > 80%- Fab Yield loss/mask level (ppm) < 1500
CUSTOMER SATISFACTION & SERVICE- Reduction of Customers Complaints for FE issues > 50%- Cycle time of Wafer Fab & EWS (Times theoretical):
AVG < 1.895% < 2.8- Scheduling and timely execution of key projects: execution > 90%
PEOPLE- Training: Adherence to training matrix > 70%- Timely execution of the empowerment roadmap > 90%- Social Climate Survey: Exceeding the average Country Norm > 10%
ENVIRONMENTAL, HEALTH & SAFETY- Adherence to Environmental Decalogue > 90%- Industrial accidents/year/100 employees > 0.5
S A L E S & M A R K E T I N GOur Path to Excellence
POLICY DEPOLYMENT - LEVEL 11999 GOALS SUMMARY
PROFITABILITY- Manufacturing variance: Reduction of gap to WWS > 50%- Yearly growth rate productivity (WPP) > 15%- Inventory turn increase (Direct & Indirect material and Spare parts) > 50%
QUALITY- Process parameters Cpk: Reduction of gap to targetCpk >1.33 Target 100% > 80%
Cpk >1.67 Target 95% > 50%- Do variance: Reduction of gap to WWS (0.01 D/cm2/lev) >50%- WLR: % of failures on std Tests performed < 1%
MANUFACTURING- OOE of equipment bottlenecks > 80%- Fab Yield loss/mask level (ppm) < 1500
CUSTOMER SATISFACTION & SERVICE- Reduction of Customers Complaints for FE issues > 50%- Cycle time of Wafer Fab & EWS (Times theoretical):
AVG < 1.895% < 2.8- Scheduling and timely execution of key projects: execution > 90%
PEOPLE- Training: Adherence to training matrix > 70%- Timely execution of the empowerment roadmap > 90%- Social Climate Survey: Exceeding the average Country Norm > 10%
ENVIRONMENTAL, HEALTH & SAFETY- Adherence to Environmental Decalogue > 90%- Industrial accidents/year/100 employees > 0.5
REGION QUALITY Our Path to Excellence
POLICY DEPOLYMENT - LEVEL 11999 GOALS SUMMARY
PROFITABILITY- Manufacturing variance: Reduction of gap to WWS > 50%- Yearly growth rate productivity (WPP) > 15%- Inventory turn increase (Direct & Indirect material and Spare parts) > 50%
QUALITY- Process parameters Cpk: Reduction of gap to targetCpk >1.33 Target 100% > 80%Cpk >1.67 Target 95% > 50%
- Do variance: Reduction of gap to WWS (0.01 D/cm2/lev) >50%- WLR: % of failures on std Tests performed < 1%
MANUFACTURING- OOE of equipment bottlenecks > 80%- Fab Yield loss/mask level (ppm) < 1500
CUSTOMER SATISFACTION & SERVICE- Reduction of Customers Complaints for FE issues > 50%- Cycle time of Wafer Fab & EWS (Times theoretical):
AVG < 1.895% < 2.8- Scheduling and timely execution of key projects: execution > 90%
PEOPLE- Training: Adherence to training matrix > 70%- Timely execution of the empowerment roadmap > 90%- Social Climate Survey: Exceeding the average Country Norm > 10%
ENVIRONMENTAL, HEALTH & SAFETY- Adherence to Environmental Decalogue > 90%- Industrial accidents/year/100 employees > 0.5
I N F O R M A T I O N T E C H .Our Path to Excellence
POLICY DEPOLYMENT - LEVEL 11999 GOALS SUMMARY
PROFITABILITY- Manufacturing variance: Reduction of gap to WWS > 50%- Yearly growth rate productivity (WPP) > 15%- Inventory turn increase (Direct & Indirect material and Spare parts) > 50%
QUALITY- Process parameters Cpk: Reduction of gap to targetCpk >1.33 Target 100% > 80%
Cpk >1.67 Target 95% > 50%- Do variance: Reduction of gap to WWS (0.01 D/cm2/lev) >50%- WLR: % of failures on std Tests performed < 1%
MANUFACTURING- OOE of equipment bottlenecks > 80%- Fab Yield loss/mask level (ppm) < 1500
CUSTOMER SATISFACTION & SERVICE- Reduction of Customers Complaints for FE issues > 50%- Cycle time of Wafer Fab & EWS (Times theoretical):
AVG < 1.895% < 2.8- Scheduling and timely execution of key projects: execution > 90%
PEOPLE- Training: Adherence to training matrix > 70%- Timely execution of the empowerment roadmap > 90%- Social Climate Survey: Exceeding the average Country Norm > 10%
ENVIRONMENTAL, HEALTH & SAFETY- Adherence to Environmental Decalogue > 90%- Industrial accidents/year/100 employees > 0.5
F I N A N C E Our Path to Excellence
POLICY DEPOLYMENT - LEVEL 11999 GOALS SUMMARY
PROFITABILITY- Manufacturing variance: Reduction of gap to WWS > 50%- Yearly growth rate productivity (WPP) > 15%- Inventory turn increase (Direct & Indirect material and Spare parts) > 50%
QUALITY- Process parameters Cpk: Reduction of gap to targetCpk >1.33 Target 100% > 80%Cpk >1.67 Target 95% > 50%- Do variance: Reduction of gap to WWS (0.01 D/cm2/lev) >50%
- WLR: % of failures on std Tests performed < 1%
MANUFACTURING- OOE of equipment bottlenecks > 80%- Fab Yield loss/mask level (ppm) < 1500
CUSTOMER SATISFACTION & SERVICE- Reduction of Customers Complaints for FE issues > 50%- Cycle time of Wafer Fab & EWS (Times theoretical):
AVG < 1 .895% < 2 .8- Scheduling and timely execution of key projects: execution > 90%
PEOPLE- Training: Adherence to training matrix > 70%- Timely execution of the empowerment roadmap > 90%- Social Climate Survey: Exceeding the average Country Norm > 10%
ENVIRONMENTAL, HEALTH & SAFETY- Adherence to Environmental Decalogue > 90%- Industrial accidents/year/100 employees > 0 .5
H U M A N R E S O U R C E Our Path to Excellence
POLICY DEPOLYMENT - LEVEL 11999 GOALS SUMMARY
PROFITABILITY- Manufacturing variance: Reduction of gap to WWS > 50%- Yearly growth rate productivity (WPP) > 15%- Inventory turn increase (Direct & Indirect material and Spare parts) > 50%
QUALITY- Process parameters Cpk: Reduction of gap to targetCpk >1.33 Target 100% > 80%
Cpk >1.67 Target 95% > 50%- Do variance: Reduction of gap to WWS (0.01 D/cm2/lev) >50%- WLR: % of failures on std Tests performed < 1%
MANUFACTURING- OOE of equipment bottlenecks > 80%- Fab Yield loss/mask level (ppm) < 1500
CUSTOMER SATISFACTION & SERVICE- Reduction of Customers Complaints for FE issues > 50%- Cycle time of Wafer Fab & EWS (Times theoretical): AVG < 1.8
95% < 2.8- Scheduling and timely execution of key projects: execution > 90%
PEOPLE- Training: Adherence to training matrix > 70%- Timely execution of the empowerment roadmap > 90%- Social Climate Survey: Exceeding the average Country Norm > 10%
ENVIRONMENTAL, HEALTH & SAFETY- Adherence to Environmental Decalogue > 90%- Industrial accidents/year/100 employees > 0.5
T Q M - N V G Our Path to Excellence
POLICY DEPOLYMENT - LEVEL 11999 GOALS SUMMARY
PROFITABILITY- Manufacturing variance: Reduction of gap to WWS > 50%- Yearly growth rate productivity (WPP) > 15%- Inventory turn increase (Direct & Indirect material and Spare parts) > 50%
QUALITY- Process parameters Cpk: Reduction of gap to targetCpk >1.33 Target 100% > 80%Cpk >1.67 Target 95% > 50%
- Do variance: Reduction of gap to WWS (0.01 D/cm2/lev) >50%- WLR: % of failures on std Tests performed < 1%
MANUFACTURING- OOE of equipment bottlenecks > 80%- Fab Yield loss/mask level (ppm) < 1500
CUSTOMER SATISFACTION & SERVICE- Reduction of Customers Complaints for FE issues > 50%- Cycle time of Wafer Fab & EWS (Times theoretical):AVG < 1.8
95% < 2.8- Scheduling and timely execution of key projects: execution > 90%
PEOPLE- Training: Adherence to training matrix > 70%- Timely execution of the empowerment roadmap > 90%- Social Climate Survey: Exceeding the average Country Norm > 10%
ENVIRONMENTAL, HEALTH & SAFETY- Adherence to Environmental Decalogue > 90%- Industrial accidents/year/100 employees > 0.5
T Q M - M P G
Our Path to ExcellenceCFM POLICY DEPOLYMENT - LEVEL 1
1999 GOALS SUMMARY
PROFITABILITY- Manufacturing variance: Reduction of gap to WWS > 50%- Yearly growth rate productivity (WPP) > 15%- Inventory turn increase (Direct & Indirect material and Spare parts) > 50%
QUALITY- Process parameters Cpk: Reduction of gap to target
Cpk >1.33 Target 100% > 80%Cpk >1.67 Target 95% > 50%- Do variance: Reduction of gap to WWS (0.01 D/cm2/lev) >50%- WLR: % of failures on std Tests performed < 1%
MANUFACTURING- OOE of equipment bottlenecks > 80%- Fab Yield loss/mask level (ppm) < 1500
CUSTOMER SATISFACTION & SERVICE- Reduction of Customers Complaints for FE issues > 50%- Cycle time of Wafer Fab & EWS (Times theoretical):
AVG < 1.895% < 2.8- Scheduling and timely execution of key projects: execution > 90%
PEOPLE- Training: Adherence to training matrix > 70%- Timely execution of the empowerment roadmap > 90%- Social Climate Survey: Exceeding the average Country Norm > 10%
ENVIRONMENTAL, HEALTH & SAFETY- Adherence to Environmental Decalogue > 90%- Industrial accidents/year/100 employees > 0.5
T Q M - C M G Our Path to Excellence
CFM POLICY DEPOLYMENT - LEVEL 11999 GOALS SUMMARY
PROFITABILITY- Manufacturing variance: Reduction of gap to WWS > 50%- Yearly growth rate productivity (WPP) > 15%- Inventory turn increase (Direct & Indirect material and Spare parts) > 50%
QUALITY- Process parameters Cpk: Reduction of gap to targetCpk >1.33 Target 100% > 80%
Cpk >1.67 Target 95% > 50%- Do variance: Reduction of gap to WWS (0.01 D/cm2/lev) >50%- WLR: % of failures on std Tests performed < 1%
MANUFACTURING- OOE of equipment bottlenecks > 80%- Fab Yield loss/mask level (ppm) < 1500
CUSTOMER SATISFACTION & SERVICE- Reduction of Customers Complaints for FE issues > 50%- Cycle time of Wafer Fab & EWS (Times theoretical):AVG < 1.8
95% < 2.8- Scheduling and timely execution of key projects: execution > 90%
PEOPLE- Training: Adherence to training matrix > 70%- Timely execution of the empowerment roadmap > 90%- Social Climate Survey: Exceeding the average Country Norm > 10%
ENVIRONMENTAL, HEALTH & SAFETY- Adherence to Environmental Decalogue > 90%- Industrial accidents/year/100 employees > 0.5
T Q M - T P A
Our Path to ExcellencePOLICY DEPOLYMENT - LEVEL 1
1999 GOALS SUMMARY
PROFITABILITY- Manufacturing variance: Reduction of gap to WWS > 50%- Yearly growth rate productivity (WPP) > 15%- Inventory turn increase (Direct & Indirect material and Spare parts) > 50%
QUALITY- Process parameters Cpk: Reduction of gap to targetCpk >1.33 Target 100% > 80%Cpk >1.67 Target 95% > 50%- Do variance: Reduction of gap to WWS (0.01 D/cm2/lev) >50%
- WLR: % of failures on std Tests performed < 1%
MANUFACTURING- OOE of equipment bottlenecks > 80%- Fab Yield loss/mask level (ppm) < 1500
CUSTOMER SATISFACTION & SERVICE- Reduction of Customers Complaints for FE issues > 50%- Cycle time of Wafer Fab & EWS (Times theoretical):
AVG < 1.895% < 2.8- Scheduling and timely execution of key projects: execution > 90%
PEOPLE- Training: Adherence to training matrix > 70%- Timely execution of the empowerment roadmap > 90%- Social Climate Survey: Exceeding the average Country Norm > 10%
ENVIRONMENTAL, HEALTH & SAFETY- Adherence to Environmental Decalogue > 90%- Industrial accidents/year/100 employees > 0.5
STEERING
COMMITTEE
AMERICAS OBJECTIVES
OBJECTIVE 7
OWNER
AMERICAS OBJECTIVES
OBJECTIVE 24
OWNER
AMERICAS OBJECTIVES
OWNER
OBJECTIVE 25
AMERICAS OBJECTIVES
OWNER
OBJECTIVE 8
GROUP
AMERICAS G
&A
MANUFACTURING
AMERICAS BUSINESSGROUPS
AMERICAS REGIONALFUNCTIONS
AMERICASMANUFACTURING SITES
Figure 2.1B – Policy Deployment Concept
Step 4: Information from the first three steps and the proposed segment strategies help determine and prioritize regional objectives and combine them into the yearly operating budget. The budget includes yearly sales objectives, expenses, R&D investments, manufacturing targets, quality and environmental strategies, and human resources. It also includes allocations for longer-term goals such as capacity expansion, new product development, personnel hiring, and training.
Step 5: Region Americas’ operating budget is rolled up at the corporate level along with the other ST regions. These bottom-up plans are reviewed by corporate management for alignment between regions and business groups.
Step 6: Implementation is managed using the Policy Deployment methodology (Figure 2.1B). Each business entity provides their key goals to support the corporate, regional, and segment strategies. These inputs are compiled into a set of regional goals by the Steering Committee for the Regional Top Page. The Steering Committee selects owners who have the tasks of deploying the policy (goals) into the organization, tracking performance, and reporting status.
Step 7: Key goals are monitored at least monthly through operational reviews and reports from the lowest level of responsibility up to the Regional Steering Committee.
Step 8: Throughout the year, when reviews indicate a change in performance or in plan, the Steering Committee reviews the original goals and, if necessary, launches contingency actions to ensure rapid adaptation to the change. Execution of the plan is also guided by a set of Contingency Reactions for rapid re-deployment of resources as needed.
Step 9: As the strategic plan is carried out, deviations from the original goals are expected. We must have a dynamic plan that can adapt to rapidly changing business conditions. We use horizontal and vertical communication to keep a continuous, vigilant eye on the plan and environment.
2.1b Strategic objectives As a result of our Vision 200x process, we reconfirmed our strategic objectives because they focus us on the most important factors for our business. The Strategic Planning process is designed to support and reinforce these objectives.
2.2 Strategy Deployment The Policy Deployment approach is used to develop action plans from the Region level and cascade down to the team or individual level action plan. The lowest level Top Pages roll up to support each successive level. Current strategic plans are summarized in our Region Americas’ Top Page (Figure 2.2A) . The plan outlines objectives, strategies, measures, and

1999 MBNQA Application Abstract
6
Corporate Region Americas
Company Objectives Region Americas Strategies Measurables Objectives -Financial - RONA - Exp/Sales - Exp/Sales (%) (Region) (Includes Mktg./Sales, G&A, Logistics)
- COGS - Standard Margin (%) - Direct Mfg. Variance - Asset Mgmt - Inventory Turns - F. Goods Obsoles. (mil$ Write-off) - Receivables (days of sales)
-Growth - Sales - Sales - Billings ($M) Domestic - Billings ($M) WW total - Market Share - Market Share - Market Share (%) Domestic - R & D - # Patents Filed/Issued - Staffing/Retention - Employee Retention - Turnover (Tot%) - Recruitment - "Freshouts" Hires (%) - Cycle Time to Hire in days (Ex/NEx) - Cost of New Recruits (Exempts) - Service/Quality - Customer Satisfaction - Customer Perception - Customer Score Card Ave (^) - Quality - RMAs (Technical - % of NSB)
-Social - TQM - Employee Satisfaction - Climate Survey (Cat's > U.S. Norm) - Employee Empowerment - Training - Avg Training hours per employee - Energy Efficiency - Power Consumption - Kw-hr per 6" Equiv. Wafer Out - Paper Consumption - LBS per Employee -Community Involve - Corp Image - Name Recognition - Communication - Employee Awareness - Community Action - # Community Initiatives Supported -Compliance - OSHA/Safety - OSHA reportable accident rate - EEOC - # Founded Charges - Year 2000 Compliance - Compliance plans % complete
Figure 2.2A – Region Americas Top Page
performance. Key program owners are assigned to each objective and current performance is tracked to targets.
Human resource requirements to achieve the 1999 “action plan” (Top Page) are defined as are other corporate and individual requirements in three categories, i.e., Quantity, Capabilities, and Motivation. HR maintains their own Top Page plan that summarizes the specific activities required to meet the needs of the strategic plan. All resources (human, financial, and physical assets) are allocated during the budgeting session to support existing and new programs.
Key performance measures are cascaded to each operational unit, which in turn sets lower-level objectives and measures in support of the macro levels. On each operational unit Top Page, measures are in the same format as Region Americas’.
Alignment through communication and deployment of the strategic objectives is the ultimate purpose of our Policy Deployment. The Top Pages are posted in all sites and on each department and team bulletin board. Each staff member holds regular staff meetings with his/her reports to cascade the objectives and the implementation of action plans in support of the objectives for their area. During the same meeting, results are analyzed and discussed for continuous implementation until the objectives are met or exceeded. Our five to seven year plans and goals from our Vision 2000 cover the following areas:
1. Growth 6. Execution/Cycle Time 2. Market Share 7. Service 3. Expenses/Sales 8. Quality/Reliability 4. Innovation 9. Profit 5. Manufacturing Efficiency 10. Employee Satisfaction
CCaatteeggoorryy 33 –– CCUUSSTTOOMMEERR AANNDD MMAARRKKEETT FFOOCCUUSS
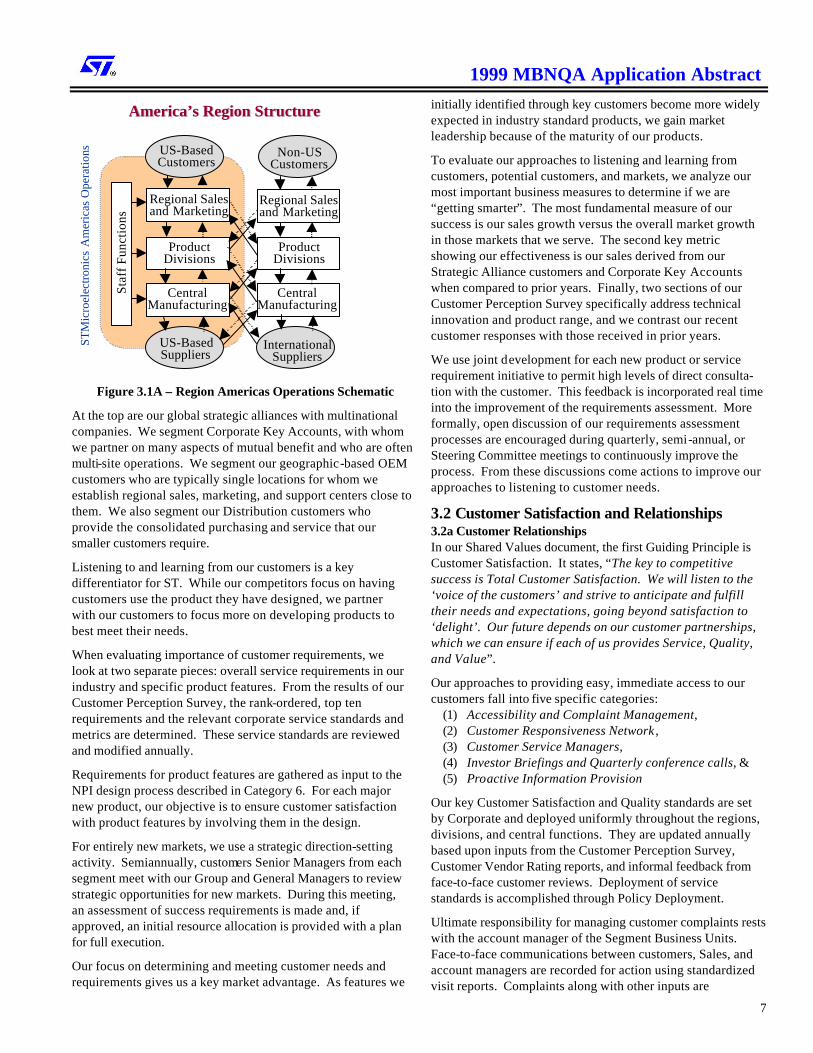
3.1 Customer and Market Knowledge ST Corporate maintains an international perspective to its operations and, as such, manages their business flow as a single, integrated entity. Our part of that integrated business flow is managed independently by us, but with a natural, broad view of the market as seen in Figure 3.1A. Our Marketing and Sales groups focus on establishing the needs and building relationships with our US-based customers for their facilities here and abroad.
Our approach to segmentation is to identify those groups of customers with generally common needs and characteristics. We have determined that a tiered, or matrix, approach to customer segmentation provides the greatest understanding of their needs. Customers are segmented by industry, which provides a product type split. Within these segments, we break customers into specific “tiers” for further segmentation.
1999 MBNQA Application Abstract
7
Staf
f Fu
ncti
ons
US-BasedCustomers
US-BasedSuppliers
Regional Salesand Marketing
ProductDivisions
CentralManufacturing
InternationalSuppliers
Non-USCustomers
Regional Salesand Marketing
ProductDivisions
CentralManufacturing
America’s Region StructureAmerica’s Region Structure
STM
icro
elec
tron
ics
Am
eric
as O
pera
tions
Figure 3.1A – Region Americas Operations Schematic
At the top are our global strategic alliances with multinational companies. We segment Corporate Key Accounts, with whom we partner on many aspects of mutual benefit and who are often multi-site operations. We segment our geographic-based OEM customers who are typically single locations for whom we establish regional sales, marketing, and support centers close to them. We also segment our Distribution customers who provide the consolidated purchasing and service that our smaller customers require.
Listening to and learning from our customers is a key differentiator for ST. While our competitors focus on having customers use the product they have designed, we partner with our customers to focus more on developing products to best meet their needs.
When evaluating importance of customer requirements, we look at two separate pieces: overall service requirements in our industry and specific product features. From the results of our Customer Perception Survey, the rank-ordered, top ten requirements and the relevant corporate service standards and metrics are determined. These service standards are reviewed and modified annually.
Requirements for product features are gathered as input to the NPI design process described in Category 6. For each major new product, our objective is to ensure customer satisfaction with product features by involving them in the design.
For entirely new markets, we use a strategic direction-setting activity. Semiannually, customers Senior Managers from each segment meet with our Group and General Managers to review strategic opportunities for new markets. During this meeting, an assessment of success requirements is made and, if approved, an initial resource allocation is provided with a plan for full execution.
Our focus on determining and meeting customer needs and requirements gives us a key market advantage. As features we
initially identified through key customers become more widely expected in industry standard products, we gain market leadership because of the maturity of our products.
To evaluate our approaches to listening and learning from customers, potential customers, and markets, we analyze our most important business measures to determine if we are “getting smarter”. The most fundamental measure of our success is our sales growth versus the overall market growth in those markets that we serve. The second key metric showing our effectiveness is our sales derived from our Strategic Alliance customers and Corporate Key Accounts when compared to prior years. Finally, two sections of our Customer Perception Survey specifically address technical innovation and product range, and we contrast our recent customer responses with those received in prior years.
We use joint development for each new product or service requirement initiative to permit high levels of direct consulta-tion with the customer. This feedback is incorporated real time into the improvement of the requirements assessment. More formally, open discussion of our requirements assessment processes are encouraged during quarterly, semi-annual, or Steering Committee meetings to continuously improve the process. From these discussions come actions to improve our approaches to listening to customer needs.
3.2 Customer Satisfaction and Relationships 3.2a Customer Relationships In our Shared Values document, the first Guiding Principle is Customer Satisfaction. It states, “The key to competitive success is Total Customer Satisfaction. We will listen to the ‘voice of the customers’ and strive to anticipate and fulfill their needs and expectations, going beyond satisfaction to ‘delight’. Our future depends on our customer partnerships, which we can ensure if each of us provides Service, Quality, and Value”.
Our approaches to providing easy, immediate access to our customers fall into five specific categories:
(1) Accessibility and Complaint Management, (2) Customer Responsiveness Network , (3) Customer Service Managers, (4) Investor Briefings and Quarterly conference calls, & (5) Proactive Information Provision
Our key Customer Satisfaction and Quality standards are set by Corporate and deployed uniformly throughout the regions, divisions, and central functions. They are updated annually based upon inputs from the Customer Perception Survey, Customer Vendor Rating reports, and informal feedback from face-to-face customer reviews. Deployment of service standards is accomplished through Policy Deployment.
Ultimate responsibility for managing customer complaints rests with the account manager of the Segment Business Units. Face-to-face communications between customers, Sales, and account managers are recorded for action using standardized visit reports. Complaints along with other inputs are

1999 MBNQA Application Abstract
8
aggregated and communicated through the weekly Briefing Room Report (BRR) for broad dissemination across group and division managers and corporate staff entities. Informal complaints are specifically addressed and monitored by the team involved in the specific issue resolution.
We approach loyalty and relationships building with our customers through a very simple concept – we listen to our customers and give our best attention to their needs and inputs. We have six key corporate accounts with whom we have established Global Strategic Alliances. In addition to these accounts, we also have 20 top key segment accounts that provide more than 50% of our total business.
These customers have dedicated Account Executives and have regular and open access to our senior management, design and technology resources, and production capacity. Our CEO and Corporate VP exchange frequent visits with them to establish close working relationships.
Through ongoing involvement with customers, surveys, customer vendor ratings, internal measures of performance, customer behaviors, and through ongoing comparisons to competitors, we continuously identify ways to build stronger relationships. In many cases, modifications to our approaches can be immediately implemented. When the modification is more global or involved, we plan and implement changes through Policy Deployment to ensure fast action. Many remarkable improvements have been made.
3.2b Customer Satisfaction Determination There are five formal, mature processes in place to determine customer satisfaction levels: § Customer Perception Surveys § Customer Vendor Rating Reports § Customer Awards and Accolades
§ Customer Audits § Visits to/by customers
Also, since our initial public offering of stock in December 1994, we have collected measures of Investment Community Satisfaction by tracking company valuation, growth in Analyst Coverage, and the change in their buy recommendations.
We have performed standardized Customer Perception Surveys since 1986 as the primary vehicle for formal customer satisfaction determination. Annually, we survey a significant proportion of our entire worldwide customer base. The survey reflects matters of importance to our customers and closely matches the structure and content of surveys performed by independent industry analysts. We keep the survey base consistent from year to year to facilitate valid comparisons over time. We ask customers to rate us on our performance and that of our competitors. We also ask questions designed to reflect future buying intentions. Feedback also comes through customer scorecards, audits, and awards.
We have direct one-on-one contact with our customers daily, weekly, monthly and quarterly at all levels of the organization, allowing us to follow-up on every step and action we take. Each of our customers and channels has assigned sales engineers, key account executives, and geographic sales
and/or franchise managers who determine our customer’s product and service needs and follow-up on all transactions. Also, monthly or quarterly reviews provide a forum for follow-up with key customers and distributors.
In order to provide detailed comparisons of our performance in areas of importance to customers, every question in the Customer Perception Survey is asked in comparison to the best competitor for that criterion and the relative importance of that criterion to the customer. We gather additional comparative data through periodic, external, third-party surveys and industry information to determine customer satisfaction relative to our competitors.
To keep our methods of customer satisfaction determination current, we continuously improve our measurement systems through Customer Perception Surveys and Direct Contacts, Customer Audits, and various methods of self-examination.
Developing strong relationships with our customers is a way of life for us. Participation as a partner is a key differentiator in our fast-paced industry and, by establishing shared values and driving improvements through joint teams, we have enhanced customer loyalty. This is also true in the Investor Community, where trust developed only through years of consistent, accurate, and “no-surprise” information.
CCaatteeggoorryy 44 –– IINNFFOORRMMAATTIIOONN AANNDD AANNAALLYYSSIISS
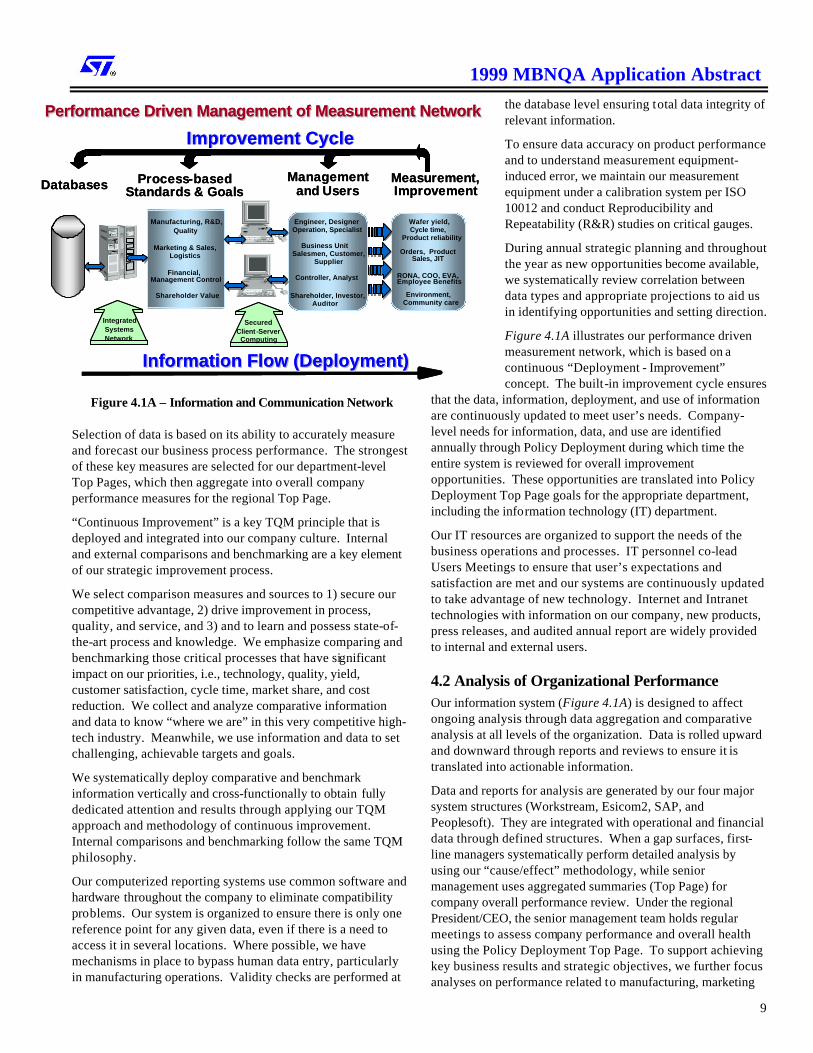
4.1 Measurement of Organizational Performance One of our five key TQM principles is “Fact-Based Decision Making”. Our state-of-the-art information and communication network (Figure 4.1A) effectively supports fact-based performance measurement of the company.
Information and data are selected specifically to measure the performance of all business activities at all levels of the company to allow for continuous improvement. Our Policy Deployment process further drives this selection process. The Top Page for individual departments is their defined key process and activity measures. The Region Americas Top Page then is an integrated summary of key company indicators from all departments. Each organization level, together with its vision and mission statements, has a set of requirements (i.e., expense, budget, output, and standards) so as to effectively measure performance and prioritize focus and resources for opportunities to achieve excellence.
The comprehensive sets of measurements and indicators are the platform for assessing the company in all areas and at all levels with regard to our short-, medium-, and long-term objectives and plans.
Indicators are selected by time sensitivity to provide man-agement and employees with earliest course correction con-trols for meeting our goals. Indicator time-spans range from “real time” monitoring to annual evaluation of performance.
1999 MBNQA Application Abstract
9
Figure 4.1A – Information and Communication Network
Selection of data is based on its ability to accurately measure and forecast our business process performance. The strongest of these key measures are selected for our department-level Top Pages, which then aggregate into overall company performance measures for the regional Top Page.
“Continuous Improvement” is a key TQM principle that is deployed and integrated into our company culture. Internal and external comparisons and benchmarking are a key element of our strategic improvement process.
We select comparison measures and sources to 1) secure our competitive advantage, 2) drive improvement in process, quality, and service, and 3) and to learn and possess state-of-the-art process and knowledge. We emphasize comparing and benchmarking those critical processes that have significant impact on our priorities, i.e., technology, quality, yield, customer satisfaction, cycle time, market share, and cost reduction. We collect and analyze comparative information and data to know “where we are” in this very competitive high-tech industry. Meanwhile, we use information and data to set challenging, achievable targets and goals.
We systematically deploy comparative and benchmark information vertically and cross-functionally to obtain fully dedicated attention and results through applying our TQM approach and methodology of continuous improvement. Internal comparisons and benchmarking follow the same TQM philosophy.
Our computerized reporting systems use common software and hardware throughout the company to eliminate compatibility problems. Our system is organized to ensure there is only one reference point for any given data, even if there is a need to access it in several locations. Where possible, we have mechanisms in place to bypass human data entry, particularly in manufacturing operations. Validity checks are performed at
the database level ensuring total data integrity of relevant information.
To ensure data accuracy on product performance and to understand measurement equipment-induced error, we maintain our measurement equipment under a calibration system per ISO 10012 and conduct Reproducibility and Repeatability (R&R) studies on critical gauges.
During annual strategic planning and throughout the year as new opportunities become available, we systematically review correlation between data types and appropriate projections to aid us in identifying opportunities and setting direction.
Figure 4.1A illustrates our performance driven measurement network, which is based on a continuous “Deployment - Improvement” concept. The built-in improvement cycle ensures
that the data, information, deployment, and use of information are continuously updated to meet user’s needs. Company-level needs for information, data, and use are identified annually through Policy Deployment during which time the entire system is reviewed for overall improvement opportunities. These opportunities are translated into Policy Deployment Top Page goals for the appropriate department, including the information technology (IT) department.
Our IT resources are organized to support the needs of the business operations and processes. IT personnel co-lead Users Meetings to ensure that user’s expectations and satisfaction are met and our systems are continuously updated to take advantage of new technology. Internet and Intranet technologies with information on our company, new products, press releases, and audited annual report are widely provided to internal and external users.
4.2 Analysis of Organizational Performance Our information system (Figure 4.1A) is designed to affect ongoing analysis through data aggregation and comparative analysis at all levels of the organization. Data is rolled upward and downward through reports and reviews to ensure it is translated into actionable information.
Data and reports for analysis are generated by our four major system structures (Workstream, Esicom2, SAP, and Peoplesoft). They are integrated with operational and financial data through defined structures. When a gap surfaces, first-line managers systematically perform detailed analysis by using our “cause/effect” methodology, while senior management uses aggregated summaries (Top Page) for company overall performance review. Under the regional President/CEO, the senior management team holds regular meetings to assess company performance and overall health using the Policy Deployment Top Page. To support achieving key business results and strategic objectives, we further focus analyses on performance related to manufacturing, marketing
Databases Improvementand UsersStandards & Goals
Improvement CycleImprovement Cycle
Information Flow (Deployment)Information Flow (Deployment)
Measurement,ManagementProcess-based
Performance Driven Management of Measurement NetworkPerformance Driven Management of Measurement Network
IntegratedSystemsNetwork
SecuredClient -Server
Computing
Manufacturing, R&D,Quality
Marketing & Sales,Logistics
Financial,Management Control
Shareholder Value
Engineer, DesignerOperation, Specialist
Salesmen, Customer,Supplier
Controller, Analyst
Shareholder, Investor,Auditor
Business Unit
Wafer yield,
Product reliability
Orders, ProductSales, JIT
RONA, COO, EVA,Employee Benefits
Environment, Community care
Cycle time,

1999 MBNQA Application Abstract
10
and sales, HR, financial, product process, environmental, and our customers and suppliers.
Just as the Americas’ Policy Deployment Top Page is a key driver of organizational analysis, department-level Policy Deployment Top Pages drive workgroup-level analysis. We emphasize a bottom-up model, while a top-down approach is used only when senior level support is needed to smooth out complex cross-functional interfaces. We hold periodic operating reviews to draw plans for improvement using the Plan-Do-Check-Act cycle. Plans for different operations are established to prioritize and determine profit level, customer satisfaction, people actions, capex, process improvement, R&D projects, and G&A expenses to support our commitment to customer, corporate, and shareholder interest. Regardless of organizational level, at least four key sets of indicators are always being measured: actual, actual versus budget, actual versus previous period, and trends for the next three periods. Results of top-level analysis are deployed to operational levels through Policy Deployment to address organizational health and performance issues. Our systems are designed to strive for higher performance levels in our daily business. Online reports for analysis are available to support daily operations, reviews, and to empower our employees to take appropriate actions. Gung Ho and cross-functional Excellence Teams are set up to perform analysis to ensure actions and decisions are taken in the best interests of the company.
CCaatteeggoorryy 55 –– HHUUMMAANN RREESSOOUURRCCEE FFOOCCUUSS
5.1 Work Systems Our work systems are designed to support our company’s matrix structure by providing maximum flexibility. We are organized by Manufacturing, Marketing and Sales, and Product groups and are supported by Human Resources, Finance, Legal, and IT functions. Sixty percent of our employees work in the manufacturing division, which has driven our team-based approach to work and job design. Our work structure design is focused toward maximizing productivity, flexibility, and empowerment to facilitate our need to be cost competitive, agile, and high performing. Manufacturing teams are structured around natural work modules and are called Gung-Ho teams. Trained teams are organized in work team modules rather than the traditional line organization. Empowered steering committees made up of Manufacturing Section Managers were formed to review team progress and give team leaders guidance for further development. This is a major cultural change from a traditional top down management style to an enabling, participative culture. Employees manage their own work systems through multiple approaches. Teams determine their workflow,
assignments, break and lunch schedules, as well as time off. Team members conduct peer reviews that are incorporated into the formal performance reviews and merit increases. Managers and supervisors have been trained to coach, facilitate, and communicate rather than to direct and control the work. Through an outside consultant, we designed and taught “The Supervisor as a Coach” training, giving managers and supervisors guidance on how to encourage and motivate employees to utilize their full potential. In support services and the few plants where Gung Ho is not fully deployed, managers and supervisors support employee career progression through development plans based upon the job’s career ladder and employee career goals. A peer assessment process is in place for the teams in our Rancho Bernardo and Carrollton sites where peer evaluations account for 40% of the team members’ performance review (the remainder is based on 25% attendance and 35% team leader review). Annual development plans are part of each employee’s annual performance review and progress and performance are reviewed quarterly by their teams. Our compensation system supports job design by rewarding employees through pay increases and promotions as skills are developed and demonstrated. Our Manufacturing Certification rates are tracked to assure adequate cross training. The performance review system provides a documented record for rewarding merit increases for achievement of objectives and demonstration of skills. We added a variable pay element called the VIP program to encourage individual, team, unit, and company goal achievement. Production employees can receive a monthly bonus for performance to mutually established production objectives. All other employees are eligible for semiannual bonuses based on achievement of individual, team, or unit and company performance objectives. Executives participate in a Worldwide Corporate incentive plan weighted towards overall company results. Senior management and high-level, key contributors participate in a stock option program to provide a sense of ownership in company results. Additionally, several recognition events are in place to motivate employees. Communications are built into our work processes. To ensure continuity between shift changes, manufacturing team members conduct “pass-downs” to the next shift covering all major activities of their workday. A shift standup is then held in the clean room to relay pass-down information and to formulate the shift’s daily plan. Cross function communications occur through monthly de-partment meetings; quarterly executive staff meetings between the Product Divisions, Site Managers, and Support activities; and quarterly worldwide meetings of manufacturing site
1999 MBNQA Application Abstract
11
managers to discuss and plan improvements. Site newsletters include articles of interest regarding the company, employees, and activities. E-Flash (e-mail) is periodically distributed worldwide and includes information for all employees. ST uses a Regional team design approach for sharing best practices and developing new initiatives. Manufacturing team members, technicians, engineers, and support managers travel between sites to learn and share advanced technology, manufacturing, and service techniques. ST has continuously improved the employee selection process since 1996, when the Carrollton site initiated a job analysis project to develop success criteria and performance indicators. Phoenix and Rancho Bernardo formed employee Excellence Teams to develop job competencies and use behavioral interviewing techniques to rate applicants.
5.2 Education, Training, and Development In order to balance long- and short-term objectives of the organization and employee needs, we approach training and development on three tiers: worldwide initiatives, coordination of regional needs, and site-specific training. Worldwide initiatives provide leadership training specifically designed by us, which is the fundamental concept behind our STUniversity (STU) - “ST teaches ST”. ST also provides global training to meet common company needs and to support our LATCH and LEARN training focused on TQM deployment. STU training is open to partner organizations, suppliers, and customers. To reinforce an ongoing learning environment, we offer financial assistance to those employees completing job-related course work at local colleges and universities. At the site level, training departments are established to provide a variety of skill- and methods-related training. During training design, key considerations are the targeted participants and the training objectives. The STU instructor workshop teaches the methodology for designing and structuring the development of training courses. Training design is a continuous process based upon feedback from multiple sources. Employees have several communication tools to voice opinions and express concerns including those about needed training and training delivery. We deliver training through many mechanisms to all shifts, from classroom lecture to CBT and video. Where possible, course design includes practical applications with participant involvement. In-house and off-site facilities are used at all locations with employee content experts, training profes-sionals, and outside consultants as instructors. Training categories are company knowledge, job training, and skill improvement. All positions have formal job descriptions that include knowledge and education requirements plus the fundamental knowledge necessary to support our long-term planning. Training programs ensure employees have the skills
and tools necessary to meet our strategic challenges. All new hires attend New Hire Orientation. We have a large number of quality skills and tools courses in our training matrix starting with LATCH and LEARN Cascade. The most recent tools give our employees additional skills for addressing specific objectives such as TOPS (Team Oriented Problem Solving) and FMEA (Failure Mode and Effects Analysis). Other training includes QIT (Quality Improvement Team), QIP (Quality Improvement Process), TQI (Total Quality Improvement), SPC (Statistical Process Control), Process Management, Cycle Time, DOE (Design of Experiments), and BPM (Business Process Management), among others. To reinforce the use and development of new skills, we have employed basic reinforcement strategies. Training is provided just in time to ensure knowledge retention. A “peer pressure” approach is used through the Gung Ho team concept where a team is trained with the needed skills and, they support each other with collective knowledge. Where the new skills are applied directly to products in manufacturing, re-enforcement is achieved through skill re-certification on a predetermined schedule. Supervisors reinforce and promote new skills by coaching employees through projects and helping them understand application of skills .
5.3 Employee Well-being and Satisfaction 5.3a Work Environment We believe in a proactive, prevention-based approach to em-ployee health and safety as evidenced by our outstanding safety statistics. Our safety focus includes onsite health centers and safety programs, health services, ergonomic and industrial health programs, and regular workplace audits. Volunteers from all shifts serve on Emergency Response Teams to respond to health, chemical, and fire emergencies. 5.3b Employee Support Climate We provide many special services and benefits to support employee needs including break areas and a full-service cafeteria serving day and evening meals. We also support an employee driven activity called C.H.I.P (Creating Harmony In People), which was started in 1986. Our well-balanced benefits package includes medical, dental, vision, retirement, 401K, Employee Assistance Program, Family Medical Leave Act, Flexible Time Off, short- and long-term disability, life insurance, AD&D, spouse and child life, and flexible spending accounts for health and dependent care. 5.3c Employee Satisfaction We use a number of professionally developed external tools to evaluate employee satisfaction. Experts have identified the overall elements of work environment that most strongly affect employee satisfaction, well-being, and motivation. These experts work with us during their administration of the tools to identify those elements of our work environment most

1999 MBNQA Application Abstract
12
important to employees. We also gather information about current areas of importance from our ongoing roundtables and one-on-one employee interactions.
Each site’s HR teams and senior management conduct employee roundtables each month to openly discuss issues of employee concern. We target 96 sessions per year and accomplished 107 in 1998. Employees may correspond with any member of management, including the President, via e-mail. Our three manufacturing sites have open accounts, e.g., “Ask Jack” in Carrollton, for questions to the operations or HR manager.
Employees are also invited to participate in an annual em-ployee opinion survey called “Dialogue”. Each site formally reviews the results to develop action plans. Other satisfaction determinants are turnover, productivity, and information gained through roundtable discussions, skip-level discussions with senior leaders, and exit interviews.
Certain programs that were designed to improve employee morale or satisfaction have shown significant returns in business results. Since the implementation of our Gung Ho program, every financial and productivity index tracked by the company is going up. This is the most significant contributing factor in making us a “model site” for all of ST.
CCaatteeggoorryy 66 –– PPRROOCCEESSSS MMAANNAAGGEEMMEENNTT
6.1 Product and Service Processes Customer needs, manufacturability, and reliability are considered in the design process in order to assure our products meet customers expectations. We have a set of Standard Operating Procedures outlining the product life cycle. Major lifecycle steps are defined as Maturity levels: § Maturity 10 (Design/Development) § Maturity 20 (Evaluation/Characterization/Sampling) § Maturity 30 (Production Stabilization/Production) § Maturity 50 (Product Termination) § Maturity 60 (End of Commitment) § Maturity 90 (Obsolete)
Our procedures cover the entire product life cycle, but Maturity levels 10, 20, and 30 relate to our New Product Introduction (NPI) process (Figure 6.1A).
NPR Phase - The New Product Request (NPR) phase begins with initial concept and completes with a thorough product development plan containing business and technical details.
Maturity 10 Phase – After NPR approval, designers identify reusable design components from our macro libraries and design new ones where needed to fulfill the customers’ specific requirements. Maturity 10 is complete when the prototype is fully functional in the target application and the team and the customer sign the Design Approval Certificate.
Maturity 20 Phase – This phase is used to vigorously review the designed product for its compatibility with high volume manufacturing. It follows a set of well-defined criteria and guidelines, which are a “minimum” for the analysis of any
Feasibility
NPR Review
Design
Design Review 2
Maturity 20Maturity 20
Maturity 30Maturity 30 Production
PQC Approval
Review
Characterization &Reliability
Qualification Lots
DAC Approval
Wafer Evaluation
Layout Review
Layout
Design Review
NPR ApprovalNPR
DAC
PQC
Maturity 10Maturity 10
Figure 6.1A – Design (NPI) Process Flow
product. This cycle includes rigorous testing to evaluate the product design. Once product qualification and all required supporting documentation is complete, management approves the Product Qualification Certificate (PQC), allowing the new product to proceed to Production; i.e., our Maturity 30 Phase.
Ongoing customer input is formally captured as required steps in the design process. For more complicated projects, the program manager chairs regular weekly status reviews with the customer to ensure all requirements are understood and met.
If a new technology is chosen, the R&D groups are involved on the cross-functional team. Analysis of the technology

1999 MBNQA Application Abstract
13
choice becomes an integral part of the NPR. The introduction of new technology into production follows well-defined steps in company specifications.
Our design process has built-in evaluation by monitoring and tracking real-time performance measures to determine effectiveness. We similarly track performance of the production process continuously to identify effectiveness of design. When an area for improvement is identified, one of six types of approaches is used to improve the process.
The design of production processes consists of specification of controls and limits in production and materials used. Design of these specifications is conducted in all four steps of the NPI process and tested using prototypes. The purpose of the Maturity 20 phase is to qualify design compatibility with high volume manufacturing before ramping up production.
As Figure 6.1A shows, multiple design reviews are conducted throughout the lifecycle to ensure that members of each disci-pline and customer have thoroughly reviewed specifications and signed off. We use two advanced analysis and investigative tools, Failure Mode and Effects Analysis (FMEA) and then Design of Experiments (DOE), during the design phase to ensure product design is correct before we invest in the large-scale production of the product.
6.1b Production/Delivery Processes Figure 6.1B depicts our key production and delivery process steps with key requirements and in-process measures. In Process 1 we conduct masking, etching, diffusion, and metalization processes to produce finished die in wafer form. Because this process is conducted within our clean-room facilities, many procedures and process actions associated with this step are to ensure the absolute purity of the environment. Process 2 is the Electrical Wafer Sort – the first functional test of the product. This operation provides critical data for improving the wafer fabrication process. The remaining process steps are performed outside the Americas Region. Our products are shipped overseas for assembly and distribution and then to predetermined warehouses.
Process control and management are deeply integrated into our systems. All manufacturing plants are certified to ISO 9001 or ISO 9002 standards. We use Statistical Process Control (SPC) techniques supported by Computer Aided Manufacturing (CAM) software for data collection and analysis. Results from measurements and step inspections are recorded and fed back into the production line to control and improve processes; thus building in quality and process improvement during production.
The pillar of our built-in quality is that we extend the concept of SPC beyond the aspect of control to include prevention via FMEA and DOE. We also use Defect Density Control and Reduction, and Production Environment Control. Our objectives to minimize process variability are in-line process control, process capability (Cp) improvement, process variability (Cpk) minimization, anomalous lot elimination,
Wafer FabricationRequirements:
Cycle TimeConformance to SpecificationsOn-time Delivery
In-Process Measures :Inventory TurnsSPC, Out-of-Control
(Event Reaction)Daily Cost vs. MTDProductivity
Electrical Wafer Sort (Probing)Requirements:
Outgoing QualityYield Database
In-Process Measures :Average Outgoing Quality (AOQ)
Assembly and Testing(performed by other operating units)
1
2
4
3
Shipment to Customer
Process
Figure 6.1B – Production Delivery Process (Maturity 30)
and Cost of Non-Quality (CONQ) reduction. We extensively use EWMA (Exponential Weighted Moving Average) control charts to manage processes. Cycle time, or line speed, is measured on a daily basis . Manufacturing standards for the current and next year are determined and deployed annually through Policy Deployment. Performance measurement is made to these indices each shift, day, week, and month depending on the type of measure. Performance key to the improvement programs and standards is summarized by site and reported monthly. Key performance measures are cycle time, Cpk, on-time delivery, and manufacturing cost. All critical processes have an established improvement plan based on the Policy Deployment targets for these measures.
We use many sources to provide feedback and awareness of status and needed improvements in our processes. A primary improvement method is extensive benchmarking of key parameters. Data from 14 plants worldwide include cost, cycle time, process capability, and on-time delivery. The corporate WWS system establishes the best-known performance for our industry in service, quality, and manufacturing. We use this to analyze our gaps and determine areas for improvement.
6.2 Support Processes Our key support processes are Human Resources, Business Administration, Quality and Reliability, Financial Control, Information Technology, Legal/Intellectual Property, Sales and Marketing, and TQM and Business Management.
Key requirements, measures, and goals for the Business Support processes support strategic planning and Policy Deployment from input gathered during internal and external

1999 MBNQA Application Abstract
14
audits, internal and external customer requirements, industry standards, government regulations, and employee suggestions. These requirements are translated into corpo-rate-wide standards and deployed via Policy Deployment to receive the same focus as production processes.
All support processes are managed through the use of SOPs for tracking and analysis of key in-process measures defined during Policy Deployment. Corporate standards are set for high-level measures and through each organization creates a “Top Page” document outlining action plans with associated key measures and goals to support the corporate direction. Goals for key requirements are updated annually and monitored through monthly/quarterly reviews.
Like design and production processes, support processes are evaluated through customer input (internal and ext ernal), reviews of performance to plans, their effect on company operational results, and team process evaluations.
6.3 Supplier and Partnering Processes Each year we create/update our “Supplier Quality Business Plan” in which we highlight past year achievements and goals for the future. Our plan for coming-year audits, improvements, and objectives are outlined as a roadmap for our supplier management process.
Partnership with suppliers is a key strategic element in our Total Quality Management philosophy. We consider our suppliers as a part of our company; a partner with whom we have a common goal to succeed. It is this approach that has born partnership with suppliers in openness of information and shoulder-to-shoulder approach to solving problems. Figure 6.3A shows the supplier lifecycle.
SupplierTotal QualityManagement
Cycle
Specification
SupplierSelection
Qualification
Agreements
Contract
Production
PerformanceMonitoring
SupplierBenchmarking
ImprovementPrograms
Figure 6.3A – Supplier Quality Cycle
All key suppliers must have a quality system designed to en-sure products and services perform to, and exceed expected results. Our fundamental grading system for suppliers is the Materials Suppliers Quality Assurance (MSQA). Each type of supplier is given an attribute specification for materials,
equipment performance requirements for manufacturing equipment, and service agreement contract for services.
Each type of supplier is judged by application-specific meth-ods. Material suppliers are judged first through material qualification for our needs, and then assessed for their quality system using the MSQA questionnaire. Equipment suppliers are selected based on equipment performance and ability to re-spond. Their requirements are outlined in a very extensive set of performance, delivery, and support requirements. Partnership with our service suppliers is driven through service agreement contracts and standard approach.
Our systematic approach to supplier management is built around providing ongoing assistance to improve suppliers’ products and services through joint problem solving, provid-ing training, and awareness. Through our technology road-map, we work with suppliers in determining future technical needs. Each supplier then develops their roadmap based on their customer’s future needs.
All points of material influence on our products are evaluated through measures and benchmarking for continuous improve-ment. In effect, this is a constant and continuous cycle of establishing higher goals, evaluating methods of achieving the goals, and adjusting systems to improve probability for success.
CCaatteeggoorryy 77 –– BBUUSSIINNEESSSS RREESSUULLTTSS
7.1 Customer Focused Results One of our core strategies is close alliance with our strategic partners. By listening and learning from customers, we gain tremendous knowledge, not only from a technical point of view, but also in building relationships. The results are obvious from the superior 273% growth in sales over the last five years with our strategic customers (Figure 7.1A).
Strategic Customer Sales Growth
$0
$200
$400
$600
$800
$1,000
$1,200
$1,400
1994 1995 1996 1997 1998 1999
$M (Transnational Sales)
Figure 7.1A – Strategic Customer Sales Growth
Our Customer Perception Survey is a primary means of collecting data for improving our performance in those areas important to our customers. Each customer is asked to rank us on a scale of 1 to 10 (with 10 being “best”) on each category of the survey. The customer is then asked to select their best supplier for each of the same categories and rank them against
Good
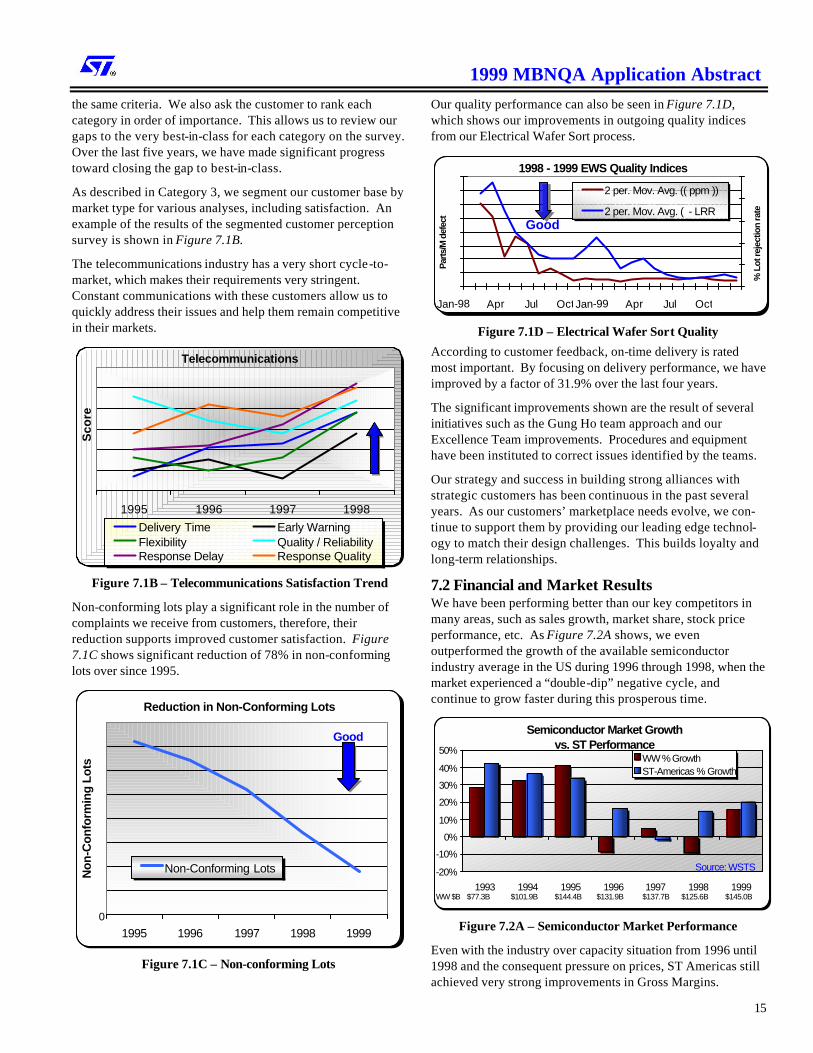
1999 MBNQA Application Abstract
15
the same criteria. We also ask the customer to rank each category in order of importance. This allows us to review our gaps to the very best-in-class for each category on the survey. Over the last five years, we have made significant progress toward closing the gap to best-in-class.
As described in Category 3, we segment our customer base by market type for various analyses, including satisfaction. An example of the results of the segmented customer perception survey is shown in Figure 7.1B.
The telecommunications industry has a very short cycle-to-market, which makes their requirements very stringent. Constant communications with these customers allow us to quickly address their issues and help them remain competitive in their markets.
Telecommunications
1995 1996 1997 1998
Sco
re
Delivery Time Early WarningFlexibility Quality / ReliabilityResponse Delay Response Quality
Figure 7.1B – Telecommunications Satisfaction Trend
Non-conforming lots play a significant role in the number of complaints we receive from customers, therefore, their reduction supports improved customer satisfaction. Figure 7.1C shows significant reduction of 78% in non-conforming lots over since 1995.
Reduction in Non-Conforming Lots
1995 1996 1997 1998 1999
Non
-Con
form
ing
Lots
Non-Conforming Lots
0
Good
Figure 7.1C – Non-conforming Lots
Our quality performance can also be seen in Figure 7.1D, which shows our improvements in outgoing quality indices from our Electrical Wafer Sort process.
1998 - 1999 EWS Quality Indices
0100200300400500600700800
Jan-98 Apr Jul OctJan-99 Apr Jul Oct
Parts
/M d
efec
t
0%
2%
4%
6%
8%
10%
% L
ot re
ject
ion
rate
2 per. Mov. Avg. (( ppm ))
2 per. Mov. Avg. ( - LRR(%))
Figure 7.1D – Electrical Wafer Sort Quality
According to customer feedback, on-time delivery is rated most important. By focusing on delivery performance, we have improved by a factor of 31.9% over the last four years.
The significant improvements shown are the result of several initiatives such as the Gung Ho team approach and our Excellence Team improvements. Procedures and equipment have been instituted to correct issues identified by the teams.
Our strategy and success in building strong alliances with strategic customers has been continuous in the past several years. As our customers’ marketplace needs evolve, we con-tinue to support them by providing our leading edge technol-ogy to match their design challenges. This builds loyalty and long-term relationships.
7.2 Financial and Market Results We have been performing better than our key competitors in many areas, such as sales growth, market share, stock price performance, etc. As Figure 7.2A shows, we even outperformed the growth of the available semiconductor industry average in the US during 1996 through 1998, when the market experienced a “double-dip” negative cycle, and continue to grow faster during this prosperous time.
Semiconductor Market Growth vs. ST Performance
-20%
-10%
0%
10%
20%
30%
40%
50%
1993 1994 1995 1996 1997 1998 1999
WW % Growth
ST-Americas % Growth
$77.3B $101.9B $144.4B $131.9B $137.7B $125.6BWW $B $145.0B
Source: WSTS
Figure 7.2A – Semiconductor Market Performance
Even with the industry over capacity situation from 1996 until 1998 and the consequent pressure on prices, ST Americas still achieved very strong improvements in Gross Margins.
Good

1999 MBNQA Application Abstract
16
Significant emphasis has been placed in our industry on reduction of Sales and Marketing and G&A expenses to sales ratio in order to continue to reduce costs to meet price demands. Our ratio has remained consistently low from 1994 to 1996, and consistent from 1997 to 1999. In fact, our S/G&A ratios were lower than the average of our key competitors throughout this period as shown in Figure 7.2B.
Sales, G&A Expense to Sales Ratio
0%
2%
4%
6%
8%
10%
12%
14%
16%
18%
1994 1995 1996 1997 1998 1999
ST 7 Key Competitors
Figure 7.2B – Expense to Sales
Reduced costs, superior technology, improved processes, and trained, motivated people are key contributors to our success and productivity. A key measure of productivity is sales per head trend. Figure 7.2C shows our improvement and significant performance over the Semiconductor Industry Association (SIA) average, as well as competitors’ average.
ST Sales Per Head vs. SIA and Competitors
0
100
200
300
400
500
600
1993
1994
1995
1996
1997
1998
1999
$KSales AmericasSales SIAMajor Competitors
(An
nu
alize
d)
Figure 7.2C – Sales per Head
Our long-term financial objectives are to be a profitable and viable company. Through our excellent customer relationships and the strength of our internal processes, we are able to maintain a best-in-class level in our industry for Accounts Receivable collections (Figure 7.2D).
Another contributing factor to our profitability and viability is our strong control and efficiencies in inventory usage. Figure 7.2E shows that our Inventory Turns Management is under tight control and is consistently improving.
Trade Receivable Collections
0
10
20
30
40
50
60
1996 1997 1998 1999
Day
s
ST Dunn & Bradstreet
Figure 7.2D – Receivable Collection
Inventory Turns Management
6
7
8
9
10
11
12
13
1996 1997 1998 1999
# T
urn
s
ST - Turns Dunn and Bradstreet
Figure 7.2E – Inventory Management
Region Americas US market share continues to grow at a rapid rate. As Figure 7.2F shows, we have increased our market share from 1.88 % in 1991 to 2.63 % in 1999. This represents a 39% increase. While 1995 showed a temporary dip in our market share growth, our overall growth trend is healthy and continues to improve as seen in Figure 7.2G. This figure also shows our even more outstanding performance in sales growth when viewed in comparison to our key competitors.
Americas Billings and Market Share
0
200
400
600
800
1,000
1,200
1,400
1991 1992 1993 1994 1995 1996 1997 1998 1999
Bill
ings
$M
1.0%
1.5%
2.0%
2.5%
% M
kt. S
hare
Billings Mkt Share
Good
Figure 7.2F – Market Share
Good
Good

1999 MBNQA Application Abstract
17
Relative Sales Growth Normalized from 1995 Sales
-10%
-5%
0%
5%
10%
15%
20%
25%
30%
1996 1997 1998 Q3-99
Composite of 7 Major Competitors ST
Figure 7.2G – Sales Growth
Figure 7.2H reflects our consistent increase in sales of differentiated products and growth of market share in this market since 1994. This results in our total sales growth and increasing market share as shown in Figure 7.2F.
Focus on Differentiated Products
0%
10%
20%
30%
40%
50%
60%
70%
1994 1995 1996 1997 1998 1999
% D
iff.
Pro
du
cts
of
Sal
es
0%
2%
4%
6%
8%
10%
12%
14%
16%
% o
f D
iff.
Pro
du
cts
Mrk
t
% Sales % MKT. Share
(new computation
started in 1999 for %
market share based
on new product mix)
Figure 7.2H – Differentiated Product Sales
7.3 Human Resource Results Figure 7.3A shows the percentage of operators certified in multiple job functions, which allows for greater manufacturing flexibility and efficiencies. The percentage figure shown indicates the amount of operators certified to perform the number of job functions indicated by the number following the “OCR” designation (Operator Certification Rate).
CARN Fab CARN EWS R.B. Fab PHX Fab OCR 1 100% 100% 99% 98% OCR 2 95% 94% 97% 95% OCR 3 85% 88% 86% 88% OCR 4 74% 85% 72% 77% CARN = Carrollton, R.B. = Rancho Bernardo, PHX = Phoenix
OCR = Operator Certification Rate Figure 7.3A – Certified Operators
Figure 7.3B shows our high average training hours per employee through the last four years, which is reflected in our manufacturing productivity improvements.
Training Hours per Person
0
10
20
30
40
50
60
70
80
90
1995 1996 1997 1998 1999
Avg Hours Goal
Figure 7.3B – Training Hours
A strong indicator of employee satisfaction is employee retention. While the national benchmark, Saratoga, continues to trend up (64% over three years) in voluntary turnover rates because of the tightening labor market, ST continues a downward trend with a reduction of 39% over five years.
Figure 7.3C shows increasing participation in STU training and the breakout for each category during the last three years. Categories of training we provide each year are clearly driven by our organization needs defined in our annual Policy Deployment.
0
100
200
300
400
500
600
700
800
900
Nu
mb
er
1997 1998 1999
STU Participants from Region Americas
Tools and Meth.Personal Dev.TechnicalManagement
Figure 7.3C – STU Participants
A major contributor to this satisfaction is internal promotions. We have shown a consistent promotion rate above 20%, in spite of the growing census during the last four years.
Internal referral rate is also an indicator of employee satisfaction in that employees feel comfortable enough with the work climate at our company to refer their friends and relatives to work here. Over 30% of new hires for the last four years were referred by ST employees.
Our team approach is especially important when moving to a flatter organization to allow increased responsibility deeper into the organization. The organizational trend in the Region has resulted in an increase in the overall number of operators per supervisor by almost double from 1995 to 1999, as seen in Figure 7.3D.
Good
Good
Good
Good

1999 MBNQA Application Abstract
18
Flat Organization
0
2
4
6
8
10
12
14
16
1995 1996 1997 1998 1999
Op
erat
ors
per
Su
per
viso
r
Figure 7.3D – Operator/Supervisor Ratio
In 1997, we started our employee opinion survey called “Dialogue”. The results are shown in Figure 7.3E below. Our Gung Ho training and team concept were born out of the
needs evidenced by the employee survey in 1997. Figure 7.3F indicates the level of activity in one of our many Employee Recognition programs.
Employee Recognition
0
0.1
0.2
0.3
0.4
0.5
1996 1997 1998 1999
% B
ase
Pay
roll
Figure 7.3F – Employee Recognition
Social Climate Survey
0
10
20
30
40
50
60
70
80
Qlty/TQM Co. Image Job Sat Reward Training Info Rltnshp Suprv Mgmt Work Org.
1997 ST Regional 1997 US Norms 1999 ST Regional 1999 US NormsGood
Figure 7.3E – Employee Survey Results
7.4 Supplier and Partner Results Supplier Partnership is imbedded into our TQM philosophy of continuous improvement. Figure 7.4A shows the overall average rating improvements from 1989 - 1996 using our old supplier rating system, and for 1997 - 1998 under the new rating system (twice a year). Both measurement systems show supplier performance has improved over time because of timely feedback, comparisons, and assistance in their improvement areas.
For both materials and equipment suppliers we have promoted QS9000 certification. Figure 7.4B shows the increased number of suppliers certified to QS9000 or ISO900X Quality systems. As environmental concerns are one of our company’s key focuses, the figure also shows the increased number of our suppliers certified by a 3rd party.
Average Rating of Material Suppliers(Rating system changed end of 1996)
55%
60%
65%
70%
75%
80%
85%
90%
95%
100%
89
90
91
92
93
94
95
96
1H
-97
2H
-97
1H
-98
2H
-98
% R
atin
g to
Mea
sure
s
Prior 1997
Starting 1997
Good
Figure 7.4A – Material Supplier Rating
Good
Good

1999 MBNQA Application Abstract
19
Supplier ISO/QS/ENV. Certification Status
0
10
20
30
40
50
60
ISO QS ENV. ISO QS ENV.
Certified Planned
# of
Sup
plie
rs
1996 1997 1998
Figure 7.4B – Supplier Certifications
The approach taken for equipment suppliers is total partnership through the life of the equipment. In 1997, the Center for Advanced Purchasing Studies (CAPS - a consortium for best practice and data sharing) performed a survey including nine major Semiconductor companies who were evaluated against 19 indices. Coverage of each index by the company’s system was given a percentage score, and the results were published. ST had more indices above 50% than any other company surveyed. Based on the results, CAPS gave our company a “best practice” rating for our supplier management program.
Monthly and annual meetings are held to evaluate equipment performance, supplier responsiveness, and improvements made. Major equipment suppliers compare equipment indices between our sites and competitors’ where their equipment is installed. Through this approach, insights to improvement opportunities surface. As a result of this type of comparison data and resultant focus on specific equipment improvement, we have improved total uptime and, therefore, throughput on several processes.
We track other measures of particular significance to specific equipment. Figure 7.4C is one example of where Mean Time Between Failures on an Implant machine has improved.
Figure 7.4D shows the continuous increase in number of inventory turns, indicating a reduction of inventory levels, which reduces the total cost of on-hand inventory.
Another performance index measuring our satisfaction with our suppliers is number of complaints they receive from us. Figure 7.4E shows that while month-to-month variation occurs, the rolling average of number of complaints shows a continuous downward trend in total complaints received.
Equipment Reliability Monitoring
0
100
200
300
400
500
600
Q1-
98
Q2-
98
Q3-
98
Q4-
98
Q1-
99
Q2-
99
Q3-
99
MTB
F H
ours
Figure 7.4C – Equipment Reliability
Total Manufacturing Inventory Turns Evolution (1997 - 1999)
4
6
8
10
12
14
16
1/97 5/97 9/97 1/98 5/98 9/98 1/99 5/99 9/99
# of
Tur
ns
Figure 7.4D – Inventory Turns
On-Site Supplier Management Complaint Trend
-2
0
2
4
6
8
10
12
1/98 4/98 7/98 10/98 1/99 4/99 7/99 10/99
Num
ber o
f Com
plai
nts
Figure 7.4E – Supplier Complaints
7.5 Organizational Effectiveness Results One specific measurement of our improving productivity performance is in “Cost of Good mm2 / level”, which is the actual cost of manufacturing one good mm2 area per mask level. Figure 7.5A shows the performance of our CF6 fab in Carrollton during the last two years. We have shown an improvement of over 43%.
Good Good
Good
Good

1999 MBNQA Application Abstract
20
Cost of Good mm2 Silicon per Manufacturing Process Level
(Productivity Improvement)
1/98 4/98 7/98 10/98 1/99 4/99 7/99 10/99
Cos
t/Goo
d m
m2/
Leve
l
Figure 7.5A – Cost of Good mm2/level (Productivity)
Another important indicator of our improving operations is our ability to provide on-time JIT delivery. This reflects the overall effectiveness of all of our operations and their ability to work together toward a common delivery time. Moves per time period through each manufacturing step is a consolidated key indicator of productivity improvements and cycle time reduction. Figure 7.5B shows the results of manufacturing improvements by consolidating three sites’ moves per day.
Manufacturing In-Line Moves per Work Day
90
110
130
150
170
190
210
230
250
F-
98
M A M J J A S O N D J-
99
F M A M J J A S O N D
1998 - 1999
Num
ber
of K
Mov
es p
er D
ay
3 Manufacturing Sites
Figure 7.5B – Manufacturing Moves
ST has taken an environmental leadership role in the semiconductor industry by its adoption of an “Environmental Decalogue”. We have comprehensive policies and measurements for environmental protection related to this Decalogue and deployed them through our Policy Deployment activity. Figure 7.5C is an example of tracking power, water, and paper efficiency to meet our challenging environmental standard. As a recent result, the use in power per wafer has been reduced by 37.5% in the overall region from 1997 to 1999.
Funding in R&D is an investment in our future. Figure 7.5D shows our continuous increase in R&D expenditures, especially during the severe market downturn in 1996 - 1998. This has helped to provide us a strong, innovative horizon.
Environmental Impact Tracking(Region Americas)
0.1
0.15
0.2
0.25
0.3
0.35
0.4
0.45
Q1-
97
Q2-
97
Q3-
97
Q4-
97
Q1-
98
Q2-
98
Q3-
98
Q4-
98
Q1-
99
Q2-
99
Q3-
99
Q4-
99
Nor
mal
ized
with
Man
ufac
turin
g A
ctiv
ity Power usage Paper usage Water usage
Figure 7.5C – Power, Paper, and Water Efficiency
ST Americas R&D Investment Trend
1993 1994 1995 1996 1997 1998 1999
$ M
illio
n
Figure 7.5D – R&D Investment
As the direct benefits of our R&D commitment and as a result of our employee empowerment activities, the number of patents issued (Figure 7.5E) has increased from 103 in 1995, to 126 in 1999 (over 22%).
Patent Portfolio
94
80
100 103103113
121132
85
126
0
20
40
60
80
100
120
140
1995 1996 1997 1998 1999
Num
ber o
f Pat
ents
US Apps US Issued
Figure 7.5E – Number of Patents
Good
Good
Good
Good
Good


![Complexity and Chaos - State-of-the-Art; Formulations and ... · 2.1 Abstract Computational Complexity (Edmonds, 1999): Blum [67] proposed an abstract definition of computational](https://static.fdocuments.in/doc/165x107/5f988b1c7ac3970e1c3436e1/complexity-and-chaos-state-of-the-art-formulations-and-21-abstract-computational.jpg)

