2001 Malcolm Baldrige Application Summary -...
31
Transcript of 2001 Malcolm Baldrige Application Summary -...


2001 Malcolm Baldrige National Quality AwardApplication Summary
• Fastest Service Times •
• Largest Market Share Growth •
• Highest Productivity •
• Highest Health Scores •
• Lowest Turnover •
• Highest Web Site Traffic •
2 0 0 1 M B N Q A A p p l i c a t i o n S u m m a r y
P a l ’ s S u d d e n S e r v i c e
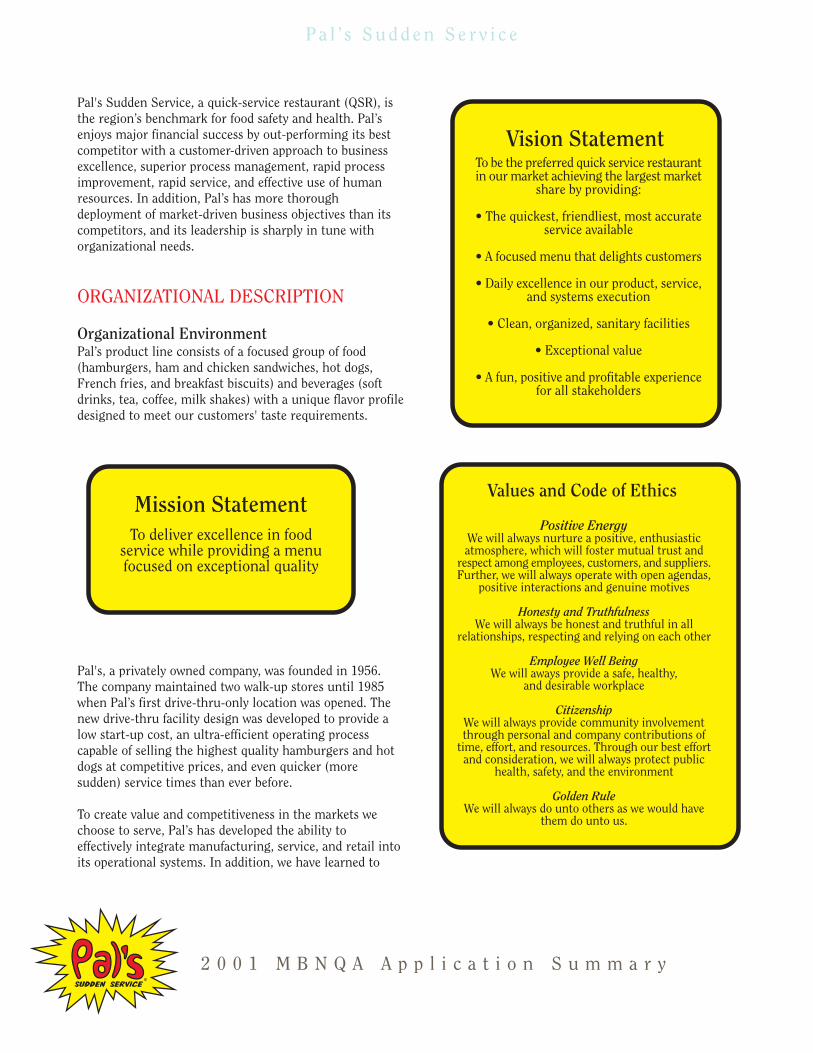
Pal's Sudden Service, a quick-service restaurant (QSR), isthe region’s benchmark for food safety and health. Pal’senjoys major financial success by out-performing its bestcompetitor with a customer-driven approach to businessexcellence, superior process management, rapid processimprovement, rapid service, and effective use of humanresources. In addition, Pal’s has more thoroughdeployment of market-driven business objectives than itscompetitors, and its leadership is sharply in tune withorganizational needs.
ORGANIZATIONAL DESCRIPTION
Organizational Environment Pal’s product line consists of a focused group of food(hamburgers, ham and chicken sandwiches, hot dogs,French fries, and breakfast biscuits) and beverages (softdrinks, tea, coffee, milk shakes) with a unique flavor profiledesigned to meet our customers' taste requirements.
Pal's, a privately owned company, was founded in 1956.The company maintained two walk-up stores until 1985when Pal’s first drive-thru-only location was opened. Thenew drive-thru facility design was developed to provide alow start-up cost, an ultra-efficient operating processcapable of selling the highest quality hamburgers and hotdogs at competitive prices, and even quicker (moresudden) service times than ever before.
To create value and competitiveness in the markets wechoose to serve, Pal’s has developed the ability toeffectively integrate manufacturing, service, and retail intoits operational systems. In addition, we have learned to
Mission StatementTo deliver excellence in food
service while providing a menufocused on exceptional quality
Vision StatementTo be the preferred quick service restaurantin our market achieving the largest market
share by providing:
• The quickest, friendliest, most accurateservice available
• A focused menu that delights customers
• Daily excellence in our product, service,and systems execution
• Clean, organized, sanitary facilities
• Exceptional value
• A fun, positive and profitable experiencefor all stakeholders
Values and Code of Ethics
Positive EnergyWe will always nurture a positive, enthusiasticatmosphere, which will foster mutual trust and
respect among employees, customers, and suppliers.Further, we will always operate with open agendas,
positive interactions and genuine motives
Honesty and TruthfulnessWe will always be honest and truthful in all
relationships, respecting and relying on each other
Employee Well BeingWe will aways provide a safe, healthy,
and desirable workplace
CitizenshipWe will always provide community involvementthrough personal and company contributions of
time, effort, and resources. Through our best effortand consideration, we will always protect public
health, safety, and the environment
Golden RuleWe will always do unto others as we would have
them do unto us.

2 0 0 1 M B N Q A A p p l i c a t i o n S u m m a r y
P a l ’ s S u d d e n S e r v i c e
apply world-class management principles and best-in-classprocesses that cause other companies emulate to oursystems.
Pal’s culture guides employee behaviors through a set ofclear values, beliefs, and expectations defined by ourMission Statement, Vision Statement, and Values/Code ofEthics. These strategic components are communicated toall levels of the organization and to all stakeholders forreview, understanding, interpretation, and feedback.
Pal's has over 400 employees. Within Pal’s organizationstructure, our people are classified in four groups:• General Staff (Process Management Teams)• Assistant Managers• Store Owner/Operators• Senior Leaders (Chairman, President/CEO).
Ninety-five percent of our staff works in direct production.The majority of our general staff and hourly managersrange in age from sixteen to thirty-two. Typically, they viewtheir job at Pal’s as an entry into the job market, providinga first step toward a long-term career in another industry.These factors create a young, inexperienced, transientworkforce that must be trained to produce quality resultsand make positive direct customer contacts on a regularbasis.
In the quick-service restaurant business, the facilities andequipment must be capable, reliable, and sanitary. Pal’sdrive-thru facilities have been designed to be efficient andeffective. The equipment, facilities, and technologies thatPal's uses to meet customer needs are components thatserve our manufacturing, service and retail needs throughongoing use of our Benchmarking, Innovation andProduct/Service/ Process Introduction processes.
Our process layout is designed so that raw materials enterthrough a delivery door and are worked forward throughthe store with one process serving the next process in theprocessing/assembly/packaging line until a finished productis handed to an external customer. The major technologiesinvolved are order taking, cooking, holding, filtering, orderdelivery, and packaging. In each category we have developedproprietary state-of-the-art technology to achieve productand service quality and to provide efficient product flow.
Cleanliness, sanitation, safety, waste disposal, and laborpractices at Pal's are regulated by a variety of local, state,and federal agencies. We are regulated locally by Fire,
Building and Waste Disposal codes; at the state level byHealth, Labor and Workers Compensation requirements;and federally by OSHA, EPA, and Wage and Hour laws.
Organizational Relationships Pal's target market is made up of eight small to mid-sizedcities in the geographical area of Northeast Tennessee andSouthwest Virginia. The customer base consists of peoplefrom the market area who work and live in our targetmarket. Eighty-two percent of our customers live or workwithin three miles of one of our restaurants. We segmentour markets according to age, gender, and annual income.
At Pal’s, we performed extensive market research topinpoint customer requirements: convenience; ease ofingress and egress; easy-to-read menu; simple, accurate
order system; fast service; wholesome food; and reasonableprice. This data has been used to translate our keycustomer requirements into Key Business Drivers.
Customer requirements are linked to clearly definedoperational processes, procedures, and systems that arecontinually monitored to ensure that we are meetingcustomer requirements. We maintain on-goingcommunications links to our customers so that we canlisten to how well they think we are meeting their needs.We also listen to learn if customer needs are changing or ifnew needs have arisen.
Pal's has three key suppliers/partners who provide themajority of our raw materials. Focusing oursupplier/partner base on just three vendors has reduced
Key Business Drivers• Quality of products,service, and process
• Service
• Cleanliness
• Value
• People
• Speed

2 0 0 1 M B N Q A A p p l i c a t i o n S u m m a r y
P a l ’ s S u d d e n S e r v i c e
product variability. It has also allowed us to develop a morepositive relationship with each supplier/partner with whomwe have established long-term, mutually beneficialpartnerships. We work with suppliers to design in quality,value and our unique flavor profile.
ORGANIZATIONAL CHALLENGES
Competitive EnvironmentPal's competes in a regional market head-to-head withfranchises of major international and national fast foodchains.
The principle competitive factors that determine Pal’ssuccess in our market are:• Food quality• Service speed• Food health and sanitation• Pricing• Staff turnover• Food cost
These factors have been identified by the Leadership Team,linked to Key Business Drivers, and supported by aligningmanufacturing, service, and retail processes. We use theMalcolm Baldrige Criteria for Performance Excellence toassess our Business Excellence Process and determine gapsin our alignment and performance.
The food industry, and especially the QSR segment, iscontinually impacted by changes that affect competition.Currently, Pal’s is concerned with a tight labor market inour service area, consolidations of paper suppliers,competitors refocusing on core menus, and shake-outs(forced business closings) in the restaurant industry.
Strategic Challenges Pal’s faces several key strategic challenges:• Competing directly with much larger national chainsthat have national reputations and much larger marketingbudgets. • Operating with a tight labor market.• Maintaining and growing market share.• Maintaining and improving standardization within ouroperations as we increase business and the number of
stores we operate.
Performance Improvement System Pal’s has created an environment that promotes continualimprovement. Systematic evaluation and improvementprocesses that are role-modeled by Pal’s leadership supportthis environment. Because of the management-led andorganization-wide focus on continual improvement, majorresults are improving. This improvement is generatingimprovement stories that cover almost every aspect of thebusiness. Some of the key processes that supportsystematic evaluation and improvement are:• Communication/Feedback Process • The Systematic Evaluation and Improvement step that isbuilt into all major processes • Strategic Planning Process • Product/Service/Process Introduction Process • Benchmarking Process • Continual Improvement Process
Best Practices are routinely identified, verified,standardized, and appropriately replicated throughout allthe Pal’s stores in a rapid and effective manner. Pal’sBalanced Scorecard, which measures all the Key BusinessDrivers, helps guide improvement efforts to make sureimprovements are effective in improving the Key BusinessDrivers. In addition, facts and data are the basis for Pal’ssystematic evaluation and improvement processes.Organizational learning, employee development, andcontinually improving results are basic characteristics ofthe Pal's culture.

2 0 0 1 M B N Q A A p p l i c a t i o n S u m m a r y
P a l ’ s S u d d e n S e r v i c e
Since beginning business in 1956, Pal’s operationshave been based on the principles: (1) that leadersshould establish company values by first settingthe example through their own personal choicesand behaviors (2) that each business transactionshould be focused on serving the customers in away that delights them and (3) that storeowner/operators should have a financial stake inthe success of the business. These principles arethe cornerstones of Pal’s leadership approach.
ORGANIZATIONAL LEADERSHIPSenior Leadership DirectionPal’s Senior Leaders (Chairman and President/CEO) set,communicate, and deploy plans to properly address thedesired organizational values, short- and longer-termdirections, performance expectations, a focus on customersand other stakeholders, learning, and innovation. Theypersonally lead, monitor, and coach the Pal’s LeadershipTeam (senior leaders and all store owner/operators), whichmeets each month to review and share lessons learned onthe day-to-day, week-to-week, month-to-month, year-to-yearapplication of the Pal’s Business Excellence Process (Figure1). The combination of leadership methods/ principles andleadership resources provides the structure and thecapabilities needed for guiding and aligning businessdecisions and actions throughout the organization.
The Strategic Planning Process (Figure 2) is applied by theLeadership Team to set direction and pursue futureopportunities for the business while using inputs from allkey stakeholders (e.g., customers, store owner/operators,general staff, suppliers/partners), taking into account their
needs and expectations. This process is used to define, align,review, and maintain a Corporate Mission Statement, VisionStatement, Key Business Drivers, Values & Code of Ethics,and action plans. Through these strategic outputs, Pal’sLeadership Team maintains clear values, high performanceexpectations, and a keen focus on all stakeholder needs.Senior leaders and store owner/operators communicate andinterpret these at each organizational level to defineorganizational, store, and individual responsibilities and toidentify opportunities for learning and innovation.
Innovation is driven through the Product/ Service/ ProcessIntroduction Process (Figure 3). Senior leaders personallylead cross-functional teams through this systematicapproach for developing new or modified products, services,or processes.
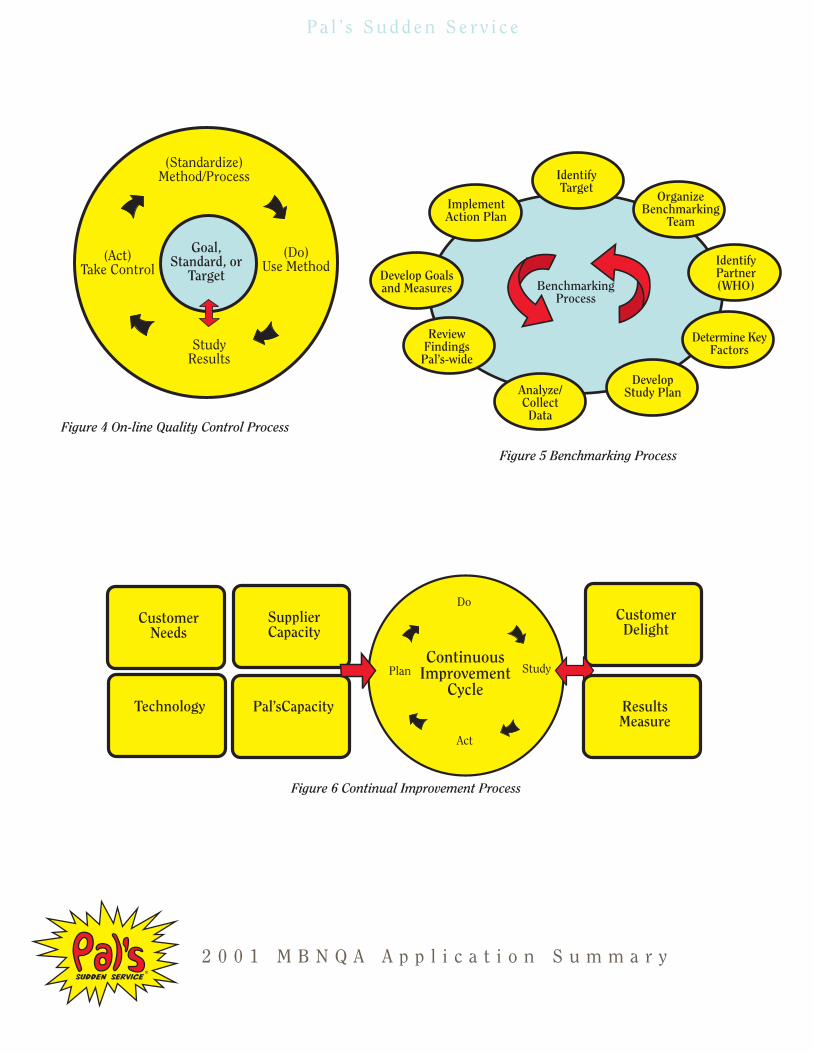
Leadership Team members adopted the On-line QualityControl Process (Figure 4) and routinely review itsapplication of best practices to achieve high performanceand excellence in Pal’s operational and support processes.This ensures consistent adherence to procedures, standards,and targets.
The Benchmarking Process (Figure 5), which has beenapplied informally for over forty years by senior leaders, hasbeen formalized to provide the entire Leadership Team an
on-linequalitycontrolprocess
continualimprovement
process
product,service ormethod
introductionprocess
strategicplanningprocess
communication - feedback process
ContinualImprovementof BusinessExcellence
Process
ManagementReview of
Progress &Performance
benchmarking process
continually improve strategic planning process
gather andanalyzestrategic
performancedata
review/analyzeexistingstrategic
directions/documents
revise/develop
strategy
(objectives
and action
plans
deployobjectivesand action
plans
reviewprogress
andresults
Figure 1 Pal’s Business Excellence Process
Figure 2 Pal’s Strategic Planning Process
customer needs stakeholder feedback
definition ofnew product,
service, orprocess
initialdesign andvalue-addDFC test
leadershipreview &strategicplanning
detaileddesign withbenchmrkgand PDSA
pilot testsand
redesignwith SDSA
no no no no
yesyesyesyes
leadershipreview &strategicplanning
SYSTEM-WIDE
ROLLOUT
Figure 3 Product/Service Introduction Process
2 0 0 1 M B N Q A A p p l i c a t i o n S u m m a r y
P a l ’ s S u d d e n S e r v i c e
Goal,Standard, or
Target
(Standardize)Method/Process
(Do)Use Method
StudyResults
(Act)Take Control
Figure 4 On-line Quality Control Process
BenchmarkingProcess
IdentifyTarget
OrganizeBenchmarking
Team
IdentifyPartner(WHO)
ImplementAction Plan
Develop Goalsand Measures
ReviewFindings
Pal’s-wide
Analyze/CollectData
DevelopStudy Plan
Determine KeyFactors
Figure 5 Benchmarking Process
SupplierCapacity
Do
Study
Act
PlanContinuous
ImprovementCycle
CustomerDelight
ResultsMeasure
Pal’sCapacityTechnology
CustomerNeeds
Figure 6 Continual Improvement Process

2 0 0 1 M B N Q A A p p l i c a t i o n S u m m a r y
P a l ’ s S u d d e n S e r v i c e
effective means of making meaningful competitivecomparisons, identifying and adopting best practicesneeded to achieve high performance expectations, andachieving defined directions for the future.
The Continual Improvement Process (Figure 6), featuring aPlan-Do-Study-Act cycle (PDSA), defines standards ofexcellence needed to maintain a focus on customers andother stakeholders. It is also used to identify, plan, andexecute improvement projects.
The Communication/Feedback Process (Figure 7) is aprogressive and rapid means of communication to/from allstakeholders. This process serves as a standard operatingmode for Leadership Team members:• Step 1 - Process Inputs - Leadership Team members usethis step informally during normal interactions with allstakeholders by continually listening to them as theyidentify needs, problems, solutions, and creative ideas whileconducting normal business functions. In addition, formaldata is gathered from the Pal’s process management systemand used to identify further inputs (and to validate informalinformation).• Step 2 - Analysis & Rapid Prototyping - Step 2 involvescapturing the formal and informal data from Step 1 andrapidly sharing it with all Leadership Team members whobegin rapid analysis, problem solving, and innovation. If anidea appears to be applicable, senior leaders initiate theProduct/Service/Process Introduction Process to develop
prototypes and move toward implementation of improvedproduct/service designs and process standards.• Step 3 - Outputs to all Store Operations - Step 3 involvesquick deployment/sharing of the information/learningthroughout Pal’s operations in all stores, maximizing itsimprovement value.
Values, beliefs, expectations, company directions, andfuture opportunities are set and communicated by theLeadership Team through Pal’s Mission Statement, VisionStatement, Values/Code of Ethics, and Action Plans for KeyBusiness Drivers, which are developed, regularly reviewed,and updated as appropriate. These strategic components arecommunicated to all levels of the organization and to allstakeholders for review, understanding, interpretation, andfeedback.
Senior leaders personally drive the Business ExcellenceProcess by leading teams; serving on teams; designing andimproving products, services and processes; teachingclasses; attending training sessions; participating inbenchmarking studies; applying the rewards system;interfacing with customers; Marketing by WanderingAround (MkBWA); making public speeches; doing strategicplanning; and performing management reviews. TheLeadership Team routinely evaluates and improves thecomponents of Pal’s Business Excellence Process usingfeedback throughout all company organizational levels andamong all stakeholders.
The impact on Pal’s organization from this leadership-driven, full stakeholder involvement approach todeployment has been rapid improvement actions,standardized processes, ongoing organizational learning,employee development, a proactive culture, and high valuebusiness results.
The pervasive use of the Communication/Feedback Processallows the Leadership Team to listen for, and rapidlyconsider, test, and implement ideas for improvement. Thispractice creates and reinforces an environment forparticipation, empowerment, and innovation. It alsoencourages organizational agility and organizational andemployee learning.
The senior leaders and Leadership Team fully assume theresponsibility for applying the Business Excellence Process.However, ideas for improvement frequently originate fromemployees (and other stakeholders) outside the LeadershipTeam. Each senior leader and owner/operator spends aportion of every day actively seeking input from employees,
LEADERSHIP
employee-teams
suppliers
community
operators-owners
2. analysis & rapidprototyping
1. process inputsproblemssolutions
shared datacreative ideas
control actionsfast PDSA
proactiveculture 3. outputs to all
store operationsorganizational
learning
employeedevelopment
rapidimprovement
standardizedprocesses
high value-added results
informal input(stakeholders)
formal input(management)
customers
Figure 7 The Communication/Feedback Process

2 0 0 1 M B N Q A A p p l i c a t i o n S u m m a r y
P a l ’ s S u d d e n S e r v i c e
customers, suppliers, and other stakeholders to gatherinputs used in the Business Excellence Process.
The combination of Pal’s values, principles, standards, andexpectations matched with the real life example set by ourleaders provides a positive role model for the employeeswho work with us and the stakeholders who do businesswith us. This plan to develop integrity and ethicsthroughout all layers of the Pal’s organizationsimultaneously supports our strong focus on excellence.
Organizational Performance ReviewSenior leaders, along with all owner/operators (i.e., theLeadership Team), routinely review data trends andvariation to assess performance toward goals and toperform any required problem solving.
This management review is performed in addition to theshift, daily, and weekly reviews. Appropriate action plansare developed during the reviews based on findings. Keylearnings are captured and shared throughout theorganization using the Communication/Feedback Processand the On-line Quality Control Process. Directions andplans are revised or restructured based on changes incustomer/stakeholder needs, what we learn as anorganization, what our competition is doing, and what wediscover from benchmarking with Best-In-Classperformers. When performance meets or exceeds goalcriteria, we seek meaningful ways to celebrate with ouremployees, customers, and other stakeholders.
During management reviews, the senior leaders, inconjunction with the Leadership Team, determine prioritiesfor needed improvements and opportunities for innovation.Our Continuous Improvement Process (see Figure 6) isused to translate these priorities and opportunities intoplans. This involves detailed study and rapid prototypingthrough the Product/ Service/Process Introduction Processor rapid innovation (piloting/testing) through theCommunication/Feedback Process.
Leadership Team members set the example for the way keysystems should be evaluated and improved by usingorganizational performance review findings to evaluate andimprove the Business Excellence Process. The LeadershipTeam makes sure the components of the process areroutinely evaluated and improved during their meetings byusing input gathered by the Communication/FeedbackProcess from all stakeholder groups. This healthy, open
flow of information has greatly improved Pal’s ability to setand deploy direction, plans, and actions, and to achievedesired results.
PUBLIC RESPONSIBILITY ANDCITIZENSHIP
Responsibilities to the PublicThe Leadership Team addresses Pal’s societalresponsibilities by making sure three primary riskmanagement areas are managed in a way that is consistentwith our own values and expectations: the safety of the foodwe sell, the people we employ, and the environment inwhich we operate. Pal’s anticipates public concerns andestablishes appropriate measures and goals in these areas.
To anticipate public concerns, Pal’s gathers informationfrom all levels of its organizational structure and reviewsdata collected from other sources. Included are customers,suppliers, the Tennessee Restaurant Association, theNational Restaurant Association, the Restaurant News,legislative bills, the Fire Marshall, OSHA publications, StateDepartment of Health, Labor Department, local/nationalmedia, and Pal’s Benchmarking Process. Based on thisinformation, Pal’s Leadership Team members use theContinual Improvement and Strategic Planning processesto set targets and goals related to potential and currentpublic concerns.
In response to the growing public concern over food safety,Pal’s developed a Risk Management Process centered onhazard analysis, safe service methods, and in-housesanitation inspections. We have implemented the HazardAnalysis Critical Control Point (HACCP) Program andadopted the National Restaurant Association’s ServSafetraining and certification, an industry best practice for foodsafety education, as a standard requirement. In addition,in-house health inspections are conducted in all Pal’sstores.
Safe, clean, and secure processes and facilities forcustomers and the environment are also of significantconcern for Pal’s. Facility and process designs and in-houseinspections focus on adequate lighting in parking lots,curbing, security practices, slip-resistant floors, safety glasson windows and doors, housekeeping practices, wastereceptacles and disposal, food packaging, and otherpotential injury, illness and hazard-causing conditions.Waste disposal is carefully managed and transported to

approved landfills. Internal incidents, customerlistening, literature searches, and benchmarking areall used to identify existing and potential publichazards that are addressed by our Strategic Planningand Continual Improvement processes.
Pal’s Leadership Team defines ethical businesspractices as strict adherence to the Pal’s Values/Codeof Ethics. Senior leaders and owner/operatorsroutinely share/communicate the Values/Code ofEthics with all of Pal’s stakeholders and use it as aguide for assessing ethical performance of employeesand suppliers/partners. The Values/Code of Ethics arealso used by senior leaders and store owner/operatorsin Leadership Team meetings as a self-assessment toolto evaluate and improve their own ethical compliance.
SUPPORT OF KEY COMMUNITIESAt Pal’s, the Leadership Team has identified a three tofive mile radius around each store as the keycommunities for organizational involvement andsupport. These geographical areas are primarily whereour customers live and work. The senior leaders (forPal’s overall community) and each owner/operatordecide on the areas to support.
A major responsibility to our local communities is theshaping of our employees into positive citizens. Byhelping our people grow, develop, and become bettercitizens, Pal’s helps make our business moresuccessful while also making our communities abetter place to live and work. Leadership Teammembers fulfill this responsibility by role modelingand teaching good citizenship and good workpractices. Each senior leader and store owner/operatoris actively involved in various communityorganizations and projects, serving as directors,chairs, board members, contributors, and projectleaders.
A standard practice at Pal’s is to keep our stores openduring inclement weather and natural disasters.Whenever our market areas experience severe snow,ice, rain, or electrical storms, Pal’s stores remain openwhen our competitors close shop and send their staffmembers home.
Pal’s Leadership Team has also opened its meetingsand training to local businesses so they can observe
our business excellence practices. Many localbusinesses have attended and participated in thesemeetings and have invited us to speak publicly on ourstakeholder-focused Business Excellence Process atcivic group meetings and other professional andcommunity functions. We frequently share ourknowledge, experience, and key learnings with fellowcitizens.
Pal’s Senior Leaders rely on strategic objectives andaction plans to produce customer-driven quality,market-focused growth, operational excellence, andresponsible corporate citizenship. Key strategicplanning outputs guide ongoing decision-making,resource allocation, and company-wide management.
STRATEGY DEVELOPMENT
Strategy Development ProcessThe Pal’s Strategic Planning Process (Figure 2), whichis performed annually, focuses on a two-year planninghorizon.
Step 1 - Gather and Analyze Strategic PerformanceData (Strengths, Weaknesses, Opportunities, andThreats) - In addition to collecting data from all levelsof the organization, Pal’s gathers data from ourprimary stakeholders (i.e., customers/market,employees, community, competitors, financial,regulatory, internal performance, suppliers/partnersperformance, technology, and food industry). Theleadership team analyzes all data using a SWOT(Strengths, Weaknesses, Opportunities, and Threats)analysis and risk review.
Step 2 - Review/Analyze Existing StrategicDirections/Documents -Analyzed data from Step 1 isused to evaluate the appropriateness of the existingstrategic documents/outputs (Mission, Vision,Values/Code of Ethics, and Key Business Drivers).
Step 3 - Revise/Develop Strategy - Results of theSWOT analysis and risk data from Step 1 are used toperform various functions (e.g., visioning, forecasting,projections, options development, brainstorming,scenarios). Strategic documents and outputs fromStep 2 are used as references to ensure consistency ismaintained during the establishment of short-termand longer-term strategic objectives and action plans.
2 0 0 1 M B N Q A A p p l i c a t i o n S u m m a r y
P a l ’ s S u d d e n S e r v i c e

2 0 0 1 M B N Q A A p p l i c a t i o n S u m m a r y
P a l ’ s S u d d e n S e r v i c e
Strategic data analyses and interpretations arecarefully evaluated against our own operationalrequire-ments, our capabilities, and available capitalbefore strategic objectives and plans are chosen.
Step 4 - Deploy Objectives and Action Plans -Deploying objectives and action plans to all levels ofthe Pal’s organization and to all stakeholders involvesdeveloping item-specific action plans, which areanalyzed and integrated into a single, coordinated,large-scale action plan designed to accomplish theoverall objective.
Step 5 - Review Progress and Results - The LeadershipTeam reviews progress and results using Pal’sManagement Review Process.
Step 6 - Continually Evaluate and Improve StrategicPlanning Process - The Leadership Team devotes partof its annual planning agenda to evaluating andimproving strategic objective selection, actionplanning, deployment, our capabilities for tracking andachieving performance relative to plans, improvementplanning, benchmarking, innovation, problem solving,and performance.
Customer and Market Needs/Expectations areevaluated using market research studies and customercomplaint data. These data are used to interpretcustomer needs and requirements, to project markettrends, and to establish new strategies that will delightcustomers and sustain our competitive advantages.
Competitive Environment and Capabilities Relative toCompetitors are evaluated with data from our bench-marking process (Figure 5), benchmark data exchange,and competitive reviews. We use the data to identifymarket and industry trends, industry and competitorcapabilities and Best Business Practices, competitorstrategies, potential competitor reactions to ourstrategies, and promotional and technologicalimprovement opportunities.
Technological Risk is evaluated with data gatheredfrom manufacturers, vendors, and industry tradeassociations using the following criteria: • How will the technology help us meet needs?• Are any of our technologies becoming obsolete?• Do our existing technologies have new hazards/risks?
• What new technologies offer us a competitive edge?• Are the new technologies cost effective?• Are competitors developing/using new technology?• Will the technology become an industry standard?• What training will we need for our staff?• What safety risks are associated with it?
Pal’s Strengths and Weaknesses are addressed usingthe SWOT Analysis, supported by various analyses ofkey processes, internal capabilities, and KBD data.
Human Resource Capabilities/Needs are addressedafter business and operational strategies and KeyBusiness Drivers have been identified. Included in thisarea are strategies and plans to train and educatepersonnel, to build staff capacity for strategic success,to improve work/job designs and work areas, and tobuild a better culture for excellence.
Operational Capabilities and Needs are considered byevaluating anticipated needs and capabilities forhuman resources, technology, research anddevelopment, innovation, and business processes.Internal capability data are analyzed against industrytrends, technology developments, and performanceadvances, looking for ways to develop dominantpositions within our market.
Supplier/Partner Strengths and Weaknesses areevaluated for Pal’s three major suppliers/partners whoprovide 100% of our raw materials. These suppliers/partners are reviewed semi-annually to analyze:• Their own competitive market positions• Their process and performance capabilities• The quality and availability of their supply lines• Their projected product cost trends• The impact of new technologies in their industry• Any risks that may threaten their business and their
ability to deliver quality and value on-time to Pal’s
Financial risk is given special consideration using acomprehensive Financial Planning Process, whichincludes annual assessments, budgeting, forecasting,and decision-making to guide short-term cash flowand longer-term profits. Detailed cost projections aremade for each store to accurately manage profit andloss, cash flow, expansion and capital investment, anddaily financial decisions.

Societal and Market Risk are analyzed with specificcriteria for assessing potential value added or threats forall stakeholders. Some of the sources of information thatare used include restaurant associations, market studies,bills coming before the legislature, OSHA publications,Department of Health, Department Of Labor, and Pal’sBenchmarking Process. The issues that emerge from all ofthe above analyses are subjected to an extensive SWOTAnalysis.
Strategic ObjectivesPal’s current strategic objectives that address its strategicchallenges are: • To improve competitiveness directly with national
chains. - We have a strategic objective of Improving the Public’s Image/Perception of Quick-Service Restaurants. We also have a Human Resource objective of Better Developing and Utilizing Assistant Managers.
• To handle a tight labor market. - We have a Human Resource objective with action plans for Minimizing the Threat of a Shrinking Labor Pool.
• To maintain and grow market share - We have a strategic objective with action plans for Increasing Market Share. Continuing to open new stores in new market niches is a key element for growing market share.
• To maintain/improve standardization - As we increase business and the stores we operate, we have a Human Resource strategic objective of Improving People Capabilities through processes and work designs.
Before the final selection of Strategic Objectives andAction Plans takes place, we solicit input from allemployees and stakeholders, testing needs for credibility,reasonableness, and commitment through ourCommunication/Feedback Process.
STRATEGIC DEPLOYMENT Action Plan Development and DeploymentOnce a strategic objective is determined, alternatives/options are considered and an optimum action plan isdeveloped to achieve the objective. We develop item-specific action plans using cause-effect analyses with inputfrom key stakeholders in the area impacted. Theseindividual action-item plans are analyzed and integratedinto a single, coordinated, large-scale action plan toaccomplish the overall objective.
One of the critical roles of our store owner/operator is thedeployment of strategic objectives and action plans to alllevels of the Pal’s organization. They communicate ourgoals to the entire staff through workplace scoreboards,meetings, training sessions, memorandums, and one-on-one discussions detailing how individual performance willimpact the planned strategic goals.
We allocate our best, most capable resources toaccomplish the objective we have determined adds themost value to all stakeholders. We allocate remainingavailable resources of manpower, materials, and money inthe order of importance of each objective relative to theothers. Allocations are done with a careful eye on ourorganizational design and operational requirements sinceover-stressing can lead to sub-optimization of the whole.
Monthly Leadership Team meetings include regularreviews of action plan progress as well as performancereviews of current operating results measured againststrategic targets. Current performance measures fortracking progress versus action plans include:• Action Plan Milestones Completed• Compliance to Target Completion Dates• Compliance to Target Budgets• Number of Training Modules Developed/Tested• Number (%) Employees Trained• Number of Assistant Managers promoted/ retained• Number of Positions Targeted and/or Filled with Co-op
Students (High School and College)• Compliance to New Lighting Standards• Average Staff Wage
Performance ProjectionAt Pal’s, our Business Excellence Process (Figure 1) willcontinue to drive us toward performance improvementover the next two to five years by maintaining our focuson strategies and plans linked directly to Key BusinessDrivers and derived heavily from customer/market.
Pal’s projected performance will continue to strengthenour position as the market leader versus our leadingcompetitor by generating additional sales, and bydeveloping the required operating capabilities. At thistime, we are the regional leader in all major areas ofcomparative performance (quality, service, speed, foodhealth/safety, customer satisfaction, market share, sales,and profit).
2 0 0 1 M B N Q A A p p l i c a t i o n S u m m a r y
P a l ’ s S u d d e n S e r v i c e

2 0 0 1 M B N Q A A p p l i c a t i o n S u m m a r y
P a l ’ s S u d d e n S e r v i c e
The priority of customer and market focus at Pal’s isreflected in our menu design (food items offered),flavor profiles (taste), pricing strategy, sudden serviceobjectives, customer delightment vision, packagingdesigns, customer contact standards, store design,complaint resolution policy, sanitation standards,and even our dress code. Our ability to understandthe voices of our customers and the marketultimately determines our business success.Throughout the Pal’s history, we have placed a majoremphasis on (1) establishing a world-class processfor listening, learning, and understanding what ourcustomers and market expect and (2) determininghow satisfied they are with the products and servicewe deliver to them.
CUSTOMER AND MARKETKNOWLEDGE
Pal’s uses the industry-proven standard method ofsegmenting by age, gender, income, and proximity tothe store location for analyzing buying patterns anddefining expectations. The following conclusions andstrategies have been determined:• Age - Pal’s menu structure is geared toward sixteen
to fifty-four year-olds, which is the age group that frequently purchases fast-food hamburgers, hot dogs, French fries, and soft drinks.
• Gender - Our customers are predominately female (sixty-four percent) who favor Pal’s because of superior quality (taste and temperature), service (speed and accuracy), and sanitation levels (State Health Scores).
• Income - Most of our customers earn less than $36,000 annually and require a reasonably priced menu.
• Proximity and Convenience of Locations - The majority of our customers live or work within a three-mile radius of one of our locations. Sixty-two percent prefer drive-thru service to dining in. Convenience is a key factor in their choice of where they make their fast-food purchases.
Pal’s market research seeks comparative informationrelating to key issues such as (1) customers likes ordislikes concerning Pal’s or specific Pal’scompetitors, and (2) reasons a particular restaurantis selected as a favorite. We analyze the comparativedata for trends and shifts in buying patterns to
identify needed changes in our business strategy andto target other potential customer groups and futuremarkets.
Key customer requirements and drivers of purchasedecisions are determined from the application of thefollowing listening and learning methods:• Telephone interviews• Mall interviews• Drop-in surveys• Mail-in surveys• Marketing By Wandering Around (MkBWA), • On-site interviews• Web-based surveys
Our listening strategies allow us to maintaincontinuous contact with customers and obtainvaluable information directly from them to identifycurrent and future needs.
Product and service features are determined bylistening for customer wants and needs,benchmarking/evaluating competitor products andservices, evaluating supplier products andcapabilities, and ensuring we have the technologyand capabilities to meet those needs. We also useindustry and competitive data to help realisticallypredict future trends in consumer tastes and buyingpatterns. Analysis of sales data and customer inputfrom our entire customer listening/learning sourceshelps pinpoint the relative importance of thesefeatures.
Pal’s frontline staff training program includes intenseinstruction on effective listening skills. These skillsare not only critical for high performance on thefood preparation line (required for order accuracy,speed, and customization), but are also beneficial forgathering valuable customer information aboutneeds, expectations, and satisfaction (as post-transaction feedback).
Through the Plan-Do-Study-Act improvement cycle(see Continual Improvement Process in Figure 6), we conduct small-scale pilot efforts to evaluate andimprove our processes for listening to and learningfrom customers and our ability to understandchanging customer needs and buying habits. Inaddition, we measure and evaluate the overalleffectiveness of our customer listening and learning

2 0 0 1 M B N Q A A p p l i c a t i o n S u m m a r y
P a l ’ s S u d d e n S e r v i c e
approaches by checking the validity of our marketresearch, customer surveys, and results againstoperational data, industry trends, and competitorinformation. We also evaluate how well we are doingagainst our customer-focused strategic objectives bybenchmarking our Key Business Drivers againstcompetitors.
CUSTOMER RELATIONSHIPS ANDSATISFACTION
Customer RelationshipsOur primary strategy for building customerrelationships is to create customer loyalty andreferrals by providing value and delight throughproduct quality, service speed, accuracy, friendliness,and aesthetic appeal.
Through training and coaching, we instill in our staffa positive, helpful, can-do focus on our customers,which also contributes to building good customerrelationships. Through community service activities,we strive to be a positive, proactive force in buildingbetter communities within our market areas.
Pal’s customer service standards (i.e., customercontact requirements) are derived from (1) listeningto the wants and needs of our customers through ourvarious listening sources, (2) benchmarkingstandards of industry leaders, and (3) developing ourprocess standards to exceed customer expectationsand competitor performance. Service standards areincorporated into our staff training as critical successfactors and are reviewed at the store level daily.Feedback and coaching are provided by store owner/operators and assistant managers as appropriate tobuild customer service skills.
Our service standards are reviewed and evaluated ona regular basis by both the Leadership Team and ourprocess teams. They are continually improvedthrough use of the On-line Quality Control (Figure4) and Continual Improvement Processes. (Figure 6.)A common agenda item for Leadership and processteam meetings, service standards are analyzed duringcustomer satisfaction performance data reviews toidentify potential improvement opportunities, andthey are routinely targeted during benchmarkingstudies.
Through our customer listening methods and studiesof industry standards and best practices, Pal’s hasdetermined a variety of access mechanisms andsources of information that enable customers toeasily seek assistance, conduct business transactions,and voice complaints:• Centrally located stores• Easy to locate store entrance.• Easy to read, large lettered 3-D focused menus• Direct, face-to-face access to order taker and
cashier/order deliverer• Continuous in-store availability of store
owner/operator (a managing partner)• Web site for contacting corporate office and stores• Printed menus available in bags and various ads• Long hours of operation (6:00 a.m. to 10:00 p.m.)• Telephone numbers of individual stores and offices
in telephone directories (white and yellow pages)• Single-focused advertising strategies with bold
messages and color• MkBWA where owner/operator goes door-to-door
in close proximity to store
Pal’s stores are specifically designed with a tradedress intended to stand out from other restaurants,to be easily noticed and remembered, to be easilyfound for access, and to present a bright, fresh, up-scale appearance. Our menu boards are designed toallow customers to easily, accurately, and quicklyread and understand them.
Pal’s has a permanent, cross-functional CustomerFocus Assessment Team that analyzes customer andmarket data to identify more effective ways to providecustomer access, to determine customer satisfaction,and to build customer relationships. The teamreviews the following measures to assess our existingapproaches:• Customer Count trends• Market research data• Competitive Analysis results• Complaint Log entries• MkBWA notes• Product Sales Mix data
The team reviews the consistency and validity of thedata with our listening methods, survey comments,industry and national restaurant trends, and localcompetitor strategies. It also benchmarks industrybest practices and approaches for providing customeraccess, determining customer satisfaction, and

2 0 0 1 M B N Q A A p p l i c a t i o n S u m m a r y
P a l ’ s S u d d e n S e r v i c e
building customer relationships. Using the ContinualImprovement Process (Figure 6), potentialimprovements to our existing customer/market focusprocesses are identified and reviewed by the Pal’sLeadership Team to assess their capability of meetingthe requirements of our changing business needs andstrategies. Typical improvements include surveyapproaches, question details, service standards, ideasfor customer/market focus process improvement,different market research methods (i.e., thirdparties), and sample sizes. For example, over the pastseveral years both the timeliness and satisfaction ofcomplaint handling have been improved throughtraining and by empowering the staff to instantlyresolve complaints with free product coupons,product replacement, and/or money reimbursement.
Our most recent improvement in customer accessand relationship building has been achieved throughthe new Pal’s web site, an improvement idea thatcame directly from evaluations of our customerrelationship processes. Since its launch in October1999 with 292,000 hits per month, activity onwww.palsweb.com has increased to three million plushits per month. This mechanism for providingcustomer access and building customer relationshipshas allowed us to develop an active database of 25,000customers while increasing our top-line sales bythree percent and producing a project return oninvestment of over five hundred percent. It alsoallows us to provide quick responses by a LeadershipTeam member for every customer communication.During our 6:00 a.m. to midnight schedule, aLeadership Team member answers each query withinsix hours, 365 days a year.
Pal’s Complaint Handling Process is a long-standing,well-established part of our customer-focused culture.Our Operations Manual clearly states the way inwhich we conduct our business: “Every Pal’s staffmember has the authority to take corrective actionwhen confronted with a customer complaint, whetherin person or via telephone. The staff member whoreceives the complaint is empowered to replace theorder and/or refund the customer’s money. Thecomplaint is reported to the owner/operator andentered on the Complaint Log.”
The member of our staff that becomes aware of thecomplaint enters all formal and informal complaints
and comments in our Complaint Log. The customer’sname, address, and telephone number (whenavailable), and time of complaint are recorded in thelog along with the nature of the complaint and themeans of resolution. Each complaint is systematicallycoded to enable us to track the areas of our processesthat need improvement. The owner/operator followsup the complaint by contacting the customer toensure the complaint was satisfactorily resolved.Leadership Team members also randomly check withcustomers who have complained to determine if eachindividual complaint was handled in an expedient,professional, and thorough manner. Complaint datais reviewed for recurring trends at both the store andcompany levels. Root cause analysis is conducted onareas where the need for improvement is indicated.
By its nature, the fast food business requires fastresolution of complaints, so we empower our entirestaff to handle them in the manner they feel isappropriate. In rare instances when we are unable toresolve a complaint instantly with our standardoperating procedure, progressive levels of Pal’sLeadership Team are quickly called upon to resolvethe complaint. In our surveys, one hundred percentof those customers who made a complaint reportedthat they were fully satisfied with the manner andmethod in which it was resolved.
Customer Satisfaction DeterminationCustomer satisfaction levels are measured using datafrom various sources including Customer TransactionCounts, MkBWA, and market research. Customerdissatisfaction is evaluated through our ComplaintLog data. MkBWA and industry studies allow us tovalidate the objectivity and results of the annualmarket research study. MkBWA provides us theopportunity to directly ask customers what they valueand how Pal’s products and services rank in eachcustomer’s value perception. These results are alsoused to determine and assess customer satisfactionand dissatisfaction. However, the most obvious waycustomers indicate their level of satisfaction isthrough their repeat business.
Future buying trends and referrals are addressedthrough MkBWA and market research. Questions areaimed at gauging the customer’s current buyinghabits, the likelihood of those habits changing, andhis/her willingness to recommend Pal’s to a friend.

2 0 0 1 M B N Q A A p p l i c a t i o n S u m m a r y
P a l ’ s S u d d e n S e r v i c e
The answers to these questions are correlated to ourcurrent sales mix trend data to allow us to forecastfuture requirements. We thoroughly review the datagenerated from MkBWA, market research, and theComplaint Log looking for specific areas whereimprovement is needed. Then, we take theappropriate action to act on the opportunity.
Pal’s uses three systematic tools to follow-up withcustomers on our product and service quality andrecent transactions: Pal’s web site, MkBWA, and theComplaint Log. As more and more customers obtainInternet access, Pal’s website will become one of ourmost effective communication tools.
Since the majority of our customers live or workwithin a three-mile radius of a Pal’s location, MkBWAis a useful tool for following-up on customertransactions. Owner/operators typically contactcustomers at their homes, place of business, orrandomly while wandering around to question themabout their opinion of our products and services.
MkBWA also provides theowner/operator with the opportunity todirectly ask customers about theirsatisfaction levels with individualcompetitors as compared to Pal’s and toseek reasons for the satisfaction ratings.This data is collected three times peryear, and reported at both the store andcompany levels.
Pal’s market research is conducted by anoutside firm, which is hired for us by a third party sothe researcher does not know they are working forPal’s. Using the same questionnaire form, this firmsurveys both Pal’s customers and those of our majorindividual competitors to determine satisfaction levelsof products and services. Using the samequestionnaire for both our customers and those ofcompetitors ensures that the data collected isobjective and can be easily compared.
Finally, Pal’s cross-functional Customer FocusAssessment Team meets to analyze customer andmarket data for the purpose of identifying moreeffective ways to determine customer satisfaction.
INFORMATION AND ANALYSIS
Pal’s Leadership Team has carefully designed aperformance measurement and analysis system forthe collection, integration, and analysis ofinformation and data that feeds and interacts withour Strategic Planning, Continual Improvement,Benchmarking, and Management Review processes.Pal’s Management Information System (Figure 8) isalso used to guide the selection, gathering,integration, management, and effective use ofinformation and data to support our key operationalprocesses, action plans, and performancemanagement system.
MEASUREMENT AND ANALYSIS OFORGANIZATIONAL PERFORMANCE
Pal’s Management Information System gathers andintegrates data and information from multiple
sources (e.g., operations, customer listening/learningprocesses, market research, benchmarking studies,suppliers, regulatory agencies, and industrypublications). Much of the data is gathered at itssource (in the store) through our automated SysDinedata collection, integration, and analysis system.SysDine generates store-level and companywide reports on sales, customer count, product mix,ideal food and material cost, and turnover rates. Thisdata, which is readily available at each store, isreviewed and analyzed for use in support of dailyoperations.
Performance and capability data are easily integrated
ideas forimproving
mis
shared info for organizational learning
unit/storeperformance
datacollection
data andinformationintegration
andanalysis
performance
management
results
mgmt Reviews
assessoperational
effectiveness-----
determinecustomer
needs-----
identifylessonslearned
benchmarkStudy
Resultsdata source:
-cust./mkt.-competitor
- Financial- Employees- Operations- Suppliers- Regulatory
keybusinessdrivers
ideas forimprovingoperations
evaluate and improve measurement,analysis and benchmarking
opportunities for continual improvement
Figure 8 Management Infomation System

2 0 0 1 M B N Q A A p p l i c a t i o n S u m m a r y
P a l ’ s S u d d e n S e r v i c e
Performance and capability data are easily integratedbecause each of our seventeen stores has a commoncore set of performance measures includingcustomer-related, operational, human resource,competitive, and financial performance measures.Data for our company-wide balanced scorecard isgathered for analysis/review using standardizedcollection procedures and operational definitions.
SysDine automatically gathers financial andoperational performance data at the store-level andconsolidates it for use in overall organizationalanalysis and decision-making. We maintain aBalanced Scorecard of Core Performance Measureslinked directly to our Key Business Drivers. Thesemeasures/indicators support the understanding,alignment, and improvement of overall company andoperational excellence at all levels and in all parts ofthe organization. The balanced scorecard links inhouse performance measures and data charts foreach Key Business Driver with the influencing keyoperational processes and strategic action plans.
Information Frequency Tables determine the specificstore measures, the frequency of reporting, and thelevel and frequency of review. The balanced scorecardis used to identify needs for making improvements inkey areas that drive our business to excellence andgrowth.
Pal’s uses a Benchmarking Process (Figure 5) todetermine best-of-class practices and performanceand to set stretch goals to reach and exceed best-of-class performance levels. We select comparative dataon the basis of its ability to tell us where we standwithin our industry, within our market, and relativeto selected benchmark companies (within andoutside our industry).
During management reviews, the Leadership Teamselects the measures or processes to be benchmarkedusing the Balanced Scorecard. Gaps with the highestpotential gain are given the highest priority for moreextensive benchmarking/comparison. Onceperformance gaps are targeted, benchmarkingpartners are selected using the following criteria:• A winner of the Malcolm Baldrige NQA or state• level Quality Award.
• An organization recognized in its industry as best-of-class through publications and industry• level awards.• An organization recognized by a significant groupof customers as best-of-market as determined byinternal surveys and listening tools.• Outside of industry best-of-class as demonstratedthrough news articles, awards, and other types ofrecognition.
After benchmarking studies, the Leadership Teamuses the steps of the Continual Improvement (Figure6) and Communication/Feedback (Figure 7)processes to share the results with the entireorganization. Using information about our partner’sbest-of-class performance areas and best-knownmethods, we develop stretch goals duringmanagement reviews and strategic planning sessionsto push us toward high performance results. After wehave analyzed and learned as much as possible fromour benchmarking partnerís processes andperformance data, we use our Plan-Do-Study-Act(PDSA) piloting and continual improvementapproach to incorporate any learning we gain intoour own processes to produce equal or better results.
The selection and use of comparative informationand data at Pal’s are evaluated and improved by theLeadership Team, which performs an assessmentafter each benchmarking study by analyzing:• Was our performance gap real and valid?• Were we effective in getting acceptance of findings?• Was our action plans on-target?• Was our implementation and monitoring correctand focused?• Were reviews and updates timely?
The Continual Improvement Process is used annuallyto assess the company, store, and core processoperational information needs of senior leaders,owner/operators, assistant managers, staff, andsuppliers/partners. The evaluation of data covers theeffectiveness, timeliness, format, and understandingas it relates to the Key Business Drivers, measures,process measures, and on-line observations needed tomeet current business needs and directions.
We also evaluate the overall information and data for

2 0 0 1 M B N Q A A p p l i c a t i o n S u m m a r y
P a l ’ s S u d d e n S e r v i c e
the Monthly Performance Report Package, on-sitestandardized scorecards in stores, and various dailymeasurement logs and checklists. All changes,updates, and additions of significant proportions arepiloted using our “her” (assumes the role ofchampioning a proposed idea, product, or service),“antagonist” (assumes the role of opposing thechange), and “neutral” (neither champions oropposes a proposed idea, product, or service) storeconcept. The final results are reviewed to identifymore effective data reports and procedures for datacollection/update.
Performance AnalysisOur core information and analysis system is designedto support understanding of organizationalperformance by providing meaningful information foridentifying cause-effect relationships among ourdifferent functional areas, processes, and performancemeasures. Our SysDine System also has anautomated correlation routine available for keybalanced scorecard data to support organizationalperformance reviews and strategic planning.
SysDine has the capability of performing correlationanalyses at any time between any sets of measureddata we collect to make a statistically soundassessment of coefficients of correlation. With thisanalytical tool, we are able to identify how changes inone performance area impact all other areas, makeaccurate performance projections, and understandhow to optimize our management system. Each areaof performance is analyzed to identify root cause,solve problems, capture improvements and learningto be shared, and take appropriate control actions.
Measured data at the store level (through the SysDineMIS) is plotted by the staff each shift to compareperformance over time, to evaluate trends, and toassess actual performance versus standards/targets.Store-level data analyses are shared with staffmembers for their interpretation and use inidentifying root causes, solving problems, capturingimprovements, and taking appropriate controlactions.
The results/findings of analysis and decision-makingduring monthly Management Reviews (e.g., identifiedroot causes, improved procedures, control actions,
and new learnings) are communicated company-wide(and as appropriate to suppliers). Our completeinformation set (each store’s specific operationalresults as well as those for the whole organization) isshared and reviewed with the entire staff at eachstore. After staff review and analysis (through ourCommunication/Feedback Process (Figure 7), theanalyzed data and findings are then fed into theBusiness Excellence Process (Figure 1) and used toassess the need for change in current directions,strategies, and action plans by:• Reassessing strategic goals• Initiating any new benchmarking studies• Considering new product/service/process ideas• Pinpointing improved process standards and targets• Re-prioritizing improvement projects• Reallocating resources assigned to special projects
Information and analysis at Pal’s is linked directly toour Key Business Drivers with a balanced scorecardof strategically important measures/indicators andreadily available correlation tools. This approachenables us to achieve effective alignment of unit-levelanalysis in support of both unit-level andorganizational-level action plans. Daily data analysiswithin the units drives actionable decision-making insupport of both unit-level and organizational goals.
Our organizational goals to deliver consistent foodtaste and quality and to meet targeted food cost (toensure a good profit margin) offer good examples ofthe way our approach to analysis supports dailyoperations and continual improvement throughoutthe Palís organization. Each of these goals hasorganizational-level and store-level measures, whichare tracked and analyzed daily.
As our understanding of our operations and whatactually drives food taste, quality, and cost hasimproved, we have improved our ability to accuratelyproject performance results and identify what weneed to do to achieve continuous and breakthroughimprovements in performance.
INFORMATION MANAGEMENTData AvailabilityKey operational data from our SysDine system isposted on control charts and bulletin boards in ourstores for reference in process management and
2 0 0 1 M B N Q A A p p l i c a t i o n S u m m a r y
P a l ’ s S u d d e n S e r v i c e
improvement. This information is readily accessibleto every employee for review and analysis in supportof daily operations. SysDine has digital sharingcapabilities, which allows us to easily share data withsuppliers, as we feel appropriate. Feedback collectedfrom the stores is used to develop data reliabilityreports, which are transmitted to owner/operators toconfirm the validity of the monthly performancereports.
Our participative approach to information andanalysis (involving the staff and suppliers in datacollection, data use, and data analysis) ensures theavailability of data in our operations. This results inour data users (and suppliers) having a strong voicein the design and use of measured performance data.
We assure that data is reliable and accurate by usingpoint-of-sale devices to enter most data, using error-proofing aids during the entry of manually entereddata, and control charts to detect significant shiftsthat might be caused by incorrect data. To helpensure the overall data and information reliability, weutilize a third-party professional statistician toevaluate our selected data, how it’s collected, and howit’s used.
Pal’s begins considering user requirements duringthe data and information selection stage with pre-defined user criteria. The data selection, collection,and reporting criteria include:• Meets stakeholder requirements• Links to our Key Business Drivers• Provides a balanced scorecard• Drives action• Creates reliability• Provides rapid access• Allows rapid update• Supports continual learning/improvement
Pal’s Leadership Team members partner with threeinformation technology firms to maintain awarenessof currently available and emerging technologies andmethods for making information and data morereliable, accurate, available, and usable. Input fromthese partners is considered during strategic planningwhere our data capabilities and requirements are
aligned with our business objectives and action plans.
Hardware and Software QualityAt Pal’s, we ensure that hardware and software arereliable and user friendly by using establishedstandards and specifications in the selection of eachof the computers and point-of-sale terminals we usein all operations. Our standards and specificationsinclude strict criteria to review reliability and userfriendliness. We also test new systems in advance(using our piloting approach) before installing themin all of our stores. During use, we measure andreview mean time between failures on our systemscomponents, and we routinely assess whether wehave sufficient redundant backup.
To help assure the reliability of the software, we alsohave strict controls over who can make changes inthe programs. Changes are tested and verified priorto being used on a production basis.
We review the way our systems perform withinoperations with the people who actually use theequipment and programs. We also keep abreast oftechnology changes through our partners, tradeshows, and publications. During strategic planningwe use this input to analyze how our systems aremeeting all current user requirements. We also assesswhat is needed to support our strategic objectives andaction plans.

2 0 0 1 M B N Q A A p p l i c a t i o n S u m m a r y
P a l ’ s S u d d e n S e r v i c e
Employees at Pal’s are challenged to produce excellence inour operations (quality, speed, flexibility, service, and cost);to exhibit positive energy, well-being, and self-control; tomake the right decision at the right time; and to bededicated to continuous learning, development and growth.
WORK SYSTEMS
Pal’s operates without the aid of a professionalHuman Resources staff. A set of HumanResource principles and policies are appliedthrough defined processes for hiring, training,evaluation, compensation, benefits, andrecognition by the owner/operator at eachstore.
At Pal’s, we have focused our Human Resourcesstrategies, plans, job/work designs, and HRprocesses for developing capabilities thatsupport the key competitive performance expectations ofour organization (speed, accuracy, quality, and hospitality).In our work environment, where our staff meets thecustomer face-to-face, we employ effective job designs and aflexible work organization to encourage cooperation,collaboration, individual initiative, responsibility, andinnovation.
The staff at each Pal’s facility is organized into processteams along the order-taking, processing, packaging, andorder-completing line. Our staff must work with speed andflexibility while adhering to strict performance standardsand maintaining a line of sight with the customer at orderplacement and product delivery. Work and job designsenable employees to exercise discretion, judgement,initiative, and decision-making while safely applying bestbusiness practices that meet expectations for excellence andcustomer delightment.
Although each staff level has clearly defined roles andresponsibilities within our team structure (Figure 9), jobflexibility is pervasive in our work designs and teamassignments. As business levels fluctuate between high- andlow-volume periods, we must continuously exerciseflexibility in all of our production and service functions.
Through cross-training, staff members have a completeunderstanding of all production and service procedures andquality standards to allow smooth transition from workstation to work station and cooperative, flexible responses
to volume cycles and unplanned reassignments.Adjustments in assignments are made quickly whensickness, absenteeism, or unexpected variations in customercounts occur. Our emphasis on flexibility and cooperationalso helps us keep transaction times fast and food qualityconsistent, because the Pal’s staff does not have a “That’sNot My Job” mentality.
Pal’s Communication/Feedback Process (Figure 7) andBusiness Excellence Process (Figure 1) are utilized by ourCross-Functional (C-F) and Process teams providing thebasic foundation for formal and informal communication,cooperation, and knowledge/skill sharing throughout ourbusiness. We routinely collect and rapidly share ideas acrossour entire organization using e-mails, facsimiles,telephones, and pagers. This often produces rapid learningand decision-making that is shared company wide withinthe same day (or same hour).
Pal’s senior leaders and owner/operators maintain acontinuous organization-wide flow of information
Team Nature Membership Focus/Process
LeadershipTeam
Process Team
C-F AssessmentTeam
C-F ImprovementTeam
In-StoreImprovement Team
Pilot Team
Permanent
Permanent
Semi-Permanent
Rotational
Temporary
Temporary
Chairman, CEO,Owner/Operators
Operators, AssistantManagers, General Staff
CEO, Operators,Assistant Managers
Pal’s Employees,Stakeholders
Individual StoreEmployees
Individual StoreEmployees
Leadership through Business Excellence
On-line Quality Control &Communication/Feedback
Self-Assessment & Benchmarking
Continual Improvement (PDSA Cycle)
Continual Improvement (PDSA Cycle)
Product/Service/Process Introduction
Figure 9 Pal’s Team Structure
OrganizationalLevel
General Staff Process execution and analysis, problemsolving, and process management
Responsibilities
AssistantManagers
Team assignments, process executionand analysis, training, problem solving,
and process improvement
Owner/OperatorCoaching, system execution and
analysis, training, problem solving,and process improvement
Senior LeadersMentoring, vision, direction and keybusiness driver execution, analysis,
problem solving, and processimprovement
Figure 10 Key Roles & Responsibilities

2 0 0 1 M B N Q A A p p l i c a t i o n S u m m a r y
P a l ’ s S u d d e n S e r v i c e
concerning daily operational and business issues. Anyinformation (top-down, bottom-up, or store-to-store) thatwould be of immediate use or interest is quickly sharedwith all levels of the organization. Furthermore, each storeowner/operator maintains a weekly Communication Log,which lists important information about sales, expenses,customer information, staff, products, service, equipment,suppliers, and improvement ideas. Each Monday morning,these logs are shared with all stores as appropriate.
Pal’s work system allows owner/operators to lead andmanage while working directly in the operations areamotivating employees and encouraging their development.This regular one-on-one attention from owner/operatorspromotes rich communication that creates a commonunderstanding and shared goals. Their mentoring, coupledwith the developmental aspects of peer reviews and ourtraining processes, effectively supports employees indeveloping and utilizing their full potential. Pal’s also has aformal system for setting development objectives for eachemployee. These objectives are reviewed quarterly forprogress.
Pal’s staff members (from hourly worker to senior leader)have continual learning ingrained into their basic approachto performing work. They participate regularly onimprovement and learning teams where brainstorming andconsensus-building sessions enable them to identifyproblems or opportunities for improvements, analyzeprocesses, and recommend solutions. This experiencebuilds individual confidence, provides skills in problemsolving and continual learning, and motivates employees todevelop and utilize their full potential.
Most of our employees’ ultimate careers are with othercompanies. Therefore, we strive to provide skills,knowledge, a principle-based mindset, and work habitsrequired for producing excellence and practicing life-longlearning. We find these capabilities readily transfer to othercompanies and position a Pal’s graduate for successanywhere he/she chooses to pursue a longer-term career.
At Pal’s, we provide an abundance of immediate, public,non-monetary recognition for staff contributions in supportof employee development, customer satisfaction, continualimprovement, and organizational learning. Through the“Caught Doing Good” (CDG) program, any staff member orteam caught making an improved or exemplary jobcontribution in production or customer service isrecognized on the spot with written public praise for thedeed. A staff member, assistant manager, owner/ operator,
or senior leader (or even a customer or supplier) candocument a CDG on a specially designed form and post iton the store bulletin board.
Semi-annual peer reviews are used at the store level asanother tool for assessing individual performance anddelivering recognition. Each staff member rates their co-workers’ performance (work habits, attitude, adherence toprocess standards, job knowledge, and quality awareness).The owner/operator tabulates store results and reviewsthem with each staff member to identify strengths,opportunities for improvement, and a personalizeddevelopment strategy/plan.
All staff members are eligible for wage increases at any timetheir individual efforts demonstrate effective application ofimportant job skills or they are judged to be making asignificant contribution to store results. Any time anowner/operator (based on predetermined standards)observes that an individual staff member’s performancemerits financial reward, a raise is given regardless of theamount of time that has passed since the last raise. Thispolicy allows us to use direct compensation and recognitionto reward staff members for contributions that support ourcustomer and business focus.
The Leadership Team maintains succession plans at eachlevel of the organization to serve as road maps for showingspecifically who will succeed whom on a planned basis andin case of an immediate, unexpected need. Within a crew,employees advance on a planned basis to fill vital ProcessTeam roles as they learn more job skills and operationalpositions. The most capable process team members areselected to back-up Assistant Managers and are put on apath of planned advancement to the assistant managerposition. Assistant Managers are closely evaluated on theirleadership skills, business management skills, and personalcharacteristics that are used to select candidates forowner/operator succession.
The training of future senior leaders (owner/operators whoare identified to potentially fill the positions of President,COO and CEO) is a CEO-level responsibility. Specificperformance criteria are used to evaluate candidates withinput from all levels of the operation.
Owner/operators uses this same system to select new staffemployees who demonstrate a predisposition for quick-service food work (i.e., the basic aptitude, characteristics,and talents necessary to excel in our unique work systemand our particular work and job designs). By matching

2 0 0 1 M B N Q A A p p l i c a t i o n S u m m a r y
P a l ’ s S u d d e n S e r v i c e
existing talents and skills to our work and job designs, wehave greatly improved human resource capabilities, reducedtraining cycle times, lowered turnover rate, and enhancedoperational performance.
EMPLOYEE EDUCATION, TRAINING, AND DEVELOPMENT
Pal’s Business Excellence Process (Figure 1) is based on thecore concepts of the Malcolm Baldrige Criteria forPerformance Excellence. These principles, which are apervasive part of our culture, are used to achieve our actionplans. They are integrated throughout our training for teamskills, performance measurement, standards, continualimprovement, problem solving, quality control, andbenchmarking.
Pal’s Training Program contains a variety of modulesdesigned to support our strategic objectives, key actionplans, and operational capabilities by addressingorganizational and employee needs for development,learning, and career progression. As part of the StrategicPlanning Process, the Leadership Team annually assessestraining needs for strategic objectives (short-term and long-range) against our existing training program content inorder to identify needs for new trainingmodules/approaches and improved training effectiveness.
Individual training and personal development plans areestablished for all employees at all levels to ensure thatknowledge and skills required for defined responsibilities ateach position are acquired. Career plans are addressed forthose individuals who express an interest in long-termcareer development, allowing them the opportunity toprogress through general staff assignments to assistantmanager to owner/ operator to senior leader.
All new training programs, modules, and tools are designedusing inputs from all levels of the organization. This inputis normally gathered and considered during deployment ofstrategic objectives by cross-functional teams assigned toimplement training objectives identified in our HRStrategic Plan. In addition, training participants evaluate allexisting training modules to evaluate effectiveness andidentify improvement needs.
Pal’s Training Program covers our entire key developmentaland training needs. The basic performance need in ouroperations is to deliver quality, accuracy, and speed in a
responsive, friendly, flexible, professional, convenient,sanitary, and aesthetically pleasing manner to variedcustomer demands arriving at a rapid-fire pace. We havestudied our work and job designs to identify the criticalstaff knowledge and skills that impact these requirementsusing employee input and measured/ observed performanceresults. In addition, we have clearly definedlearning/capability objectives.
Our work system need for empowerment and decision-making is emphasized by our self-teach learning systems,our business management training for assistant managersthat enables them to serve as teachers and mentors, ourproblem solving training module for the entire staff, andthe ongoing process of transforming the owner/operatorfrom controller to coach/mentor.
We have no full-time or even part-time training instructors.Instead, senior leaders, owner/operators, and assistantmanagers have a primary responsibility for staff trainingand building staff performance capabilities. In-store processexperts also help deliver training. They are experienced inour operational procedures and have participated indefining Pal’s strategic direction, values, beliefs, andprinciples.
Our self-teach and classroom training modules covering keyoperational skills for each support and production workstation, use Pal’s CEO, store owner/operators, assistantmanagers, and staff members to demonstrate the process.These training tools allow us to convey the necessarymaterial in the shortest time possible while achievingstandardization and knowledge retention.
If measured training results do not match observed on-the-job results, we seek input from all levels of the organizationon how to design a more effective training, coaching, andassessment system through our then ContinualImprovement (Figure 6) and Communication/Feedback(Figure 7) processes.
Our work system and operational structure are designed toprovide close and frequent interaction among LeadershipTeam and Process Team members and to provide constantopportunities for verbal reinforcement. Owner/operators,assistant managers, and staff members work side-by-sidewithin our process teams on the service line allowing closeobservance of job behaviors and performance levels.Feedback, coaching, and reinforcement of appliedknowledge and skills are natural parts of work execution.

2 0 0 1 M B N Q A A p p l i c a t i o n S u m m a r y
P a l ’ s S u d d e n S e r v i c e
The Assistant Manager is a key resource for ongoing day-to-day reinforcement of staff member training on the job.He/she is usually promoted from within the store’s generalstaff and has already acquired the required processexecution and analysis and problem solving skills whileserving as a general staff member
The Caught Doing Good program provides additional verbaland written reinforcement from process team memberswhen an employee meets our quality standards and highperformance expectations. A special effort is made in CDGto identify behaviors that are consistent with our trainingprograms and that are clearly linked to desired performanceresults.
EMPLOYEE WELL-BEING ANDSATISFACTIONWork EnvironmentOur concept of safety, health and well-being is one ofprevention first (eliminating all possible causes of accidentsor mishaps), then finding and eliminating causes of actualor possible accidents. Our entire staff participates inanalyzing all accidents and implementing processimprovements to eliminate known causes and prevent aparticular accident from occurring or recurring. As a resultof our prevention orientation, Pal’s on-the-jobinjury/accident claims have declined seventy-five percentsince 1992. (Figure 11)
Health, safety, and ergonomic standards/targets are usedextensively in the design of our facilities to preventdeviation from standards and injuries.
Material Safety Data Sheets (MSDSs) are readily available toall staff (and regulatory personnel). A copy of our MSDSmanual is kept at each store and contains a data sheet foreach hazardous chemical used in the restaurant.
Restaurant Association (RA) inspectors, in-houseinspectors, and our liability/risk insurance carrier conductscheduled site visits to evaluate health and safety practicesand to help drive facility improvements. RA and insuranceinspections are conducted annually. The Leadership Teamanalyzes the data from these inspections, making anyrequired or desirable changes for improvement throughprocess analysis using our On-line Quality Control (Figure4) and Continual Improvement (Figure 6) processes.
In-house health and safety inspections are conducted once amonth in each store using the Food and DrugAdministration (FDA) Food Service Sanitation Ordinance.Results are compiled and distributed to all stores withintwenty-four hours of the inspection with any identifiedimprovements applied in all stores. With a focus oncontinuous high-level results, we are able to give aconsistently high performance on semi-annual state healthinspections.
ServSafe is used to make our staff knowledgeableconcerning proper food handling procedures, which aids inserving safe food to our customers and to our staff. Allowner/operators, assistant managers, and key personnel arerequired to be certified, making it possible for at least onecertified staff member to be on duty at all times.
EMPLOYEE SUPPORT & SATISFACTIONWe determine the key factors that affect employee well-being, satisfaction, and motivation with the same studiesused for identifying selection criteria for our Talent BasedHiring System. The criteria are evaluated and continuallyrefined/improved with direct employee input gathered fromour annual Staff Opinion (satisfaction) Survey and from ourexit interview process. The main segmentation of thisinformation for analysis is by function within the company.
At Pal’s, we build and enhance ourwork climate for employeesatisfaction, well-being, andmotivation through a variety ofcompany services, benefits, andactions. At the very foundation of ourapproach is our performanceexcellence policy. In our job market,pride in one’s work is a majorcontributor to an employee’s attitudeabout his/her job. By providing a work
Factors Requirements Measure Target Long-Term Goal
GlovesHeat Resistant
Cut Resistant
Number of Burns
Number of Cuts
<12 per year
<15 per year
<6 per year
<10 per year
All positions certified
Zero<6 per year
2 or more per mo.Positions Certified
Number ofBack Strains
Cross-Trained
Belts
PositionFlexibility
Back Supports
Figure 11 Health & Safety Requirements

2 0 0 1 M B N Q A A p p l i c a t i o n S u m m a r y
P a l ’ s S u d d e n S e r v i c e
system based on producing excellence in products andservices, Pal’s provides a strong beginning foundation foremployee satisfaction, well-being, and motivation. Inaddition, our extensive use of the Communication/Feedback Process (Figure 7) and our extensive use of cross-functional teams provide our employees a constant voice inthe management of our business and a direct means formaking meaningful contributions through work efforts.
We have policies covering sexual harassment, equalemployment, and discrimination on the basis of race,culture, religion, and belief. At Pal’s, we place a high valueon diversity, because it presents a different perspective fromwhich to learn and to assess opportunities forimprovement. Our acceptance of people with diversebackgrounds extends across organizational lines to includecustomers and supplier/partners.
The annual Staff Opinion Survey is used to measure levelsof employee satisfaction and to uncover any problemsneeding attention. Survey questions are designed by across-functional team of employees based on what isimportant to employee well being, satisfaction andmotivation. The team evaluates and improves the surveyannually by assessing the survey questions. Surveyquestions cover topics such as motivation, morale,excitement, training, product and service quality, andcommunication with no differentiation made for employeesegments. Survey results are compiled at the company levelfor review in Leadership Team meetings. Individual storelevel results are reviewed with its respective owner/operator analyzing the store-by-store results for potentialareas for improvement.
Staff Turnover is an indicator of how motivated, challenged,well-trained, and satisfied our staff is. Turnover reports areanalyzed each month (each store and overall organization).This information allows each store to monitor itseffectiveness in managing turnover, determine ifimprovements are needed, and facilitate root-cause problemanalysis. Pal’s leads the industry in low staff turnover. Theindustry annual average in our market is over 300 percentwhile Pal’s turnover rate for 2000 was 127 percent.
Our Human Resource strategy is based on creating stabilityin our workforce through work designs, a workenvironment and climate, and education, training anddevelopment processes that are focused on employee well-being, satisfaction, and motivation. Pal’s strategicobjectives always carefully consider the requirements of ourpeople. We recognize them as the key to buildingcapabilities, driving continual improvement, lowering costs,delighting customers, and increasing market share.

2 0 0 1 M B N Q A A p p l i c a t i o n S u m m a r y
P a l ’ s S u d d e n S e r v i c e
Through the disciplined customer-focus steps of the BusinessExcellence Process (Figure 1), Pal's processes are established ina way that creates meaningful interactions with our customerson an ongoing transaction-to-transaction, day-to-day basis.These frequent interactions allow us to really get to know ourcustomers and understand their needs. Our BusinessExcellence approach to management and close customerrelationships therefore automatically leads us to (1) carefullydesign our products and services, (2) continually measure andanalyze our product and service delivery processes, and (3)ensure that our operations are meeting customer requirementseach and every time a customer is served.
PRODUCT AND SERVICE PROCESSES
Design ProcessesPal’s is careful to never introduce a new product or servicewithout clear customer input, thorough market research,detailed design, extensive testing and careful analysis, andcalculated rollout to ensure internal capability and customeracceptance. The Product/Service/Process Introduction Process(Figure 3), featuring review and feedback from all stakeholders,is Pal's systematic approach for developing new and modifiedproducts and services and their related production/deliveryprocesses.
The Product/Service/Process Introduction Process begins withDefining a New Product/Service or Service. Ideas are generatedfrom customer needs identified through customer listeningstrategies, market research, benchmarking, andcommunication/ feedback with all stakeholders. Afterdetermining customer needs and changing customer/marketrequirements through the listening/learning methods, theLeadership Team considers new or revised product and serviceideas, asking the following questions to perform an InitialDesign and Value-Added Analysis:• Are our customer needs data and market trend data objective,valid, and credible?• Is a specific product, service or process suggested?• How will the product or service add value to all stakeholders?• What new capabilities will we need?• Will this change add value to all stakeholders?• What similar or related things are our competitors doing?• Do our suppliers have the capacity to support this newoffering?• Is the appropriate technology available?• Does Pal's have the capability to fully support this newoffering?
The Initial Design and Value-Added Analyses step of ourintroduction process is performed with a DesirabilityFeasibility Capability (DFC) approach focused not only oncustomer needs, but also on operational requirements. Duringthe Leadership Review and Strategic Planning stage, weexamine ways of incorporating new technology into ourproducts, services, and processes to meet customer/ marketneeds and to develop operational capabilities.
In addition, during the Detailed Design step, we identify whatand how new technology (equipment, systems, processes, andweb-based technologies) will be incorporated into Pal’sproducts, services and processes. We utilize our BenchmarkingProcess (Figure 5) and the PDSA Cycle of the ContinualImprovement Process (Figure 6) to develop and/or refine ouroperational processes. Technology needs and availability arealso investigated during the Pilot Testing step. If possible, wetry to simply adapt an existing process to establish the deliverycapability we will need. However, if new equipment is needed,we make sure during the design phase that it will fit into thespace available, and is it cost effective.
Our entire introduction process (Figure 3) is focused on (1) designing in quality as defined by the customer, (2) maintaining or improving our critical cycle times for speed,(3) testing new technologies and targeted outcomes, and (4) assessing overall desirability, feasibility (cost andproductivity), and capability of new designs. We also review and evaluate other factors such as cost control, storagerequirements, effect on sales mix, and profitability.
The Detailed Design and Pilot Testing step of our introductionprocess is guided by customer-focused process design criteriaand new or modified product/ service standards to ensure thatall customer needs and design criteria are met and that allprocess capabilities are established. During the design process,we review and consider items to ensure all of our keyoperational performance requirements are addressed.
During the Pilot Testing step the new/adapted operationalprocess is subjected to extensive piloting with a Standardize-Do-Study-Act Cycle (SDSA) approach to define/develop thefinal process design and capabilities. Process measures areevaluated versus standards and targets to identify and removebarriers to standardization and projected capabilities. Potentialnew offerings are tested with three pilots using a hero store(champions the proposed change), antagonist store (opposesthe change), and neutral store (neither champions or opposesthe change) piloting approach to ensure that capabilities areestablished to meet customer-focused process design criteria

2 0 0 1 M B N Q A A p p l i c a t i o n S u m m a r y
P a l ’ s S u d d e n S e r v i c e
and new or modified product/service standards. All pilot resultsare shared company-wide as data becomes available.
After initial design and testing, the new product/service designgoes through extensive Leadership Review, Analysis andStrategic Fit, using the preliminary piloting/testing data. Theresults and data are evaluated by the Leadership Team to reacha consensus on a final plan for company-wide implementation.During implementation, we utilize process measures, MkBWA,and market research to ensure we are fulfilling process andcustomer requirements. Only after being thoroughly tested andafter process capabilities are established and proven, do wedevelop strategic plans for introduction of the newproduct/service with a store-to-store rollout.
After each new product, service, or process launch, theLeadership Team performs a company-wide analysis bygathering and reviewing internal and external data concerningall identified potential improvements in ourdesign/introduction process. These improvement ideas areassessed against existing introduction process checklists fortraining, materials, equipment, suppliers, production, andsupport requirements to evaluate the capability of ourProduct/Service/Process Introduction Process for providing asuccessful design.
PRODUCTION/DELIVERY PROCESSES
Pal's core operational processes include Order Taking, Cooking,Product Assembly, Cash Collection, and Order Delivery. Theirassociated customer requirements, which have been used inprocess design to ensure customer delightment, are outlined inFigure 12.
Our process teams use Pal's On-line Quality Control Process(Figure 4) to manage our production/delivery processes.Through our SDSA Cycle in Product/Service Introduction, weestablish our capabilities to apply best-known operational andservice practices without variation. Through On-line QualityControl, we maintain and continually improve processperformance to ensure products and services meet customerand operational requirements.
Successful day-to-day operation of our key production/deliveryprocesses to meet key performance requirements requires ouremployees to effectively apply the On-line Quality Control(SDSA) using a variety of well-designed, well-defined visualstandards. Within Pal's high-speed work, our processes arerunning so rapidly that visual operational standards must bementally ingrained to achieve compliance to standards
Visual standardization is a critical element of Pal's training anddevelopment program. We thoroughly train/coach ouremployees on our precise work procedures and processstandards. This training focuses on developing a visualreference to verify product quality and usability. Operationalprocedures, service standards, and in-process control measuresfor all core processes, each product, and support services arecarefully designed and documented in the Pal’s OperationsManual.
Performance is also maintained through various process
automation and measurement components featuring precisecalibration capabilities to minimize process variation forcritical operational standards. Preventive maintenance is usedto ensure accuracy of our in-process measurement systems.
A final component of the Pal’s system of day-to-day operationto meet key performance requirements is our crisis plan. Wehave documented standard procedures for dealing with adverse
Core Process Principal Requirements
Order Taking Accurate, Fast, Friendly
Cooking Proper Temperature
ProductAssembly
Proper TemperatureQuantity, Freshness
Accurate, Fast, Friendly
•Proper Sequence, Sanitary• Correct Ingredients and Amounts• Speed• Proper Temperature, Neat
CashCollection
Accurate, Fast, Friendly
OrderDelivery
Slicing Cut/SizeFreshness/Color
ChiliPreparation
Proper TemperatureQuantity, Freshness
Ham/ChickenPreparation
Figure 12 Pal’s Core Processes & Principal Requirements

2 0 0 1 M B N Q A A p p l i c a t i o n S u m m a r y
P a l ’ s S u d d e n S e r v i c e
situations, which occasionally (and potentially will) occur in thecourse of doing business such as power outage, water outage,serious employee illness/injury, or customer emergency. Ourcrisis plans (in conjunction with our empowered staff trained tooperate in a manner of on-line self-control) allow us to meetperformance requirements and customer needs effectively in allsituations.
Employees are also trained to analyze results versus processstandards and measures. They are given the authority to takeaction, even if the action is to recognize problems, search forroot cause, take compensating actions, and resolve problems inwhatever manner seems appropriate.
Pal's inspection, testing, and auditing costs are kept to aminimum by the way we design our work systems and the waywe train and empower our staff. In our work systems, all staffmembers are able to assess the operation they are performingand are empowered with the authority to take any actionnecessary to ensure that products delivered to our customersmeet or exceed customer requirements. This approach, coupledwith our introduction process (Figure 3) to design in quality onthe front-end, and our flat organizational structure producessystems that deliver the correct product and service withoutunnecessary inspection, testing, and auditing.
Pal's Quality Control, Continual Improvement, andBenchmarking processes are all key management componentsthat allow us to evaluate and improve our core processes toachieve better performance, improved product/service designs,improved processes, and reduced cycle times. Process teamsevaluate results from automated control systems, personal on-line observations, and control charts to identify improvementopportunities for core and specific product/service processes. Weuse root cause analysis to pinpoint common barriers toconsistent compliance with process standards. Problem solvingdetermines how to remove barriers and reduce variability aroundestablished targets.
The Continual Improvement Process (Figure 6) is used toidentify, prioritize, plan, and execute improvements. Its use isinitiated within individual stores by process teams and company-wide by the Leadership Team. Process teams utilize long-termresults from automated control systems, personal observations,and control charts to assess needs for improvement. Theyappoint in-store improvement teams to apply the Plan-Do-Study-Act (PDSA) Cycle and propose an improved product, service, orprocess design. Process teams gather internal customer datathrough constant day-to-day interaction among employeesworking side-by-side on the line. The data is used to evaluate theneed for improved process control and standardization. If anyproblems with a process or service are clearly identified, the
information is shared company-wide via the CommunicationLogs.
Using the Benchmarking Process (Figure 5), we obtaininformation on the best performing companies in our industryand market by observing direct competitors and sharing findingsfrom formal benchmarking studies. To assist us in our processimprovement efforts, we look inside and outside our industry forbest-of-class performance and best-known methods for use inprocess improvement. We utilize restaurant industry researchdata from trade associations, literary searches, and the Internet.
BUSINESS PROCESSES
Pal’s Key Business Processes (Figure 13) include Supply ChainManagement, Property Acquisition, Construction, and Marketingand Advertising.
The Leadership Team follows the steps of the Product/Service/Process Introduction Process (Figure 3) to define the keyrequirements for our business processes. The team specificallyreviews the process, obtains input from process users, andspecifies requirements for meeting business needs. Additionalinput on requirement definitions comes from our benchmarkingwith other companies.
Introduction Process (Figure 3), we design our businessprocesses with the same rigor we use to design our core productand service processes. Careful review and analysis is used todesign business processes and to select good suppliers/partnersto help meet overall performance requirements. We thenmonitor supplier performance (whether internal or external)against our key requirements to make sure operationalrequirements are being met. Figure 13 outlines the principalperformance requirements for supplier/partner selection and forevaluating their performance.
Market Share
BusinessProcess
KeyRequirement
KeyMeasure
Supply ChainManagement
Reasonable Price Food Cost
Order Accuracy Survey Rating
PropertyAcquisition
Sales Potential Sales
Within Budget Cost
ConstructionOn time Opening Date
Within Budget Cost
Marketing &Advertising
Clear Message Focus Group Rating
Brand Recognition
Figure 13 Pal’s Key Business Processes

2 0 0 1 M B N Q A A p p l i c a t i o n S u m m a r y
P a l ’ s S u d d e n S e r v i c e
The key performance measures/indicators for Pal's businessprocesses are shown in Figure 14. Process data is thepredominant source of information for evaluation for controland improvement. However, we also use the Communication/Feedback Process (Figure 7) to obtain additional feedback datafrom all stakeholders on process results. Deviations fromtargets, standards and requirements found during performanceand progress reviews are quickly identified and remedied.
The overall costs associated with inspections, tests, and auditsfor our supply chain management process is minimized bymaintaining only a few long-term, core suppliers. In our otherbusiness processes, we minimize these costs by well thought-outprocess designs and by training and empowering our processoperators.
Pal's On-line Quality Control, Continual Improvement, andBenchmarking processes are used to continually evaluate andimprove our business process capabilities. The same approachoutlined in is applied to our business processes.
SUPPORT PROCESSES
Pal’s key support processes and their performance requirementsare defined in Figure 15.
Leadership Team members define key requirements foradministrative support processes with input from staff memberswho utilize the process. We often use benchmarking and inputfrom outside professional experts to assess our definitions ofrequirements and to offer suggestions for policies,administrative procedures, process designs, and processcontrols.
We use the same approach and same attention to detail in ourdesign and performance of support processes that we use forproduction and delivery processes. Support processes are oftendesigned concurrently with core process designs as an integralpart of the new product/service design phase of our Product/Service/Process Introduction Process.
The Leadership Team appoints a C-F process design team toapply our Product/Service/Process Introduction Process. Duringdesign, they flowchart how the successful support processshould function and develop an operational plan for it. TheLeadership Team reviews the flowchart and plan during this pre-design planning phase to ensure that key requirements for allprocesses (core, business, and support processes) are identifiedand properly considered.
The key performance measures/indicators for control andimprovement of our support process include:• P&L Statement Turn-around Time (Accounting),• percent Staff Turnover (Human Resources),• Sales Per Labor Hour (Human Resources),• Injury-free Hours Worked (Human Resources),• Repair Cost (Maintenance),• Supplier Fill Rate (Ordering)• On-time Deliveries (Ordering), and• HACCP Temperatures (Stocking).
Pal's On-line Quality Control Process (Figure 4) is applied tosupport processes with the same level of discipline as for coreprocesses in order to build our capabilities for applying best-known practices without variation. On-line quality controlmethods employed by our empowered process team membersoperating in a mode of self-control are the primary means usedto manage all of our support processes.
Support Process Principal Requirements
Accounting/Finance AccurateReliableRapid Turnaround
Human Resources(hiring, training,evaluation,compensation/payroll,benefits, and recognition)
Fully staffedLow TurnoverInjury-free
Maintenance(repair, calibration, PM)
ReliabilityQuick ResponseMinimum Cost
Mgmt. Info. System AccurateRapid Access
Ordering Right ProductRight QuantityDelivery on time
StockingNo Stock-outsOrganizedFresh
Figure 15 Pal’s Support Processes & Principal Requirements
Measure Principal Requirement
Product Quality Per Specifications
Price Best for Volume Level
On-Time Delivery < 3% Late Deliveries
Fill Rate 100%
Product Temperature Within HACCP Guidelines
Product Code Dates 100% in Date
Figure 14 Principle Supplier/Partner Performance Requirements

2 0 0 1 M B N Q A A p p l i c a t i o n S u m m a r y
P a l ’ s S u d d e n S e r v i c e
Pal's inspection, testing, and auditing costs are kept to aminimum for support processes by the way we design ourwork systems and the way we train and empower our staff.
As with core processes, the Pal's On-line Quality ControlProcess, Continual Improvement Process, andBenchmarking Process are all key process managementcomponents used to evaluate and improve our supportprocesses to achieve better performance, improvedproduct/service designs, improved core processperformance, and reduced cycle times. The same approachis applied for improving support processes and sharing/standardizing improvements across the Pal's organization. Pal’s success can be measured in many ways to reflectexcellence, customer-focus, citizenship, and world-classorganizational effectiveness and business results. Pal’s isachieving a leadership position in the fast food market bymodeling business success produced through amanagement process designed to align our operations withcustomer-driven expectations.
CUSTOMER FOCUSED RESULTS
In the fast food business in our market region, no onelistens to the customer with as many tools as Pal’s. Nowone understands the customer as well as we do, and no onecomes as close to meeting their needs. As a result, Pal’s isthe best-in-market performer for Customer Focusedresults.
Pal’s Customer Counts data shows steady growth at healthyrates.
Superior satisfaction is also reflected in our low level ofcustomer complaints - less than 0.4 per year per 1000customers.
Our Customer Survey and Market Research results showthat regional fast food customers have consistently rated usbetter than the best competitor over the past five years inareas of product accuracy, quality and service (speed),which are the primary determinants of customersatisfaction.
The rapid acceptance, popularity, and growth of our website, www.palsweb.com, is another strong indicator ofcustomer loyalty to the Pal’s brand.
Research results for product and service performanceclearly show that regional fast food customers are satisfiedwith Pal’s products and service.
num
ber
year
1995
1996
1997
1998
1999
2000
2001
Pal’s
Best Competitor
Goal 2001
num
ber
year
1995
1996
1997
1998
1999
2000
2001
Pal’s
Best Competitor
0
1
2
3
4
5
Quality
Lower is Better 1995 1996 1997 1998 1999 2000 2001
Service
Accuracy
Higher is Better
Quality
Service
Accuracy
1995 1996 1997 1998 1999 2000 2001
0.17
0.04
0.66
0.15
0.03
0.62
0.15
0.03
0.57
0.13
0.03
0.45
0.10
0.02
0.37
0.07
0.02
0.34
0.07
0.01
0.26
91.0 94.1 93.7 94.2 94.5 95.2 95.8
93.2 95.2 95.1 94.6 95.6 95.9 96.4
86.1 91.4 91.3 94.5 95.2 95.7 95.7
Pal’s Customer Satisfaction
Figure 16 Customer Counts
Figure 17 Complaint per 1000 Customers
Figure 18 Customer Focused DataComplaints per 1000 Customers

FINANCIAL AND MARKET RESULTS
Our financial and market results show that Pal’s is quicklybecoming the regional fast food leader in key financial andmarketplace performance. A few percentage points in profitmake a huge difference in a company’s ability to stay inbusiness and compete effectively.
Pal’s strong positive trend in Cash Flow reflects growth infinancial health. This is critical in being able to deliverpositive financial returns and economic value to ourstakeholders.
Marketplace performance is measured and evaluated withindicators for Sales Growth and Market Share. Ourperformance levels and trends in these areas indicate thatwe are in a position to assume leadership in marketplaceperformance.
With the strongest market share growth trend in ourregion, along with continuing improvements in ProfitPercentage, Profit/Person, and ROA, we realistically expectto continue to increase our share of the market.
2 0 0 1 M B N Q A A p p l i c a t i o n S u m m a r y
P a l ’ s S u d d e n S e r v i c e
Cash
Goal 2001
dolla
rs
year
1995
1996
1997
1998
1999
2000
2001
Pal’s
Best Competitor
Goal 2001
perc
ent
year
1995
1996
1997
1998
1999
2000
2001
1994
Pal’s
Goal 2001
dolla
rs
year
1995
1996
1997
1998
1999
2000
2001
1994
Profit/Person
year
1996
1997
1998
1999
2000
2001
Profit/Person
1996
1997
1998
1999
2000
2001
1995
1994
Pal’s
Best Competitor
Goal 2001
dolla
rs
year
1995
1996
1997
1998
1999
2000
2001
1994
Figure 19 Sales Growth
Figure 20 Cash Flow
Figure 21 Market Share
Figure 22 Profit Percentage
Figure 23 Profit Person
Figure 24 Pal’s ROA

HUMAN RESOURCE RESULTS
Staff Turnover, Pal’s key quantitative measure of employeesatisfaction, shows that our employee retention levels are atan all time best for Pal’s and superior to any competitor inour market.
Furthermore, our group of store operators and seniorleaders has lost only three individuals in the last twentyyears, which gives us a major advantage in leadershipcontinuity over our competitors.
Our primary measure of work systemperformance is Staff Productivity orSales per Labor Hour. Our improvingproductivity trend reflects theeffectiveness of our selection, hiring,training, and work designs. Our lowturnover rate and more experienced staff further enhance productivity.
ORGANIZATIONALEFFECTIVENESS RESULTS
We evaluate organizational effectivenessat Pal’s with measures for food quality,customer service (accuracy and speed),food safety, and cost of operations.
Cost of operations has two majordeterminants - Food Cost and LaborCosts. Our food costs (expressed as a
percentage of sales) are influenced by closely managedpurchasing, tight inventory controls, strict operationalstandards, aggressive minimization efforts, and closelymanaged vendor relations.
Labor costs are also evaluated in terms of our staffproductivity measure and Labor as a % of Sales.
Food Safety is evaluated by State Health Inspection Scores,which is a primary indicator of our compliance withsanitation requirements established by Federal and StateRegulations. Pal’s consistently receives the highest HealthInspection Scores in our market.
Pal’s leadership role in our market has been achieved byfocusing on satisfying customers through the principles ofperformance excellence. We have produced dominantbusiness results with a capable and committed workforce, asupportive supplier network, and capable and efficientoperations that deliver quality and speed at a reasonablecost.
2 0 0 1 M B N Q A A p p l i c a t i o n S u m m a r y
P a l ’ s S u d d e n S e r v i c e
Pal’s19
96
1997
1998
1999
2000
2001
1995
1994
Best Competitor
Perc
ent
Pal’s
1996
1997
1998
1999
2000
2001
1995
1994
Best Competitor
Dol
lars
Communication
Scale 1-5 Higher is Better
Training
Motivation
3.84
3.97
3.55
3.87
3.95
3.65
3.77
3.95
3.70
4.11
4.20
3.92
4.09
4.15
3.98
4.22
4.39
4.16
4.26
4.44
4.26
Cuts
Burns
Lifting
12,214 17,611 26,744 24,685 38,826 61,604 -
20,938 32,874 39,088 49,371 64,711 151,234 -
136,571 123,279 125,481 135,772 182,400 298,547 -
Excitement
Harmony
Management’s ability
3.16
3.61
3.55
3.79
3.47
3.64
3.63
3.56
3.86
4.09
3.66
3.86
3.98
4.21
4.04
4.27
4.12
4.13
4.33
Hours Worked With No AccidentsHigher is Better
1995 1996 1997 1998 1999 2000 2001
1995 1996 1997 1998 1999 2000 2001
Lower is Better
Number of Accidents
Cuts
Burns
Lifting
1995 1996 1997 1998 1999 2000 2001
26
15
3
19
10
3 3 3 2 2 1
3
33
7
9
13
8
17
6
10
Figure 25 Turnover
Figure 26 Sales per Labor Hour (SPLH)
Figure 27 H/R Data Staff Surveys